Peer review process
Revised: This Reviewed Preprint has been revised by the authors in response to the previous round of peer review; the eLife assessment and the public reviews have been updated where necessary by the editors and peer reviewers.
Read more about eLife’s peer review process.Editors
- Reviewing EditorJan BruguésTechnische Universität Dresden, Dresden, Germany
- Senior EditorAleksandra WalczakCNRS, Paris, France
Reviewer #1 (Public review):
Summary:
The aim of this paper is to develop a simple method to quantify fluctuations in the partitioning of cellular elements. In particular, they propose a flow-cytometry based method coupled with a simple mathematical theory as an alternative to conventional imaging-based approaches.
Strengths:
The approach they develop is simple to understand and its use with flow-cytometry measurements is clearly explained. Understanding how the fluctuations in the cytoplasm partition varies for different kinds of cells is particularly interesting.
Weaknesses:
The theory only considers fluctuations due to cellular division events. Fluctuations in cellular components are largely affected by various intrinsic and extrinsic sources of noise and only under particular conditions does partitioning noise become the dominant source of noise. In the revised version of the manuscript, they argue that in their setup, noise due to production and degradation processes are negligible but noise due to extrinsic sources such as those stemming from cell-cycle length variability may still be important. To investigate the robustness of their modelling approach to such noise, they simulated cells following a sizer-like division strategy, a scenario that maximizes the coupling between fluctuations in cell-division time and partitioning noise. They find that estimates remain within the pre-established experimental error margin.
Reviewer #2 (Public review):
Summary:
The authors present a combined experimental and theoretical workflow to study partitioning noise arising during cell division. Such quantifications usually require time-lapse experiments, which are limited in throughput. To bypass these limitations, the authors propose to use flow-cytometry measurements instead and analyse them using a theoretical model of partitioning noise. The problem considered by the authors is relevant and the idea to use statistical models in combination with flow cytometry to boost statistical power is elegant. The authors demonstrate their approach using experimental flow cytometry measurements and validate their results using time-lapse microscopy. The approach focuses on a particular case, where the dynamics of the labelled component depends predominantly on partitioning, while turnover of components is not taken into account. The description of the methods is significantly clearer than in the previous version of the manuscript. I have only two comments left:
-
In eq. (1) the notation has been changed/corrected, but the text immediately after it still refers to the old notation.
-
Maybe I don't fully understand the reasoning provided by the authors, but it is still not entirely clear to me why microscopy-based estimates are expected to be larger. Fewer samples will increase the estimation uncertainty, but this can go either way in terms of the inferred variability.
Author response:
The following is the authors’ response to the original reviews.
Reviewer #1 (Public review):
Summary:
The aim of this paper is to develop a simple method to quantify fluctuations in the partitioning of cellular elements. In particular, they propose a flow-cytometry-based method coupled with a simple mathematical theory as an alternative to conventional imaging-based approaches.
Strengths:
The approach they develop is simple to understand and its use with flow-cytometry measurements is clearly explained. Understanding how the fluctuations in the cytoplasm partition vary for different kinds of cells is particularly interesting.
Weaknesses:
The theory only considers fluctuations due to cellular division events. This seems a large weakness because it is well known that fluctuations in cellular components are largely affected by various intrinsic and extrinsic sources of noise and only under particular conditions does partitioning noise become the dominant source of noise.
We thank the Reviewer for her/his evaluation of our manuscript. The point raised is indeed a crucial one. In a cell division cycle, there are at least three distinct sources of noise that affect component numbers [1] :
(1) Gene expression and degradation, which determine component numbers fluctuations during cell growth.
(2) Variability in cell division time, which depending on the underlying model may or may not be a function of protein level and gene expression.
(3) Noise in the partitioning/inheritance of components between mother and daughter cells.
Our approach specifically addresses the latter, with the goal of providing a quantitative measure of this noise source. For this reason, in the present work, we consider homogeneous cancer cell populations that could be considered to be stationary from a population point-of-view. By tracking the time evolution of the distribution of tagged components via live fluorescent markers, we aim at isolating partitioning noise effects. However, as noted by the Reviewer, other sources of noise are present, and depending on the considered system the relative contributions of the different sources may change. Thus, we agree that a quantification of the effect of the various noise sources on the accuracy of our measurements will improve the reliability of our method.
In this respect, assuming independence between noise sources, we reasoned that variability in cell cycle length would affect the timing of population emergence but not the intrinsic properties of those populations (e.g., Gaussian variance). To test this hypothesis, we conducted a preliminary set of simulations in which cell division times were drawn from an Erlang distribution (mean = 18 h, k=4k = 4k=4). The results, showing the behavior of the mean and variance of the component distributions across generations, are presented in Supplementary Information - Figure 1. Under the assumption of independence between different noise sources, no significant effects were observed even for high asymmetries of the partitioning distribution.
Next, we quantified the accuracy of our measurements in the presence of cross-talks between the various noise sources.Indeed, cells may adopt different growth and division strategies, which can be grouped into three categories based on what triggers division:
● Sizer-like cells divide upon reaching a certain size;
● Timer-like cells divide after a fixed time (corresponding to the previously treated case with independent noise);
● Adder-like cells divide once their volume has increased by a finite amount.
A detailed discussion of these strategies, including their mathematical formulation, can be found in [2]. Here we have assumed that cells follow a sizer-like model. In this way, we study a system in which cells with a higher number of components have shorter division times. Hence, older (newer) generations are emptied (populated) starting from higher values.
As can be observed, higher levels of division asymmetry increase the fluctuations of the system relative to the analytically expected behavior, particularly in later generations.
The result in Supplementary Information - Figure 3 demonstrates the robustness of our method, as the estimates remain within the pre-established experimental error margin. We have now discussed this aspect both in the main and in the Supplementary Information and thank the Reviewer for pointing it out.
(1) Soltani, Mohammad, et al. "Intercellular variability in protein levels from stochastic expression and noisy cell cycle processes." PLoS computational biology 12.8 (2016): e1004972.
(2) Mattia Miotto, Simone Scalise, Marco Leonetti, Giancarlo Ruocco, Giovanna Peruzzi, and Giorgio Gosti. A size-dependent division strategy accounts for leukemia cell size heterogeneity. Communications Physics, 7(1):248, 2024.
Reviewer #2 (Public review):
Summary:
The authors present a combined experimental and theoretical workflow to study partitioning noise arising during cell division. Such quantifications usually require time-lapse experiments, which are limited in throughput. To bypass these limitations, the authors propose to use flow-cytometry measurements instead and analyse them using a theoretical model of partitioning noise. The problem considered by the authors is relevant and the idea to use statistical models in combination with flow cytometry to boost statistical power is elegant. The authors demonstrate their approach using experimental flow cytometry measurements and validate their results using time-lapse microscopy. However, while I appreciate the overall goal and motivation of this work, I was not entirely convinced by the strength of this contribution. The approach focuses on a quite specific case, where the dynamics of the labelled component depend purely on partitioning. As such it seems incompatible with studying the partitioning noise of endogenous components that exhibit production/turnover. The description of the methods was partly hard to follow and should be improved. In addition, I have several technical comments, which I hope will be helpful to the authors.
We are grateful to the Reviewer for the comments. Indeed, both partitioning and production turnover noise are in general fundamental processes. At present the only way to consider them together are time-consuming and costly transfection/microscopy/tracking experiments. In this work, we aimed at developing a method to effectively pinpoint the first component, i.e. partitioning noise thus we opted to separate the two different noise sources.
Below, we provided a point-by-point response that we hope will clarify all raised concerns.
Comments:
(1) In the theoretical model, copy numbers are considered to be conserved across generations. As a consequence, concentrations will decrease over generations due to dilution. While this consideration seems plausible for the considered experimental system, it seems incompatible with components that exhibit production and turnover dynamics. I am therefore wondering about the applicability/scope of the presented approach and to what extent it can be used to study partitioning noise for endogenous components. As presented, the approach seems to be limited to a fairly small class of experiments/situations.
We see the Reviewer's point. Indeed, we are proposing a high-throughput and robust procedure to measure the partitioning/inheritance noise of cell components through flow cytometry time courses. By using live-cell staining of cellular compounds, we can track the effect of partitioning noise on fluorescence intensity distribution across successive generations. This specific procedure is purposely optimized to isolate partitioning noise from other sources and, as it is, can not track endogenous components or dyes that require fixation. While this certainly poses limits to the proposed approach, there are numerous contexts in which our methodology could be used to explore the role of asymmetric inheritance. Among others, (i) investigating how specific organelles are differentially partitioned and how this influences cellular behavior could provide deeper insights into fundamental biological processes: asymmetric segregation of organelles is a key factor in cell differentiation, aging, and stress response. During cell division, organelles such as mitochondria, the endoplasmic reticulum, lysosomes, peroxisomes, and centrosomes can be unequally distributed between daughter cells, leading to functional differences that influence their fate. For instance, Kajaitso et al. [1] proposed that asymmetric division of mitochondria in stem cells is associated with the retention of stemness traits in one daughter cell and differentiation in the other. As organisms age, stem cells accumulate damage, and to prevent exhaustion and compromised tissue function, cells may use asymmetric inheritance to segregate older or damaged subcellular components into one daughter cell. (ii) Asymmetric division has also been linked to therapeutic resistance in Cancer Stem Cells [2]. Although the functional consequences are not yet fully determined, the asymmetric inheritance of mitochondria is recognized as playing a pivotal role [3]. Another potential application of our methodology may be (iii) the inheritance of lysosomes, which, together with mitochondria, appears to play a crucial role in determining the fate of human blood stem cells [4]. Furthermore, similar to studies conducted on liquid tumors [5][6], our approach could be extended to investigate cell growth dynamics and the origins of cell size homeostasis in adherent cells [7][8][9]. The aforementioned cases of study can be readily addressed using our approach that in general is applicable whenever live-cell dyes can be used. We have added a discussion of the strengths and limitations of the method in the Discussion section of the revised version of the manuscript
(1) Katajisto, Pekka, et al. "Asymmetric apportioning of aged mitochondria between daughter cells is required for stemness." Science 348.6232 (2015): 340-343.
(2) Hitomi, Masahiro, et al. "Asymmetric cell division promotes therapeutic resistance in glioblastoma stem cells." JCI insight 6.3 (2021): e130510.
(3) García-Heredia, José Manuel, and Amancio Carnero. "Role of mitochondria in cancer stem cell resistance." Cells 9.7 (2020): 1693.
(4) Loeffler, Dirk, et al. "Asymmetric organelle inheritance predicts human blood stem cell fate." Blood, The Journal of the American Society of Hematology 139.13 (2022): 2011-2023.
(5) Miotto, Mattia, et al. "Determining cancer cells division strategy." arXiv preprint arXiv:2306.10905 (2023).
(6) Miotto, Mattia, et al. "A size-dependent division strategy accounts for leukemia cell size heterogeneity." Communications Physics 7.1 (2024): 248.
(7) Kussell, Edo, and Stanislas Leibler. "Phenotypic diversity, population growth, and information in fluctuating environments." Science 309.5743 (2005): 2075-2078.
(8) McGranahan, Nicholas, and Charles Swanton. "Clonal heterogeneity and tumor evolution: past, present, and the future." Cell 168.4 (2017): 613-628.
(9) De Martino, Andrea, Thomas Gueudré, and Mattia Miotto. "Exploration-exploitation tradeoffs dictate the optimal distributions of phenotypes for populations subject to fitness fluctuations." Physical Review E 99.1 (2019): 012417.
(2) Similar to the previous comment, I am wondering what would happen in situations where the generations could not be as clearly identified as in the presented experimental system (e.g., due to variability in cell-cycle length/stage). In this case, it seems to be challenging to identify generations using a Gaussian Mixture Model. Can the authors comment on how to deal with such situations? In the abstract, the authors motivate their work by arguing that detecting cell divisions from microscopy is difficult, but doesn't their flow cytometry-based approach have a similar problem?
The point raised is an important one, as it highlights the fundamental role of the gating strategy. The ability to identify the distribution of different generations using the Gaussian Mixture Model (GMM) strongly depends on the degree of overlap between distributions. The more the distributions overlap, the less capable we are of accurately separating them.
The extent of overlap is influenced by the coefficients of variation (CV) of both the partitioning distribution function and the initial component distribution. Specifically, the component distribution at time t results from the convolution of the component distribution itself at time t−1 and the partitioning distribution function. Therefore, starting with a narrow initial component distribution allows for better separation of the generation peaks. The balance between partitioning asymmetry and the width of the initial component distribution is thus crucial.
As shown in Supplementary Information - Figure 5, increasing the CV of either distribution reduces the ability to distinguish between different generations.
However, the variance of the initial distribution cannot be reduced arbitrarily. While selecting a narrow distribution facilitates a better reconstruction of the distributions, it simultaneously limits the number of cells available for the experiment. Therefore, for components exhibiting a high level of asymmetry, further narrowing of the initial distribution becomes experimentally impractical.
In such cases, an approach previously tested on liquid tumors [1] involves applying the Gaussian Mixture Model (GMM) in two dimensions by co-staining another cellular component with lower division asymmetry.
Regarding time-lapse fluorescence microscopy, the main challenge lies not in disentangling the interplay of different noise sources, but rather in obtaining sufficient statistical power from experimental data. While microscopy provides detailed insights into the division process and component partitioning, its low throughput limits large-scale statistical analyses. Current segmentation algorithms still perform poorly in crowded environments and with complex cell shapes, requiring a substantial portion of the image analysis pipeline to be performed manually, a process that is time-consuming and difficult to scale. In contrast, our cytometry-based approach bypasses this analysis bottleneck, as it enables a direct population-wide measurement of the system's evolution. We have added a detailed discussion of this argument in the Supplementary Material of the manuscript and added a clarification of the role of the gating strategy in the main text.
(1) Peruzzi, Giovanna, et al. "Asymmetric binomial statistics explains organelle partitioning variance in cancer cell proliferation." Communications Physics 4.1 (2021): 188.
(3) I could not find any formal definition of division asymmetry. Since this is the most important quantity of this paper, it should be defined clearly.
We thank the Reviewer for the note. With division asymmetry we refer to a quantity that reflects how similar two daughter cells are likely to be in terms of inherited components after a division process. We opted to measure it via the coefficient of variation (root squared variance divided by the mean) of the partitioning fraction distribution. We have amended this lack of definition in the reviewed version of the manuscript.
(4) The description of the model is unclear/imprecise in several parts. For instance, it seems to me that the index "i" does not really refer to a cell in the population, but rather a subpopulation of cells that has undergone a certain number of divisions. Furthermore, why is the argument of Equation 11 suddenly the fraction f as opposed to the component number? I strongly recommend carefully rewriting and streamlining the model description and clearly defining all quantities and how they relate to each other.
We have amending the text carefully to avoid double naming of variables and clarifying each computation passage. In equation 11 the variable f refers to the fluorescent intensity, but the notation will be changed to increase clarity.
(5) Similarly, I was not able to follow the logic of Section D. I recommend carefully rewriting this section to make the rationale, logic, and conclusions clear to the reader.
We have updated the manuscript clarifying the scope of section D and its results. In brief, Section A presents a general model to derive the variance of the partitioning distribution from flow cytometry time-course data without making any assumptions about the shape of the distribution itself. In Section D, our goal is to interpret the origin of asymmetry and propose a possible form for the partitioning distribution. Since the dyes used bind non-specifically to cytoplasmic amines, the tagged proteins are expected to be uniformly distributed throughout the cytoplasm and present in large numbers. Given these assumptions the least complex model for division follows the binomial distribution, with a parameter that measures the bias in the process. Therefore, we performed a similar computation to that in Section A, which allows us to estimate not only the variance but also the degree of biased asymmetry. Finally, we fitted the data to this new model and proposed an experimental interpretation of the results.
(6) Much theoretical work has been done recently to couple cell-cycle variability to intracellular dynamics. While the authors neglect the latter for simplicity, it would be important to further discuss these approaches and why their simplified model is suitable for their particular experiments.
We agree with the Reviewer, we have added a discussion on this topic in the Introduction and Discussion sections of the main text.
(7) In the discussion the authors note that the microscopy-based estimates may lead to an overestimation of the fluctuations due to limited statistics. I could not follow that reasoning. Due to the gating in the flow cytometry measurements, I could imagine that the resulting populations are more stringently selected as compared to microscopy. Could that also be an explanation? More generally, it would be interesting to see how robust the results are in terms of different gating diameters.
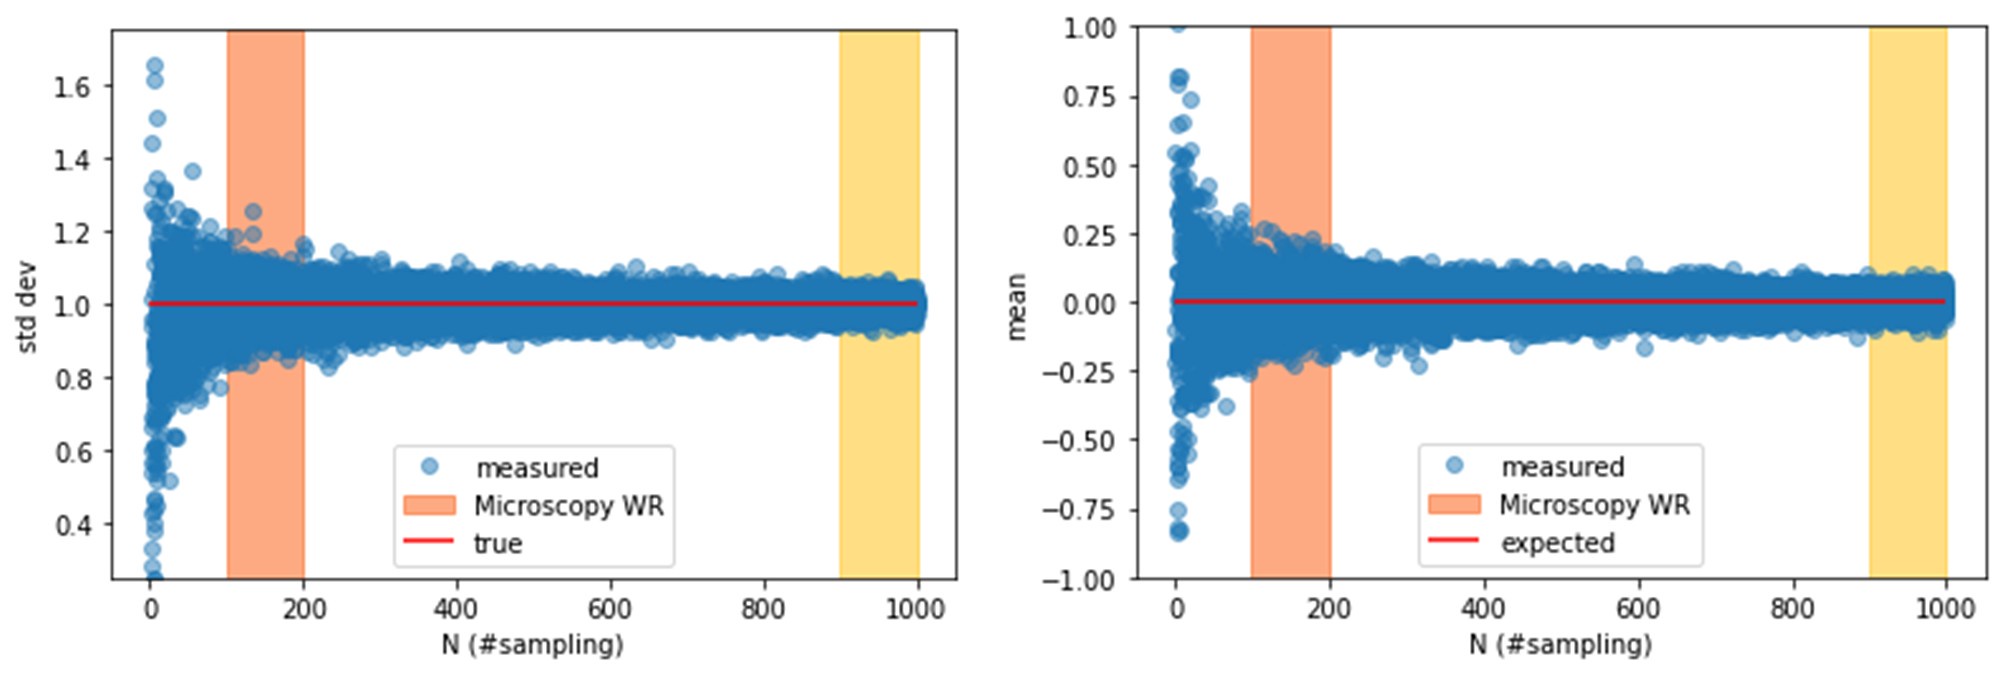
The Reviewer is right on the importance of the sorting procedure. As already discussed in a previous point, the gating strategy we employed plays a fundamental role: it reduces the overlap of fluorescence distributions as generations progress, enables the selection of an initial distribution distinct from the fluorescence background, allowing for longer tracking of proliferation, and synchronizes the initial population. The narrower the initial distribution, the more separated the peaks of different generations will be. However, this also results in a smaller number of cells available for the experiment, requiring a careful balance between precision and experimental feasibility. A similar procedure, although it would certainly limit the estimation error, would be impracticable In the case of microscopy. Indeed, the primary limitation and source of error is the number of recorded events. Our pipeline allowed us to track on the order of hundreds of division dynamics, but the analysis time scales non-linearly with the number of events. Significantly increasing the dataset would have been extremely time-consuming. Reducing the analysis to cells with similar fluorescence, although theoretically true, would have reduced the statistics to a level where the sampling error would drastically dominate the measure. Moreover, different experiments would have been hardly comparable, since different fluorescences could map in equally sized cells. In light of these factors, we expect higher CV for the microscopy measure than for flow cytometry’s ones. In the plots below, we show the behaviour of the mean and the standard deviation of N numbers sampled from a gaussian distribution N(0,1) as a function of the sampling number N. The higher is N the closer the sampled distribution will be to the true one. The region in the hundreds of samples is still very noisy, but to do much better we would have to reach the order of thousands. We have added a discussion on these aspects in the reviewed version of the manuscript, with a deeper description of the importance of the sorting procedure in the Supplementary Material. .
Author response image 1.
Standard deviation and mean value of a distribution of points sampled from a Gaussian distribution with mean 0 and standard deviation 1, versus the number of samples, N. Increasing N leads to a closer approximation of the expected values. In orange is highlighted the Microscopy Working Region (Microscopy WR) which corresponds to the number of samples we are able to reach with microscopy experiments. In yellow the region we would have to reach to lower the estimating error, which is although very expensive in terms of analysis time.
(7) It would be helpful to show flow cytometry plots including the identified subpopulations for all cell lines, currently, they are shown only for HCT116 cells. More generally, very little raw data is shown.
We have provided the requested plots for the other cell lines together with additional raw data coming from simulations in the Supplementary Material.
(8) The title of the manuscript could be tailored more to the considered problem. At the moment it is very generic.
We see the Reviewer point. The proposed title aims at conveying the wide applicability of the presented approach, which ultimately allows for the assessment of the levels of fluctuations in the levels of the cellular components at division. This in turn reflects the asymmetricity in the division.
Reviewer #1 (Recommendations for the authors):
(1) I am quite concerned about the fact that the theory only considers fluctuations due to cellular division events since intrinsic and extrinsic noise sources are often dominant. I suggest that the authors simulate a full model of cell growth and division (that accounts for fluctuations in gene expression, cell-cycle dynamics, and cell division to generate a controlled synthetic dataset and then use this as input to their method to understand how robust are their results to the influence of noise sources other than partitioning.
We thank the reviewer for the suggestions and following his advice we performed two sets of simulations in which we took into account the effect of the other noise sources. A detailed description of the results and the methods has been added to the Supplementary Material, while the topic has also been assessed in the main text. A cell proliferation cycle is affected by different sources of variability: (i) production and degradation processes of molecules; (ii) variability in length of the cell cycle; (iii) partitioning noise, which identifies asymmetric inheritance of components between the two daughter cells. However, the experimental approach and the model have been formulated to specifically address the effects of partitioning noise. Indeed, since we are dealing with components tagged via live fluorescent markers, production of new fluorophores is impossible and can therefore be discarded. Instead, the degradation process is a global effect that influences the behavior of the mean of the distribution in a time-dependent manner. However, by looking at the experimental data in Figure 1 of the main text, no significant depletion of fluorescence is observed, or at least it is hidden by the experimental fluctuations of the measure. Instead, a more careful evaluation has to be done for what concerns fluctuation in cell cycle length. We conducted two sets of simulations. In the first, we assumed the independence between fluctuations in cell cycle length and partitioning noise.
Cell’s division time was extracted from an Erlang distribution (mean = 18 , k = 4) and the results, showing the behavior of the mean and variance of the component distributions across generations, are presented in Supplementary Information - Figure 1. Under the assumption of independence between different noise sources, no significant effects were observed even for high asymmetries of the partitioning distribution. The second set of simulations considered a situation in which the cell’s components and division time are coupled. We assumed a sizer-like division strategy for which bigger cells have a shorter division time and the results of the simulations are shown in Supplementary Information - Figure 2.
As can be observed, higher levels of division asymmetry increase the fluctuations of the system relative to the analytically expected behavior, particularly in later generations.
The result in Supplementary Information - Figure 3 demonstrates the robustness of our method, as the estimates remain within the pre-established experimental error margin. However, a detailed description of this topic has been provided in the Supplementary Information and into the main text.
(2) I find the use of the Cauchy distribution somewhat odd since this does not have a finite mean or a variance and I suspect it is unlikely this mimics a naturally measurable distribution in their experiments. This should either be justified biologically or else replaced by a more realistic distribution.
Following the reviewer’s suggestion, we have changed the distribution to Gaussian one.
(3) There is a large body of literature on gene expression models that incorporate a large amount of detail including cell-cycle dynamics and cell division which are relevant to their discussion but not referenced. I suggest they read the following and see how to incorporate at least some of them in their discussion:
Frequency domain analysis of fluctuations of mRNA and protein copy numbers within a cell lineage: theory and experimental validation., Physical Review X, 11.2 (2021): 021032.
Exact solution of stochastic gene expression models with bursting, cell cycle and replication dynamics., Physical Review E, 101.3 (2020): 032403.
Coupling gene expression dynamics to cell size dynamics and cell cycle events: Exact and approximate solutions of the extended telegraph model., Iscience, 26.1 (2023).
Models of protein production along the cell cycle: An investigation of possible sources of noise., Plos one, 15.1 (2020): e0226016.
Sources, propagation and consequences of stochasticity in cellular growth., Nature communications, 9(1), 4528
Intrinsic and extrinsic noise of gene expression in lineage trees., Scientific Reports, 9.1 (2019): 474.
We thank the Reviewer for the provided articles. We enlarged both introduction and discussion commenting on them, also in response to the second Reviewer comments.
Reviewer #2 (Recommendations for the authors):
(1) Even when it is used only during simulation for the sake of illustration, the Cauchy distribution is a somewhat unfortunate choice as its moments do not exist and hence, the authors' approach would not apply. I would recommend using another distribution instead.
Following the Reviewer’s suggestion we have changed the distribution to Gaussian ones.
(2) "cells population" should be "cell population".
We have amended this mistake in the text.


