Figures and data
Go and No-go performance is similar across task variants.
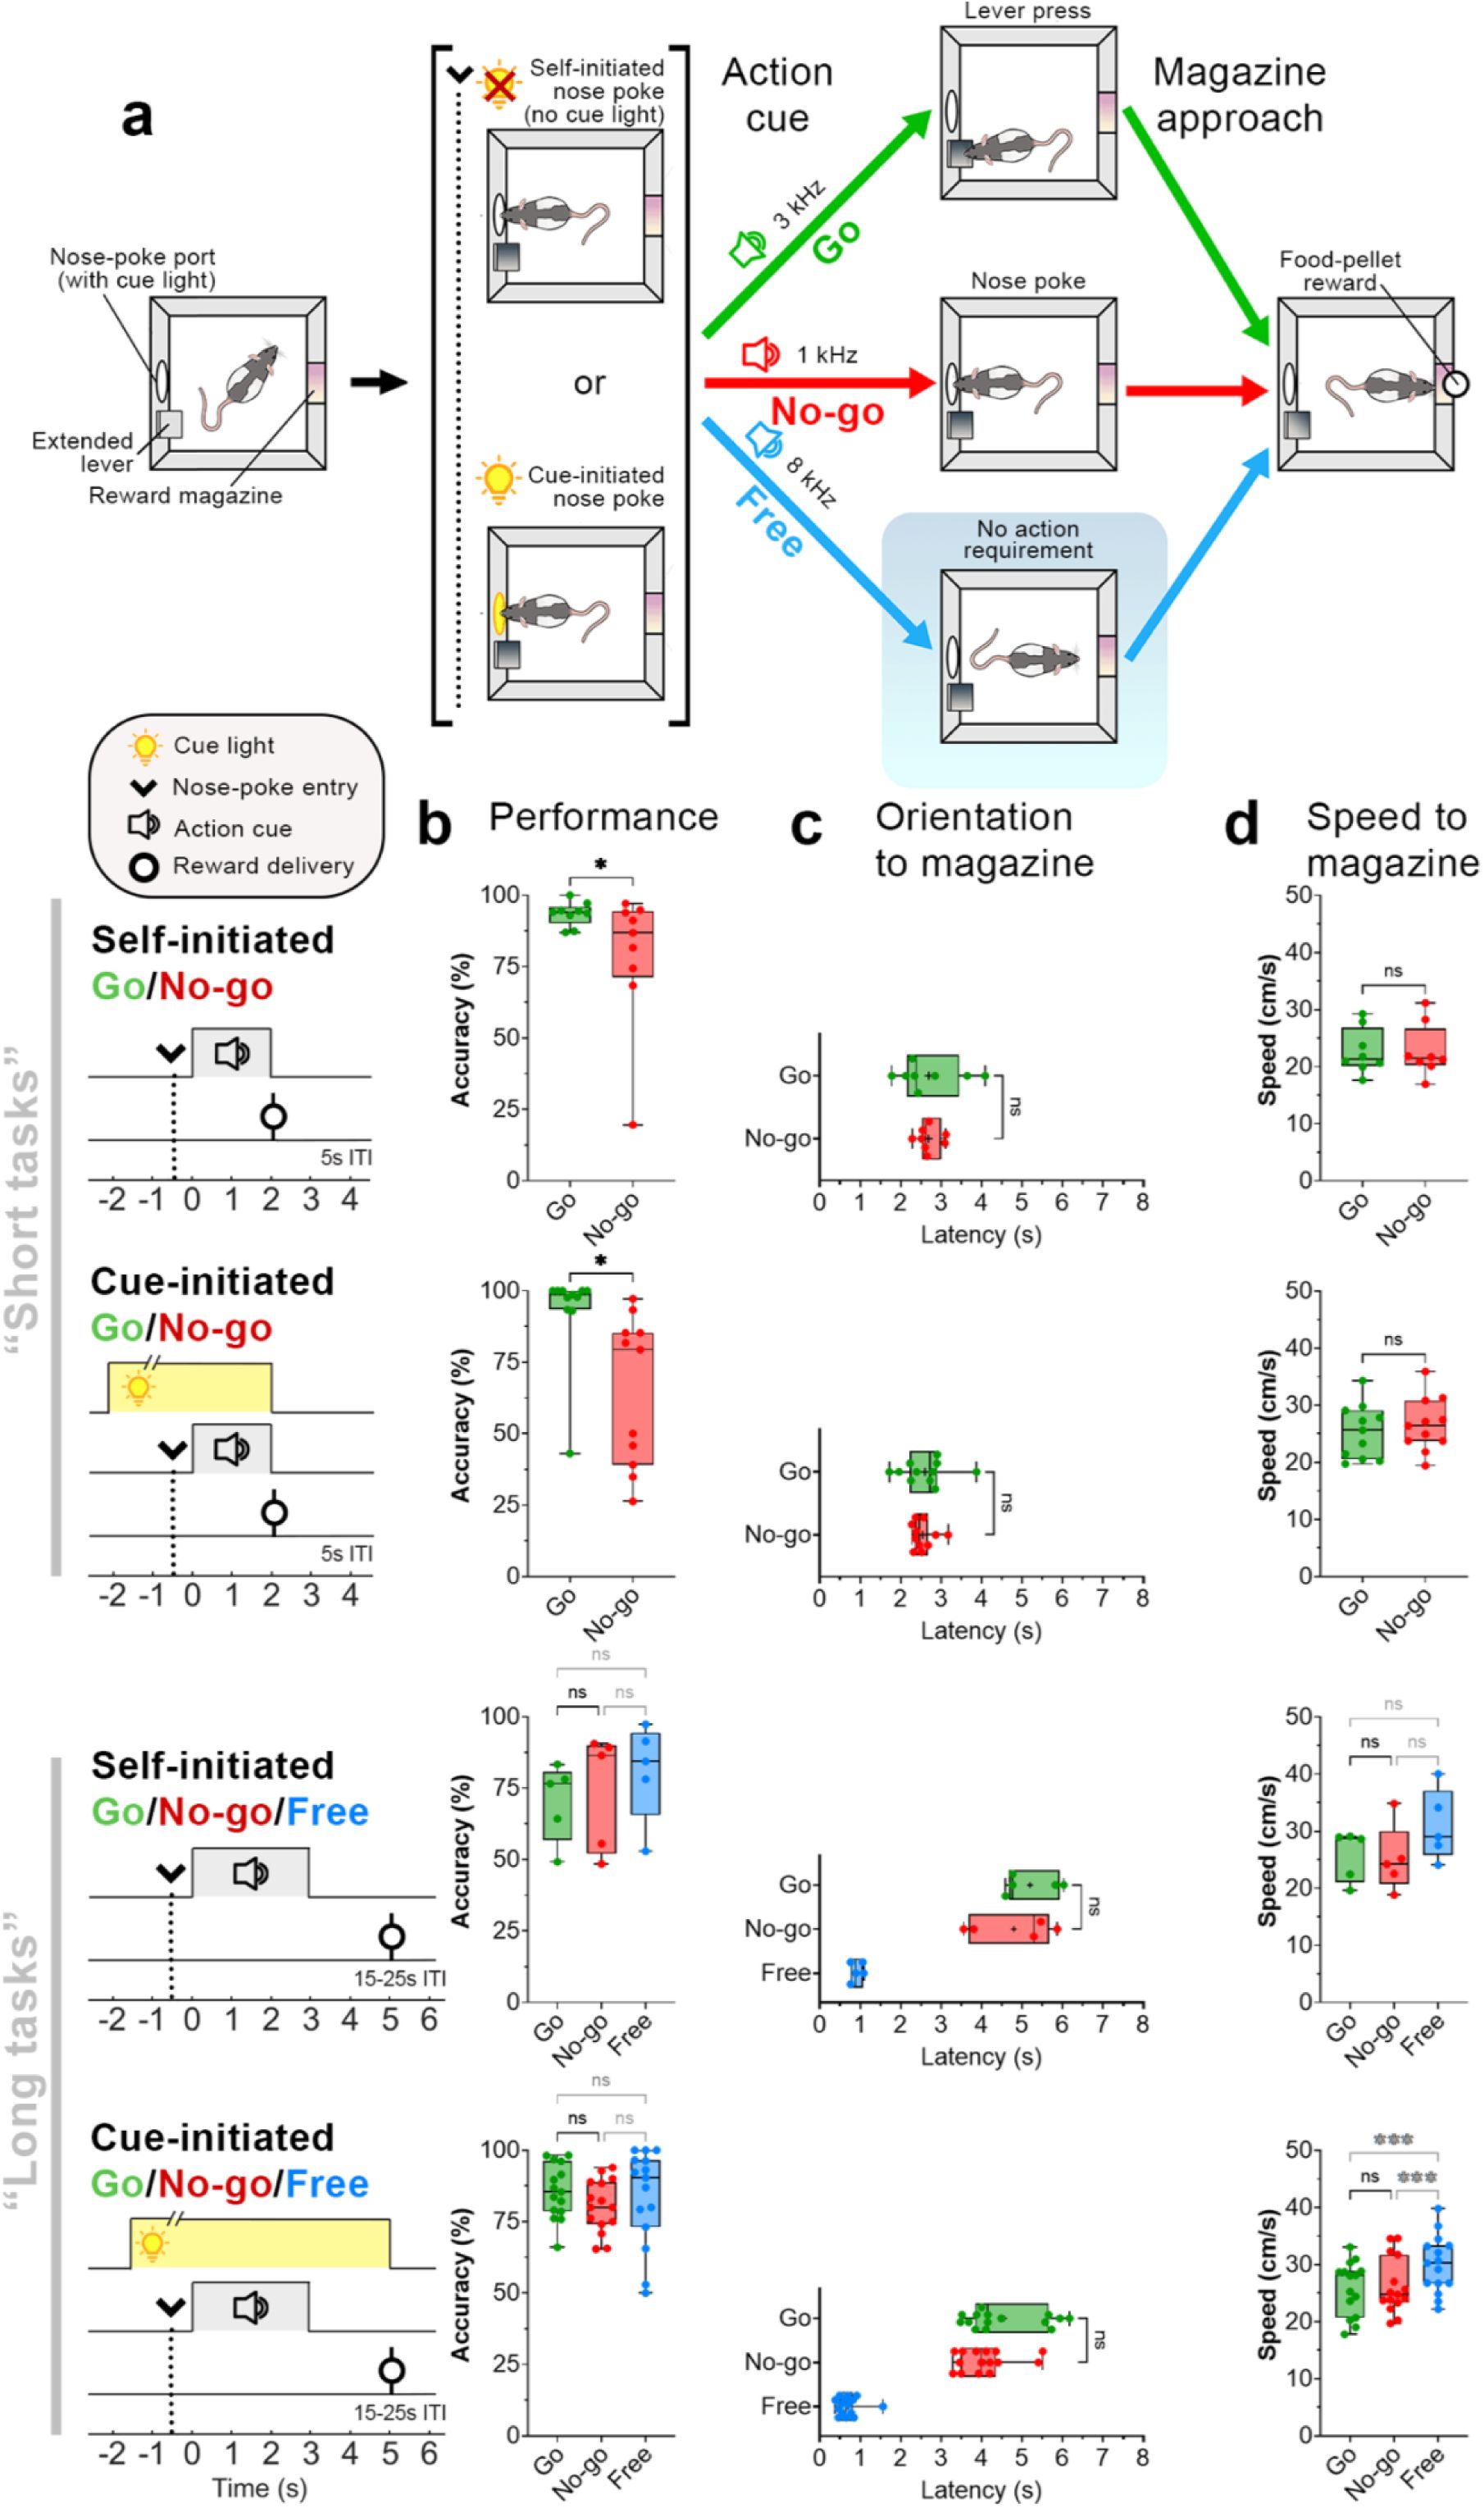
a) Schematic of the Go/No-go (short) behavioral task. Rats initiated trials by entering a nose-poke port (arrow, dotted line), either voluntarily (Self-initiated) or following nose-poke light illumination (Cue-initiated). After staying in the nose-poke port for 0.5s, an auditory stimulus (action cue) instructed rats to either initiate action (lever presses: ‘Go’, green) or remain in the nose-poke port (‘No-go’, red). In the Go/No-go/Free (long) task, an additional action cue was presented that did not require an action for rewards (‘Free’, blue). Following Free cue onset, rats could approach the reward magazine immediately. b) Schematic of task timeline. For all trials, reward-delivery latency (relative to action cue onset) was similar. c) Success rates across Go/No-go task variants. d) Latency to orient toward the reward magazine following action cue-onset. e) Speed of movement toward the reward magazine after orientation. Significance: * p < 0.05, ** p < 0.01, *** p < 0.001, Wilcoxon matched-pairs signed rank or post hoc Dunn’s tests.
VMS dopamine encodes both action initiation and reward-magazine arrival irrespective of action contingency.
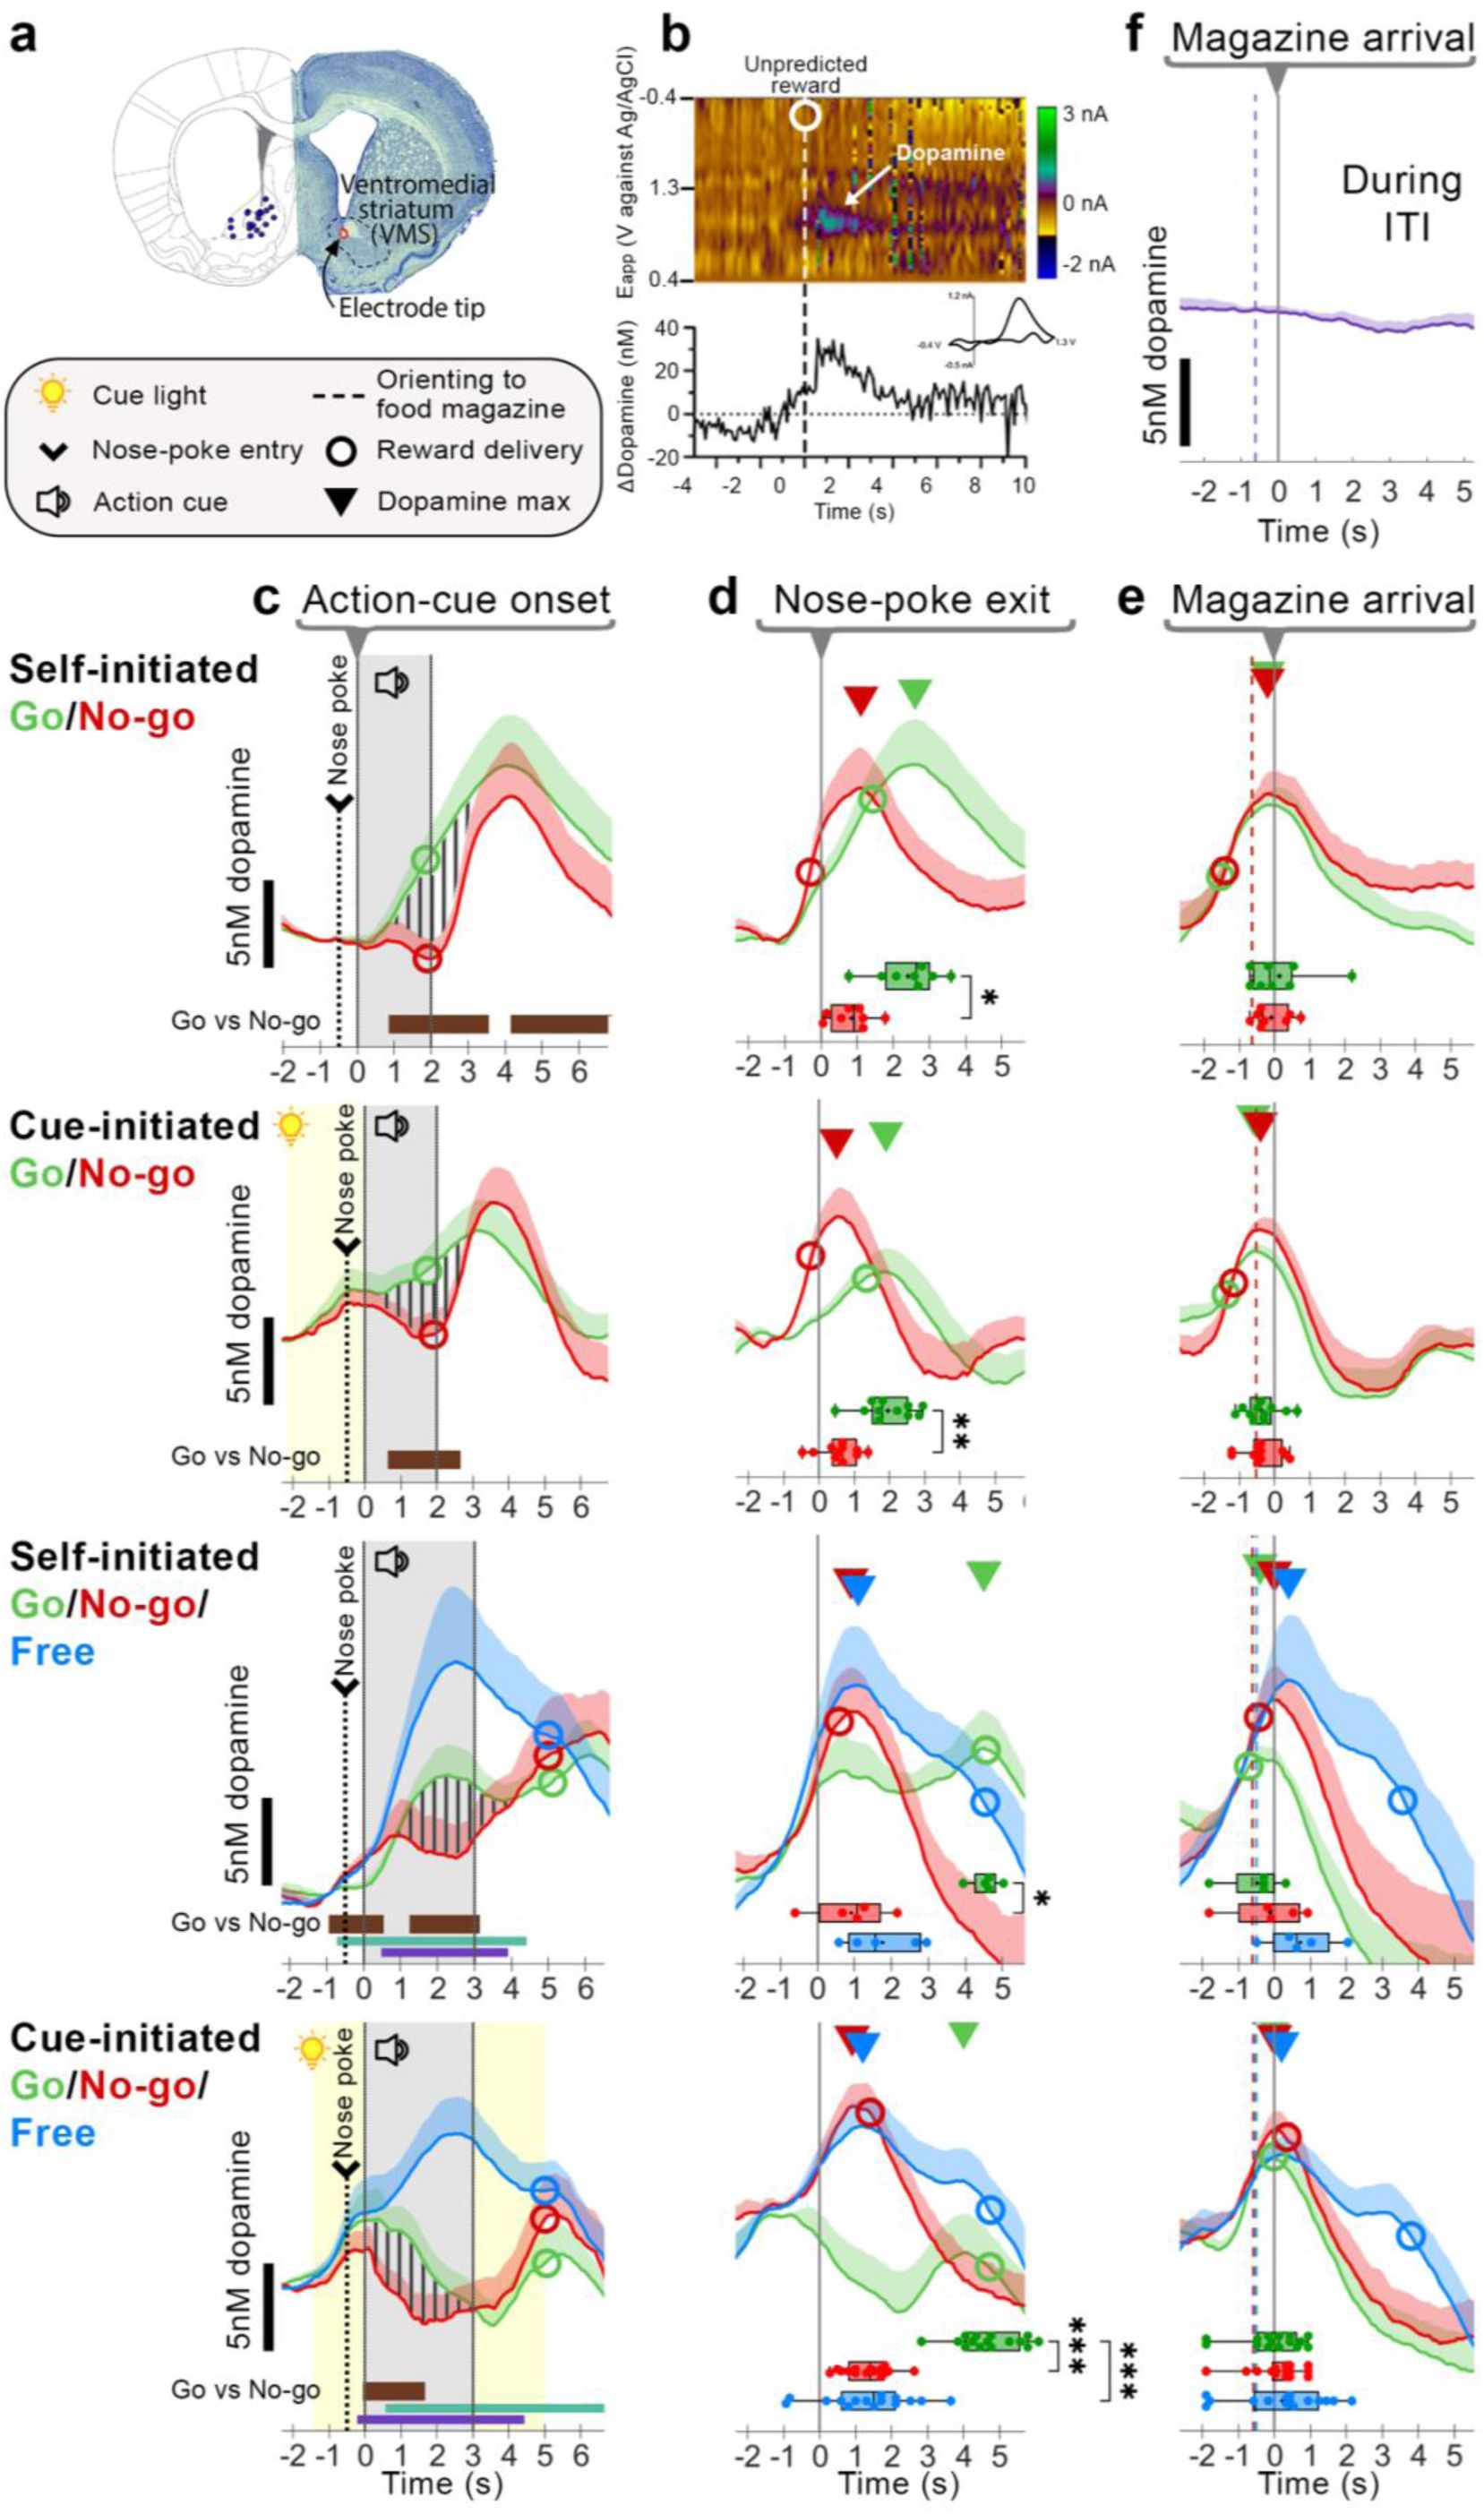
a) Histological verification of electrode placements in VMS (n = 27). b) Representative color plot and corresponding dopamine trace in response to an unpredicted pellet. The dotted line and circle indicate pellet delivery. Inset: Accompanying cyclic voltammogram confirms dopamine detection. c-e) Average dopamine concentration (nM; mean + SEM) for Go (green), No-go (red), and free (blue) trials. Triangles denote the average latency of peak dopamine relative to different alignment points. c) Traces aligned to action-cue onset. Vertical stripes highlight differences in Go vs. No-go dopamine. Horizontal bars indicate significant within-subjects differences between trial types (Brown: Go vs. No-go, Aqua: Free vs. Go, Purple: Free vs. No-go). d) Traces aligned to nose-poke exit; e) magazine arrival. Box plots depict latency of peak dopamine release (± 2s) around magazine arrival per animal. f) Dopamine release during the inter-trial interval (ITI) as rats approached the reward magazine from the opposite wall, aligned to magazine arrival. Boxplot statistical significance: * p < 0.05, ** p < 0.01, *** p < 0.001, Wilcoxon matched-pairs signed rank or post-hoc Dunn’s tests.

Classified No-go behavior reveals VMS dopamine release following action-cue offset in ‘Biting’ trials.
a) Left: Agglomerative hierarchical clustering of No-go trial behaviors using Ward’s linkage and Euclidean distance. A three-cluster solution (dotted grey line) was selected resulting in a balanced distribution of trials across clusters and sessions. These clusters corresponded to three distinct behavioral strategies. ‘Biting’ – defined as biting of the nose-poke port wall; ‘Digging’ – digging movements in the nose-poke hole; ‘Calm’ – all other no-go trials. b) A supervised decision-tree classifier labeled trials to one of three behavioral groups: Digging, Biting, and Calm. Average dopamine concentration of each classified group is depicted (nM; mean + SEM). c) Maximum dopamine concentration (nM) following action-cue offset (+2s) was highest in Biting trials as compared to other No-go trials. ‘After action-cue offset: No-go (trials)’: Individual No-go trials classified by No-go behavior. Solid lines depict the median. ‘After action-cue offset: No-go (rats)’ and ‘Unpredicted pellets (rats)’: Rats classified based on their predominant No-go strategy. Solid lines depict the mean. Significance: * p < 0.05, ** p < 0.01, *** p < 0.001, post hoc Dunn’s tests.


