Underlying dyslipidemia postpartum in women with a recent GDM pregnancy who develop type 2 diabetes
- Department of Physiology, Faculty of Medicine, University of Toronto, Canada
- Donnelly Centre for Cellular & Biomolecular Research, University of Toronto, Canada
- Kaiser Permanente Northern California, Division of Research, United States
- Advanced Diagnostics, Metabolism, Toronto General Research Institute, Canada
Figures
Figure 1
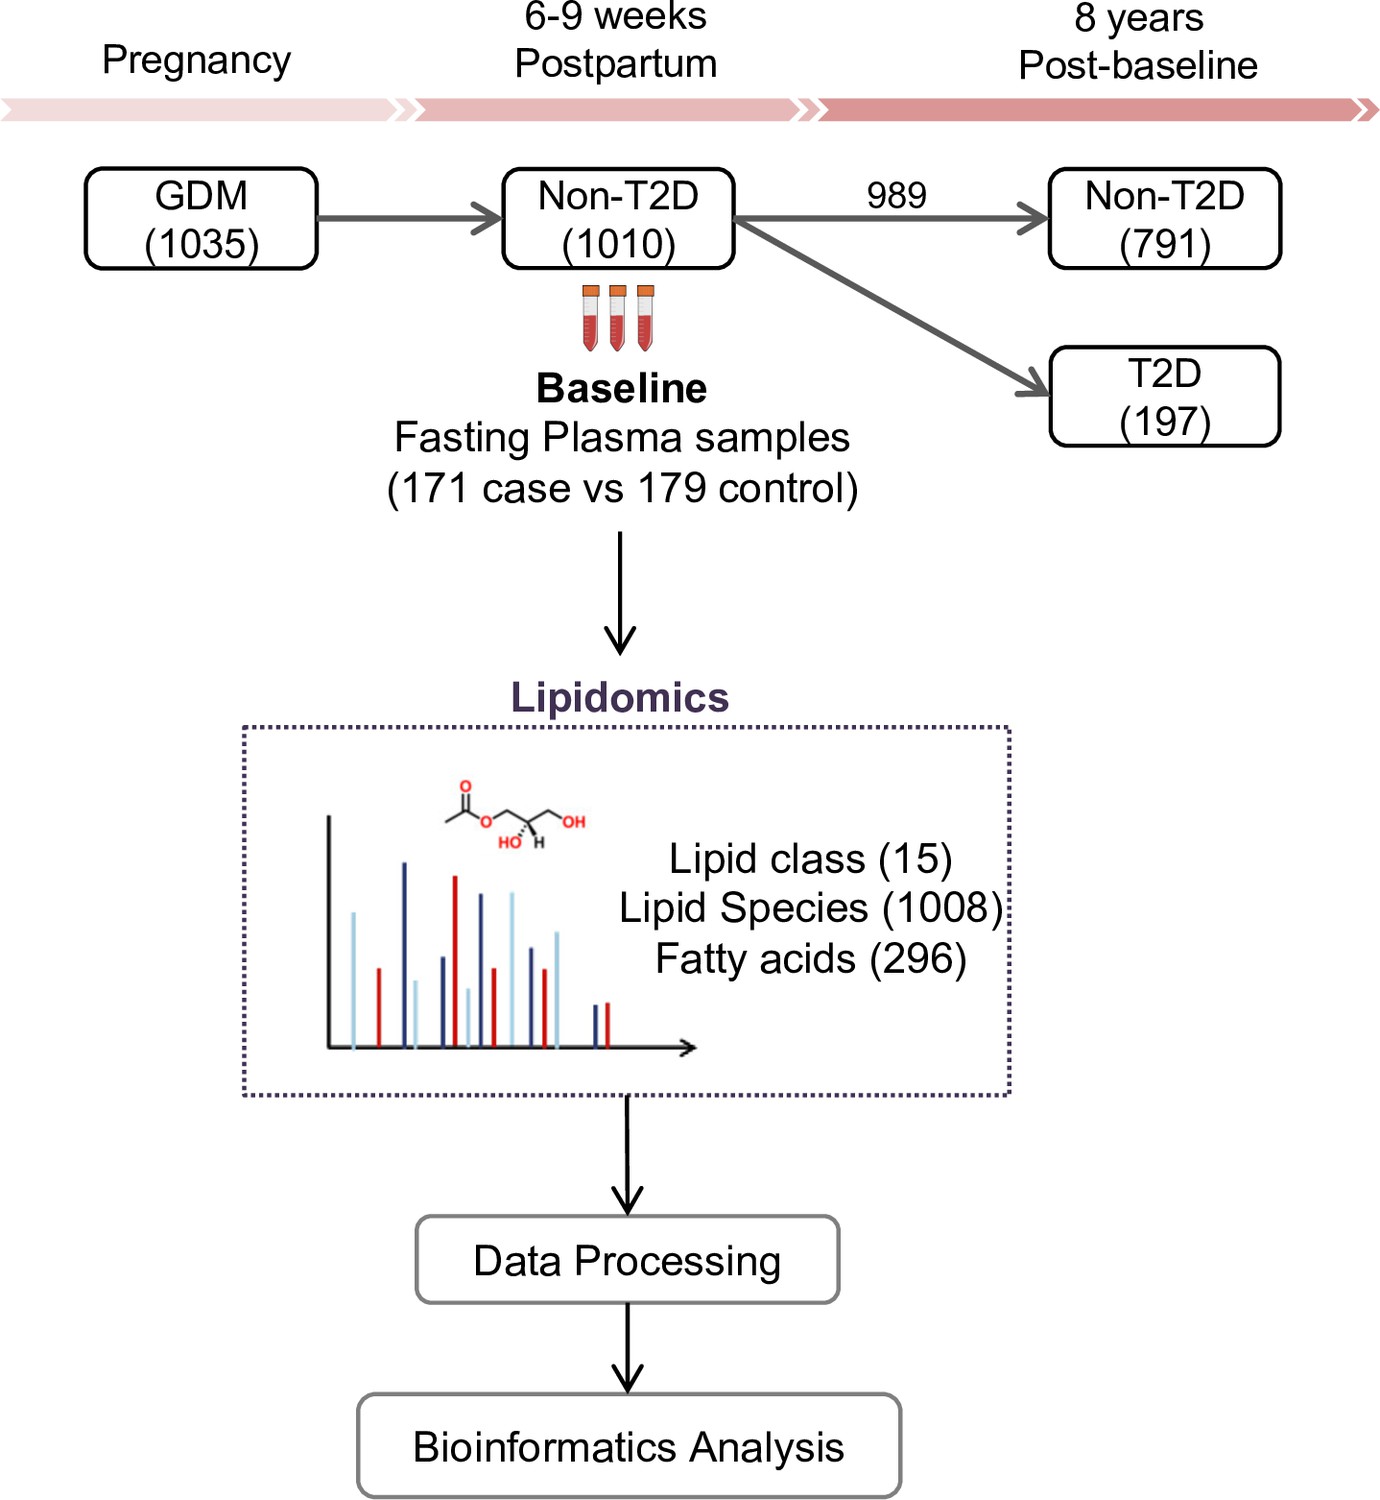
SWIFT cohort and study design.
In the SWIFT cohort, 1035 women diagnosed with GDM in 2008–2011 were enrolled at 6–9 weeks postpartum (baseline). 1010 of the 1035 participants were confirmed via 2 hr 75 g OGTT without diabetes at baseline. Up to 8 years’ post-baseline, a total of 197 (19.5%) women developed T2D. At baseline, samples of 171 available cases with 179 controls were measured using lipidomics. A total of 1008 lipid species from 15 lipid classes and 296 fatty acids were assessed in the plasma samples of all participants.
Figure 2 with 2 supplements
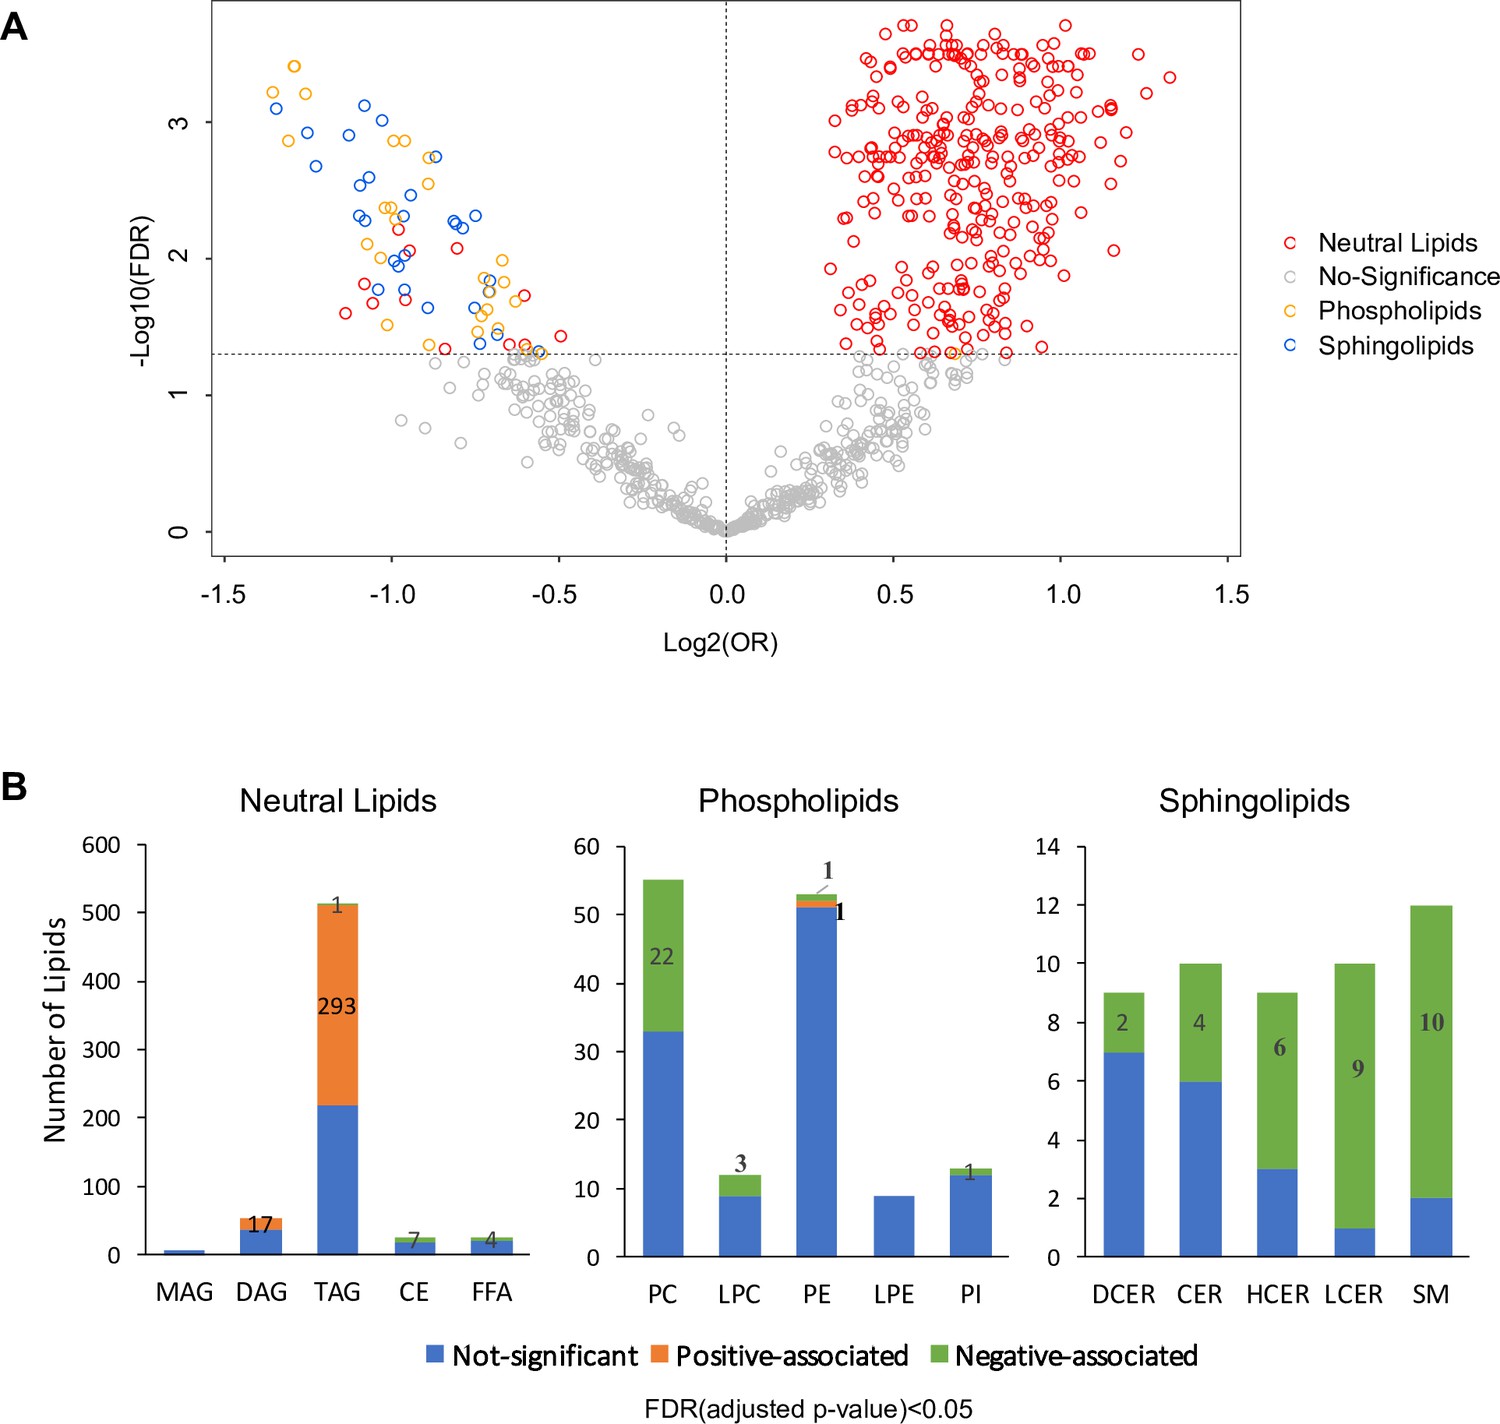
Overview of T2D associated lipids.
(A) Volcano plot showed -log10(FDR) against log2(OR) of 816 lipid species in the association with T2D risk. Grey circles were denoted as no significant association with T2D risk. Of those that are significantly associated, red circles denote as neutral lipids, orange as phospholipids, blue as sphingolipids. (B) Number of T2D positive-, negative- and non- associated lipids in each lipid class were shown. Orange, green and blue bars denote positive-, negative- and non- associated lipids respectively. Significance was indicated by FDR < 0.05.
-
Figure 2—source data 1
Odds ratio, 95% CI and FDR values of all lipids. Lipids with FDR < 0.05 were highlighted.
- https://cdn.elifesciences.org/articles/59153/elife-59153-fig2-data1-v2.xlsx
Figure 2—figure supplement 1
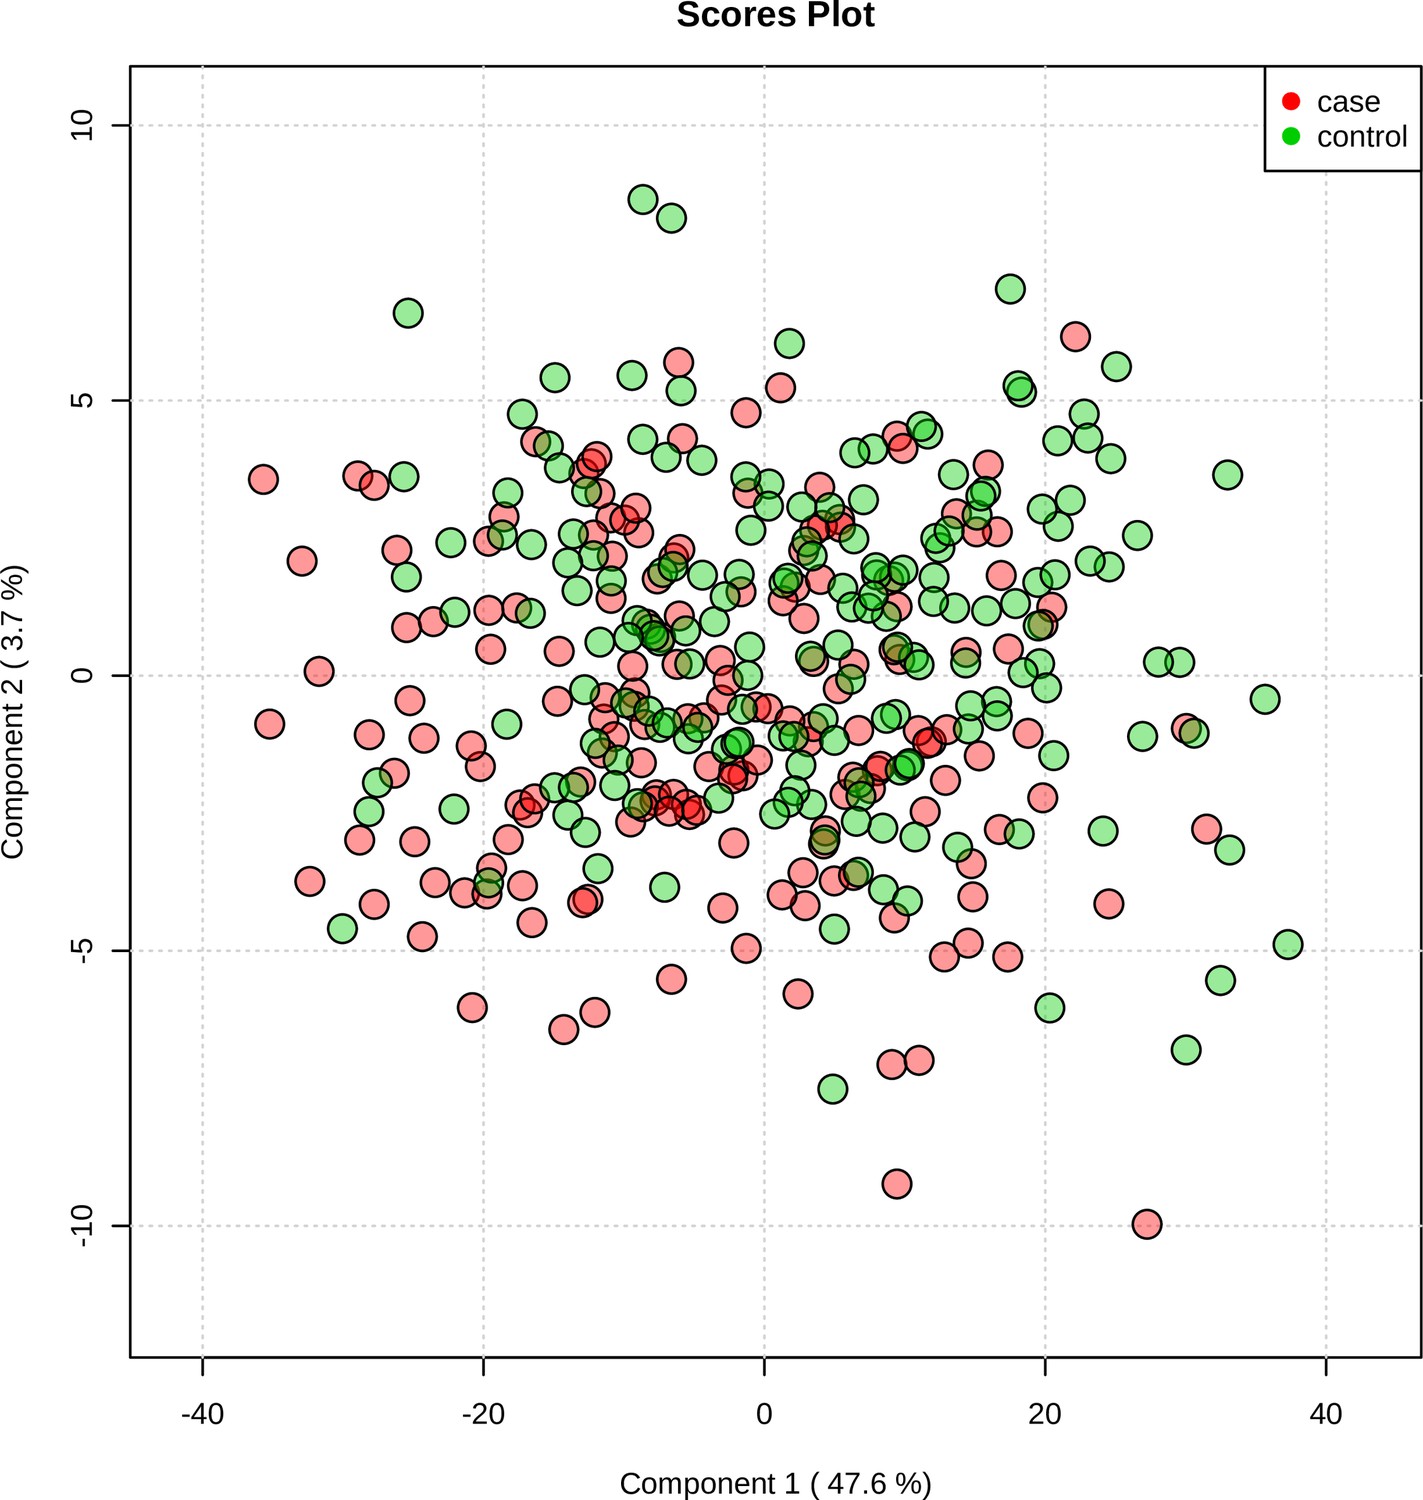
Supervised PCA indicated partial separability of lipid profiles between case and control groups.
Figure 2—figure supplement 2
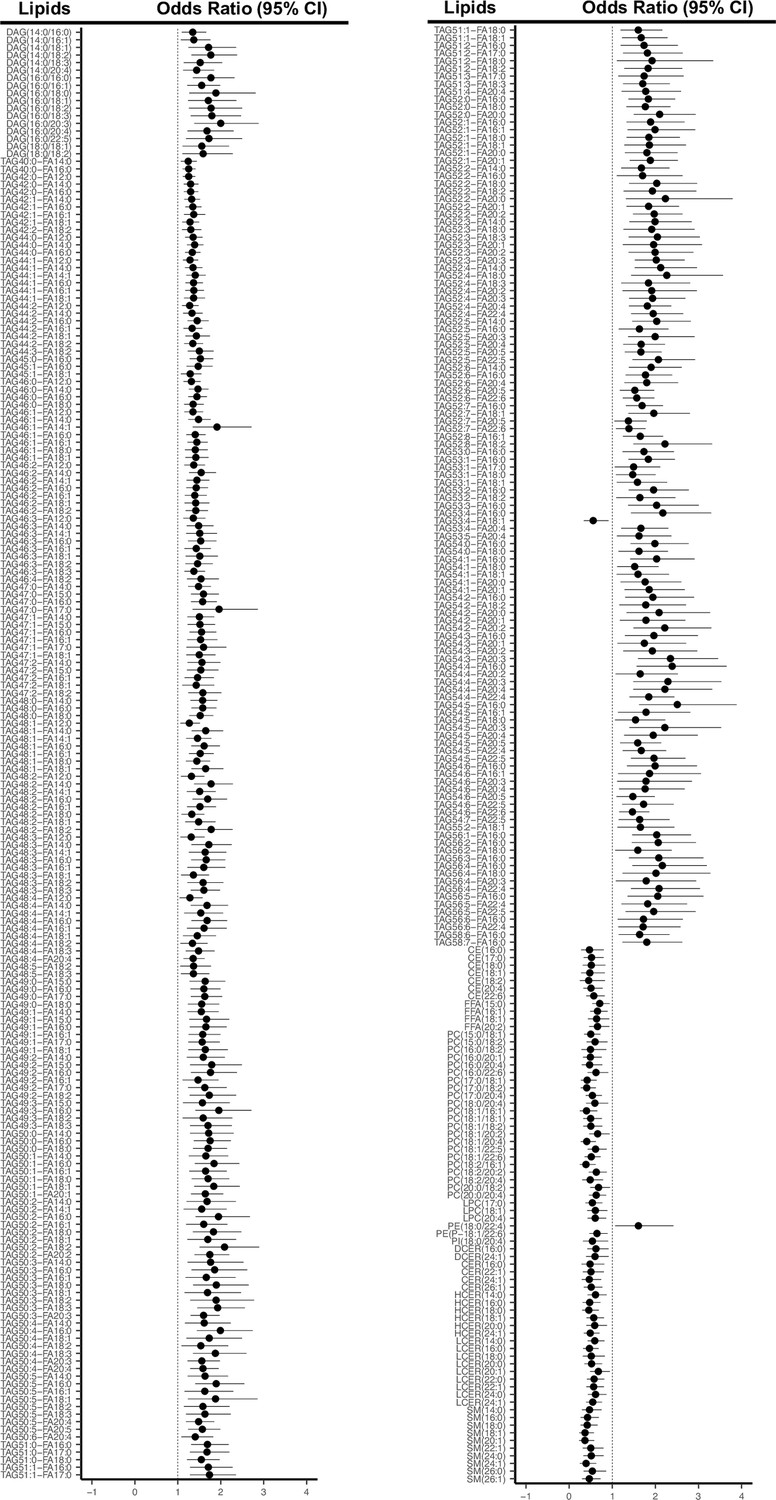
Odds ratio and 95% CI of 311 lipids associated with T2D risk (FDR < 0.05).
Figure 3
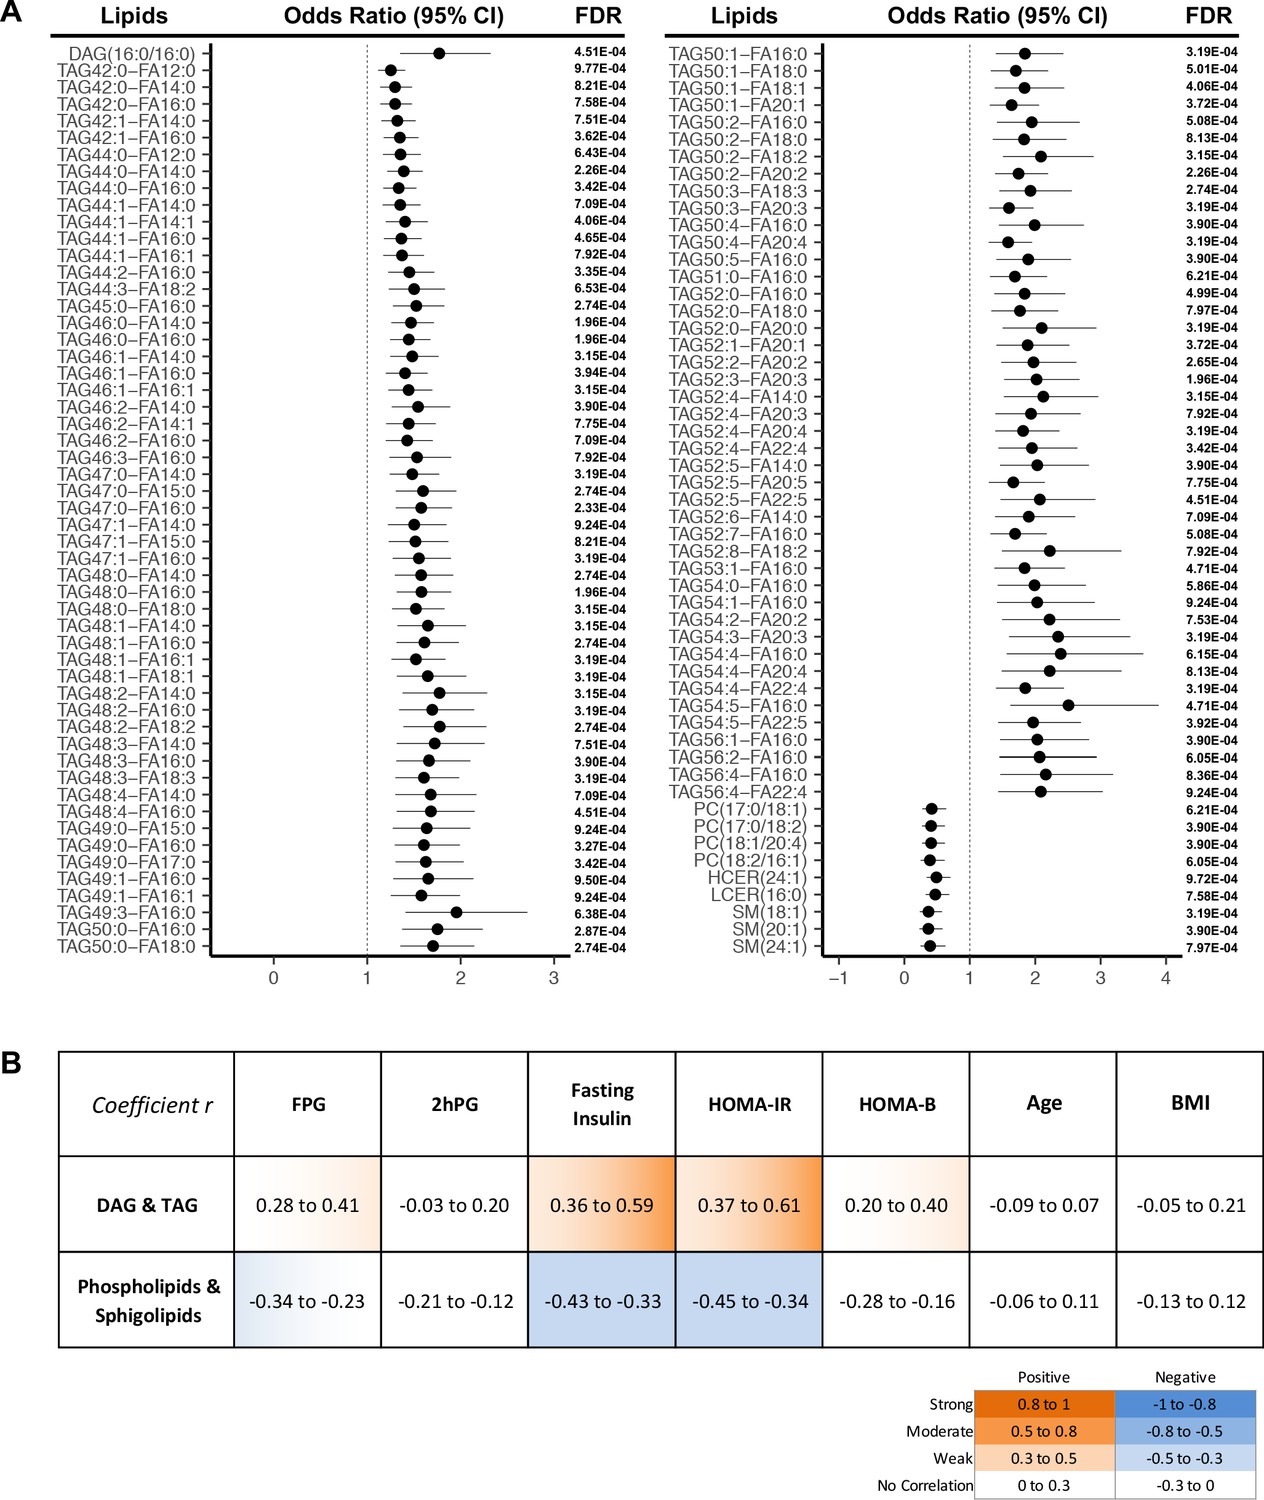
Lipids strongly associated with risk of incident T2D.
(A) Odds ratio and 95% CI of 107 lipids strongly associated with T2D risk (FDR < 0.001) were indicated. The multivariate logistic regression model was adjusted for race, age and BMI. (B) Correlation between 107 T2D-risk associated lipids and conventional clinical parameters was indicated by correlation coefficient (r). Orange color indicates positive correlation while blue denotes negative correlation.
-
Figure 3—source data 1
Odds ratio, 95% CI and FDR values of all lipids. Lipids with FDR < 0.001 were highlighted.
- https://cdn.elifesciences.org/articles/59153/elife-59153-fig3-data1-v2.xlsx
-
Figure 3—source data 2
Correlation r values of T2D risk associated lipids with clinical parameters.
- https://cdn.elifesciences.org/articles/59153/elife-59153-fig3-data2-v2.xlsx
Figure 4

Association between diabetes risk and lipid structure.
(A) Relationship between diabetes risk and total number of carbon atoms and double bonds in lipid species. Odds ratios were represented with dots, color denoting odds ratio value, dot size denoting significance by FDR value. (B) Relationship between diabetes risk and fatty acid composition in lipids. Red and blue color denotes log2(odds ratio) with significance (FDR < 0.05), white denotes values with no significance, grey denotes fatty acids not detected.
-
Figure 4—source data 1
Odds ratio values, FDR values, numbers of carbon atoms and double bonds in all lipid species.
- https://cdn.elifesciences.org/articles/59153/elife-59153-fig4-data1-v2.xlsx
-
Figure 4—source data 2
Relationship between diabetes risk and fatty acid composition in lipids.
- https://cdn.elifesciences.org/articles/59153/elife-59153-fig4-data2-v2.xlsx
Figure 5
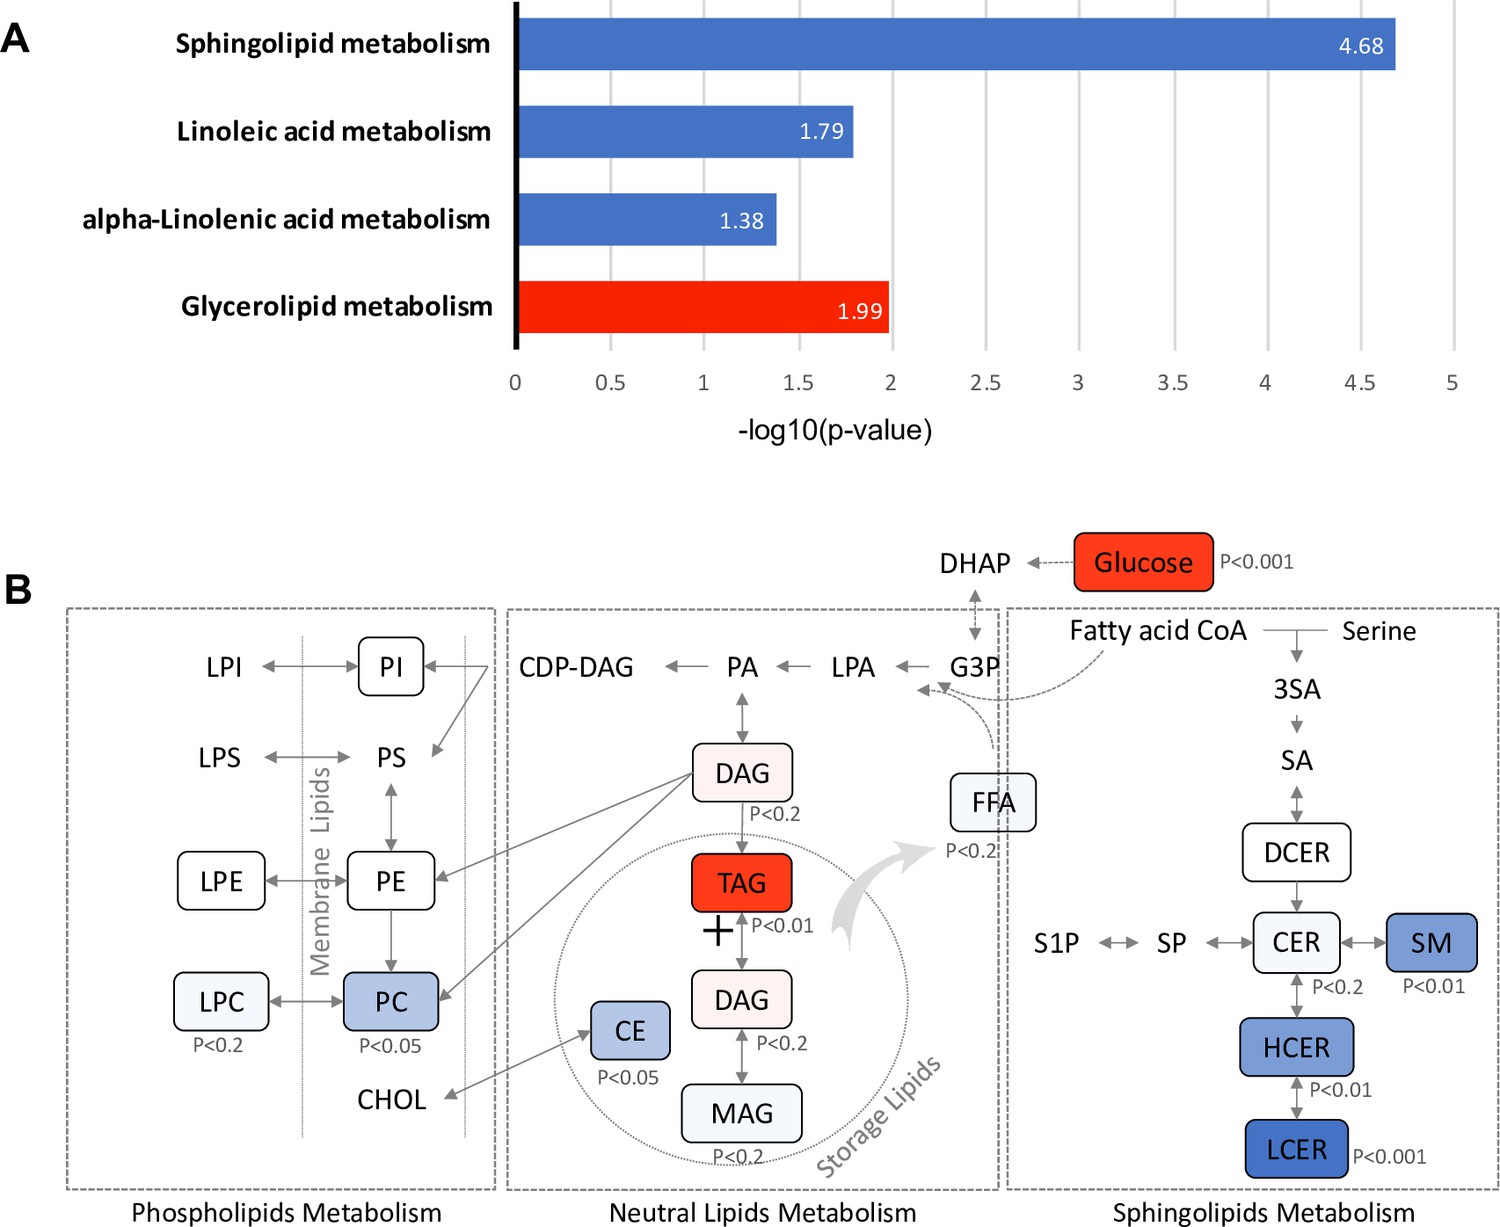
Pathways associated with future T2D at baseline.
(A) Significantly regulated biological pathways associated with future diabetes onset analyzed by Kyoto Encyclopedia of Genes and Genomes (KEGG). Blue denotes the down-regulated pathways and red denotes the up-regulated pathway. (B) The altered lipid classes in an integrated lipid metabolism pathway. Red denotes positive association whereas blue denotes negative association with significance of p-value indicated.
Figure 6
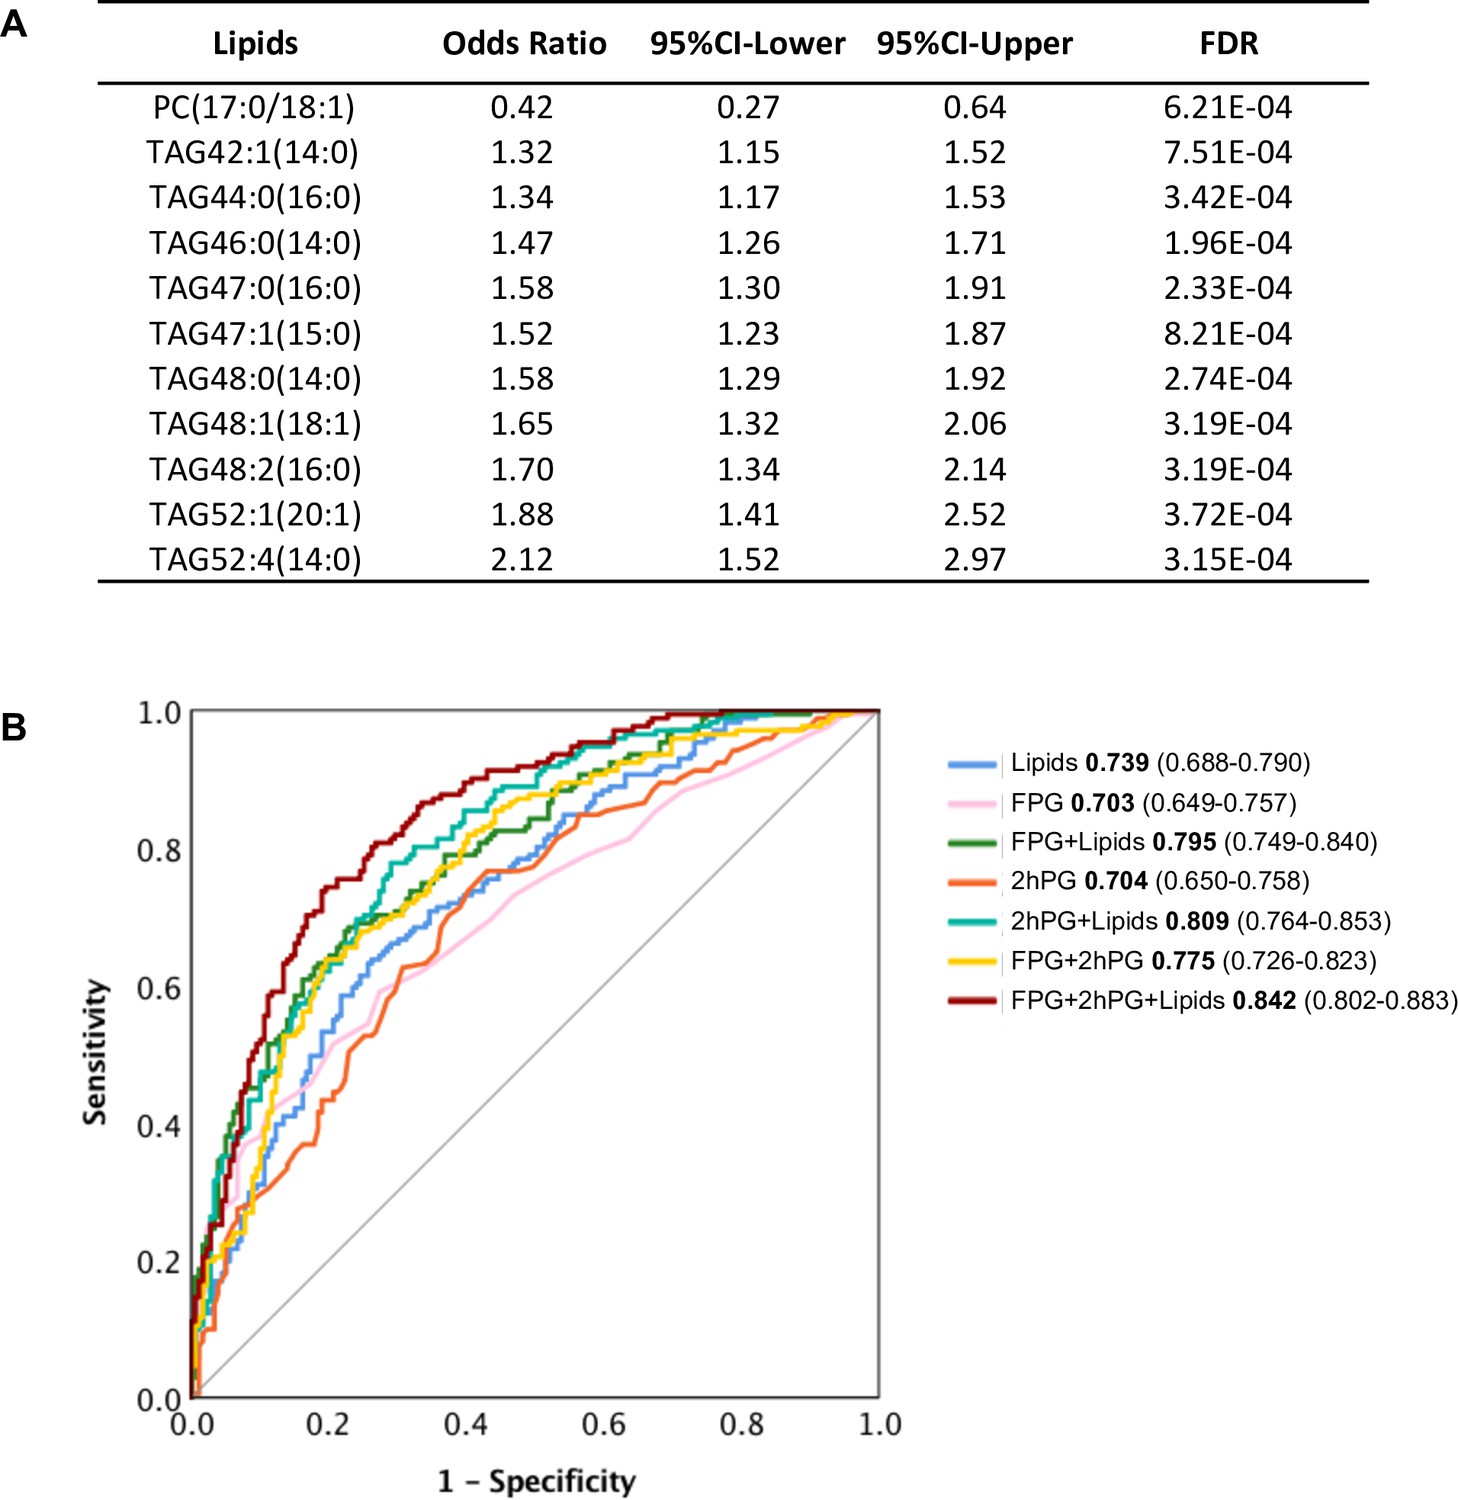
Selected lipid signature predicting future T2D.
(A) Top 11 lipids with the best predictive performance were selected for building a model to predict future T2D. Their odds ratio and 95% CI of T2D association were shown. (B) Predictive performance of logistic regression model was demonstrated as ROC curve. The area under the curve and 95% CI in each model were shown.
-
Figure 6—source data 1
Predictive performance of logistic regression model.
- https://cdn.elifesciences.org/articles/59153/elife-59153-fig6-data1-v2.xlsx
Tables
Table 1
Prenatal and study baseline (6–9 weeks postpartum) characteristics of women with gestational diabetes mellitus in the SWIFT cohort (n = 350).
| Prenatal characteristics | Case Diabetes at follow up | Control No Diabetes at follow up | p-value |
|---|---|---|---|
| (N = 171) | (N = 179) | ||
| Age (years), Mean (SD) | 33.3 (5.2) | 33.0 (4.5) | 0.63 |
| Race/ethnicity, n (%) | 0.72 | ||
| White | 31 (18.1) | 27 (15.1) | |
| Asian | 51 (29.8) | 55 (30.7) | |
| Black | 21 (12.3) | 16 (8.9) | |
| Hispanic | 66 (38.6) | 79 (44.1) | |
| Other | 2 (1.2) | 2 (1.1) | |
| Parity, n (%) | 0.80 | ||
| Primiparous (one birth) | 56 (32.7) | 54 (30.2) | |
| Biparous (two births) | 62 (36.3) | 64 (35.8) | |
| Multiparous (>2 births) | 53 (31.0) | 61 (34.1) | |
| GDM treatment, n (%) | <0.001 | ||
| Diet only | 74 (43.3) | 128 (71.5) | |
| Oral medications | 79 (46.2) | 47 (26.3) | |
| Insulin | 18 (10.5) | 4 (2.3) | |
| Pre-pregnancy BMI (kg/m2), Mean (SD) | 33.6 (8.2) | 32.3 (6.9) | 0.10 |
| Sum of Prenatal 3 hr 100 g OGTT glucose z-scores, Mean (SD) | 1.4 (3.1) | −0.2 (2.5) | <0.001 |
| Family history of diabetes, n (%) | 101 (59.1) | 89 (52.0) | 0.08 |
| Baseline characteristics at 6–9 weeks Postpartum | |||
| BMI (kg/m2), Mean (SD) | 33.5 (7.4) | 32.4 (6.3) | 0.18 |
| Fasting plasma glucose (FPG), mg/dl, Mean (SD) | 101.5 (10.4) | 94.3 (7.7) | <0.001 |
| 2 hr Post-load plasma glucose (75 g OGTT), mg/dl, Mean (SD) | 131.0 (29.5) | 109.8 (27.4) | <0.001 |
| Fasting insulin, μU/ml, Median (IQR) | 26.5 (20.7) | 22.1 (17.4) | 0.001 |
| 2 hr insulin, μU/ml, Median (IQR) | 111.5 (85.7) | 83.3 (73.6) | <0.001 |
| Fasting plasma Triglycerides, mg/dl, Median (IQR) | 119.0 (103.0) | 94.0 (72.0) | 0.003 |
| Fasting plasma HDL-C, mg/dl, Mean (SD) | 49.0 (16.0) | 52.0 (19.0) | 0.017 |
| Fasting plasma Total Cholesterol, Mean (SD) | 199.4 (34.5) | 203.5 (35.5) | 0.27 |
| Fasting plasma LDL-C, Mean (SD) | 121.0 (31.1) | 126.4 (31.2) | 0.10 |
| HOMA-IR, Median (IQR) | 6.8 (5.6) | 5.0 (4.3) | <0.001 |
| HOMA-B, Median (IQR) | 268.1 (192.1) | 256.0 (176.2) | 0.61 |
| Hypertension, n (%) | 14 (8.2) | 5 (2.8) | 0.04 |
| Smoker, n (%) | 5 (2.9) | 4 (2.2) | 0.68 |
| Dietary glycemic index, Mean (SD) | 242.5 (106.7) | 246.5 (112.5) | 0.73 |
| Dietary Intake, Percentage of Kcal as animal fat, Mean SD | 27.0 (7.7) | 25.6 (8.6) | 0.10 |
| Physical activity score, met-hrs per week, Mean (SD) | 50.7 (23.4) | 47.4 (20.6) | 0.16 |
-
Variables obtained from the SWIFT Study that administered the research 2 hr 75 g OGTTs and other assessments at in-person research visits (baseline). Participants did not have diabetes at study baseline and underwent annual 2 hr 75 g OGTTs at baseline and annually for two years, and thereafter evaluated for diabetes onset from electronic medical records. P-values are for incident diabetes case versus no diabetes controls at follow-up.
Additional files
Download links
A two-part list of links to download the article, or parts of the article, in various formats.
Downloads (link to download the article as PDF)
Open citations (links to open the citations from this article in various online reference manager services)
Cite this article (links to download the citations from this article in formats compatible with various reference manager tools)
Underlying dyslipidemia postpartum in women with a recent GDM pregnancy who develop type 2 diabetes
eLife 9:e59153.
https://doi.org/10.7554/eLife.59153


