Endosomal Rab cycles regulate Parkin-mediated mitophagy
- Tokyo Metropolitan Institute of Medical Science, Japan
- National Institutes of Health, United States
- Harvard Medical School, United States
- School of Medicine, Goethe University, Germany
- Institute of Microbial Chemistry, Japan
- Kyoto University, Japan
- National Institute of Genetics, Research Organization of Information and Systems, Japan
- SOKENDAI, Japan
- National Institute of Genetics, ROIS, Japan
Figures
Figure 1 with 2 supplements
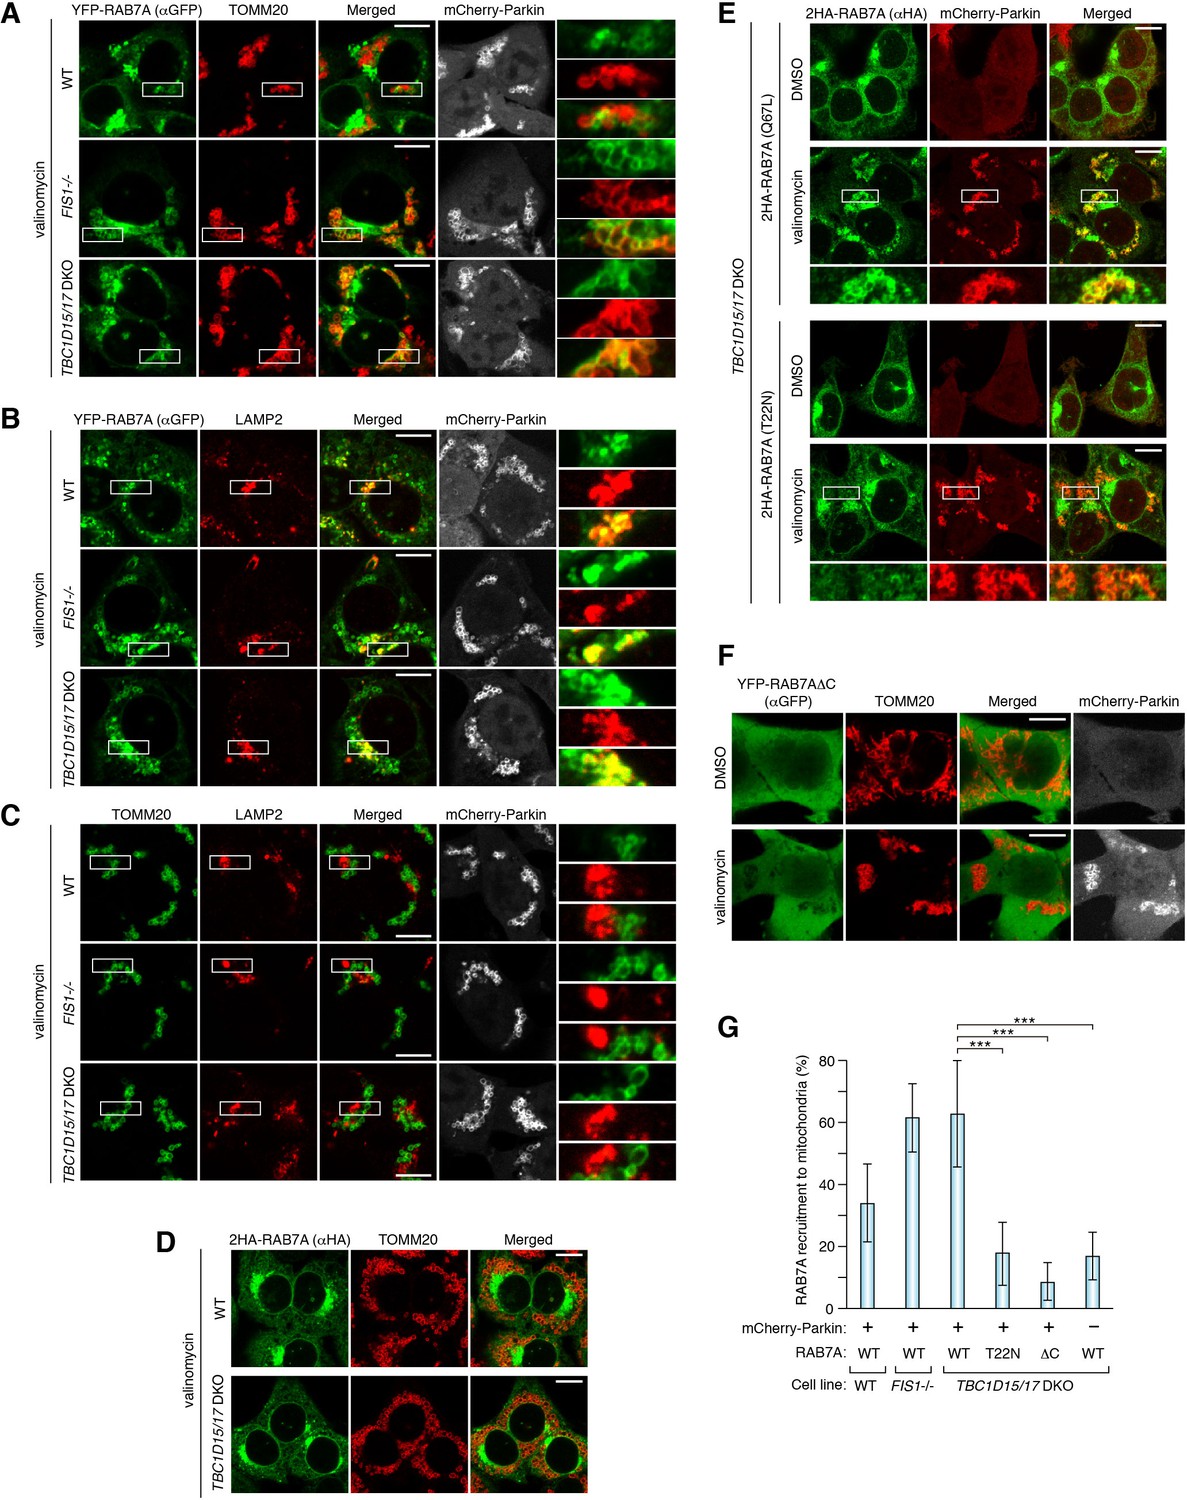
RAB7A is recruited to damaged mitochondria during mitophagy.
The indicated HCT116 cells stably expressing mCherry-Parkin and YFP-RAB7A (A and B), mCherry-Parkin alone (C), 2HA-RAB7A alone (D), or mCherry-Parkin and indicated RAB7A mutant (E and F) were treated with DMSO or valinomycin for 3 hr followed by immunostaining. Magnified images are also shown for A-C, and E. Bars, 10 μm. (G) Quantification of RAB7A recruitment to damaged mitochondria. Overlapped RAB7A signals with TOMM20 per total RAB7A signals were measured. Total RAB7A signal in each cell set to 100%. Error bars represent mean ± SE of at least two independent experiments. Statistical differences were determined by one-way ANOVA with Dunnett’s multiple comparisons test. ***p<0.001.
-
Figure 1—source data 1
This excel file contains quantification of recruitment of RAB7 WT and mutants to damaged mitochondria.
- https://doi.org/10.7554/eLife.31326.005
Figure 1—figure supplement 1
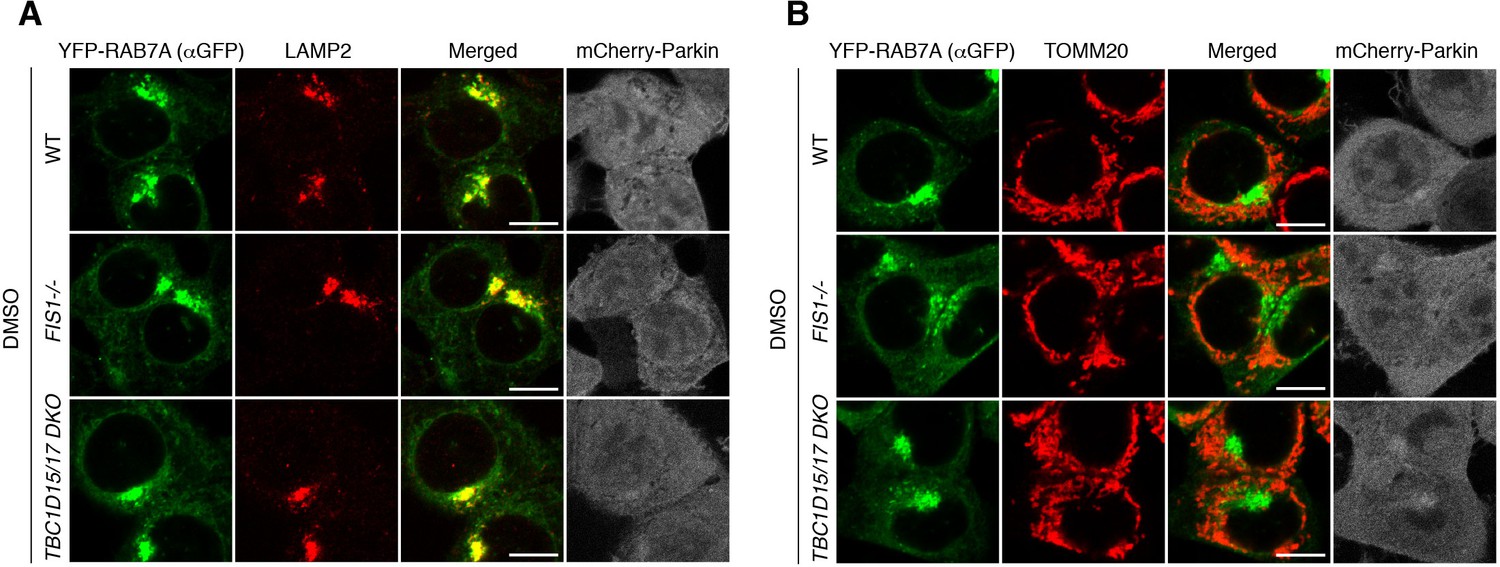
RAB7A localization under basal conditions.
(A and B) The indicated HCT116 cells stably expressing mCherry-Parkin and YFP-RAB7A were subjected to immunostaining. Bars, 10 μm.
Figure 1—figure supplement 2
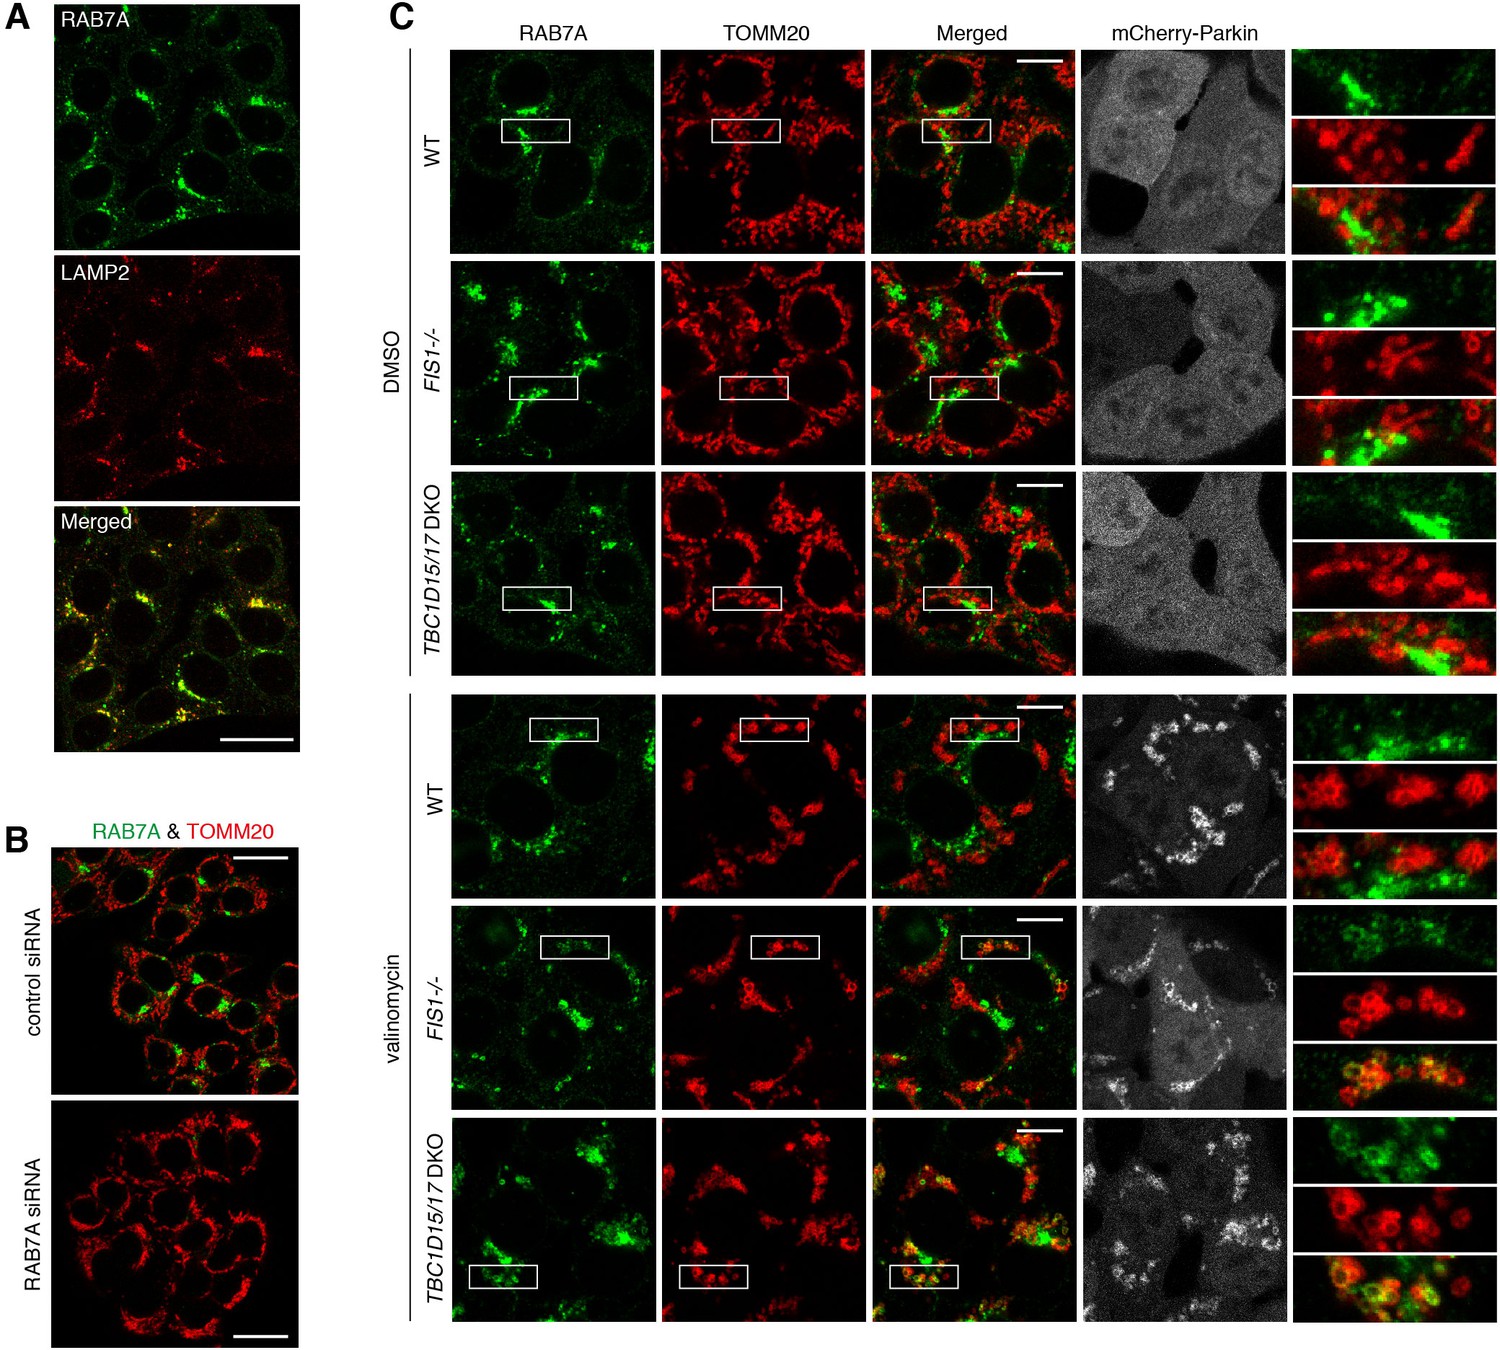
Mitochondrial recruitment of endogenous RAB7A during mitophagy.
(A) HCT116 cells were subjected to immunostaining. Bars, 20 μm. (B) HCT116 cells were treated with control or RAB7A siRNAs followed by immunostaining. Bars, 20 μm. (C) The indicated HCT116 cells stably expressing mCherry-Parkin were treated with DMSO or valinomycin for 3 hr followed by immunostaining. The magnified pictures were shown in the right. Bars, 10 μm.
Figure 2
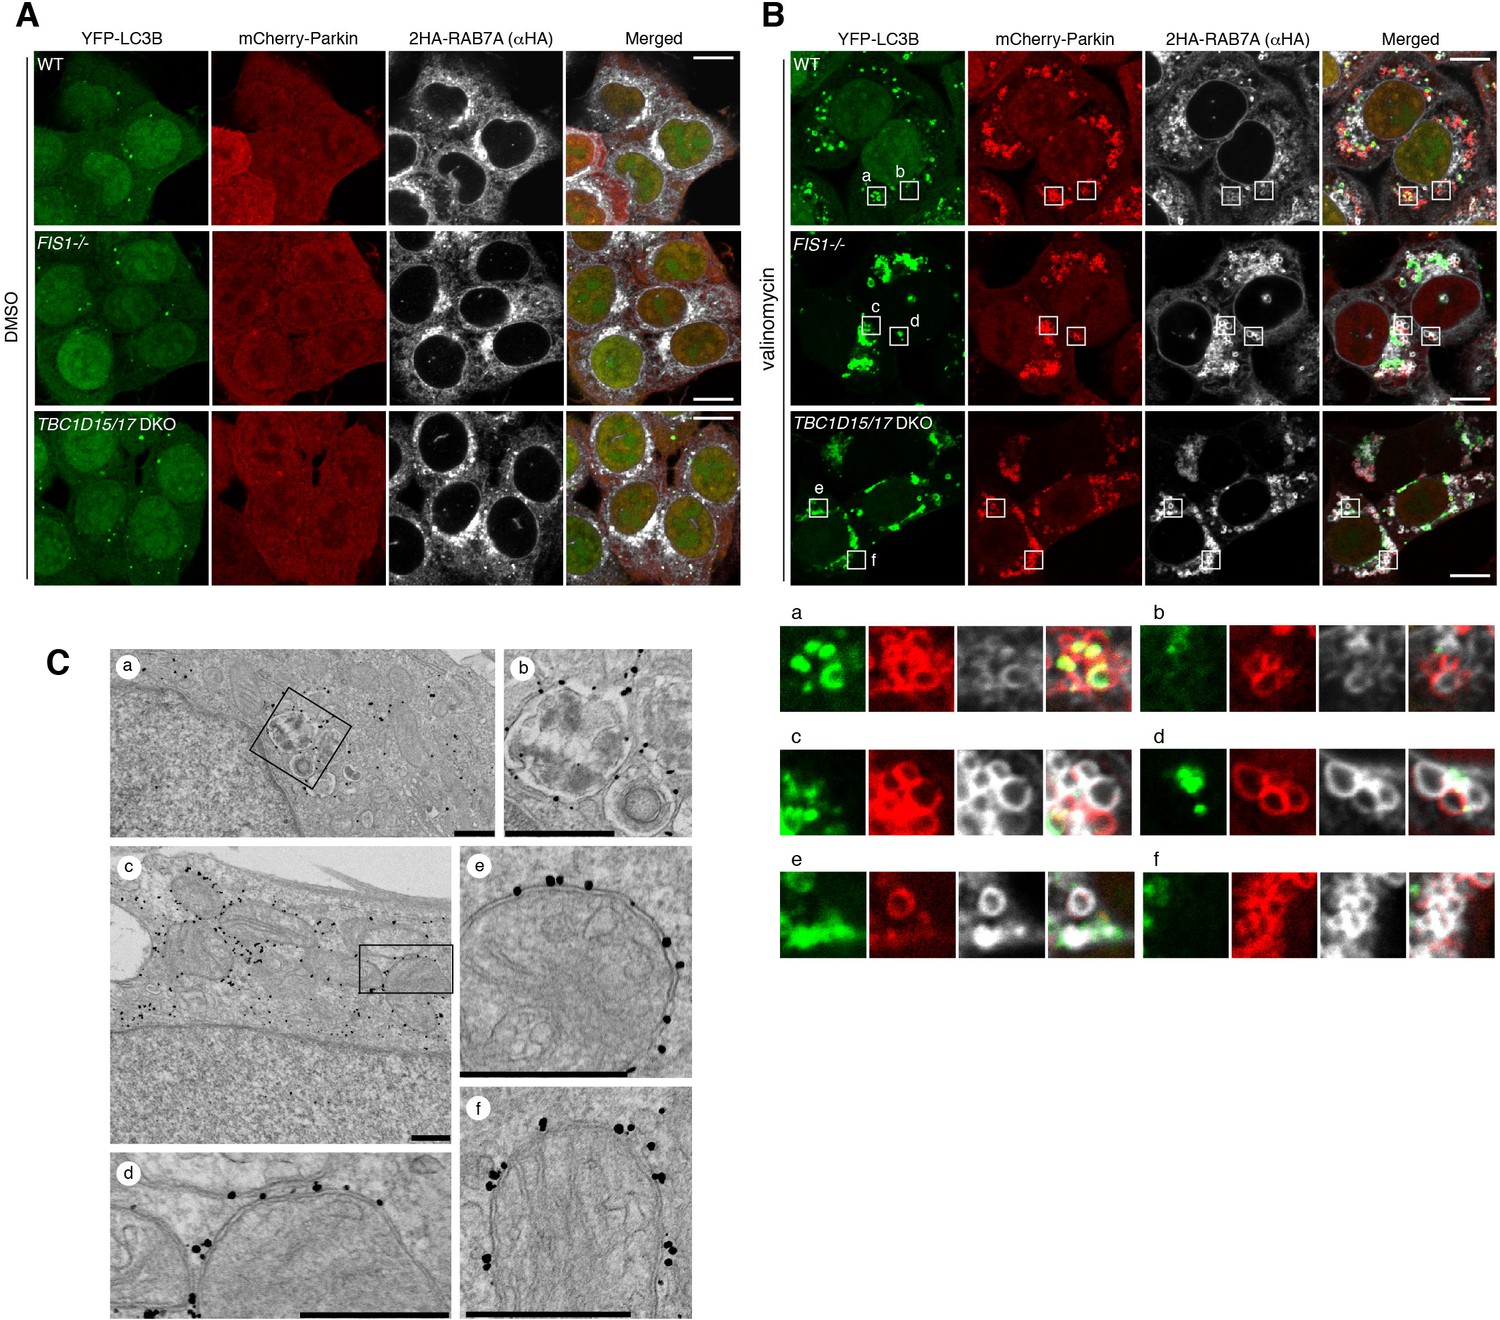
RAB7A directly associates to the outer membrane of damaged mitochondria.
(A and B) The indicated HCT116 cells stably expressing YFP-LC3B, mCherry-Parkin and 2HA-RAB7A were treated with DMSO (A) or valinomycin (B) for 3 hr, and subjected to immunostaining. The magnified images of the cells treated with valinomycin were shown in a-f. Bars, 10 μm. (C) TBC1D15/17 DKO cells stably expressing mCherry-Parkin and YFP-RAB7A were treated with DMSO (a and b) or valinomycin (c–f) for 3 hr and then subjected to immunoelectron microscopy with anti-GFP antibody. Panels b and d are the magnified images of boxes in panels a and c, respectively. Bars, 500 nm.
Figure 3 with 1 supplement
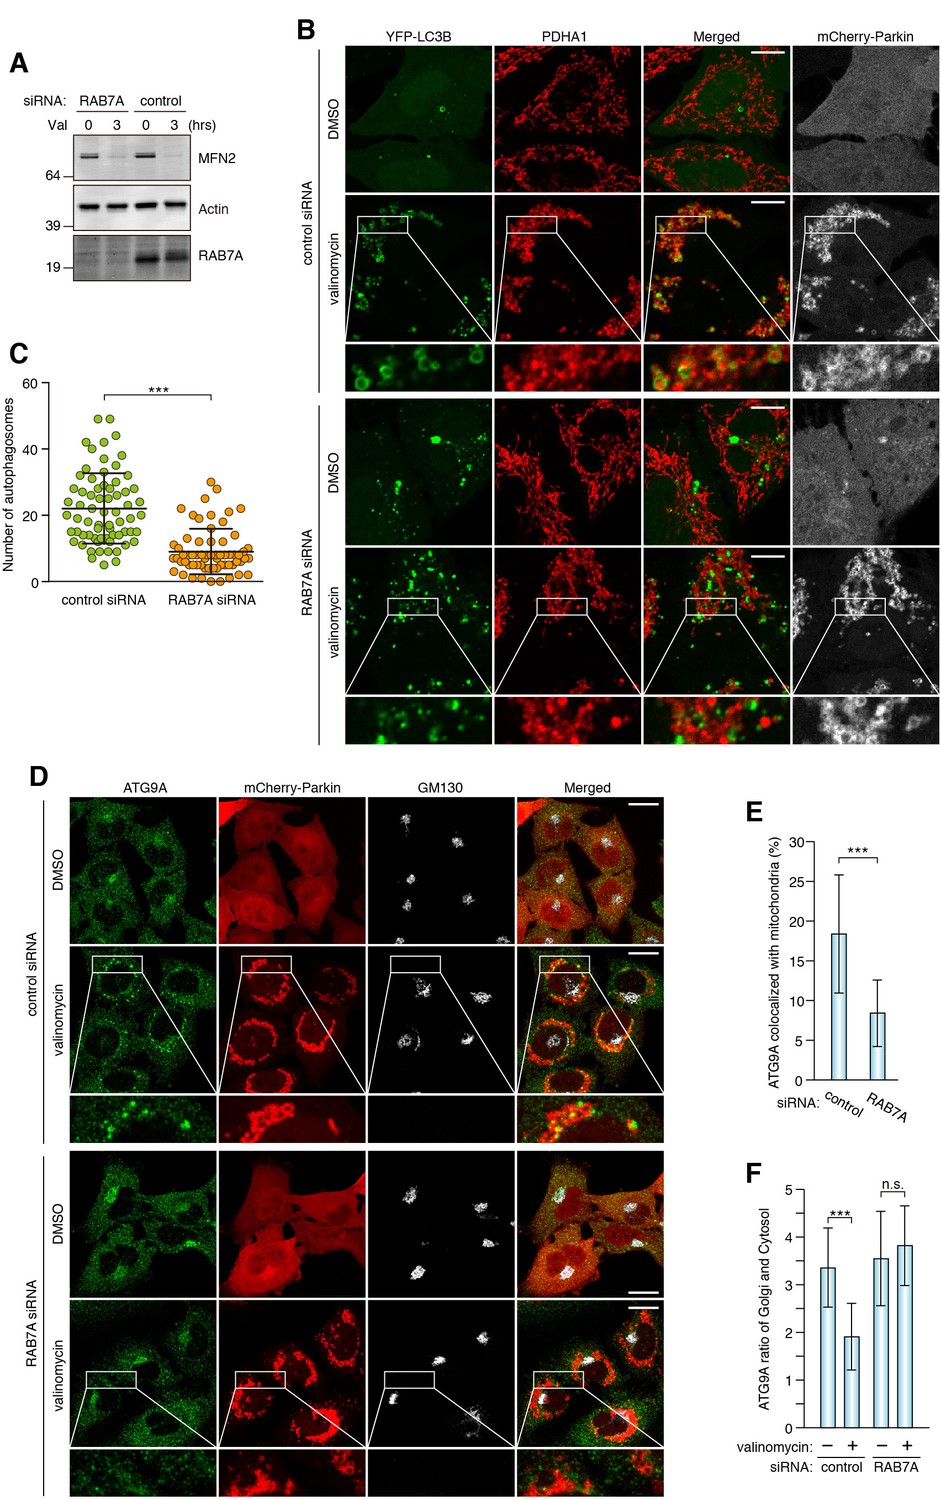
RAB7A is required for ATG9A recruitment to damaged mitochondria and encapsulation by autophagic membranes.
(A) siRNA-treated HeLa cells stably expressing mCherry-Parkin were treated with DMSO or valinomycin (Val) for 3 hr. Total cell lysates were analyzed by immunoblotting. (B) siRNA-treated HeLa cells stably expressing mCherry-Parkin and YFP-LC3B were treated with DMSO or valinomycin for 3 hr. The fixed cells were subjected to immunostaining. Images are displayed as z-stacks of five confocal slices. The magnified pictures of the cells treated with valinomycin were shown. Bars, 10 μm. (C) The number of autophagosomes containing PDHA1 inside in each cell was counted. Error bars represent mean ±SE of at least two independent experiments. Statistical differences were determined by student’s t-test. ***p<0.001. (D) The fixed cells as in (A) were subjected to immunostaining. Images are displayed as z-stacks of five confocal slices. Magnified images are shown for cells treated with valinomycin. Bars, 20 μm. (E) Quantification of ATG9A recruitment to damaged mitochondria in (D). Overlapped ATG9A signals with mitochondria-localized mCherry-Parkin per total ATG9A signals were measured. Total ATG9A signal in each cell set to 100%. Error bars represent mean ±SE. Cells from at least two independent experiments were quantified. Statistical difference was determined by student’s t-test. ***p<0.001. (F) Quantification of ATG9A localization on Golgi apparatus (see the Materials and methods for the detail). Error bars represent mean ±SE. Cells from at least two independent experiments were quantified. Statistical difference was determined by student’s t-test ***p<0.001; n.s., not significant.
-
Figure 3—source data 1
The number of autophagosomes during mitophagy in cells treated with control or RAB7A siRNA.
- https://doi.org/10.7554/eLife.31326.009
-
Figure 3—source data 2
This excel file contains quantification of ATG9A recruitment to damaged mitochondria.
- https://doi.org/10.7554/eLife.31326.010
-
Figure 3—source data 3
Quantification of ATG9A localization.
The ratio of ATG9A on the Golgi apparatus and in the cytosol was quantified.
- https://doi.org/10.7554/eLife.31326.011
Figure 3—figure supplement 1
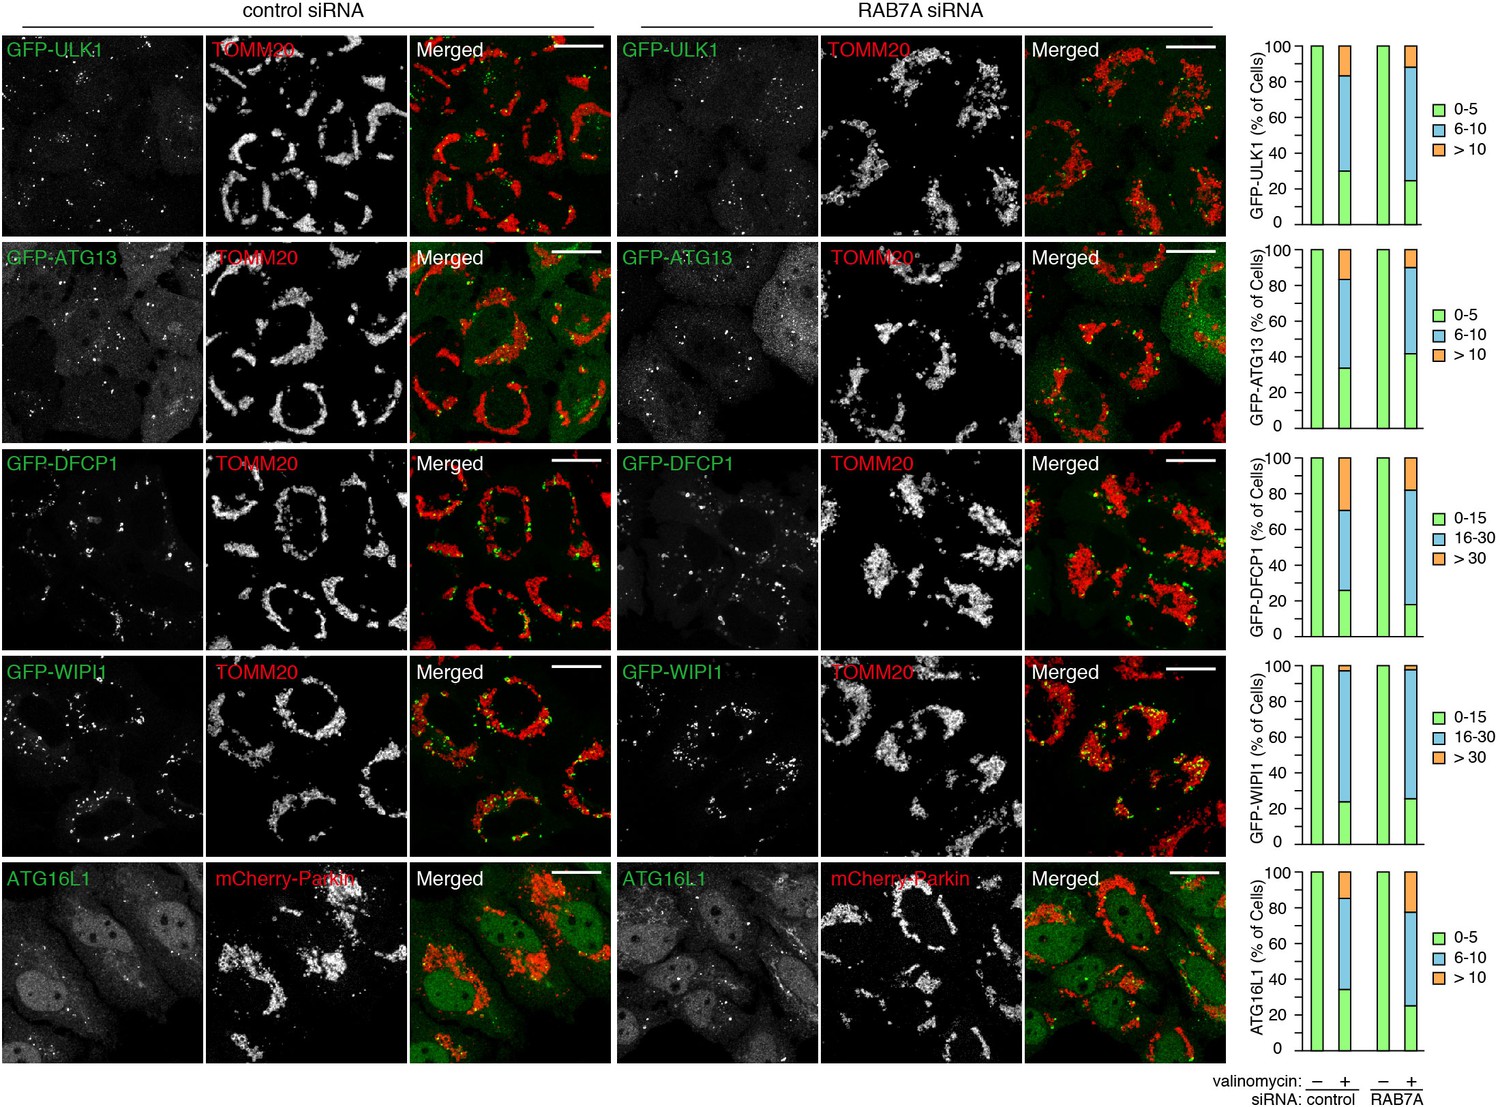
Recruitment of autophagy-related proteins to mitochondria during mitophagy.
siRNA-treated HeLa cells stably expressing mCherry-Parkin alone or with indicated GFP-tagged proteins were treated with valinomycin for 3 hr. The fixed cells were subjected to immunostaining with anti-TOMM20 or anti-ATG16L1 antibodies. Images are displayed as z-stacks of six confocal slices. Bars, 20 μm. Percentages of cells having the indicated number of GFP-foci or ATG16L1 signal were quantified.
-
Figure 3—figure supplement 1—source data 1
source data1 This excel file contains quantification of recruitment/assembly of autophagy-related proteins, GFP-ULK1, GFP-ATG13, GFP-DFCP1, GFP-WIPI1 and ATG16L1 during mitophagy.
- https://doi.org/10.7554/eLife.31326.012
Figure 4 with 1 supplement
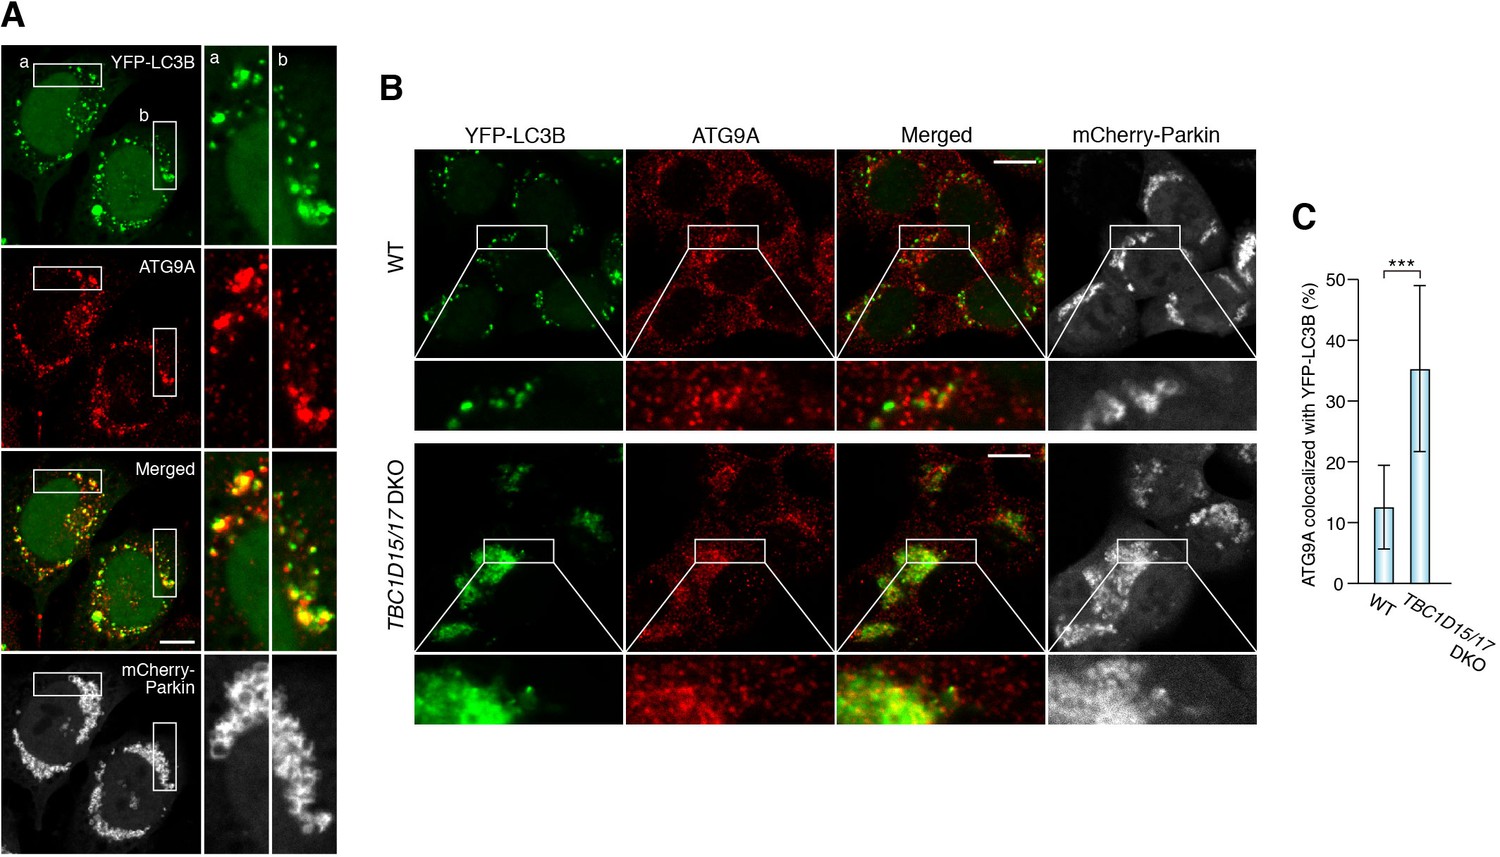
Loss of mitochondrial Rab-GAPs induced excess amounts of ATG9A on damaged mitochondria.
(A) HeLa cells stably expressing YFP-LC3B and mCherry-Parkin were treated with valinomycin for 3 hr followed by immunostaining. Magnified images of boxes (a) and (b) are shown in the right. Bars, 10 μm. (B) The indicated HCT116 cells stably expressing YFP-LC3B and mCherry-Parkin were treated with valinomycin for 3 hr followed by immunostaining. Bars, 10 μm. (C) YFP-LC3B and ATG9A signals prepared as in (B) were processed, and overlapped ATG9A signal with YFP-LC3B per total ATG9A signals in each cell were measured. Total ATG9A signal in each cell set to 100%. Error bars represent mean ±SE. Statistical difference was determined by student’s t-test. ***p<0.001.
-
Figure 4—source data 1
Quantification of colocalization of ATG9A and YFP-LC3B signals during mitophagy.
- https://doi.org/10.7554/eLife.31326.015
Figure 4—figure supplement 1
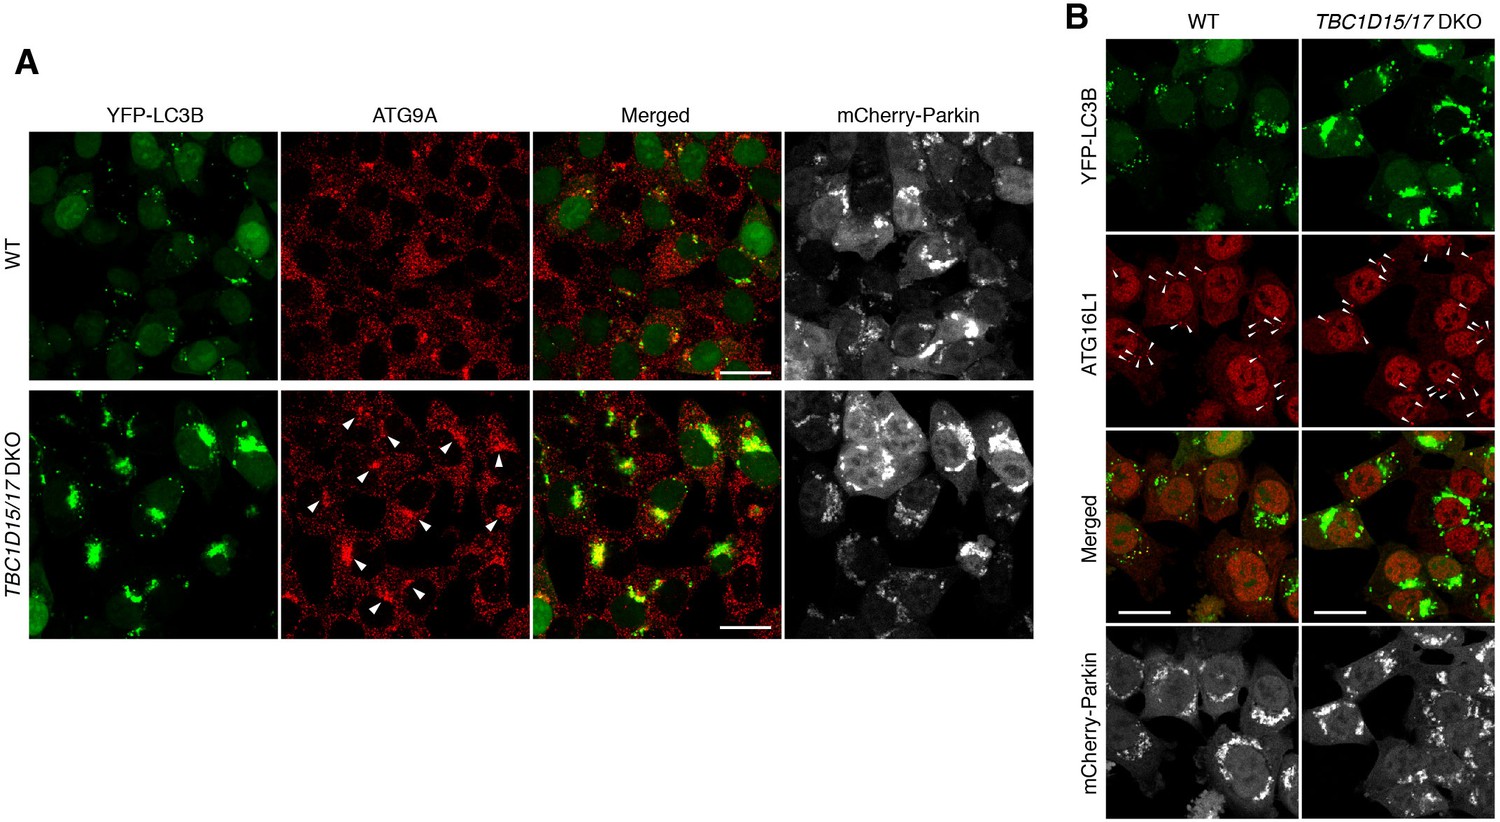
ATG9A and ATG16L1 recruitment to mitochondria in TBC1D15/17 DKO cells.
(A) Low-magnified images in Figure 4B were shown. Bars, 20 μm. Colocalization of the accumulation of YFP-LC3B and ATG9A in TBC1D15/17 DKO cells was indicated as arrowheads. (B) The indicated cells stably expressing mCherry-Parkin and YFP-LC3B were treated with valinomycin for 3 hr. The fixed cells were subjected to immunostaining. Bars, 20 μm. ATG16L1 dots colocalized with YFP-LC3B were indicated as arrowheads.
Figure 5
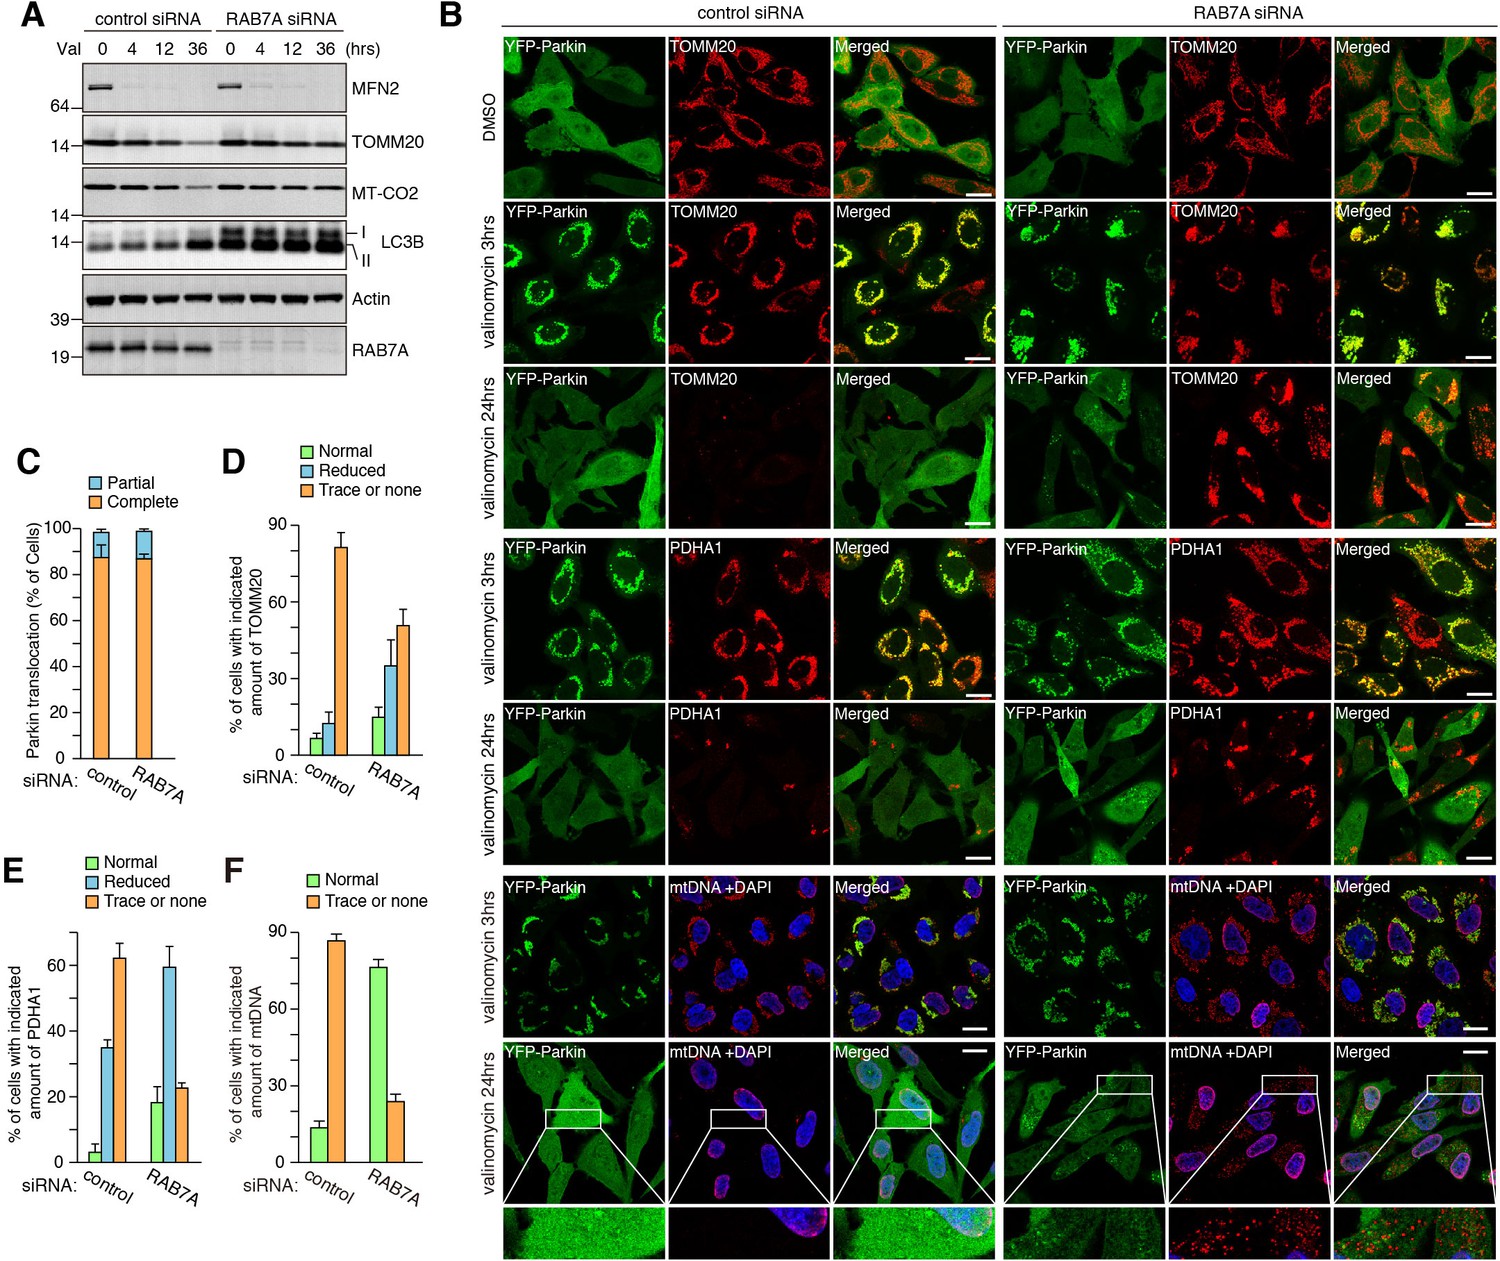
RAB7A is required for mitophagy.
(A) siRNA-treated HeLa cells stably expressing YFP-Parkin were treated with valinomycin (Val) for the indicated times and total cell lysates were analyzed by immunoblotting. I and II denote unmodified and lipidated LC3B, respectively. (B) Cells in (A) were subjected to immunostaining. DAPI was used for nuclei staining since anti-mtDNA antibody non-specifically stains nuclei of the cells having no mtDNA. Magnified pictures were shown for mtDNA degradation in cells treated with valinomycin for 24 hr. Bars, 20 μm. (C) Quantification of YFP-Parkin translocation to mitochondria after 3 hr of valinomycin treatment. Partial and complete denote that Parkin translocates to some of or all mitochondria, respectively. Error bars represent mean ±SE and over 100 cells were counted in each of three separate wells. (D - F) Percentages of cells having the indicated amount of TOMM20 (D), PDHA1 (E) and mtDNA (F) after 24 hr of valinomycin treatment were shown. Error bars represent mean ±SE from three independent replicates. Over 100 cells were counted in each of three separate wells.
-
Figure 5—source data 1
This excel file contains quantification of YFP-Parkin recruitment to damaged mitochondria, degradation of TOMM20, and degradation of PDHA1 upon mitophagy.
- https://doi.org/10.7554/eLife.31326.017
-
Figure 5—source data 2
Quantification of mtDNA degradation upon mitophagy.
- https://doi.org/10.7554/eLife.31326.018
Figure 6
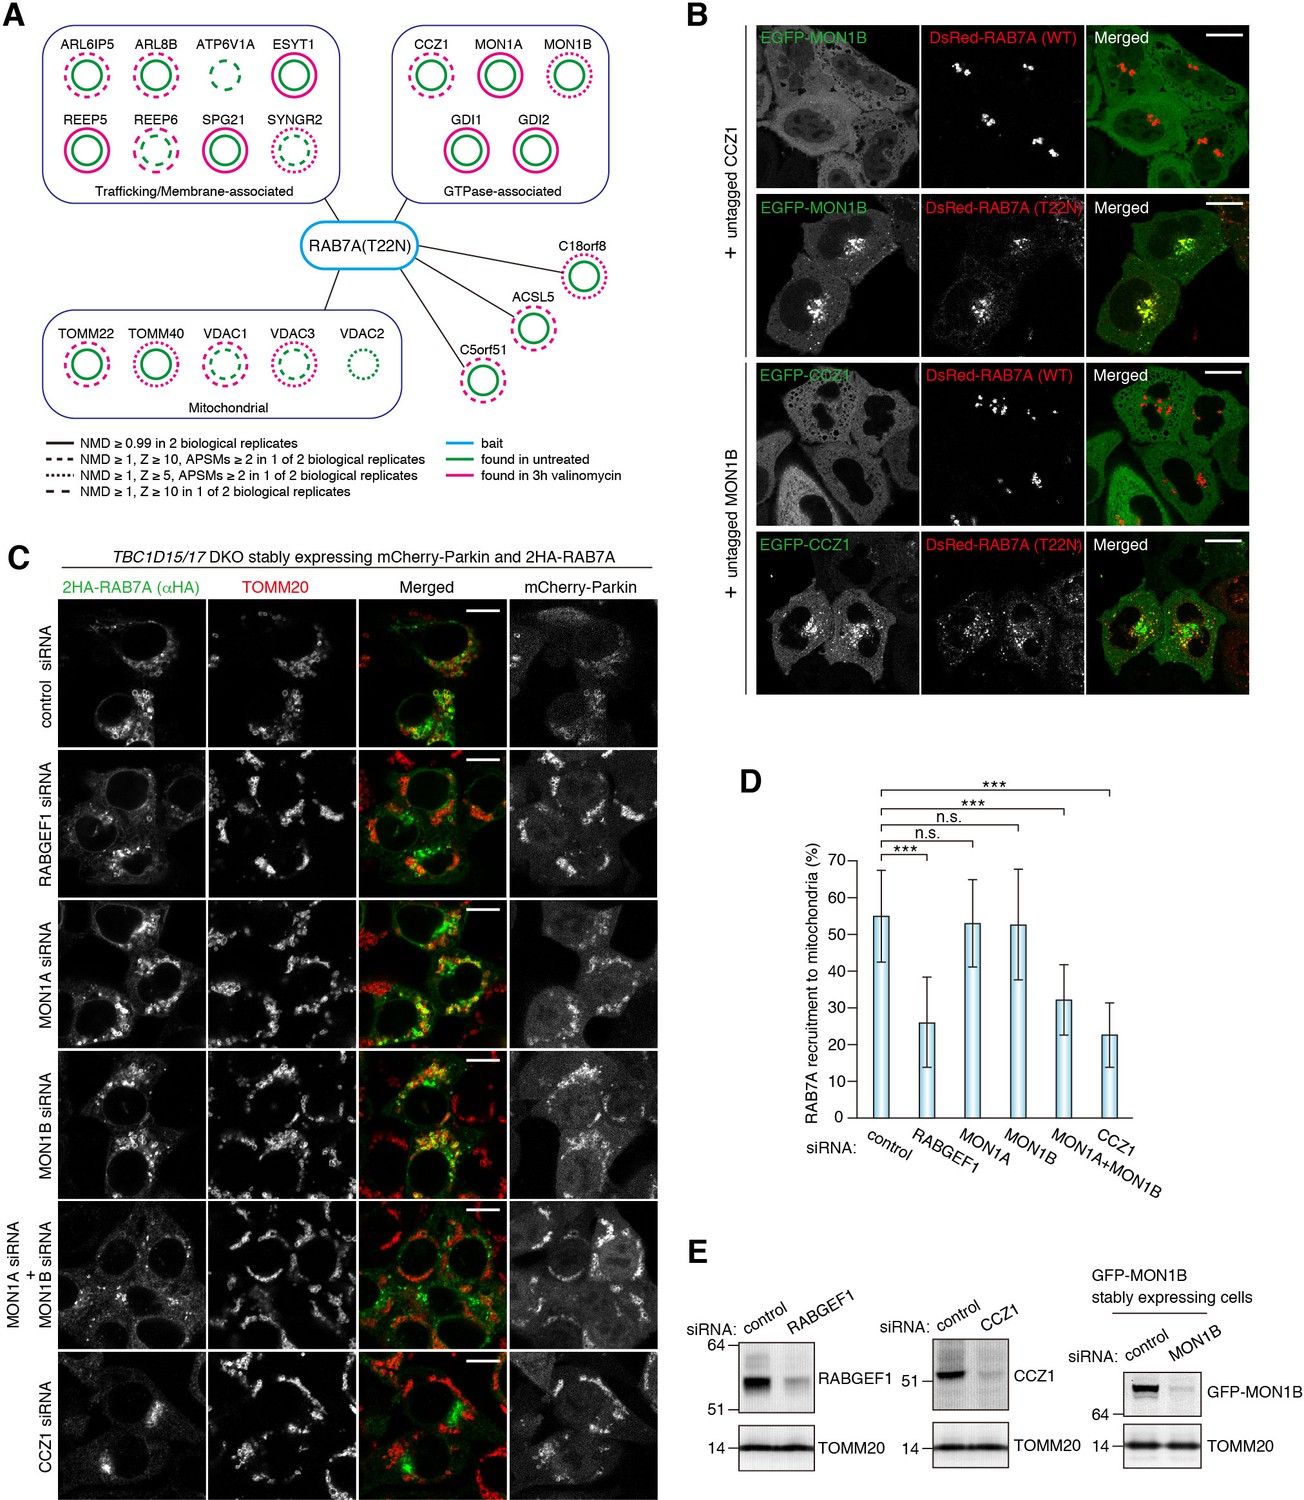
MON1/CCZ1 complex is required for RAB7A recruitment to damaged mitochondria.
(A) Lysates of TBC1D15/17 DKO HCT116 cells stably expressing mCherry-Parkin and 2HA-RAB7A (T22N) were subjected to HA-IP, followed by trypsin digestion and mass spectrometric analysis. High-confidence candidate interacting protein (HCIPs) partners of RAB7A (T22N) are color-coded: untreated (green outline) and 3 hr of valinomycin (magenta outline). Line quality as described in figure key indicates criteria used for inclusion. (B) EGFP-MON1B and untagged CCZ1 (or EGFP-CCZ1 and untagged MON1B) were transiently expressed with DsRed-RAB7A (WT or T22N) in HeLa cells. Bars, 10 μm. (C) siRNA-treated TBC1D15/17 DKO cells stably expressing mCherry-Parkin and 2HA-RAB7A were treated with valinomycin for 3 hr and subjected to immunostaining. Bars, 10 μm. (D) RAB7A recruitment to mitochondria in (C) was quantified. Total signals of 2HA-RAB7A in each cell set to 100%. Error bars represent mean ±SE of at least two independent experiments. Statistical differences were determined by one-way ANOVA with Dunnett’s multiple comparisons test. ***p<0.001; n.s., not significant. (E) HCT116 cells or those stably expressing GFP-MON1B were treated with the indicated siRNAs. Total cell lysates were analyzed by immunoblotting. GFP-MON1B was detected by anti-GFP antibody.
-
Figure 6—source data 1
This excel file contains quantification of 2HA-RAB7A recruitment to mitochondria in TBC1D15/17 DKO cells.
- https://doi.org/10.7554/eLife.31326.020
Figure 7 with 1 supplement
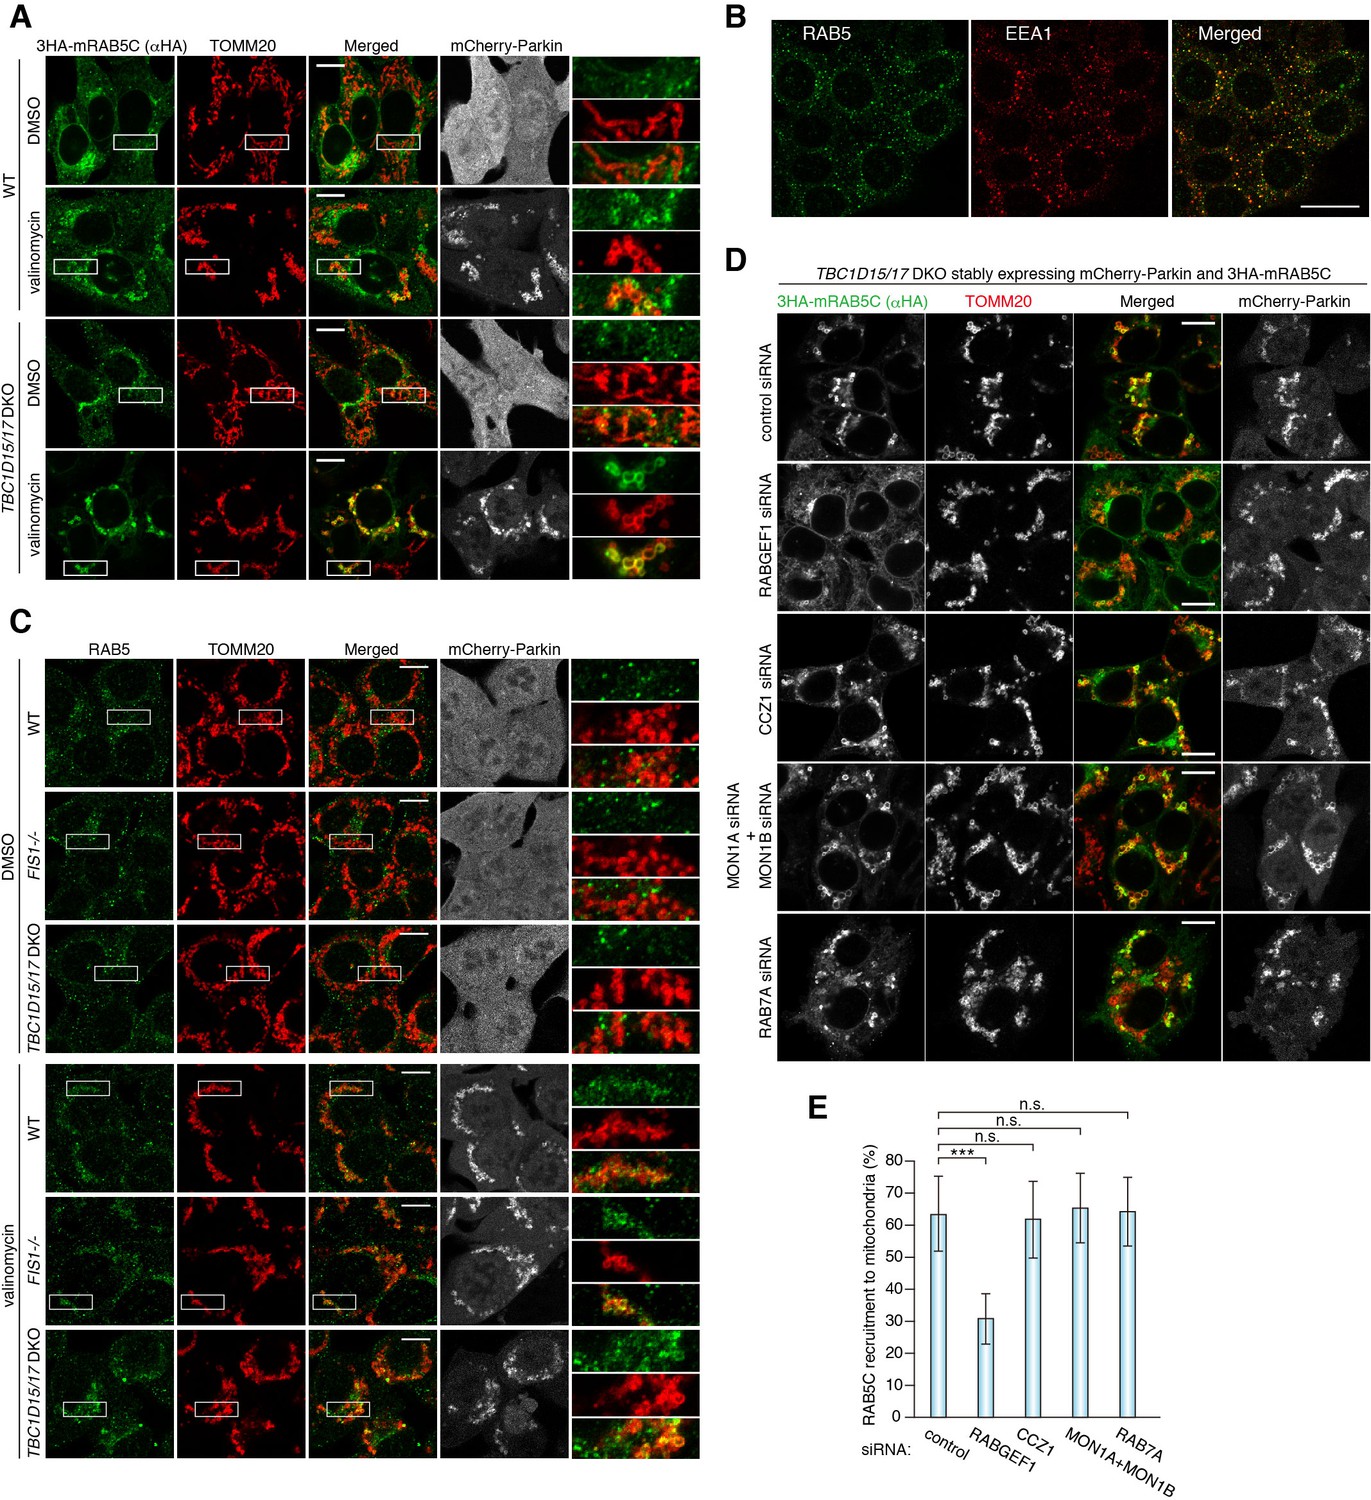
RAB5 is recruited to damaged mitochondria during mitophagy.
(A) WT or TBC1D15/17 DKO cells stably expressing mCherry-Parkin and 3HA-mRAB5C were treated with DMSO or valinomycin for 3 hr. The cells were subjected to immunostaining. The magnified pictures were shown in the right. Bars, 10 μm. (B) HCT116 cells were subjected to immunostaining. Bars, 20 μm. (C) The indicated HCT116 cells stably expressing mCherry-Parkin were treated with DMSO or valinomycin for 3 hr followed by immunostaining. The magnified pictures were shown in the right. Bars, 10 μm. (D) siRNA-treated TBC1D15/17 DKO cells stably expressing mCherry-Parkin and 3HA-mRAB5C were treated with valinomycin for 3 hr and subjected to immunostaining. Bars, 10 μm. (E) Quantification of mRAB5C recruitment to damaged mitochondria in (D). Total signals of 3HA-mRAB5C in each cell set to 100%. Error bars represent mean ±SE of at least two independent experiments. Statistical differences were determined by one-way ANOVA with Dunnett’s multiple comparisons test. ***p<0.001; n.s., not significant.
-
Figure 7—source data 1
This excel file contains quantification of 3HA-RAB5C recruitment to mitochondria in TBC1D15/17 DKO cells.
- https://doi.org/10.7554/eLife.31326.023
Figure 7—figure supplement 1
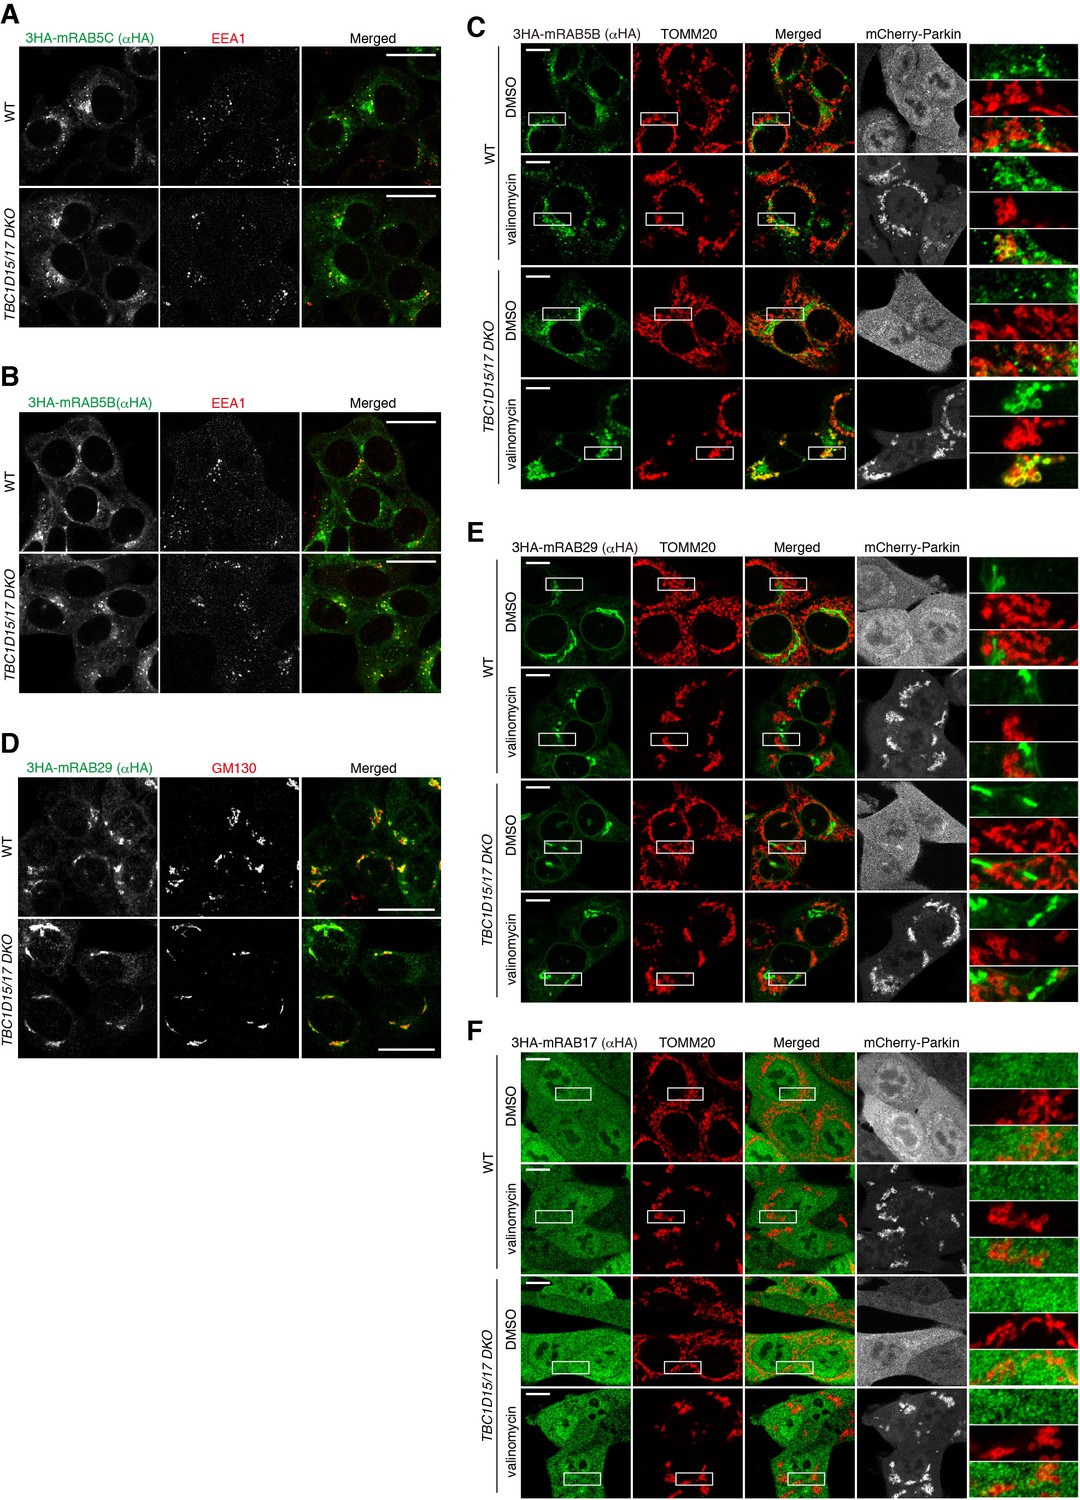
Localization of RAB5B, RAB29, and RAB17 during mitophagy.
(A and B) WT and TBC1D15/17 DKO HCT116 cells stably expressing 3HA-mRAB5C (A) or 3HA-mRAB5B (B) were subjected to immunostaining. Images are displayed as z-stacks of four confocal slices. Bars, 20 μm. (C) The indicated cells stably expressing 3HA-mRAB5B and mCherry-Parkin were treated with DMSO or valinomycin for 3 hr followed by immunostaining. Magnified images are shown in the right. Bars, 10 μm. (D) The indicated cells stably expressing 3HA-mRAB29 were subjected to immunostaining. Images are displayed as z-stacks of four confocal slices. Bars, 20 μm. (E and F) The indicated cells stably expressing mCherry-Parkin, and 3HA-mRAB29 (E) or 3HA-mRAB17 (F) were treated with DMSO or valinomycin for 3 hr followed by immunostaining. Magnified images are shown in the right. Bars, 10 μm.
Figure 8 with 3 supplements
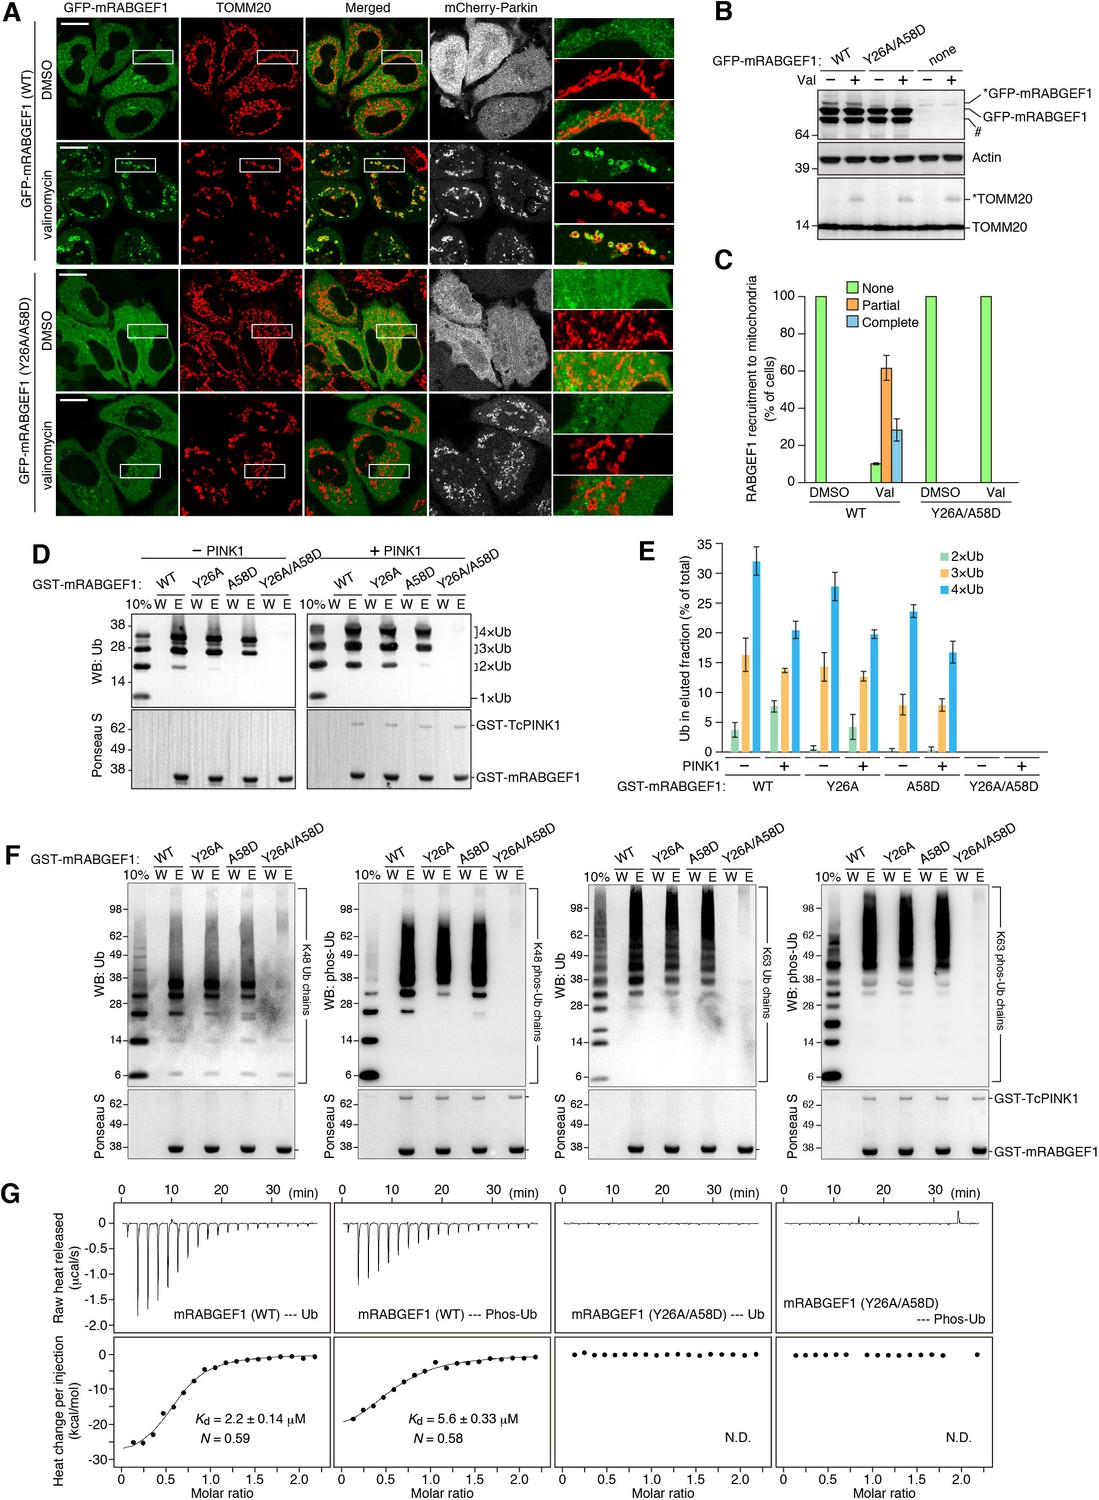
RABGEF1 is recruited to the damaged mitochondria in a ubiquitin-binding dependent manner.
(A) HeLa cells transiently expressing mChery-Parkin and GFP-mRABGEF1 were treated with DMSO or valinomycin for 3 hr followed by immunostaining. The magnified pictures were shown in the right. Bars, 10 μm. (B) Total cell lysates of (A) were analyzed by immunoblotting. Anti-GFP antibody was used for the GFP-mRABGEF1 detection. * and # denote ubiquitinated forms and truncated forms, respectively. (C) Quantification of RABGEF1 recruitment to damaged mitochondria in (A). None, partial and complete denote that GFP-mRABGEF1 signals were overlapped with no, some of, and all mitochondria, respectively. (D) Recombinant ubiquitin (Ub) pre-treated with or without GST-TcPINK1 was subjected to pull-down assay with GST-mRABGEF1. W and E indicate wash and eluted fractions, respectively. 10%, 10% of input. (E) Percentages of the amount of ubiquitin in the eluted fraction in (D) were shown. The error bars represent mean ±SE from three independent experiments. (F) K48-linked and K63-linked Ub chains pre-treated with or without GST-TcPINK1 were subjected to pull-down assay with GST-mRABGEF1. (G) Interactions between GST-mRABGEF1 (WT or Y26A/A58D) and ubiquitin or phosphorylated ubiquitin were measured by ITC. N, stoichiometry of binding.
-
Figure 8—source data 1
Quantification of RABGEF1 recruitment to damaged mitochondria during mitophagy.
- https://doi.org/10.7554/eLife.31326.028
-
Figure 8—source data 2
Binding affinities of recombinant GST-mRABGEF1 with ubiquitin or phosphorylated ubiquitin.
- https://doi.org/10.7554/eLife.31326.029
-
Figure 8—source data 3
Binding affinities of recombinant GST-mRABGEF1 with ubiquitin or phosphorylated ubiquitin.
- https://doi.org/10.7554/eLife.31326.030
Figure 8—figure supplement 1
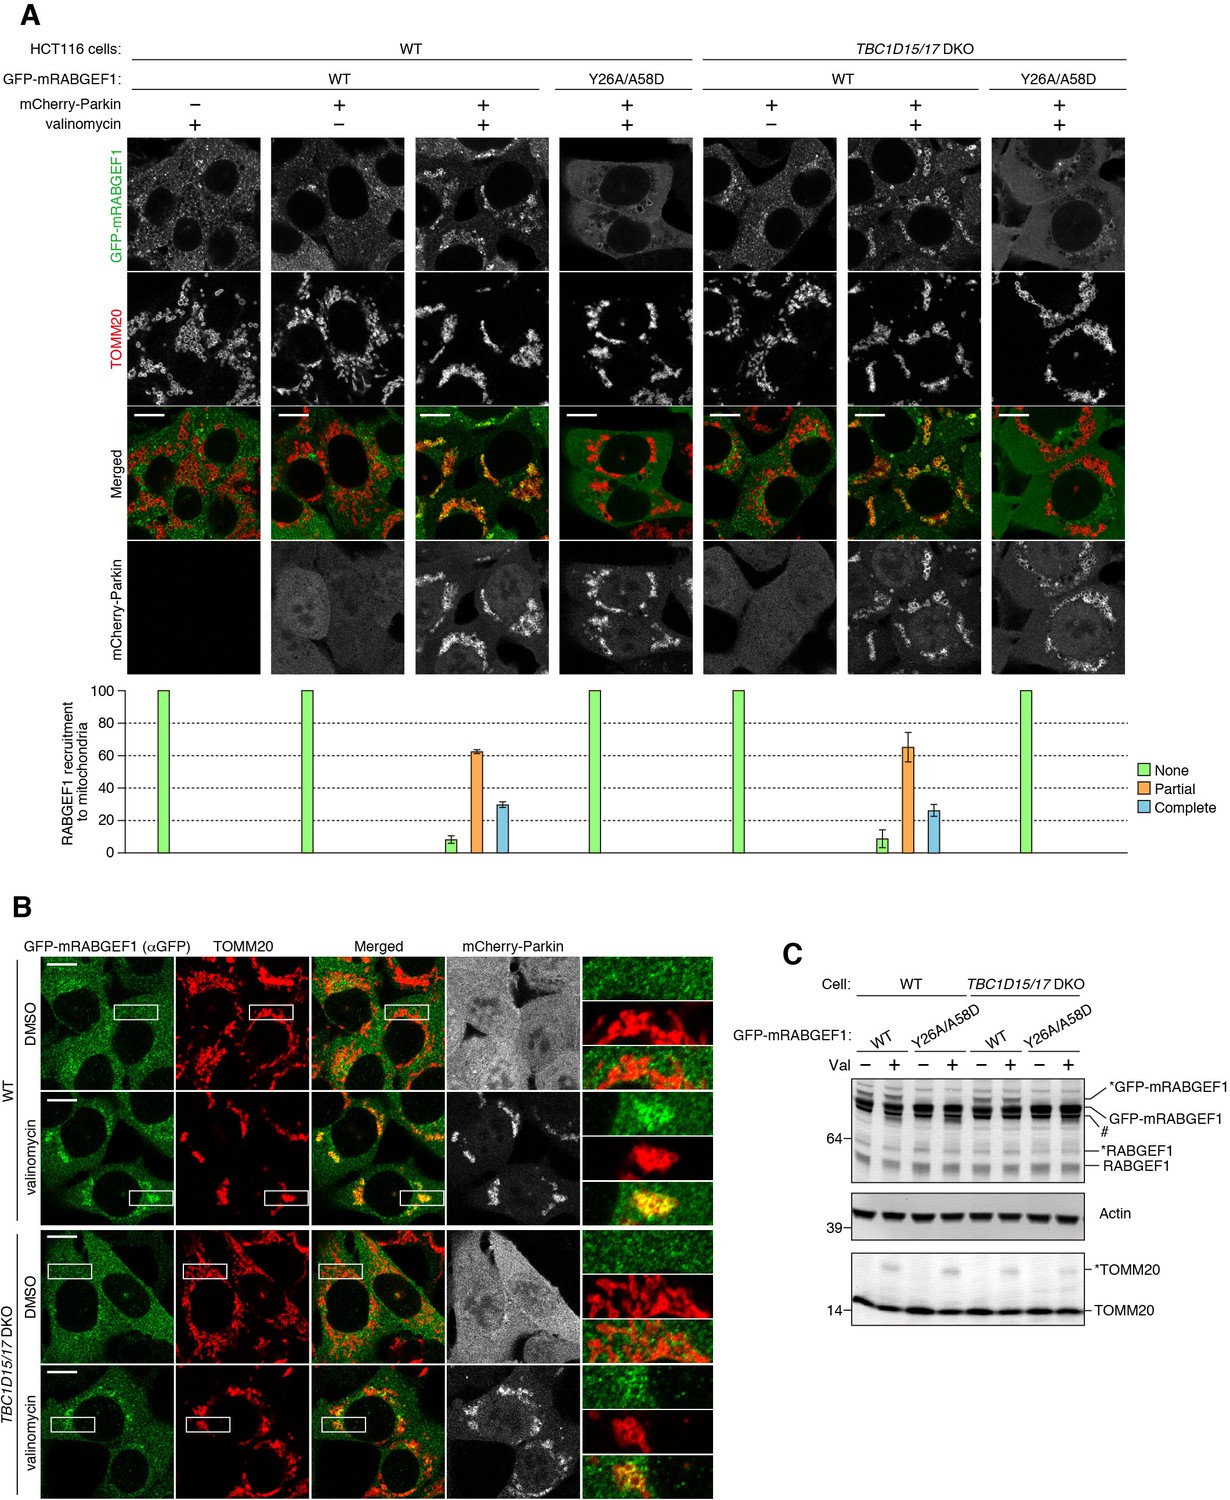
RABGEF1 recruitment to mitochondria during mitophagy.
(A) The indicated cells were treated with DMSO or valinomycin for 3 hr followed by immunostaining. Bars, 10 μm. Graphs for quantification of RABGEF1 recruitment to mitochondria were shown below the images. None, partial and complete denote that GFP-mRABGEF1 signals were overlapped with no, some of, and all mitochondria, respectively. The error bars represent mean ±SE and over 100 cells were counted in each of three separate wells. (B) WT and TBC1D15/17 DKO HCT116 cells stably expressing mCherry-Parkin and GFP-mRABGEF1 were treated with DMSO or valinomycin for 3 hr. GFP-mRABGEF1 signals were enhanced by immunostaining with anti-GFP antibody. Bars, 10 μm. (C) Total cell lysates in (B) were analyzed by immunoblotting. * and # denote ubiquitinated forms and truncated forms, respectively.
-
Figure 8—figure supplement 1—source data 1
This excel file contains quantification of RABGEF1 (WT and Y26A/A58D mutant) recruitment to mitochondria in HCT116 (WT and TBC1D15/17 DKO) cells.
- https://doi.org/10.7554/eLife.31326.031
Figure 8—figure supplement 2
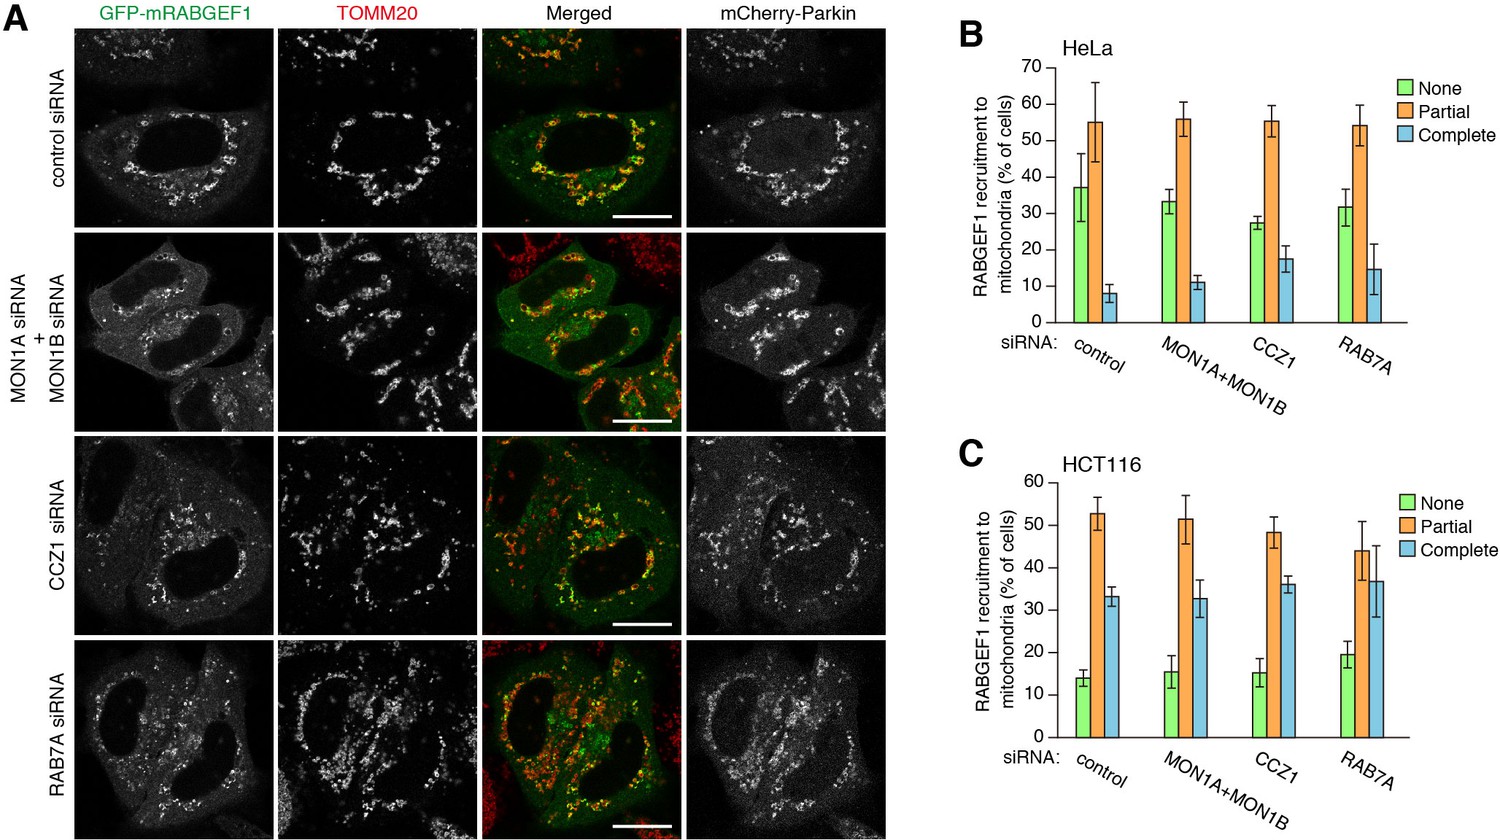
Mitochondrial recruitment of RABGEF1 is not affected by the downstream Rabs and Rab-related factors.
(A) GFP-mRABGEF1 was transiently expressed in siRNA-treated HeLa cells. The cells were then treated with valinomycin for 3 hr followed by immunostaining. Bars, 20 μm. (B) Quantification of mitochondrial recruitment of GFP-mRABGEF1 in HeLa cells. (C) Quantification of mitochondrial recruitment of GFP-mRABGEF1 in HCT116 cells. None, partial and complete denote that GFP-mRABGEF1 signals were overlapped with no, some of, and all mitochondria, respectively. The error bars represent mean ± SE and over 100 cells were counted in each of three separate wells.
-
Figure 8—figure supplement 2—source data 2
Quantification of RABGEF1 recruitment to mitochondria in HeLa cells treated with the indicated siRNA during mitophagy.
- https://doi.org/10.7554/eLife.31326.032
-
Figure 8—figure supplement 2—source data 3
Quantification of RABGEF1 recruitment to mitochondria in HCT116 cells treated with the indicated siRNA during mitophagy.
- https://doi.org/10.7554/eLife.31326.033
Figure 8—figure supplement 3
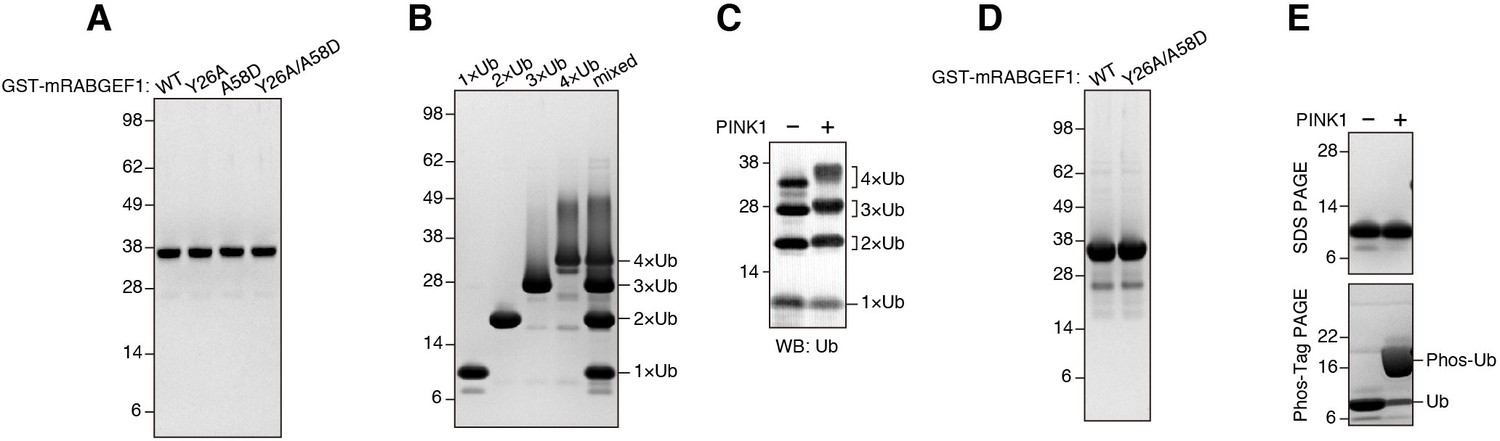
Preparation of recombinant RABGEF1 and ubiquitin.
(A) CBB staining of purified recombinant GST-mRABGEF1. (B) CBB staining of purified recombinant tandem linear ubiquitin (1×, 2×, 3×, and 4×) each and the mixture. (C) Linear ubiquitins were incubated with or without GST-TcPINK1 followed by SDS-PAGE and immunoblotting. (D) CBB staining of purified recombinant GST-mRABGEF1 used for ITC. (E) Ubiquitin and phosphorylated ubiquitin purified from bacterial cells (see the Materials and methods for details) were analyzed by SDS-PAGE or Phos-tag PAGE followed by CBB staining.
Figure 9
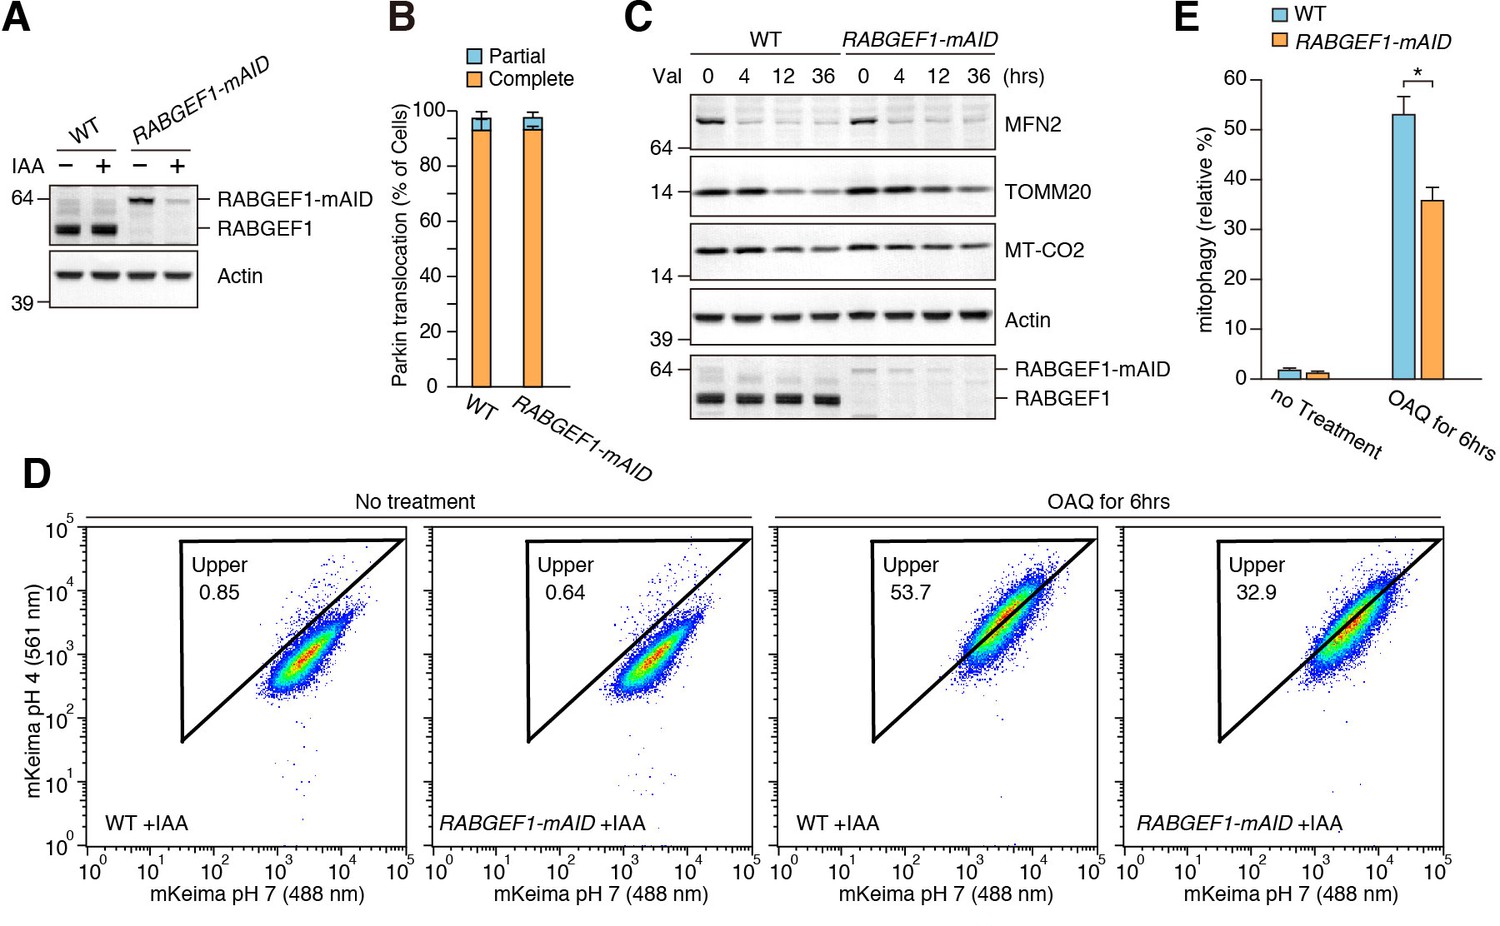
RABGEF1 is important for mitochondrial clearance.
(A) WT and RABGEF1-mAID HCT116 cells were treated with or without IAA for 16 hr. Total cell lysates were analyzed by immunoblotting. (B) Quantification of Parkin recruitment to mitochondria in WT and RABGEF1-mAID HCT116 cells after 3 hr of valinomycin treatment. Partial and complete denote that YFP-Parkin signals were overlapped with some of and all mitochondria, respectively. (C) YFP-Parkin stably expressing WT and RABGEF1-mAID HCT116 cells pre-treated with IAA were treated with valinomycin for the indicated times. Total cell lysates were analyzed by immunoblotting. (D) WT and RABGEF1-mAID HCT116 cells stably expressing YFP-Parkin and mt-mKeima were treated with IAA for 16 hr followed by DMSO or OAQ for 6 hr and subjected to FACS analysis. Plots are representative of n = 3 experiments. (E) Quantification of mitophagy in (D). Error bars represent mean ±SE of three independent experiments. Statistical differences were determined by student’s t-test. *p<0.05.
-
Figure 9—source data 1
Quantification of YFP-Parkin recruitment to mitochondria in RABGEF1-mAID HCT116 and the corresponding WT cells during mitophagy.
- https://doi.org/10.7554/eLife.31326.035
-
Figure 9—source data 2
Quantification of mitophagy using mt-mKeima and FACS analysis.
- https://doi.org/10.7554/eLife.31326.036
Figure 10
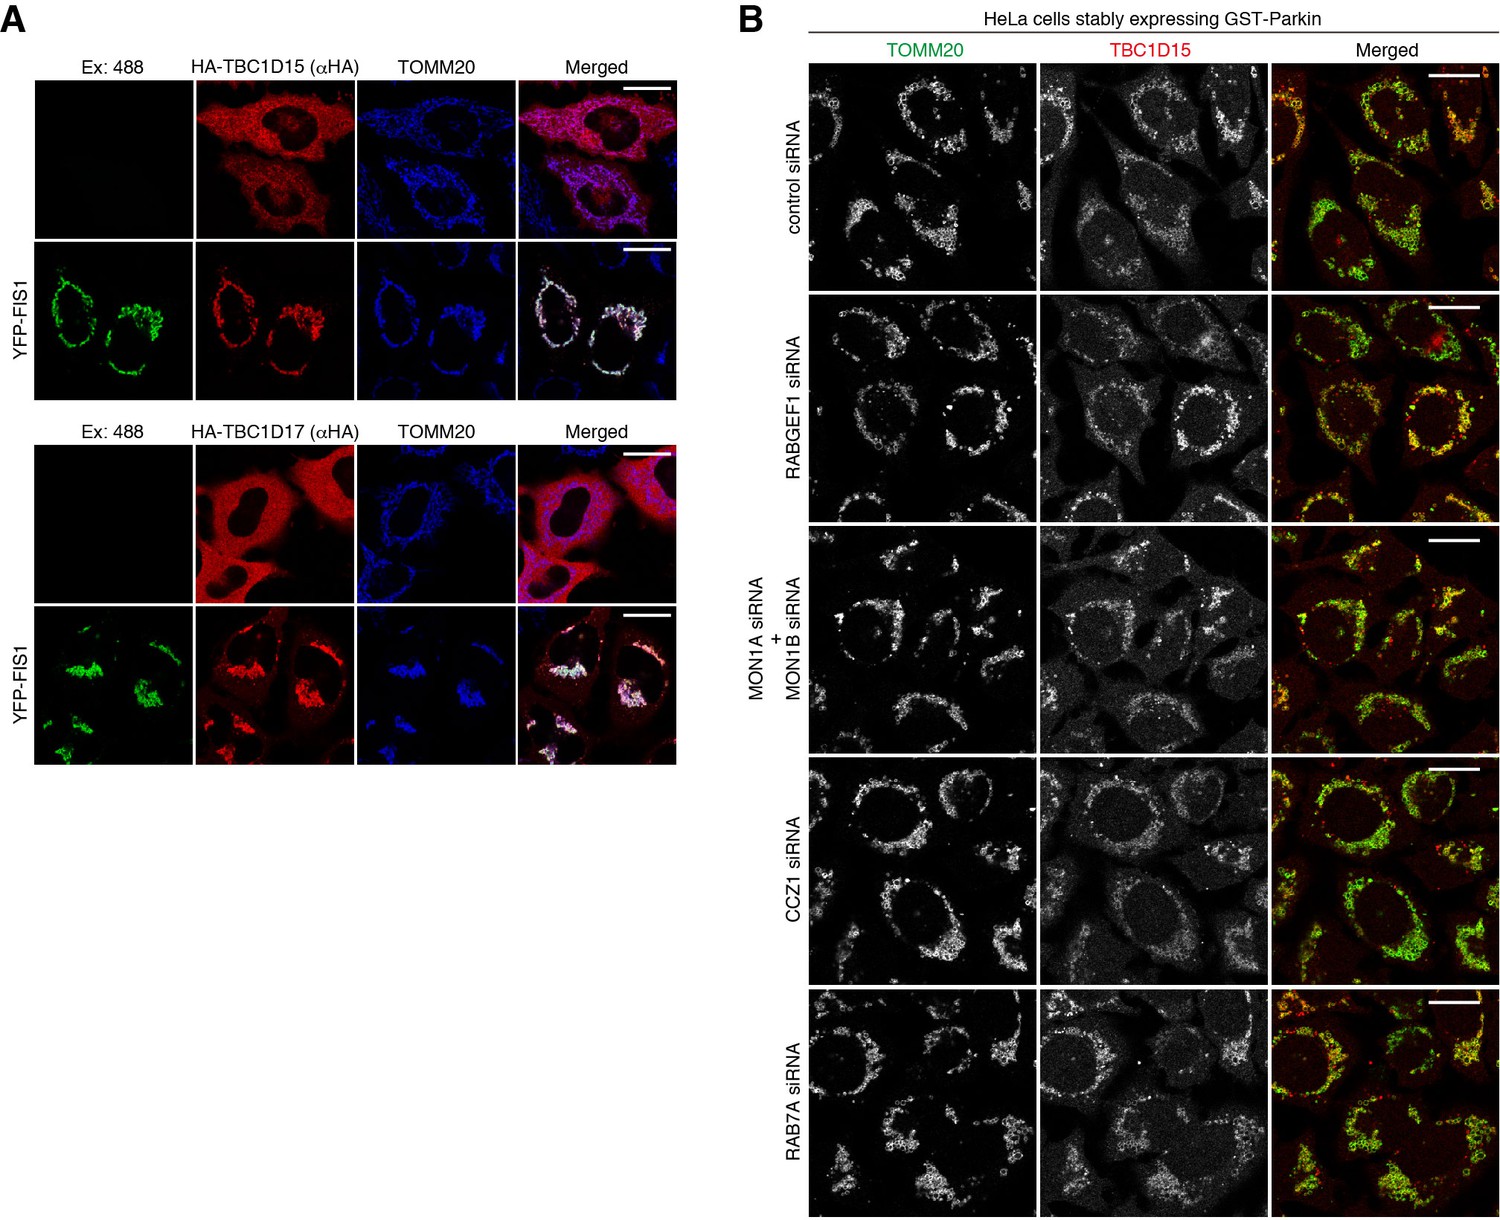
Mitochondrial localization of TBC1D15.
(A) HA-TBC1D15 (upper) and HA-TBC1D17 (lower) with or without YFP-FIS1 were transiently expressed in HeLa cells. The cells were subjected to immunostaining. Bars, 20 μm. (B) HeLa cells stably expressing GST-Parkin were treated with the indicated siRNA. After 3 hr of valinomycin treatment, cells were subjected to immunostaining. Bars, 10 μm.
Figure 11

Proposed model of mitophagy regulated by endosomal Rab cycles.
(1) Through phosphorylation by PINK1, Parkin and ubiquitin ubiquitinate damaged mitochondria. (2) RABGEF is recruited to mitochondria and (3) endosomal Rab cycles including RAB5 and MON1/CCZ1 complex direct RAB7A to the mitochondria. (4) ATG9A vesicles are recruited to the autophagosome formation sites, in a RAB7A-dependent manner, where ATG9A vesicles and LC3-labeled autophagic membranes are assembled. (5) Mitochondrial Rab-GAPs, TBC1D15 and TBC1D17, dissociate RAB7A from the mitochondrial membranes to complete the Rab cycles.
Tables
Key resources table
| Reagent type (species) or resource | Designation | Source or reference | Identifiers | Additional information |
|---|---|---|---|---|
| Cell line (Homo sapiens) | HeLa | ATCC | CVCL_0030 | |
| Cell line (H. sapiens) | HCT116 | ATCC | CVCL_0291 | |
| Cell line (H. sapiens) | FIS1-/- | Otera et al. (2010) | ||
| Cell line (H. sapiens) | TBC1D15/17 DKO | Yamano et al. (2014) | ||
| Cell line (H. sapiens) | HCT116-OsTIR1 | Natsume et al. (2016) | ||
| Cell line (H. sapiens) | RABGEF1-mAID | this paper | mAID sequence were inserted into HCT116-OsTIR1 cell line to produce RABGEF1-mAID. | |
| Cell line (H. sapiens) | HEK293T | ATCC | CVCL_0063 | |
| Antibody | Rabbit anti-GFP (polyclonal) | Abcam | ab6556 AB_305564 | 1:1000 (WB), 1:1000 (IF) |
| Antibody | Mouse anti-MFN2 (monoclonal) | Abcam | ab56889 AB_2142629 | 1:500(WB) |
| Antibody | Rabbit anti-TOMM20 (polyclonal) | Santa Cruz Biotechnology | sc-11415 AB_2207533 | 1:2000 (WB), 1:1000 (IF) |
| Antibody | Rabbit anti-LC3B | Sigma | L7543 AB_796155 | 1:1000 (WB) |
| Antibody | Mouse anti-MT-CO2 (monoclonal) | Abcam | ab110258 AB_10887758 | 1:500 (WB) |
| Antibody | Mouse anti-Actin (monoclonal) | Millipore | MAB1501R AB_2223041 | 1:2000 (WB) |
| Antibody | Mouse anti-RAB7 (monoclonal) | Abcam | ab50533 AB_882241 | 1:1000 (WB) |
| Antibody | Rabbit anti-RABGEF1 (polyclonal) | NOVUS BIOLOGICALS | NBP1-49938 AB_10012128 | 1:500 (WB) |
| Antibody | Mouse anti-CCZ1 (monoclonal) | Santa Cruz Biotechnology | sc-514290 | 1:100 (WB) |
| Antibody | Mouse anti-ubiquitin (monoclonal) | Santa Cruz Biotechnology | sc-8017 AB_628423 | 1:1000 (WB) |
| Antibody | Rabbit anti-S65 phosphorylated ubiquitin | Koyano et al. (2014) | 1:500 (WB) | |
| Antibody | Rabbit anti-GFP (polyclonal) | Invitrogen | A-11122 AB_221569 | 1:1000 (IF) |
| Antibody | Mouse anti-GFP (monoclonal) | Invitrogen | A-11120 AB_221568 | 1:1000 (IF) 1:500 (immuno-EM) |
| Antibody | Mouse anti-TOMM20 (monoclonal) | Santa Cruz Biotechnology | sc-17764 AB_628381 | 1:200 (IF) |
| Antibody | Mouse anti-HA (monoclonal) | MBL Life science | M180-3 AB_10951811 | 1:2000 (IF) |
| Antibody | Mouse anti-HA (monoclonal) | COVANCE | MMS-101R-500 AB_10063630 | 1:500 (IF) |
| Antibody | Mouse anti-LAMP2 (monoclonal) | Santa Cruz Biotechnology | sc-18822 AB_626858 | 1:100 (IF) |
| Antibody | Mouse anti-EEA1 (monoclonal) | BD Biosciences | 610457 AB_397830 | 1:200 (IF) |
| Antibody | Mouse anti-GM130 (monoclonal) | BD Biosciences | 610822 AB_398141 | 1:1000 (IF) |
| Antibody | Mouse anti-pryruvate dehydrogenase E1-alpha subunit (PDHA1) (monoclonal) | Abcam | ab110334 AB_10866116 | 1:500 (IF) |
| Antibody | Mouse anti-DNA (monoclonal) | Millipore | CBL186 AB_11213573 | 1:500 (IF) |
| Antibody | Rabbit anti-RAB5 (monoclonal) | Cell Signaling Technology | 3547 AB_2300649 | 1:200 (IF) |
| Antibody | Rabbit anti-RAB7 (monoclonal) | Cell Signaling Technology | 9367 AB_1904103 | 1:100 (IF) |
| Antibody | Rabbit anti-TBC1D15 (clonal) | A kind gift from N. Ishihara, Kurume University, Japan | 1:50 (IF) | |
| Antibody | Rabbit anti-ATG9A (clonal) | A kind gift from N. Mizushima, University of Tokyo,Japan | 1:100 (IF) | |
| Antibody | Rabbit anti-ATG16L1 | A kind gift from N. Mizushima, University of Tokyo,Japan | 1:200 (IF) | |
| Antibody | Goat anti-Rabbit IgG, Alexa Fluor 488 conjugated | Thermo Fisher Scientific | A-11034 AB_2576217 | 1:500 (IF) |
| Antibody | Goat anti-Rabbit IgG, Alexa Fluor 568 conjugated | Thermo Fisher Scientific | A-11036 AB_10563566 | 1:500 (IF) |
| Antibody | Goat anti-Rabbit IgG, Alexa Fluor 647 conjugated | Thermo Fisher Scientific | A-21245 AB_2535813 | 1:500 (IF) |
| Antibody | Goat anti-Mouse IgG, Alexa Fluor 488 conjugated | Thermo Fisher Scientific | A-11029 AB_138404 | 1:500 (IF) |
| Antibody | Goat anti-Mouse IgG, Alexa Fluor 568 conjugated | Thermo Fisher Scientific | A-11031 AB_144696 | 1:500 (IF) |
| Antibody | Goat anti-Mouse IgG, Alexa Fluor 647 conjugated | Thermo Fisher Scientific | A-21236 AB_2535805 | 1:500 (IF) |
| Antibody | Nanogold-conjugated anti-mouse IgG antibody | Nanoprobes | 2002 AB_2637031 | 1:200 (IF) |
| Antibody | Anti-rabbit IgG horseradish peroxidase-linked secondary antibodies | GE Healthcare | NA934 AB_772206 | 1:5000 (WB) |
| Antibody | Anti-HA beads | Sigma-aldrich | A2095 AB_257974 | |
| Chemical compound, drug | Lpofectamine RNAiMAX | Invitrogen | Invitrogen: 13778–150 | |
| Chemical compound, drug | FuGENE6 | Promega | Promega: E2692 | |
| Chemical compound, drug | FuGENE HD | Promega | Promega: E2311 | |
| Chemical compound, drug | DMEM | Life Technologies | Life Technologies: 31053–028 | |
| Chemical compound, drug | DMEM | Sigma-aldrich | Sigma-aldrich: D5796-500ML | |
| Chemical compound, drug | Sodium pyruvate | Life Technologies | Life Technologies: 11360–070 | |
| Chemical compound, drug | Glutamine | Life Technologies | Life Technologies: 25030–081 | |
| Chemical compound, drug | GlutaMAX | Life Technologies | Life Technologies: 35050–061 | |
| Chemical compound, drug | Nonessential amino acids | Life Technologies | Life Technologies: 11140–050 | |
| Chemical compound, drug | McCoy's 5A | Life Technologies | Life Technologies: 16600–082 | |
| Chemical compound, drug | Polybrene | Sigma-aldrich | Sigma-aldrich: H9268 | |
| Chemical compound, drug | Valinomycin | Sigma-aldrich | Sigma-aldrich: V0627-10MG | |
| Chemical compound, drug | Oligomycin | Calbiochem | Calbiochem: 495455–10 MG | |
| Chemical compound, drug | Antimycin A | Sigma-aldrich | Sigma-aldrich: A8674-25MG | |
| Chemical compound, drug | Q-VD-OPH | SM Biochemicals | SM Biochemicals: SMPH001 | |
| Chemical compound, drug | Q-VD-OPH | Sigma-aldrich | Sigma-aldrich: SML0063-1MG | |
| Chemical compound, drug | Indole-3-acetic acid (IAA) | Wako | Wako: 090–07123 | |
| Chemical compound, drug | G418 | Sigma-aldrich | Sigma-aldrich: G8168 | |
| Chemical compound, drug | Hygromycin B | Invitrogen | Invitrogen: 10687–010 | |
| Chemical compound, drug | DAPI | Thermo Fisher Scientific | Thermo Fisher Scientific: D3571 | |
| Chemical compound, drug | Protease inhibitor cocktail | Roche | Roche: 11 873 580 001 | |
| Chemical compound, drug | Phos-tag | Wako | Wako: 304–93521 | |
| Chemical compound, drug | DTBP (dimethyl 3,3'-dithiobispropionimidate) | Pierce | Pierce: 20665 | |
| Chemical compound, drug | TCEP (Tris(2-carboxylethyl)phosphine) | Sigma-aldrich | Sigma-aldrich: C4706-10G | |
| Chemical compound, drug | GSH (L-glutathione reduced) | Sigma-aldrich | Sigma-aldrich: G4251-25G | |
| Chemical compound, drug | PhosSTOP phosphatase inhibitor cocktail | Roche | Roche: 04 906 845 001 | |
| Chemical assay or kit | BCIP-NBT solution kit | Nacalai Tesque | Nacalai Tesque: 03937–60 | |
| Chemical assay or kit | Western Lightning Plus-ECL | PerkinElmer | PerkinElmer: NEL105001EA | |
| Peptide, recombinant protein | HA peptide | Sigma-aldrich | Sigma-aldrich: I2149 | |
| Peptide, recombinant protein | Ubiquitin from bovine erythrocytes | Sigma-aldrich | Sigma-aldrich: U6253 | |
| Peptide, recombinant protein | 1x ubiquitin | this paper | 1x human ubiquitin (C-terminal His-tagged) | |
| Peptide, recombinant protein | 2x ubiquitin | this paper | 2x tandem linear human ubiquitin (C-terminal His-tagged) | |
| Peptide, recombinant protein | 3x ubiquitin | this paper | 3x tandem linear human ubiquitin (C-terminal His-tagged) | |
| Peptide, recombinant protein | 4x ubiquitin | this paper | 4x tandem linear human ubiquitin (C-terminal His-tagged) | |
| Peptide, recombinant protein | GST-mRABGEF1 (WT) | this paper | GST-tagged mouse RABGEF1 (WT) 1-74aa | |
| Peptide, recombinant protein | GST-mRABGEF1 (Y26A) | this paper | GST-tagged mouse RABGEF1 (Y26A) 1-74aa | |
| Peptide, recombinant protein | GST-mRABGEF1 (A58D) | this paper | GST-tagged mouse RABGEF1 (A58D) 1-74aa | |
| Peptide, recombinant protein | GST-mRABGEF1 (Y26A/A58D) | this paper | GST-tagged mouse RABGEF1 (Y26A/A58D) 1-74aa | |
| Peptide, recombinant protein | GST-TcPINK1 | Yamano et al. (2015) | ||
| Other | Ni-NTA agarose | QIAGEN | QIAGEN: 30230 | |
| Other | PD MidiTrap G-25 | GE Healthcare | GE Healthcare: 28-9180-08 | |
| Other | Glutathione-Sepharose 4B | GE Healthcare | GE Healthcare: 17-0756-01 | |
| Other | Superdex 75 10/300 column | GE Healthcare | GE Healthcare: 17-5174-01 | |
| Other | Amicon Ultra centrifugal filters | Millipore | Millipore: UFC800308 for 3K Millipore: UFC800308 for 10K | |
| Software, algorithm | Photoshop | Adobe | SCR_014199 | |
| Software, algorithm | Volocity | PerkinElmer | SCR_002668 | |
| Software, algorithm | ZEN microscope software | Carl Zeiss | SCR_013672 | |
| Software, algorithm | GraphPad Prism v6.0d | GraphPad Software | SCR_002798 |
Additional files
-
Supplementary file 1
Proteomic analysis of 2HA-RAB7A (T22N)-associated proteins during mitophagy.
This files contains all raw and analyzed mass spectrometric data and analysis parameters. Proteomic analysis of 2HA-RAB7A (T22N)-associated proteins in TBC1D15/17 DKO HCT116 cells stably expressing mCherry-Parkin after 3 hr of valinomycin treatment using CompPASS. The tab labeled 'Analysis' contains information regarding cell lines used, experimental conditions, descriptions of all worksheets including raw data that contain the complete lists of all proteins identified, WDN-scores, Z-scores, and APSMs, and details of each subsequent analysis performed.
- https://doi.org/10.7554/eLife.31326.039
-
Transparent reporting form
- https://doi.org/10.7554/eLife.31326.040
Download links
A two-part list of links to download the article, or parts of the article, in various formats.
Downloads (link to download the article as PDF)
Open citations (links to open the citations from this article in various online reference manager services)
Cite this article (links to download the citations from this article in formats compatible with various reference manager tools)
Endosomal Rab cycles regulate Parkin-mediated mitophagy
eLife 7:e31326.
https://doi.org/10.7554/eLife.31326


