Uncharacterized yeast gene YBR238C, an effector of TORC1 signaling in a mitochondrial feedback loop, accelerates cellular aging via HAP4- and RMD9-dependent mechanisms
- Bioinformatics Institute (BII), Agency for Science, Technology and Research (A*STAR), Singapore
- Genome Institute of Singapore (GIS), Agency for Science, Technology and Research (A*STAR), Singapore
- LASA – Lausitz Advanced Scientific Applications gGmbH, Germany
- School of Biological Sciences (SBS), Nanyang Technological University (NTU), Singapore
Abstract
Uncovering the regulators of cellular aging will unravel the complexity of aging biology and identify potential therapeutic interventions to delay the onset and progress of chronic, aging-related diseases. In this work, we systematically compared genesets involved in regulating the lifespan of Saccharomyces cerevisiae (a powerful model organism to study the cellular aging of humans) and those with expression changes under rapamycin treatment. Among the functionally uncharacterized genes in the overlap set, YBR238C stood out as the only one downregulated by rapamycin and with an increased chronological and replicative lifespan upon deletion. We show that YBR238C and its paralog RMD9 oppositely affect mitochondria and aging. YBR238C deletion increases the cellular lifespan by enhancing mitochondrial function. Its overexpression accelerates cellular aging via mitochondrial dysfunction. We find that the phenotypic effect of YBR238C is largely explained by HAP4- and RMD9-dependent mechanisms. Furthermore, we find that genetic- or chemical-based induction of mitochondrial dysfunction increases TORC1 (Target of Rapamycin Complex 1) activity that, subsequently, accelerates cellular aging. Notably, TORC1 inhibition by rapamycin (or deletion of YBR238C) improves the shortened lifespan under these mitochondrial dysfunction conditions in yeast and human cells. The growth of mutant cells (a proxy of TORC1 activity) with enhanced mitochondrial function is sensitive to rapamycin whereas the growth of defective mitochondrial mutants is largely resistant to rapamycin compared to wild type. Our findings demonstrate a feedback loop between TORC1 and mitochondria (the TORC1–MItochondria–TORC1 (TOMITO) signaling process) that regulates cellular aging processes. Hereby, YBR238C is an effector of TORC1 modulating mitochondrial function.
eLife assessment
This valuable study identifies an uncharacterized yeast gene regulating chronological lifespan in a mitochondrial-dependent pathway. The approach to identify and characterise this new gene is appealing, but the evidence in support of some of the major conclusions is incomplete. The paper focuses on chronological lifespan and mitochondrial function, and it will be of interest to yeast biologists working in metabolism and aging.
https://doi.org/10.7554/eLife.92178.3.sa0Introduction
Healthy aging is crucially determined by cellular functions, and their defective status is associated with premature dysfunction and/or depletion of critical cell populations and various aging-associated pathologies such as neurodegenerative diseases, cancer, cardiovascular disorders, diabetes, sarcopenia, and maculopathy (Kennedy et al., 2014; Franceschi et al., 2018; Tchkonia and Kirkland, 2018; Gladyshev, 2016; Richardson, 2021). Advancements in biomedical research including genome-wide screening in different aging model organisms, identified several biological pathways that support the unprecedented progress in understanding overlapping profiles between aged cells and different chronic aging-associated diseases (Cohen et al., 2022; McCormick et al., 2015; Powers et al., 2006; Hamilton et al., 2005). In principle, uncovering the molecular mechanisms that drive cellular aging identifies potential drug targets and can fuel the development of therapeutics to delay aging and increase healthspan (López-Otín et al., 2013; López-Otín et al., 2023; Partridge et al., 2020; Singh et al., 2019).
Given the evolutionary conservation of many aging-related pathways, yeast is one of the aging model organisms that have been extensively used to study the biology of human cellular aging by analyzing chronological lifespan (CLS) and replicative lifespan (RLS) under various conditions (Longo and Fabrizio, 2015; Longo et al., 2012; Fontana et al., 2010; Zimmermann et al., 2018a). The CLS is the duration of time that a non-dividing cell is viable. This is a cellular aging model for post-mitotic human cells such as neurons and muscle cells. The RLS defines as the number of times a mother cell divides to form daughter cells. Such experiments provide a replicative human aging model for mitotic cells such as stem cells. Genome-wide or individual gene deletion strains’ screening identified thousands of genes affecting cellular lifespan. These lists are a rich resource to identify unique genetic regulators, functional networks, and interactions of aging hallmarks relevant to cellular lifespan (Kennedy et al., 2014; Gladyshev, 2016; Cohen et al., 2022; López-Otín et al., 2013; López-Otín et al., 2023; Partridge et al., 2020; Singh et al., 2019). At the same, these lists are rich in genes of unknown function, a class of genes that, unfortunately, got increasingly ignored by the attention of research teams (Eisenhaber, 2012; Sinha et al., 2018; Tantoso et al., 2023).
We systematically examined the available genetic data on aging and lifespan for budding yeast, Saccharomyces cerevisiae, from various sources. Our bioinformatics analyses revealed consensus lists of genes regulating yeast CLS and RLS. These gene sets were compared with lists of genes the expression of which changed under Target of Rapamycin Complex 1 (TORC1) inhibition with rapamycin. When we turned our attention to the functionally uncharacterized genes involved, we found YBR238C the only one among the latter that increases both CLS and RLS upon deletion and that is downregulated by rapamycin. Transcriptomics and biochemical experiments revealed that YBR238C negatively regulates mitochondrial function, largely via HAP4- and RMD9-dependent mechanisms, and thereby affects cellular lifespan. Surprisingly, YBR238C and its paralog RMD9 oppositely influence mitochondrial function and cellular aging.
Our chemical genetics and metabolic analyses unravel a feedback loop of the interaction of TORC1 with mitochondria that affect cellular aging. YBR238C is an effector of TORC1 that modulates mitochondrial function. We also show that mitochondrial dysfunction induces TORC1 activity enhancing cellular aging. In turn, TORC1 inhibition in yeast and human cells with mitochondrial dysfunction enhances their cellular survival.
Results
Genome-wide survey of genes affecting cellular lifespan in yeast in accordance with literature and public databases
Lists of scientific literature instances mentioning a yeast gene as affecting lifespan were downloaded from the databases SGD (Saccharomyces cerevisiae genome database) (Engel et al., 2022) and GenAge (Townes et al., 2020). In most cases, the experiments referred to are gene deletion phenotype studies. After processing the files for the mentioning of ‘increase/decrease’ of ‘chronological lifespan’ (CLS) and/or ‘replicative lifespan’ (RLS) as well as the suppression of gene duplicates, we found 2399 entries with distinct yeast genes in 15 categories reported to increase/decrease CLS and/or RLS under various conditions (Table 1). We collectively call them aging-associated genes (AAGs). Notably, about one-third of the total yeast genome belongs to that category. Downloaded files (as of November 8, 2022), description of the processing details, and all the resulting gene lists are available in Figure 1—source data 1.
Table 1
Numbers of known aging-associated genes (AAGs) reported in the scientific literature to affect (increase/decrease chronological lifespan [CLS]/replicative lifespan [RLS]) under a variety of conditions.
The gene lists were extracted, after processing, from downloaded files (as of November 8, 2022) using the databases SGD (Engel et al., 2022) and GenAge (Townes et al., 2020). The actual gene lists are available in Figure 1—source data 1. The signs ‘+’ and ‘−’ indicate that the respective annotation property is present or missing in that group of genes. We present the total number of genes in each category as the number of, as a trend, severely understudied/uncharacterized genes among those. The columns ‘RUG’ and ‘RDG’ show the numbers of rapamycin-up- and -downregulated genes in each of the 15 categories.
| Category | CLS increase | CLS decrease | RLS increase | RLS decrease | Number of genes | Understudied genes | RUG | RDG |
|---|---|---|---|---|---|---|---|---|
| 1 | + | − | − | − | 328 | 20 | 68 | 62 |
| 2 | − | + | − | − | 615 | 22 | 108 | 73 |
| 3 | − | − | + | − | 349 | 19 | 73 | 64 |
| 4 | − | − | − | + | 318 | 15 | 43 | 56 |
| 5 | + | + | − | − | 108 | 0 | 17 | 18 |
| 6 | + | − | + | − | 72 | 2 | 12 | 26 |
| 7 | + | − | − | + | 72 | 3 | 9 | 18 |
| 8 | − | + | + | − | 120 | 3 | 14 | 28 |
| 9 | − | + | − | + | 180 | 0 | 24 | 34 |
| 10 | − | − | + | + | 59 | 0 | 8 | 14 |
| 11 | + | + | + | − | 29 | 1 | 7 | 7 |
| 12 | + | + | − | + | 45 | 1 | 7 | 9 |
| 13 | + | − | + | + | 30 | 1 | 2 | 11 |
| 14 | − | + | + | + | 55 | 1 | 5 | 11 |
| 15 | + | + | + | + | 19 | 0 | 0 | 2 |
Whereas most of the genes (1610, 67%) have been mentioned for just one of the four scenarios (‘CLS increase’, ‘CLS decrease’, ‘RLS increase’, and ‘RLS decrease’), the remaining genes have been described for several alternative and/or even opposite/conflicting outcomes. Nineteen genes are brought up in context with all four scenarios. As the experimental conditions varied among the reports and the gene networks are complex, this is not necessarily a contradiction. Yet (see below) some of the cases are actually annotation errors at the database level.
We explored the potential enrichment of gene ontology (GO) terms among the genes involved in the 15 categories with the help of DAVID WWW server (Sherman et al., 2022). The most significant result is the enrichment of ontology terms related to mitochondrial function among the genes annotated with the single qualifier ‘CLS decrease’. The top mitochondrial term cluster has an enrichment score 18.2 (gene-wise p values and Benjamini–Hochberg values all below 6.e−13); a second one related to mitochondrial translation has the score 4.7. Enrichment of mitochondrial ontology terms has also been observed for ‘CLS decrease’ in combination with ‘CLS increase’ or ‘RLS increase/decrease’.
Every other signal from the ontology is much weaker. Term enrichment (with scores near 2 or better) related to autophagy and vesicular transport pop up for CLS-annotated genes whereas terms connected with translation, DNA repairs, telomeres, protein degradation, and signaling are observed with RLS-tagged gene lists.
We also explored the presence of uncharacterized or severely under-characterized genes in the 15 categories of AAGs (Table 1). In total, 944 genes are annotated in SGD as coding for a protein of unknown function. Additionally, we considered genes without dedicated gene name (only with six-letter locus tag) as dramatically under-characterized. Comparison of this combined list with those in the 15 categories reveals 88 severely understudied AAGs that are candidates for enhanced attention from the scientific community. Thus, functionally insufficiently characterized genes have a great role in cellular aging-related processes.
Rapamycin response genes overlap with the AAGs
Nutrient sensing dysregulation is one of the aging hallmarks (López-Otín et al., 2013; López-Otín et al., 2023). The conserved protein complex TORC1 senses nutrients such as amino acids and glucose and links metabolism with cellular growth and proliferation (Loewith and Hall, 2011; Saxton and Sabatini, 2017; Liu and Sabatini, 2020; González and Hall, 2017). TORC1 positively regulates aging, and its inhibition increases lifespan in various eukaryotic organisms including yeast and mammals (Partridge et al., 2020; Saxton and Sabatini, 2017; Liu and Sabatini, 2020; Bitto et al., 2016; Johnson et al., 2013a). The drug rapamycin, initially discovered as an antifungal natural product produced by Streptomyces hygroscopicus, inhibits TORC1 and increases lifespan (Figure 1—figure supplement 1A, B; Vézina et al., 1975; Selvarani et al., 2021).
To explore the connection between nutrient signaling and cellular aging we mapped the TORC1-regulated genes with AAGs. We first identified rapamycin response genes (RRGs) by transcriptomics analysis (RNA sequencing [RNA-Seq] for yeast S. cerevisiae BY4743 cells treated with rapamycin and dimethyl sulfoxide [DMSO] control; Figure 1—figure supplement 1C). Relevant measurement results, lists of 2365 RRGs and supplementary methodical comments are available in Figure 1—source data 2.
As overlap of two RNA-Seq data analysis methods (see Methods), we identified 1155 rapamycin upregulate genes (RUG) and 1210 rapamycin downregulated genes (RDG) (Figure 1—figure supplement 1D-F; Figure 1—source data 2). RNA-Seq results were confirmed for some genes by quantitative reverse transcription-polymerase chain reaction (qRT-PCR; Figure 1—figure supplement 2A). We also checked the differential gene expressions in prototrophic yeast S. cerevisiae strain CEN.PK and found similar results as with the BY4743 strain (Figure 1—figure supplement 2B). To note, our transcriptomics analyses are, as a trend, consistent with previous RNA-Seq studies carried out under partially different experimental conditions (Gowans et al., 2018; Alfatah et al., 2021).
We mapped the RRGs (RUG and RDG) with AAGs. Among the 2399 AAGs names, 397 and 433 (in total 830) re-occur in the lists of RUG and RDG, respectively. Thus, the overlap with AAGs is nearly 35%. That is, TORC1 controls about one-third of the AAGs. Table 1 shows how many AAGs are up- and downregulated by rapamycin treatment for each of the 15 categories with regard to CLS/RLS increase/decrease. Notably, the order of magnitude for the respective numbers of RUG and RDG is the same for all 15 studied subgroups.
Since rapamycin increases the lifespan by an inhibitory effect on TORC1 activity, it appears most interesting to focus on AAGs with a deletion phenotype of increased CLS/RLS and being downregulated by rapamycin application. A manual analysis of these gene lists reveals that, among the uncharacterized or severely understudied AAGs, there is a single one known to increase both CLS and RLS upon deletion and being downregulated by rapamycin treatment. This gene is YBR238C.
Uncharacterized genes mapping unravels the role of YBR238C in cellular aging
Not much is known about YBR238C besides its effect on lifespan (to increase CLS and RLS), its mitochondrial localization (Huh et al., 2003), its transcriptional upregulation by TORC1 and the existence of the paralog RMD9. The encoded protein has 731 amino acid residues. Sequence architecture analysis with the ANNOTATOR (Eisenhaber et al., 2016) reveals an intrinsically unstructured region over the first ca. 130 residues (first, a long polar but uncharged run followed by a histidine/asparagine-rich region beginning with position 83) and a pentatricopeptide repeat region (residues 130–675, e.g., due to a HHpred Zimmermann et al., 2018b hit to structure 7A9X chain A with E-value 2.e−56). Given the sequence homology, we hypothesize that the protein encoded by YBR238C is involved in RNA binding as its paralog RMD9 with a similar globular segment (Hillen et al., 2021).
To note, YBR238C carries the conflicting annotations in SGD for increased and decreased RLS upon deletion. Unfortunately, there is not a single direct report about YBR238C listed in the scientific literature at the time of writing. There are a few genome-wide deletion strain studies that identified YBR238C as one of the gene that increases CLS (Burtner et al., 2011) and RLS (McCormick et al., 2015; Delaney et al., 2011; Kaeberlein et al., 2005; Schleit et al., 2013). However, the SGD database wrongly documented one of the latter studies as evidence for a decreased RLS phenotype of YBR238C (Schleit et al., 2013). Thus, this examination allows us to claim YBR238C as the only uncharacterized RDG causing CLS and RLS increase upon deletion.
First, we confirmed that YBR238C is indeed an RRG by qRT-PCR expression analysis in both yeast backgrounds BY4743 and CEN.PK (Figure 1A, B). Given that only a single genome-wide deletion strain study identified YBR238C as a gene that enhances CLS (Burtner et al., 2011), we further tested the role of YBR238C in CLS of yeast. CLS was analyzed in BY4743 and CEN.PK strains using three different outgrowth survival methods (see detail in methods section). Cell survival of wild type and ybr238c∆ strains was analyzed at various age time points. We found higher CLS of ybr238c∆ cells compared to wild-type cells (Figure 1C–F). Together, these results confirmed that rapamycin inhibits the expression of YBR238C, and deletion of this gene indeed increases the cellular lifespan.
Figure 1 with 2 supplements see all

YBR238C deletion increases the cellular lifespan.
(A and B) Expression analysis of YBR238C gene by quantitative reverse transcription-polymerase chain reaction (qRT-PCR) in yeast Saccharomyces cerevisiae genetic backgrounds BY4743 (A) and CEN.PK113-7D (B). qRT-PCR was performed using RNA extracted from logarithmic-phase cultures grown in synthetic defined medium supplemented with auxotrophic amino acids for BY4743 (A) and only the synthetic defined medium for CEN.PK113-7D (B). Data are represented as means ± standard deviation (SD) (n = 4). ****p < 0.0001 based on two-sided Student’s t-test. (C and D) Chronological lifespan (CLS) of the wild type and ybr238c∆ mutant was assessed in synthetic defined medium supplemented with auxotrophic amino acids for BY4743 (C) and only the synthetic defined medium for CEN.PK113-7D (D) strains in 96-well plate. Aged cells survival was measured relative to the outgrowth of day 2. Data are represented as means ± SD (n = 3) (C) and (n = 4) (D). **p < 0.01, ***p < 0.001, and ****p < 0.0001 based on two-way analysis of variance (ANOVA) followed by Šídák’s multiple comparisons test. (E, F) CLS of the wild type and ybr238c∆ mutant was performed in synthetic defined medium supplemented with auxotrophic amino acids for BY4743 and only the synthetic defined medium for CEN.PK113-7D strains using flasks. Outgrowth was performed for 10-fold serial diluted aged cells onto the YPD agar plate (E) and YPD medium in the 96-well plate (F). The serial outgrowth of aged cells on agar medium was imaged (E) and quantified the survival relative to outgrowth of day 2 (F). A representative of two experiments for (E) and (F) is shown.
-
Figure 1—source data 1
Genome-wide survey of aging-associated genes (AAGs) in Saccharomyces cerevisiae.
- https://cdn.elifesciences.org/articles/92178/elife-92178-fig1-data1-v1.zip
-
Figure 1—source data 2
Rapamycin response genes and aging-associated genes mapping.
- https://cdn.elifesciences.org/articles/92178/elife-92178-fig1-data2-v1.zip
Transcriptomics analysis reveals the longevity gene expression signatures of ybr238c∆mutants
The transcriptome of the long-lived ybr238c∆ mutant was compared with that of the wild type (Figure 2—figure supplement 1A). Applying standard significance criteria, we found 326 genes up- and 61 genes downregulated in theybr238c∆ mutant compared to wild type (Figure 2—figure supplement 1B, Figure 2—source data 1). Thus, the transcriptome of the ybr238c∆ mutant is very distinct from that of the wild type.
Notably, we see several major metabolic changes. For the ybr238c∆ mutant, genes in mitochondrial metabolic processes such as oxidative phosphorylation and aerobic respiration show predominant enrichment (Figure 2A, B,Figure 2—source data 1). Since YBR238C expression is regulated by TORC1 (Figure 1A, B), it is not surprising that we observe similarities in the profiles of upregulated differentially expressed genes (DEGs) for the ybr238c∆ mutant and for the case of treating the wild type with rapamycin (Figure 2—figure supplement 1C, D).
Figure 2 with 2 supplements see all
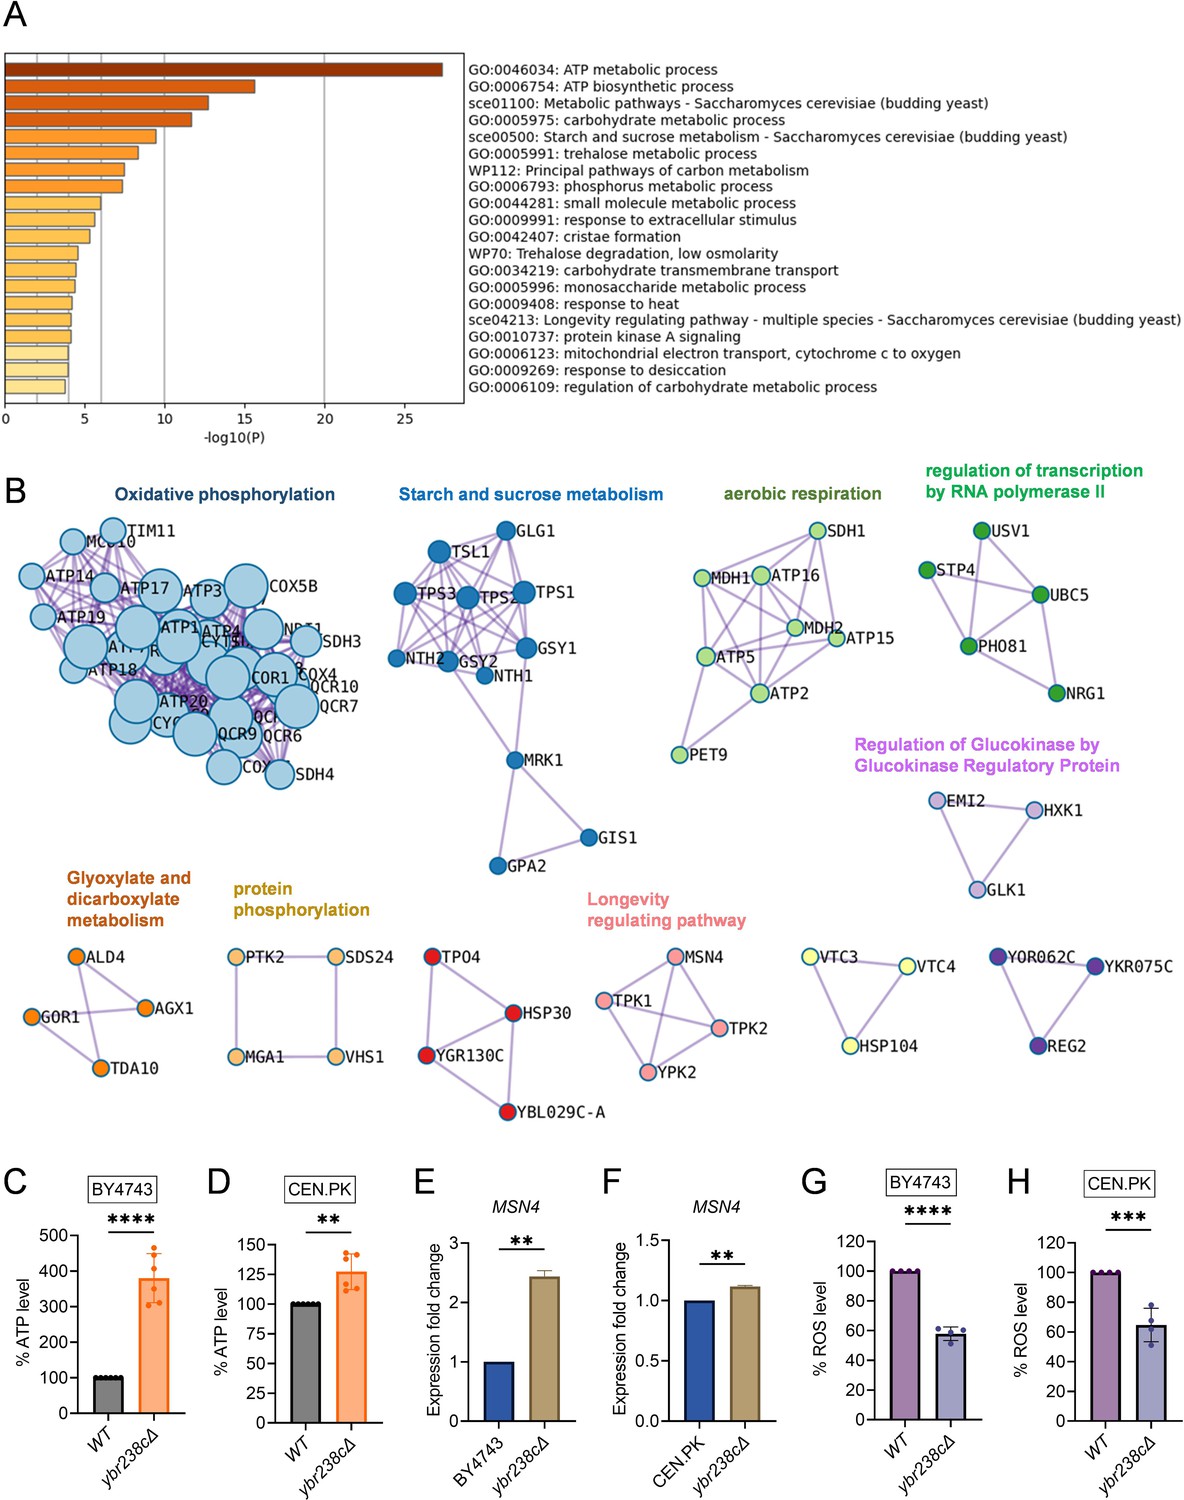
Longevity signatures of ybr238c∆ mutant.
(A, B) Functional enrichment analysis of upregulated genes in yeast Saccharomyces cerevisiae ybr238c∆ mutant compared to wild type (BY4743). Bar plots showing the enriched biological process (A) and identified MCODE complexes based on the top 3 ontology enriched terms (B). Full set of genes for functional enrichment analysis (A) and the MCODE complexes (B) are available in Figure 2—source data 1. (C and D) Adenosine triphosphate (ATP) analysis of wild type and ybr238c∆ mutant for BY4743 (C) and CEN.PK113-7D (D). Quantification was performed using ATP extracted from 72-hr stationary cultures grown in synthetic defined medium supplemented with auxotrophic amino acids for BY4743 and only the synthetic defined medium for CEN.PK113-7D strains. Data are represented as means ± standard deviation (SD) (n = 6). **p < 0.01 and ****p < 0.0001 based on two-sided Student’s t-test. (E and F) Expression analysis of MSN4 gene by quantitative reverse transcription-polymerase chain reaction (qRT-PCR) in yeast Saccharomyces cerevisiae genetic backgrounds BY4743 (E) and CEN.PK113-7D (F). qRT-PCR was performed using RNA extracted from logarithmic-phase cultures grown in synthetic defined medium supplemented with auxotrophic amino acids for BY4743 and only the synthetic defined medium for CEN.PK113-7D strains. Data are represented as means ± SD (n = 2). **p < 0.01 based on two-sided Student’s t-test. (G and H) Reactive oxygen species (ROS) analysis of wild type and ybr238c∆ mutant for BY4743 (G) and CEN.PK113-7D (H). Quantification was performed for logarithmic-phase cultures grown in synthetic defined medium supplemented with auxotrophic amino acids for BY4743 and only the synthetic defined medium for CEN.PK113-7D strains. Data are represented as means ± SD (n = 4). ***p < 0.001 and ****p < 0.0001 based on two-sided Student’s t-test.
-
Figure 2—source data 1
Transcriptomics and transcription factor analysis of ybr238c∆ cells.
- https://cdn.elifesciences.org/articles/92178/elife-92178-fig2-data1-v1.zip
Next, we experimentally tested whether the transcriptome longevity signatures are associated with enhanced mitochondrial metabolism, whether the cellular energy level has gone up and cellular stress responses are induced with a switch to oxidative metabolism (Petti et al., 2011; Galluzzi et al., 2012). Indeed, our metabolic analysis revealed an increased ATP level in ybr238c∆ mutants compared to wild-type cells (Figure 2C, D, Figure 2—figure supplement 1E). ATP generation through the oxidative phosphorylation (OXPHOS) system is regulated by mitochondrial DNA (mtDNA) (Shadel, 1999). We observed a higher mtDNA copy number in the ybr238c∆ mutant compared to wild-type cells (Figure 2—figure supplement 1F). Hence, the ybr238c∆ mutation rewires the cellular metabolism to promote resource-saving ways of energy production as the upregulated expression of OXPHOS machinery subunits truly boosts ATP synthesis in ybr238c∆ mutant cells.
The enhanced mitochondrial function in ybr238c∆ mutants does also improve the protection against reactive oxygen species (ROS). Among the 150 transcription factors (TFs) that control the upregulated DEG of the ybr238c∆ mutant (Figure 2—source data 1), 13 TFs are significantly overrepresented within the upregulated DEGs (Figure 2—source data 1). Importantly, we found that the stress response controlling TF MSN4 is upregulated in ybr238c∆ mutants (Figure 2E, F, Figure 2—figure supplement 2A, B; Longo et al., 2012; Lin et al., 2002). Concomitantly, we found less ROS level in ybr238c∆ mutant compared to wild-type cells (Figure 2G, H, Figure 2—figure supplement 1G, H) and is resistant to H2O2-induced oxidative stress toxicity (Figure 2—figure supplement 1I).
Notably, the TF-regulated activation of stress response pathways (thioredoxins, molecular chaperones, etc.) (Turcotte et al., 2010; Schüller, 2003) and the switch from fermentation to respiration are associated with delayed cellular aging (Petti et al., 2011; Galluzzi et al., 2012; Jensen and Jasper, 2014; Martínez-Reyes and Chandel, 2020). Our results show that the ybr238c∆ mutation triggers oxidative metabolism and stress protective machineries activation and, as a result increases CLS. Collectively, our findings reveal that YBR238C is a TORC1-regulated gene involved in mitochondrial function coupled with cellular aging. Therefore, we refer to YBR238C as AAG1: Aging-Associated Gene 1.
YBR238C negatively regulates mitochondrial function via HAP4-dependent and -independent mechanisms
HAP4 is a TF that controls the expression of mitochondrial electron transport chain components including OXPHOS genes (Lin et al., 2002). HAP4 activity has been shown to increase lifespan by enhancing the mitochondrial respiration in cells (Lin et al., 2002). Intriguingly, HAP4 is among the 13 TFs overrepresented among the upregulated DEGs in ybr238c∆ mutant and control mitochondrial genes (Figure 3A, Figure 2—source data 1). We validated the upregulation of HAP4 gene expression in the ybr238c∆ mutant under both yeast backgrounds BY4743 and CEN.PK (Figure 3B, C ). Consistent with these findings, transcription profile of mitochondrial genes in the ybr238c∆ mutant is opposite to that of the hap4∆ mutant (Figure 3D). For example, ETC complexes I–V genes’ expression is increased in ybr238c∆, however, it is decreased by HAP4 deletion (Figure 3D).
Figure 3
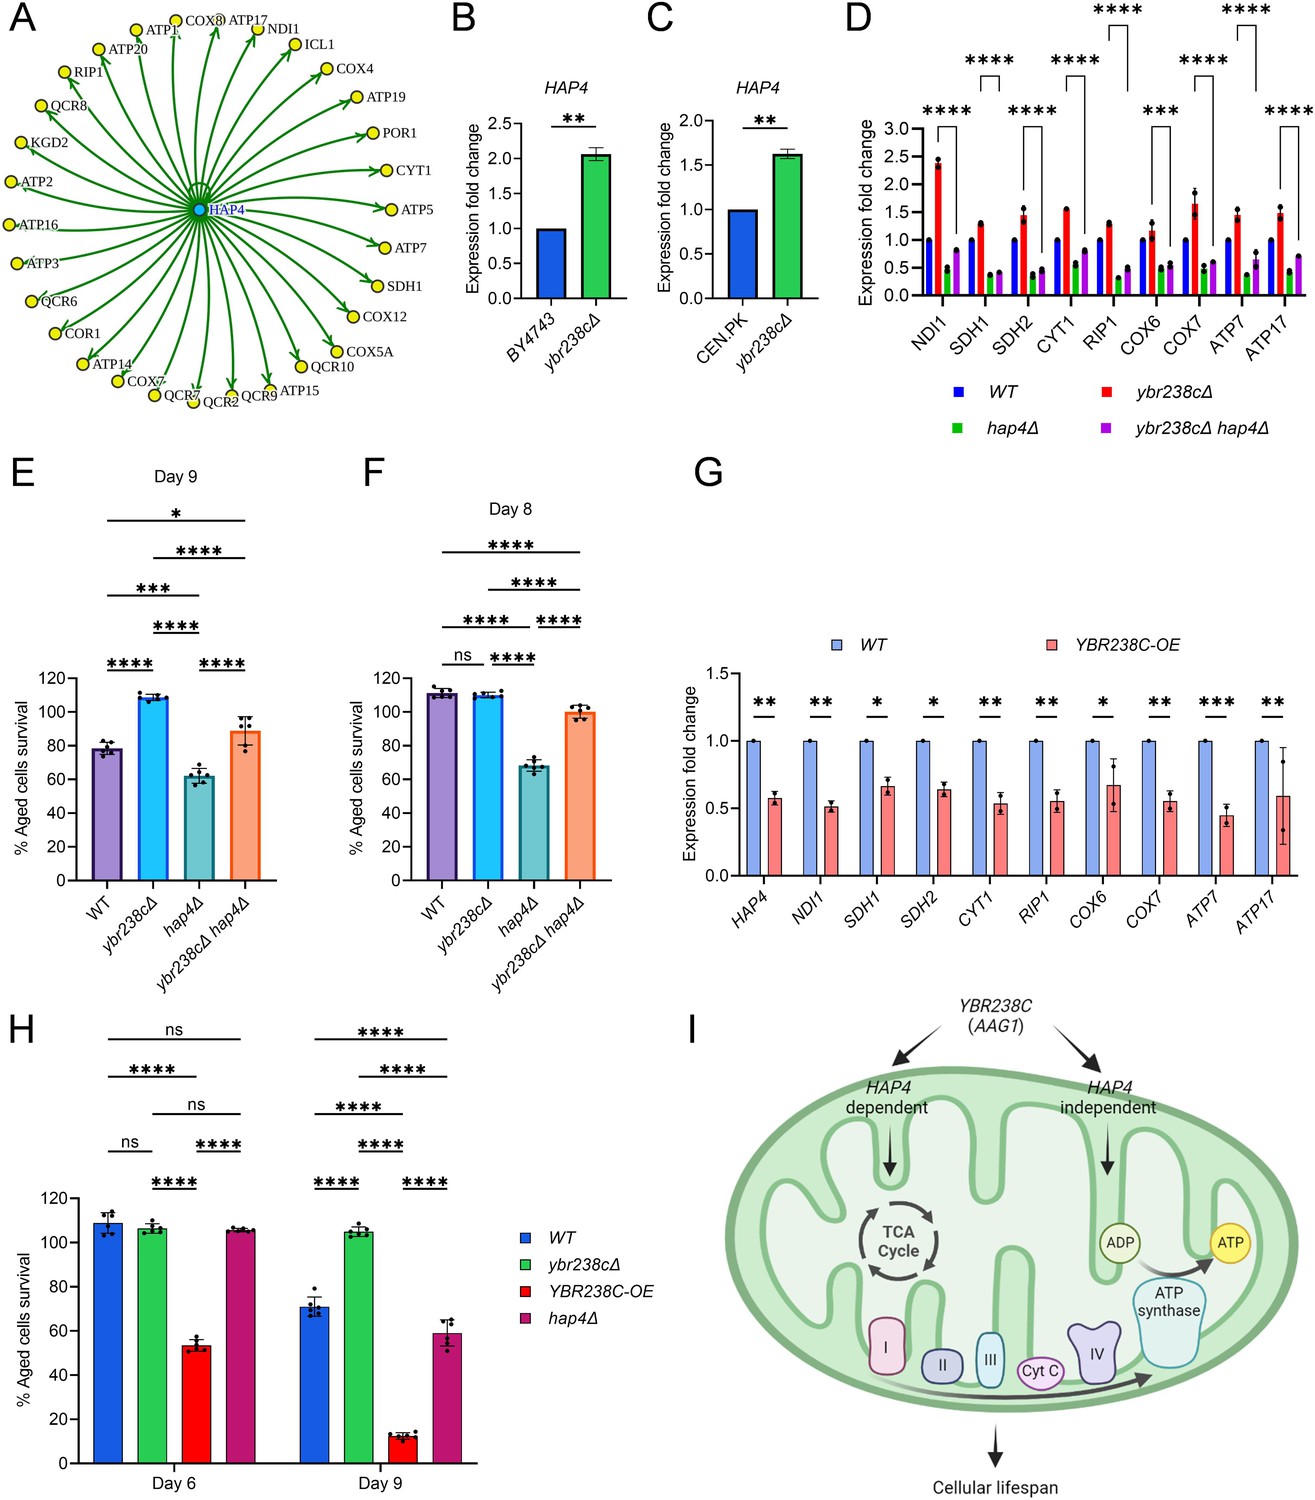
YBR238C affects cellular aging via HAP4-dependent and -independent mechanisms.
(A) The HAP4 regulon within the upregulated differentially expressed genes (DEGs) of ybr238c∆ mutant. See also Figure 2—source data 1. Expression analysis of HAP4 gene by quantitative reverse transcription-polymerase chain reaction (qRT-PCR) in yeast Saccharomyces cerevisiae genetic backgrounds BY4743 (B) and CEN.PK113-7D (C). qRT-PCR was performed using RNA extracted from logarithmic-phase cultures grown in synthetic defined medium supplemented with auxotrophic amino acids for BY4743 and only the synthetic defined medium for CEN.PK113-7D strains. Data are represented as means ± standard deviation (SD) (n = 2). **p < 0.01 based on two-sided Student’s t-test. (D) Expression analysis of mitochondrial ETC genes by qRT-PCR in wild type, ybr238c∆, hap4∆, and ybr238c∆ hap4∆, strains of yeast S. cerevisiae genetic background CEN.PK113-7D. qRT-PCR was performed using RNA extracted from logarithmic-phase cultures grown in synthetic defined medium. Data are represented as means ± SD (n = 2). Comparing data between ybr238c∆ and ybr238c∆ hap4∆. ***p < 0.001 and ****p < 0.0001 based on two-way analysis of variance (ANOVA) followed by Šídák’s multiple comparisons test. (E, F, H) Chronological lifespan (CLS) of yeast S. cerevisiae genetic background CEN.PK113-7D strains was performed in synthetic defined medium using 96-well plate. Aged cells survival was measured relative to the outgrowth of day 2. Data are represented as means ± SD (n = 6). *p < 0.05, ***p < 0.001, ****p < 0.0001, and ns: non-significant. Ordinary one-way ANOVA followed by Tukey’s multiple comparisons test (E, F). Two-way ANOVA followed by Šídák’s multiple comparisons test (H). (G) Expression analysis of HAP4 and ETC genes by qRT-PCR in wild-type and YBR238C overexpression (YBR238C-OE) strains of yeast S. cerevisiae genetic background CEN.PK113-7D (C). qRT-PCR was performed using RNA extracted from logarithmic-phase cultures grown in synthetic defined medium. Data are represented as means ± SD (n = 2). *p < 0.05, **p < 0.01, and ***p < 0.001 based on two-way ANOVA followed by Šídák’s multiple comparisons test. (I) Model representing regulation of cellular aging by YBR238C via HAP4-dependent and -independent mechanisms.
We found that deletion of HAP4 moderately decreases CLS at the background of the ybr238c∆ mutant (Figure 3E). To confirm that the decrease in lifespan is through the HAP4 pathway, we examined the expression of mitochondrial respiratory genes. We found that HAP4 deletion significantly decrease the ETC complexes I–V genes’ expression in ybr238c∆ mutant (Figure 3D). To note, HAP4 deletion at the wild-type background decreases the cellular lifespan even more (Figure 3E), which is consistent with more dramatic reduction of ETC complexes I–V genes’ expression (Figure 3D). Taken together these data suggest that YBR238C negatively regulates the HAP4 activity. HAP4-upregulated, increased mitochondrial function contributes to the prolonged lifespan of ybr238c∆ cells.
YBR238C gene deletion rescues some loss of lifespan of hap4∆ cells (Figure 3F). The effect is especially pronounced until day 8 when wild-type cells are essentially 100% surviving. Yet, complete epistasis of phenotypes is not achieved. This observation parallels the above findings that HAP4 deletion in ybr238c∆ mutant does not fully recover the mitochondrial ETC complexes I–V genes’ expression and CLS at day 9 compared to the wild-type background (Figure 3D, E). Together, these results indicate that YBR238C affects cellular lifespan via HAP4-dependent and -independent mechanisms.
To confirm the existence ofHAP4-independent mechanisms, we examined the lifespan and transcriptome under conditions of YBR238C overexpression (YBR238C-OE). As expected, YBR238C-OE decreases the expression of HAP4, of mitochondrial ETC complexes I–V genes (Figure 3G) as well as the CLS (Figure 3H). Strikingly, the lifespan of YBR238C-OE cells was shorter than for hap4∆ cells (Figure 3H). Thus, a HAP4-independent mechanism does exist through which YBR238C also affects cellular aging (Figure 3I).
The YBR238C paralog RMD9 deletion decreases the lifespan of cells
In yeast S. cerevisiae, YBR238C has a paralog RMD9 that shares ∼45% amino acid identity (Nouet et al., 2007). Given that YBR238C activity is tightly coupled with the lifespan, we investigated the role of its paralog RMD9 in cellular aging. Surprisingly, we found that RMD9 deletion has an effect opposite to YBR238C deletion and it shortens CLS (Figure 4A–C, Figure 4—figure supplement 1A–C).
Figure 4 with 1 supplement see all

RMD9 deletion decreases the cellular lifespan.
(A, E) Chronological lifespan (CLS) of yeast Saccharomyces cerevisiae genetic background CEN.PK113-7D strains was performed in synthetic defined medium using 96-well plate. Aged cells survival was measured relative to the outgrowth of day 2. Data are represented as means ± standard deviation (SD) (n = 12) (A) and (n = 6) (B). ****p < 0.0001 and ns: non-significant. Ordinary one-way analysis of variance (ANOVA) followed by Tukey’s multiple comparisons test (A). Two-way ANOVA followed by Dunnett’s multiple comparisons test (E). (B, C, F, G) CLS of yeast strains was performed in synthetic defined medium using flask. Outgrowth was performed for 10-fold serial diluted aged cells onto the YPD agar plate (B, F) and YPD medium in the 96-well plate (C, G). The serial outgrowth of aged cells on agar medium was imaged (B, F) and quantified the survival relative to outgrowth of day 1 (C, G). A representative of two experiments for B, C, F, and G is shown. (D) Serial dilution growth assays of the yeast strains on fermentative glucose medium (YPD) and respiratory glycerol medium (YPG). (H) Adenosine triphosphate (ATP) level in yeast strains. Quantification was performed using ATP extracted from 72-hr stationary cultures grown in synthetic defined medium. Data are represented as means ± SD (n = 3). *p < 0.05 and ***p < 0.001 based on ordinary one-way ANOVA followed by Dunnett’s multiple comparisons test.
RMD9 was initially isolated during a search for genes required for meiotic nuclear division (Enyenihi and Saunders, 2003). Subsequently, its role was uncovered in controlling the expression of mitochondrial metabolism genes by stabilizing and processing mitochondrial mRNAs (Hillen et al., 2021; Nouet et al., 2007; Williams et al., 2007). We asked whether RMD9 deletion induces mitochondrial dysfunction that, therefore, causes accelerated cellular aging. We first tested the mitochondrial activity by allowing mutant cells to grow under respiratory conditions (Hughes et al., 2020; Zulkifli et al., 2020; Merz and Westermann, 2009). We found that rmd9∆ mutants could perform on glucose medium, but they failed to grow on glycerol as a carbon source (known to require functional mitochondria; Figure 4D, Figure 4—figure supplement 1D). Our results are in line with previously observed dysfunctional mitochondria in rmd9∆ mutants (Hillen et al., 2021; Nouet et al., 2007).
In control experiments, we found a similar growth defect phenotype on glycerol medium for cells deficient in PET100 and COX6 mitochondrial genes (Figure 4D, Figure 4—figure supplement 1D; Merz and Westermann, 2009). CLS of pet100∆ and cox6∆ mutants were reduced compared to wild type (Figure 4E–G, Figure 4—figure supplement 1E–G). We also found lowered ATP and higher ROS levels in rmd9∆, pet100∆, cox6∆ mutants compared to wild-type cells (Figure 4H, Figure 4—figure supplement 1H).
In contrast, long-lived ybr238c∆ mutants efficiently grow on respiratory medium with high ATP and low ROS levels (Figure 4D, H, Figure 4—figure supplement 1D, H). So far, the results indicate that deletion of YBR238C potentiates the mitochondrial function that, in turn, leads to CLS increase. Thus, YBR238C and its paralog RMD9 antagonistically affect mitochondrial function, CLS, and cellular aging.
YBR238C affects the cellular lifespan via an RMD9-dependent mechanism
Previously, YBR238C deletion was shown to increase the CLS via HAP4-dependent and -independent mechanisms (Figure 3) and to rescue some loss of CLS of the hap4∆ mutant by a HAP4-independent mechanism (Figure 3E, F). Here, we ask whether YBR238C deletion suppresses the shortened lifespan of rmd9∆ mutants. We examined the lifespan of double deletion rmd9∆ ybr238c∆ mutant and compared it with rmd9∆. We found that the deletion of YBR238C largely failed to recover the lifespan of rmd9∆ mutant to wild-type cells; however, it partially prevented their early cell death (Figure 5A–C). These results show that YBR238C deletion increases the cellular lifespan via RMD9-dependent mechanisms. Also, we found that the YBR238C deletion results in increased ATP and reduced ROS levels in the rmd9∆ mutant (Figure 5D, E).
Figure 5

YBR238C affects cellular aging via RMD9-dependent mechanism.
(A, B, G, H) Chronological lifespan (CLS) of yeast Saccharomyces cerevisiae genetic background CEN.PK113-7D strains was performed in synthetic defined medium using flask. Outgrowth was performed for 10-fold serial diluted aged cells onto the YPD agar plate (A, G) and YPD medium in the 96-well plate (B, H). The serial outgrowth of aged cells on agar medium was imaged (A, G) and quantified the survival relative to outgrowth of day 2 (B, H). A representative of two experiments for A, B, G, and H is shown. (C, I) CLS of yeast strains was performed in synthetic defined medium using 96-well plate. Aged cells survival was measured relative to the outgrowth of day 2. Data are represented as means ± standard deviation (SD) (n = 6) (C) and (n = 12) (I). ****p < 0.0001 based on two-way analysis of variance (ANOVA) followed by Tukey’s multiple comparisons test (C) and Dunnett’s multiple comparisons test (I). ns: non-significant. (D, J) Adenosine triphosphate (ATP) level in yeast strains. Quantification was performed using ATP extracted from 72-hr stationary cultures grown in synthetic defined medium. Data are represented as means ± SD (n = 4). *p < 0.05, ***p < 0.001, and ****p < 0.0001 based on ordinary one-way ANOVA followed by Tukey’s multiple comparisons test. (E, K) Reactive oxygen species (ROS) level in yeast strains. Quantification was performed for logarithmic-phase cultures grown in synthetic defined medium. Data are represented as means ± SD (n = 3). **p < 0.01, ***p < 0.001, and ****p < 0.0001 based on ordinary one-way ANOVA followed by Tukey’s multiple comparisons test. ns: non-significant. (F) Expression analysis of RMD9 gene by quantitative reverse transcription-polymerase chain reaction (qRT-PCR) in yeast strains. qRT-PCR was performed using RNA extracted from logarithmic-phase cultures grown in synthetic defined medium. Data are represented as means ± SD (n = 4). ***p < 0.001 and ****p < 0.0001 based on ordinary one-way ANOVA followed by Tukey’s multiple comparisons test. (L) Effect of antimycin A (AMA) treatment on CLS of yeast strain was assessed in synthetic defined medium using 96-well plate. Aged cells survival was measured relative to the outgrowth of day 1. A representative heatmap data of three experiments is shown. (M) Model representing regulation of cellular aging by YBR238C via HAP4- and RMD9-dependent mechanisms.
Intriguingly, we find RMD9 expression upregulated in ybr238c∆ and downregulated in YBR238C-OE cells, respectively (Figure 5F). So, we asked whether RMD9 expression change is transcriptionally coupled in cellular lifespan phenotypes. Remarkably, RMD9 overexpression increases the lifespan of cells (Figure 5G–I) as we would have predicted from the observed changes with the YBR238C deletion phenotype.
To know whether this CLS increase is contributed by enhanced mitochondrial function, we quantified the ATP level in wild-type, YBR238C-OE, and RMD9-OE cells. ATP level is higher in RMD9-OE cells than wild-type cells, a result in line with RMD9 positively regulating mitochondrial activity (Figure 5J). Consistent with the above findings, YBR238C overexpression decreases the ATP level (Figure 5J). Next, we assessed the oxidative stress and found that the ROS level in RMD9-OE cells was comparable to wild type. Yet, YBR238C overexpression increases the ROS level (Figure 5K).
It can be shown that the effects of YBR238C and RMD9 are at least partially realized via the mitochondrial ETC pathway. Antimycin A (AMA) is an inhibitor of the ETC complex III, decreasing ATP synthesis (Figure 6—figure supplement 1A; Huang et al., 2005). Also, AMA treatment reduces the lifespan of cells (Figure 6—figure supplement 1B), confirming that mitochondrial energy supply is critical to delay cellular aging. Since YBR238C and RMD9 affect the ATP level, we tested the AMA effect on their deletion and overexpression strains. We found that ybr238c∆ and RMD9-OE cells with their enhanced mitochondrial function phenotype were largely resistant to AMA treatment (Figure 5L). AMA aggravates the cellular aging of mitochondrial defective YBR238C-OE cells (Figure 5L). Notably, mitochondrial defective rmd9∆ cells were not further affected by AMA treatment (Figure 5L).
Altogether, our findings reveal that YBR238C affects CLS and cellular aging via modulating mitochondrial function by mechanisms including HAP4- and RMD9-dependent pathways (Figure 5M).
YBR238C connectsTORC1 signaling with modulating mitochondrial function and cellular aging
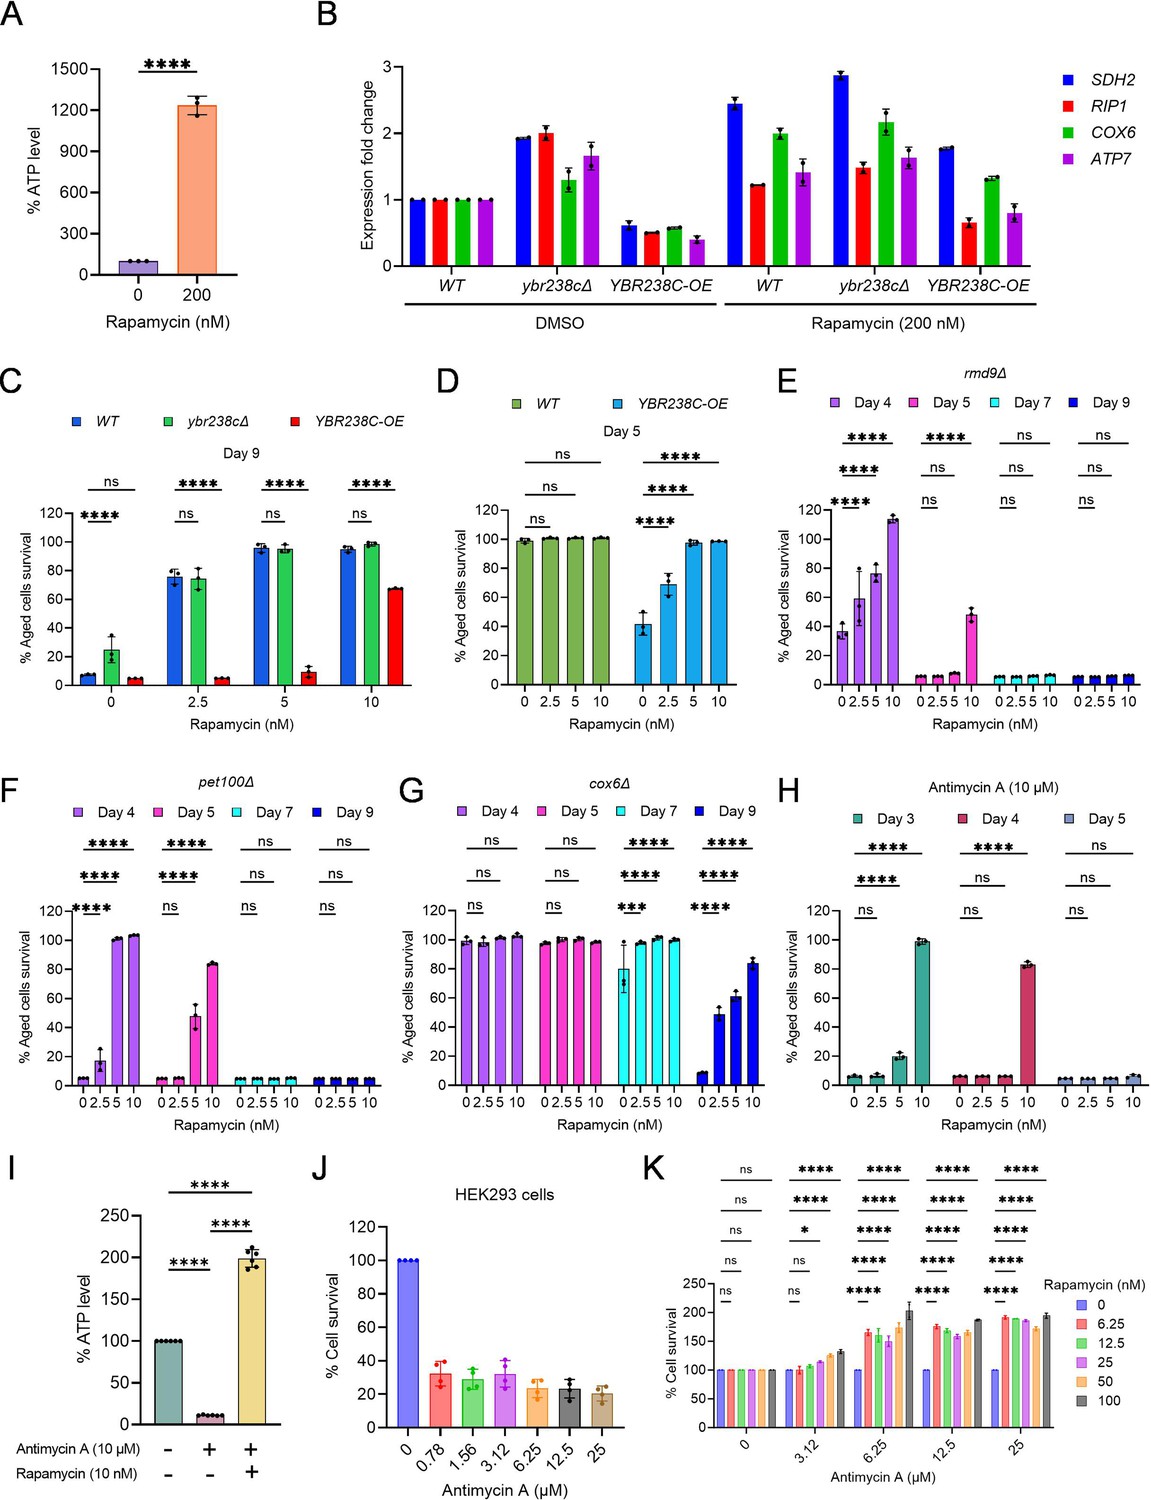
So far, we learned that YBR238C is regulated by TORC1 (Figure 1A, B) and it affects cellular lifespan by modulating mitochondrial function. Here, we wish establish the direct connection between the TORC1 signaling and mitochondrial activity. We treated cells with the TORC1 inhibitor rapamycin and found that, subsequently, the ATP-level increases in the cells (Figure 6A, Figure 6—figure supplement 1C). To test whether TORC1 affects mitochondrial function via YBR238C, we analyze the expression profile of mitochondrial ETC genes. As expected, rapamycin supplementation decreased the expression of YBR238C (Figure 6—figure supplement 1D, E) but induced the expression of ETC genes (Figure 6B). Remarkably, rapamycin-induced changes in the expression of ETC genes were largely unaffected in ybr238c∆ cells and reduced in YBR238C-OE cells (Figure 6B). Our results are consistent with the hypothesis that TORC1 regulates the mitochondrial ETC genes via YBR238C.
Figure 6 with 1 supplement see all
TORC1–MItochondria–TORC1 (TOMITO) signaling axis regulate cellular aging.
(A) Adenosine triphosphate (ATP) analysis of logarithmic-phase wild-type CEN.PK113-7D yeast cells treated with rapamycin for 1 hr in synthetic defined medium. Data are represented as means ± standard deviation (SD) (n = 3). ****p < 0.0001 based on ordinary one-way analysis of variance (ANOVA) followed by Dunnett’s multiple comparisons test. See also Figure 6—figure supplement 1C. (B) Expression analysis of mitochondrial ETC genes by quantitative reverse transcription-polymerase chain reaction (qRT-PCR). Analysis was performed using RNA extracted from logarithmic-phase wild-type CEN.PK113-7D yeast cell treated with rapamycin for 1 hr in synthetic defined medium. Data are represented as means ± SD (n = 2). (C–G) Chronological lifespan (CLS) of yeast strains with indicated concentrations of rapamycin was performed in synthetic defined medium using 96-well plate. Aged cells survival was measured relative to the outgrowth of day 2. Data are represented as means ± SD (n = 3). ***p < 0.001 and ****p < 0.0001 based on two-way ANOVA followed by Dunnett’s multiple comparisons test. ns: non-significant. (H) CLS of wild-type yeast strain with indicated concentrations of rapamycin and antimycin A (10 µM) was performed in synthetic defined medium using 96-well plate. Aged cells survival was measured relative to the outgrowth of day 1. Data are represented as means ± SD (n = 3). ****p < 0.0001 based on two-way ANOVA followed by Dunnett’s multiple comparisons test. ns: non-significant. (I) ATP analysis of stationary-phase wild-type CEN.PK113-7D yeast cells were incubated with rapamycin (10 nM) and antimycin A (10 µM) in synthetic defined medium. Data are represented as means ± SD (n = 6). ****p < 0.0001 based on ordinary one-way ANOVA followed by Tukey’s multiple comparisons test. See also Figure 6—figure supplement 1H. (J) Determination of human HEK293 cells survival incubated with indicated concentrations of antimycin A for 6 days. Untreated control is considered 100% cell survival. Cells survival was measured relative to the control. Data are represented as means ± SD (n = 6). (K) Cell survival analysis of human HEK293 cells incubated with indicated concentrations of antimycin A and rapamycin for 6 days. Antimycin A and rapamycin individual treated concentrations considered 100% cell survival control. Cells survival of combined treated cells was measured relative to the control. Data are represented as means ± SD (n = 2). *p < 0.05,****p < 0.0001, and ns: non-significant based on two-way ANOVA followed by Dunnett’s multiple comparisons test.
The strains ybr238c∆ and YBR238C-OE are associated with increased and decreased CLS, respectively. So, we ask whether TORC1 influences cellular aging via YBR238C by modulating mitochondrial function. We examined the effect of rapamycin supplementation on the lifespan of ybr238c∆ and YBR238C-OE cells. Strikingly, addition of rapamycin does not further increase CLS of ybr238c∆ cells (Figure 6C). Additionally, anti-aging effect of rapamycin is significantly reduced in YBR238C-OE cells (Figure 6C). These findings are consistent with the rapamycin effect on transcriptomics profiles of ETC genes in ybr238c∆ and YBR238C-OE cells (Figure 6B). Taken together, these results reveal that YBR238C is adownstream effector of TORC1 signaling, connecting mitochondrial function for the regulation of cellular aging.
Mitochondrial dysfunction induces the TORC1 activity that causes accelerated cellular aging
We showed that YBR238C-OE cells are associated with mitochondrial dysfunction and shortened lifespan (Figure 5). Apparently, the accelerated cellular aging phenotype is primarily due to compromised cellular energy level that affects the lifespan. Genetic (ybr238c∆) and chemical (rapamycin) mediated enhancement of ATP level increases the lifespan of wild-type cells validate this conclusion. Notably, the rapamycin supplementation significantly rescued the shortened lifespan of mitochondrial defective YBR238C-OE cells (Figure 6D, Figure 6—figure supplement 1F). This observation suggests that, as a reaction on sensing mitochondrial dysfunction, TORC1 is activated which, in turn, leads to accelerated cellular aging. Indeed, we found that cellular growth (a proxy for TORC1 activity) of mitochondria dysfunctional YBR238C-OE cells was resistant to rapamycin inhibition at concentrations that were effective for wild-type cells (Figure 6—figure supplement 1G).
Furthermore, we asked what the effect of TORC1 activity under enhanced mitochondrial function conditions would be. To test this, we assessed the growth of ybr238c∆ cells with rapamycin. We found that the cellular growth of ybr238c∆ cells was reduced by rapamycin compared to wild-type cells (Figure 6—figure supplement 1G). Apparently, TORC1 activity is not signaled downstream under these conditions and rapamycin further aggravates this by TORC1 inhibition. This result suggests that YBR238C affects TORC1 activity via modulating mitochondrial function.
We found a similar pattern of rapamycin effect on growth of mutant cells with enhanced or damaged mitochondrial function. Growth of RMD9-OE cells having enhanced mitochondrial function was sensitive to rapamycin (Figure 6—figure supplement 1G). Likewise, growth of defective mitochondrial rmd9∆, pet100∆, and cox6∆ mutants is resistant to rapamycin compared to wild type (Figure 6—figure supplement 1G). The YBR238C deletion reduced the rapamycin growth resistance phenotype of mitochondrial dysfunctional rmd9∆ (Figure 6—figure supplement 1G) and hap4∆ cells (Figure 6—figure supplement 1H), apparently by enabling enhanced mitochondrial function.
Taken together, we see that YBR238C plays a junction role in integrating mitochondrial function and TORC1 signaling.
TORC1 inhibition prevents accelerated cellular aging caused by mitochondrial dysfunction in yeast and human cells
Mitochondrial dysfunction increases the TORC1 activity and, subsequently, causes accelerating cellular aging. We asked whether inhibition of TORC1 activity could prevent accelerating cellular aging even under mitochondrial dysfunction conditions. Previously, we have already shown that rapamycin-mediated TORC1 inhibition partly rescued the shortened lifespan of mitochondrial defective YBR238C-OE cells (Figure 6D, Figure 6—figure supplement 1F). We examined other mitochondrial dysfunctional conditions to confirm that the suppressive effect of rapamycin is not only specific to YBR238C-OE. We tested defective mitochondrial mutants rmd9∆, pet100∆, and cox6∆. In all cases, rapamycin supplementation prevents the accelerated cellular aging (Figure 6E–G).
Rapamycin supplementation also rescued the AMA-mediated accelerated cellular aging (Figure 6H). We also quantified the ATP level to confirm that the suppressive effect of rapamycin is specific to mitochondrial function. Rapamycin supplementation increases the ATP level of AMA-treated cells (Figure 6I, Figure 6—figure supplement 1I), demonstrating that TORC1 inhibition improves mitochondrial function and thus suppresses accelerated cellular aging.
We further verified the connection of TORC1 and mitochondrial function in human cells. First, we examined the effect of AMA on the survival of HEK293 cells. AMA treatment decreases the viability of HEK293 cells (Figure 6J). Cell survival reduction is due to the mitochondrial dysfunction as we see lower ATP levels in AMA-treated cells compared to untreated control (Figure 6—figure supplement 1J). Subsequently, we examined the survival of AMA-treated HEK293 cells with or without rapamycin supplementation. Rapamycin supplementation suppresses AMA-mediated cellular death (Figure 6K). Further rapamycin supplementation increases the ATP-level-treated cells (Figure 6—figure supplement 1J).
Our findings convincingly support that TORC1 inhibition suppresses cellular aging associated with mitochondrial dysfunction across species.
Discussion
Identifying lifespan regulators, genetic networks, and connecting genetic nodes relevant to cellular aging provides functional insight into the complexity of aging biology Kennedy et al., 2014; Cohen et al., 2022; López-Otín et al., 2013 for the subsequent design of anti-aging interventions. Understanding the mechanism of aging will also require understanding the role of many genes of yet unknown function as YBR238C at the beginning of this work. Unfortunately, the group of uncharacterized genes coding proteins of unknown function has received dramatically decreasing attention during the past two decades (Eisenhaber, 2012; Sinha et al., 2018; Tantoso et al., 2023).
In this study, we first summarized literature and genome database reports about genes affecting aging in the yeast model (mostly observed in gene deletion screens). We found that AAGs make up about one-third of the total yeast genome (many of them are functionally uncharacterized) and can be classified into 15 categories for increase/decrease CLS and/or RLS under various conditions.
We compared the set of AAGs with the group of RRGs (rapamycin-regulated genes) and found that about one-third of the AAGs is TORC1 activity regulated. Among the functionally uncharacterized genes in this overlap set, the gene YBR238C stands out as the only one that (1) is downregulated by rapamycin and (2) its deletion increases both CLS (Burtner et al., 2011) and RLS (McCormick et al., 2015; Delaney et al., 2011; Kaeberlein et al., 2005; Schleit et al., 2013). Thus, YBR238C is important among identified rapamycin-downregulated uncharacterized genes in AAG categories as it seems to rationally connect the rapamycin-induced TORC1 inhibition with the increase of both CLS and RLS.
We observed that the CLS of ybr238c∆ cells is higher than for wild type, regardless of various aging experimental conditions tested in this study. Transcriptional analysis of ybr238c∆ cells identified a longevity signature including enhanced gene expression related to mitochondrial energy metabolism and stress response genes (Powers et al., 2006; Lin et al., 2002; Sun et al., 2016; Navarro and Boveris, 2007; Qiu et al., 2010; Bonawitz et al., 2007). In contrast, YBR238C-OE cells display mitochondrial dysfunction leading to decreased lifespan. Together, these results reveal that TORC1 regulates the YBR238C expression which is linked to mitochondrial function and cellular lifespan.
The YBR238C paralog RMD9 has been previously shown to affect mitochondrial function (Hillen et al., 2021; Nouet et al., 2007). Surprisingly, we observed an antagonism regarding the CLS phenotype of deletion/overexpression for YBR238C and RMD9. YBR238C overexpression and RMD9 deletion confer defective mitochondrial function associated with accelerated cellular aging and decrease lifespan of cells. In contrast, YBR238C deletion and RMD9 overexpression enhance the mitochondrial function that increase the cells’ longevity. Consistent with the identified negative regulatory role of YBR238C on mitochondrial function, deletion of this gene partially suppressed the accelerated aging of rmd9∆ cells and AMA-treated cells. We identified that YBR238C influences mitochondrial function and the CLS phenotype with contributions from HAP4- and RMD9-dependent mechanisms. As (1) one ofRMD9’s molecular functions has been shown to stabilize certain (mitochondrial) mRNAs and (2) YBR238C has a homologous pentatricopeptide repeat region, the two paralogs might differ in the sets of protected mRNAs with opposite outcome on cellular longevity.
While Kaeberlein et al. identified YBR238C as a top candidate for increasing RLS in yeast through deletion (Kaeberlein et al., 2005), our study builds upon their work by investigating the mechanisms and the connection with TORC1 in CLS. Results of genetic interventions (YBR238C deletion and overexpression) and rapamycin treatment show that YBR238C is a downstream effector by which TORC1 modulates mitochondrial activity. Most importantly, we found that TORC1 inhibition increases the mitochondrial function via YBR238C and, thereby, extends cellular lifespan. TORC1 is involved in both CLS and RLS (Longo et al., 2012). Whether the TORC1–YBR238C axis has similar or distinct mechanisms for CLS and RLS will be interesting to identify in the future.
TORC1 is the major controller of cellular metabolism that links environmental cues and signals for cellular growth and homeostasis. TORC1 upregulates anabolic processes such as de novo synthesis of proteins, nucleotides, lipids, and downregulates catabolic processes such as inhibition of autophagy (Saxton and Sabatini, 2017; González and Hall, 2017). We find that dysfunctional mitochondria lead to TORC1 activation both in yeast and in human cells with accompanying onset of accelerated cellular aging. Our results are in line with a recent report about anabolic pathways enhancement and suppression of catabolic processes in cells with defective mitochondria (Hernberg and Nikkanen, 1970). On the other hand, TORC1 activity decreases under enhanced mitochondrial function environment. The cause of the mitochondrial dysfunction (whether due to deletion of a critical gene or pharmacological intervention) is irrelevant in this context. Nevertheless, despite the mitochondrial insufficiency background, inhibition of TORC1 (e.g., with rapamycin) can partially rescue the shortened cellular lifespan (Figure 6D–H, Figure 6—figure supplement 1F).
Our work sheds light onto the questions (i) how mitochondrial dysfunction is linked to accelerated cellular aging and (ii) how TORC1 inhibition suppresses the mitochondrial dysfunction and prevents shortening lifespan. Apparently, mitochondrial dysfunction aberrantly signals to increase the TORC1 activity that leads to accelerated aging in cells. Remarkably, TORC1 inhibition can often suppress the accelerated cellular aging associated with impaired mitochondrial function. Yet, we found that growth of mutant strains with dysfunctional mitochondria can be resistant despite TORC1 inhibition by rapamycin with concentrations effective in wild-type cells possibly due to the dramatic increase of TORC1 activity as in YBR238C-OE, rmd9∆, pet100∆, cox6∆, and hap4∆ cells (Figure 6—figure supplement 1G, H).
Our interpretation of the experimental results is supported by two recently published studies: (1) TORC1 activation was observed after mitochondrial ETC dysfunction in an induced pluripotent cell model (Zheng et al., 2016). (2) The inhibition of TORC1 delays the progression of brain pathology of mice with ETC complex I NDUFS4-subunit knockout (Johnson et al., 2013b).
We think that it will be insightful to explore TORC1 activity under various conditions with compromised mitochondrial function including mitochondrial fission and fusion dynamics which is reported to affect in cell viability (Archer, 2013; Youle and van der Bliek, 2012). Altogether, our findings uncover the central role of the feedback loop between mitochondrial function and TORC1 signaling (TORC1–MItochondria–TORC1 (TOMITO) signaling process). Whereas the effector from TORC1 to mitochondria involves YBR238C, the other direction appears executed via metabolite sensing (e.g., α-keto-glutarate, glutamine, etc.) (Durán et al., 2012).
Methods
Data acquisition
The gene lists that modulate cellular lifespan in aging model organism yeast S. cerevisiae were extracted from database SGD (Engel et al., 2022) and GenAge (Townes et al., 2020) (as of November 8, 2022). The actual gene lists are available in Figure 1—source data 1.
Yeast strains, growth media, and cell culture
The S. cerevisiae auxotrophic BY4743 (Euroscarf) and prototrophic CEN.PK113-7D (Bauer et al., 2000) strains were used in this study. Deletion strains for BY4743 obtained from yeast homozygous diploid collection. Deletion strains in CEN.PK background was generated using standard PCR-based method (Longtine et al., 1998). Yeast strains were revived from frozen glycerol stock on YPD agar (1% Bacto yeast extract, 2% Bacto peptone, 2% glucose, and 2.5% Bacto agar) medium for 2–3 days at 30°C. For all experiments, CEN.PK113-7D strains were grown in synthetic defined (SD) medium contain 6.7 g/l yeast nitrogen base with ammonium sulfate without amino acids and 2% glucose. SD medium supplemented with histidine (40 mg/l), leucine (160 mg/l), and uracil (40 mg/l) for auxotrophic BY4743 strains.
Human cell lines, growth media, and cell culture
Human embryonic kidney (HEK293) cell line (American Type Culture Collection (ATCC), CRL-1573) was cultured in high-glucose Dulbecco’s modified Eagle’s medium supplemented with 10% fetal bovine serum and 1% penicillin–streptomycin solution. All cells cultured in a humidified incubator with 5% CO2 at 37°C. The cell lines were authenticated by the suppliers using short tandem repeat profiling, ensuring their identity. Additionally, it was confirmed that the cells were not contaminated with mycoplasma. Stocks were subsequently prepared from these authenticated and contamination-free cells. For each new experiment, a fresh aliquot from these stocks was used to maintain consistency and integrity in our experimental procedures.
Chemical treatment to cell culture
Stock solution of rapamycin and AMA was prepared in DMSO. The final concentration of DMSO did not exceed 1% in yeast and 0.01% in human cell lines experiments.
Yeast aging assay
For the CLS experiments, prototrophic CEN.PK113-7D strains were grown in SD medium contain 6.7 g/l yeast nitrogen base with ammonium sulfate without amino acids and 2% glucose. SD medium supplemented with histidine (40 mg/l), leucine (160 mg/l), and uracil (40 mg/l) for auxotrophic BY4743 strains. Chronological aging was assessed by determining the lifespan of yeast as described previously with slight modifications (Longo et al., 2012; Alfatah and Eisenhaber, 2023). Yeast culture grown in overnight at 30°C with 220 rpm shaking in glass flask was diluted to starting optical density at 600 nm (OD600) ~0.2 in fresh medium to initiate the CLS experiment. CLS was performed by outgrowth method utilizing three different approaches: (1) Cells grown and aged in 96-well plates with a total 200 µl culture in SD medium at 30°C. At various age time points yeast stationary culture (2 μl) were transferred to a second 96-well plate containing 200 μl YPD medium and incubated for 24 hr at 30°C without shaking. Outgrowth OD600 for each age point was measured by the microplate reader. (2) Cells grown and aged in flask with a total culture volume more than 5 ml SD medium and incubated for 24 hr at 30°C with 220 rpm shaking. At different age time points yeast stationary culture washed and normalized to OD600 of 1.0 with YPD medium. Furthermore, normalized yeast cells were serial 10-fold diluted with YPD medium in 96-well plates. 3 μl of diluted culture were spotted onto the YPD agar plate and incubated for 48 hr at 30°C. The outgrowth of aged cells on the YPD agar plate was photographed using the GelDoc imaging system. (3) The above discussed serial 10-fold diluted yeast stationary culture with YPD medium in 96-well plates incubated for 24 hr at 30°C without shaking. Outgrowth OD600 for serial diluted aged cells was measured by the microplate reader.
RNA extraction
Yeast cells were first mechanically lysed using the manufacturer’s disruption protocol. Total RNA from yeast cells was extracted using QIAGEN RNeasy mini kit. ND-1000 UV-visible light spectrophotometer (Nanodrop Technologies) and Bioanalyzer 2100 with the RNA 6000 Nano Lab Chip kit (Agilent) was used to assess the concentration and integrity of RNA.
RNA-Seq and bioinformatics analysis
RNA-Seq was conducted using NovaSeq PE150. Raw Fastq files were then passed into Fastp v0.23.2 for adapter trimming and low-quality reads removal. Both single- and paired-end reads were processed with default parameters with --detect adapter for pe. Raw reads that passed the quality check were then aligned using HiSat 2 v2.2.1 with the index built from S. cerevisiae R-64-1-1 top-level DNA fasta file obtained from Ensembl for sequencing data with S288C strain background. Library information for all experiments were first checked with RSeQC infer_experiment.py v4.0.0 before the addition of the respective parameters for alignment and counts. The resulting SAM files were then converted and sorted to BAM files using Samtools v1.13. The BAM files were then used to generate feature counts using HTSeq v1.99.2. HTSeq counts from each experiment were then used for downstream DEGs analysis. Counts generated from HTSeq were then used for differential gene expression analysis using EdgeR v3.34.1 quasi likelihood F-test and DESeq2 v1.36.0. Principal component analysis (PCA) was conducted via the use of transcript per million normalized counts. Samples that are separated by batches in the PCA were corrected using ComBat-Seq v3.44.0 before PCA was conducted after normalization of the corrected counts. Functional enrichment analysis was performed by metascape tool (Bitto et al., 2016).
qRT-PCR analysis
qRT-PCR experiments were performed as described previously using QuantiTect Reverse Transcription Kit (QIAGEN) and SYBR Fast Universal qPCR Kit (Kapa Biosystems) (Alfatah et al., 2021). The abundance of each gene was determined relative to the house-keeping transcript ACT1.
ATP analysis
ATP analysis was performed as described previously (Alfatah et al., 2023). Yeast cells were mixed with the final concentration of 5% trichloroacetic acid (TCA) and then kept on ice for at least 5 min. Cells were washed and resuspended in 10% TCA and lysis was performed with glass beads in a bead beater to extract the ATP. ATP extraction from human HEK293 cells was performed using Triton X-100 lysis buffer. The ATP level was quantified by PhosphoWorks Luminometric ATP Assay Kit (AAT Bioquest) and normalized by protein content measured Bio-Rad protein assay kit.
mtDNA copy number analysis
Determination of mtDNA copy number was analyzed by real-time qPCR (quantitative polymerase chain reaction). DNA was extracted using Quick-DNA Midiprep Plus Kit (Zymo Research). qPCR was performed in a final volume of 20 μl containing 20 ng of total DNA using SYBR Fast Universal qPCR Kit (Kapa Biosystems) and analyzed using the Quant Studio 6 Flex system (Applied Biosystems). The real-time qPCR conditions were one hold at (95°C, 180 s), followed by 40 cycles of (95°C, 1 s) and (60°C, 20 s) steps. A melting-curve analysis was included in the cycle after amplification to verify PCR specificity and the absence of primer dimers. Relative mtDNA content was determined by qPCR of mitochondrial genes (ATP6 and COX3) and normalized with nuclear-specific gene ACT1.
ROS measurement
Cells were washed and resuspended in 1× phosphate buffer saline (PBS, pH 7.4). After that cells were incubated with 40 μM H2DCFDA (Molecular probe) for 30 min at 30°C (Haque et al., 2019). Cells were then washed with PBS and ROS level was measured by fluorescence reading (excitation at 485 nm, emission at 524 nm) by the microplate reader. The fluorescence intensity was normalized with OD600.
TFs analysis
TFs enrichment analysis was performed using YEASTRACT (Teixeira et al., 2006; Teixeira et al., 2018). The significant p-value <0.05 considered for regulatory network analysis based on DNA-binding plus expression evidence. The TFs regulatory networks were visualized with a force-directed layout.
Fermentative and respiratory growth assay
Yeast cells grown in YPD medium were washed and normalized to OD600 of 1.0 with water. Furthermore, normalized yeast cells were serial 10-fold diluted with water. 3 μl of diluted culture were spotted onto the agar medium YPD (2% glucose) and YPG (3% glycerol) and incubated for 48 hr at 30°C. The cell growth on the agar plate was photographed using the GelDoc imaging system.
Growth sensitivity assay
Effect of chemical compounds on cell growth was carried out in 96-well plates. At an OD600 of ~0.2 in SD medium 200 µl yeast cells was transferred into the 96-well plate containing serially double-diluted concentrations of compounds. Cells were incubated at 30°C and the growth was measured at OD600 by the microplate reader.
Quantification and statistical analysis
Data analysis of all the experimental results such as mean value, standard deviations, significance, and graphing were performed using GraphPad Prism v.9.3.1 software. The comparison of obtained results was statistically performed using the Student’s t-tests, ordinary one-way analysis of variance (ANOVA), and two-way ANOVA followed by multiples comparison tests. In all the graph plots, p values are shown as *p < 0.05, **p < 0.01, ***p < 0.001, and ****p < 0.0001 were considered significant. ns: non-significant.
Lead contact and materials availability
Further information and requests for resources and reagents should be directed to and will be fulfilled by the Lead Contact, Dr. Mohammad Alfatah (alfatahm@bii.a-star.edu.sg).
Data availability
Sequencing data have been deposited in SRA under accession codes SAMN38984574, SAMN38984575, SAMN38984576, SAMN38984577.
-
NCBI BioSampleID SAMN38984574. 2% Glucose_WT_1.
-
NCBI BioSampleID SAMN38984575. 2% Glucose_ΔYBR238C_1.
-
NCBI BioSampleID SAMN38984576. 2% Glucose_WT_2.
-
NCBI BioSampleID SAMN38984577. 2% Glucose_ΔYBR238C_2.
References
-
Mitochondrial dynamics--mitochondrial fission and fusion in human diseasesThe New England Journal of Medicine 369:2236–2251.https://doi.org/10.1056/NEJMra1215233
-
An interlaboratory comparison of physiological and genetic properties of four Saccharomyces cerevisiae strainsEnzyme and Microbial Technology 26:706–714.https://doi.org/10.1016/s0141-0229(00)00162-9
-
A complex systems approach to aging biologyNature Aging 2:580–591.https://doi.org/10.1038/s43587-022-00252-6
-
Glutaminolysis activates Rag-mTORC1 signalingMolecular Cell 47:349–358.https://doi.org/10.1016/j.molcel.2012.05.043
-
A decade after the first full human genome sequencing: when will we understand our own genome?Journal of Bioinformatics and Computational Biology 10:1271001.https://doi.org/10.1142/S0219720012710011
-
The recipe for protein sequence-based function prediction and its implementation in the annotator software environmentMethods in Molecular Biology 1415:477–506.https://doi.org/10.1007/978-1-4939-3572-7_25
-
Mitochondrial control of cellular life, stress, and deathCirculation Research 111:1198–1207.https://doi.org/10.1161/CIRCRESAHA.112.268946
-
Nutrient sensing and TOR signaling in yeast and mammalsThe EMBO Journal 36:397–408.https://doi.org/10.15252/embj.201696010
-
A systematic RNAi screen for longevity genes in C. elegansGenes & Development 19:1544–1555.https://doi.org/10.1101/gad.1308205
-
mTOR at the nexus of nutrition, growth, ageing and diseaseNature Reviews. Molecular Cell Biology 21:183–203.https://doi.org/10.1038/s41580-019-0199-y
-
Chronological aging in Saccharomyces cerevisiaeSub-Cellular Biochemistry 57:101–121.https://doi.org/10.1007/978-94-007-2561-4
-
Mitochondrial TCA cycle metabolites control physiology and diseaseNature Communications 11:102.https://doi.org/10.1038/s41467-019-13668-3
-
The mitochondrial energy transduction system and the aging processAmerican Journal of Physiology. Cell Physiology 292:C670–C686.https://doi.org/10.1152/ajpcell.00213.2006
-
The quest to slow ageing through drug discoveryNature Reviews. Drug Discovery 19:513–532.https://doi.org/10.1038/s41573-020-0067-7
-
Extension of chronological life span in yeast by decreased TOR pathway signalingGenes & Development 20:174–184.https://doi.org/10.1101/gad.1381406
-
You have come a long way baby: five decades of research on the biology of aging from the perspective of a researcher studying agingThe Journals of Gerontology. Series A, Biological Sciences and Medical Sciences 76:57–63.https://doi.org/10.1093/gerona/glaa208
-
Yeast as a model for human mtDNA replicationAmerican Journal of Human Genetics 65:1230–1237.https://doi.org/10.1086/302630
-
The mitochondrial basis of agingMolecular Cell 61:654–666.https://doi.org/10.1016/j.molcel.2016.01.028
-
Cell Senescence, and chronic disease: emerging therapeutic strategiesJAMA - Journal of the American Medical Association 13:1319–1320.https://doi.org/10.1001/jama.2018.12440
-
Identifying longevity associated genes by integrating gene expression and curated annotationsPLOS Computational Biology 16:e1008429.https://doi.org/10.1371/journal.pcbi.1008429
-
Mitochondrial fission, fusion, and stressScience 337:1062–1065.https://doi.org/10.1126/science.1219855
-
Yeast as a tool to identify anti-aging compoundsFEMS Yeast Research 18:foy020.https://doi.org/10.1093/femsyr/foy020
-
A Completely Reimplemented MPI Bioinformatics Toolkit with A New HHpred Server at its CoreJournal of Molecular Biology 430:2237–2243.https://doi.org/10.1016/j.jmb.2017.12.007
-
Yeast homologs of human MCUR1 regulate mitochondrial proline metabolismNature Communications 11:4866.https://doi.org/10.1038/s41467-020-18704-1
Article and author information
Author details
Trishia Yi Ning Cheng

Funding
A*STAR Career Development Fund, Singapore (C210112008)
- Mohammad Alfatah
US NAM Healthy Longevity Catalyst Awards Grant (MOH-000758-00)
- Mohammad Alfatah
- Frank Eisenhaber
YIRG, National Medical Research Council, Singapore (MOH-001348-00)
- Mohammad Alfatah
The funders had no role in study design, data collection, and interpretation, or the decision to submit the work for publication.
Acknowledgements
We thank Sebastian Maurer-Stroh (Executive Director, BII, A*STAR), Lee Hwee Kuan (Training and Talent Deputy Director, BII, A*STAR), Chandra S Verma (Research Deputy Director, BII, A*STAR), Su Xinyi (Acting Executive Director, IMCB, A*STAR), Farid John Ghadessy (Senior Principal Scientist), and Cheok Chit Fang (Principal Investigator, IMCB, A*STAR) for backing this research. This work was supported by Bioinformatics Institute, A*STAR Career Development Fund (C210112008), US NAM Healthy Longevity Catalyst Awards Grant (MOH-000758-00), and YIRG, National Medical Research Council, Singapore (MOH-001348-00).
Version history
- Preprint posted: July 5, 2023 (view preprint)
- Sent for peer review: September 5, 2023
- Preprint posted: November 24, 2023 (view preprint)
- Preprint posted: February 22, 2024 (view preprint)
- Version of Record published: May 7, 2024 (version 1)
Cite all versions
You can cite all versions using the DOI https://doi.org/10.7554/eLife.92178. This DOI represents all versions, and will always resolve to the latest one.
Copyright
© 2023, Alfatah et al.
This article is distributed under the terms of the Creative Commons Attribution License, which permits unrestricted use and redistribution provided that the original author and source are credited.
Metrics
-
- 460
- views
-
- 29
- downloads
-
- 0
- citations
Views, downloads and citations are aggregated across all versions of this paper published by eLife.
Download links
A two-part list of links to download the article, or parts of the article, in various formats.
Downloads (link to download the article as PDF)
Open citations (links to open the citations from this article in various online reference manager services)
Cite this article (links to download the citations from this article in formats compatible with various reference manager tools)
Uncharacterized yeast gene YBR238C, an effector of TORC1 signaling in a mitochondrial feedback loop, accelerates cellular aging via HAP4- and RMD9-dependent mechanisms
eLife 12:RP92178.
https://doi.org/10.7554/eLife.92178.3
Further reading
-
- Genetics and Genomics
PARP-1 is central to transcriptional regulation under both normal and stress conditions, with the governing mechanisms yet to be fully understood. Our biochemical and ChIP-seq-based analyses showed that PARP-1 binds specifically to active histone marks, particularly H4K20me1. We found that H4K20me1 plays a critical role in facilitating PARP-1 binding and the regulation of PARP-1-dependent loci during both development and heat shock stress. Here, we report that the sole H4K20 mono-methylase, pr-set7, and parp-1 Drosophila mutants undergo developmental arrest. RNA-seq analysis showed an absolute correlation between PR-SET7- and PARP-1-dependent loci expression, confirming co-regulation during developmental phases. PARP-1 and PR-SET7 are both essential for activating hsp70 and other heat shock genes during heat stress, with a notable increase of H4K20me1 at their gene body. Mutating pr-set7 disrupts monomethylation of H4K20 along heat shock loci and abolish PARP-1 binding there. These data strongly suggest that H4 monomethylation is a key triggering point in PARP-1 dependent processes in chromatin.
-
- Cancer Biology
- Genetics and Genomics
Enhancers are critical for regulating tissue-specific gene expression, and genetic variants within enhancer regions have been suggested to contribute to various cancer-related processes, including therapeutic resistance. However, the precise mechanisms remain elusive. Using a well-defined drug-gene pair, we identified an enhancer region for dihydropyrimidine dehydrogenase (DPD, DPYD gene) expression that is relevant to the metabolism of the anti-cancer drug 5-fluorouracil (5-FU). Using reporter systems, CRISPR genome-edited cell models, and human liver specimens, we demonstrated in vitro and vivo that genotype status for the common germline variant (rs4294451; 27% global minor allele frequency) located within this novel enhancer controls DPYD transcription and alters resistance to 5-FU. The variant genotype increases recruitment of the transcription factor CEBPB to the enhancer and alters the level of direct interactions between the enhancer and DPYD promoter. Our data provide insight into the regulatory mechanisms controlling sensitivity and resistance to 5-FU.


