Nanodomain coupling explains Ca2+ independence of transmitter release time course at a fast central synapse
- IST Austria (Institute of Science and Technology Austria), Austria
Figures
Figure 1

Fast and synchronous transmitter release at BC–PC synapses in the cerebellum is exclusively mediated by P/Q-type Ca2+ channels.
(A) Light micrograph of a cerebellar basket cell filled with biocytin during recording and labeled using 3,3′-diaminobenzidine as chromogen. Similar morphological properties were obtained in 29 other biocytin-labeled cerebellar BCs. (B) Plot of IPSC peak amplitude (top) and corresponding series resistance (bottom) against time during recording. Action potentials were evoked in the presynaptic cell at time intervals of 4 s. Note that evoked IPSC shows only little rundown for more than 40 min with stable series resistance. (C) Presynaptic action potentials evoked in the whole-cell current clamp configuration (top) and evoked IPSCs (bottom) recorded at ∼22°C (left) and ∼34°C (right). 10 consecutive individual traces (gray) and the corresponding average trace (black) are shown superimposed. (D) Summary bar graph. Left, latency (time between steepest point in the rising phase of the presynaptic action potential and IPSC onset) at ∼22°C and ∼34°C. Right, standard deviation of latency, a measure of synchrony of transmitter release. Bars indicate mean ± SEM; solid circles represent data from individual experiments (∼22°C: 24 pairs; ∼34°C: 5 pairs). (E) IPSCs in a BC–PC pair before (left) and after (right) application of 1 µM of the selective P/Q-type Ca2+ channel blocker ω-agatoxin IVa. Synaptic transmission was almost completely blocked. Top, presynaptic action currents evoked in the cell-attached voltage-clamp configuration; bottom, corresponding IPSCs. 10 consecutive individual traces (gray) and the corresponding average trace (red) are shown superimposed. (F) Similar recording as shown in (E), but with 1 µM of the selective N-type Ca2+ channel blocker ω-conotoxin GVIa. (G) Plot of IPSC peak amplitude against time during application of 1 µM of ω-agatoxin IVa (red) or ω-conotoxin GVIa (blue). The time of application of the different extracellular solutions is represented by horizontal bars. Black: mock application of control solution. Symbols indicate mean; error bars represent SEM. (H) Summary bar graph of the effects of Ca2+ channel blockers. Bars indicate mean ± SEM; solid circles represent data from individual experiments (control: 4 pairs; ω-agatoxin IVa: 4 pairs; ω-conotoxin GVIa: 5 pairs). To achieve maximal stability, presynaptic BCs were noninvasively stimulated in the cell-attached configuration in all experiments. * and ** indicate p < 0.05 and 0.01, respectively. All experiments except subsets in (C), (D) were performed at ∼22°C.
Figure 2 with 2 supplements

Changes in [Ca2+]o affect peak release rate, but leave the TCR unaffected at the cerebellar BC–PC synapse.
(A) Presynaptic action potential (top) and evoked IPSCs (bottom) in different [Ca2+]o. 10 consecutive individual traces (gray) and the corresponding average trace (red, 1 mM [Ca2+]o; black, 2 mM; blue, 4 mM) are shown superimposed. Inset shows quantal IPSCs; 10 individual IPSCs recorded in 0.7 mM [Ca2+]o (gray) and the corresponding average trace (green) are shown superimposed. (B) Relationship between IPSC peak amplitude and [Ca2+]o. IPSC amplitudes were normalized to the value at 2 mM [Ca2+]o and averaged across pairs. Top, linear–logarithmic representation. Data were fit with a Hill equation, yielding a maximal value (a) of 3.73, a half-maximal effective concentration (EC50) of 3.09 mM, and an average Hill coefficient (n) of 2.39. Bottom, double-logarithmic plot; data points for [Ca2+]o ≤ 2 mM were analyzed by linear regression, yielding a Hill coefficient of 3.02 in the low concentration limit. (C) Relationship between peak amplitude of IPSC successes and [Ca2+]o. Symbols indicate mean, error bars represent SEM. The peak amplitude of the successes reaches a constant level below 1 mM [Ca2+]o, suggesting that the level of quantal IPSCs was reached. (D) TCR in different [Ca2+]o obtained by deconvolution. Top, presynaptic action potential. Middle, average evoked IPSCs in different [Ca2+]o. Bottom, TCR in different [Ca2+]o. Inset, expanded waveforms of the TCR (red, 1 mM [Ca2+]o; black, 2 mM; blue, 4 mM; gray, fit Gaussian curves). Data in (A) and (D) are from the same pair. (E) Peak release rate (top), half-duration (middle), and decay time course of release period (bottom) plotted vs [Ca2+]o. Open circles connected by lines indicate mean ± SEM; solid circles indicate data from individual experiments (0.7 mM: 5 pairs; 1 mM: 7 pairs; 2 mM: 11 pairs; 4 mM: 5 pairs). All experiments were performed at ∼22°C. (Also see Figure 2—figure supplement 1,2).
Figure 2—figure supplement 1

Lowering temperature slows TCR, but leaves its [Ca2+]o independence unaffected.
(A) Presynaptic action potential (top) and evoked IPSCs (bottom) in different [Ca2+]o at ∼12°C. 10 consecutive individual traces (gray) and the corresponding average trace (red, 1 mM [Ca2+]o; black, 2 mM; blue, 4 mM) are shown superimposed. (B) Quantal IPSCs at ∼12°C. 10 individual IPSCs recorded in 1 mM [Ca2+]o (gray) and the corresponding average trace (green) are shown superimposed. Note that the action potentials, evoked IPSCs, and quantal IPSCs are markedly slower than those obtained at ∼22°C (compare with Figure 2A,C). (C) TCR in different [Ca2+]o obtained by deconvolution at ∼12°C. Top, presynaptic action potential. Middle, average evoked IPSCs in different [Ca2+]o. Bottom, TCR in different [Ca2+]o (red, 1 mM [Ca2+]o; black, 2 mM; blue, 4 mM). Data in (A)–(C) are from the same pair. (D) Summary bar graph of half-duration of TCR in different [Ca2+]o at ∼12°C. Bars indicate mean ± SEM; solid circles represent data from individual experiments (5 pairs).
Figure 2—figure supplement 2

TCR is unlikely to be distorted by postsynaptic receptor saturation or desensitization.
(A) Presynaptic action potential (top) and evoked IPSCs in 4 mM [Ca2+]o (bottom) before and after application of 300 µM of the low-affinity GABAA receptor antagonist TPMPA. 2 µM CGP55845 were added during the entire experiment to block GABAB receptors. 10 consecutive individual traces (gray) and the corresponding average trace (black, control; red, TPMPA) are shown superimposed. (B) Summary bar graph of IPSC peak amplitude in control and 300 µM TPMPA. Bars indicate mean ± SEM; solid circles represent data from individual experiments; lines indicate measurements taken from the same experiment (control: 12 pairs; TPMPA: 6 pairs). (C) TCR in 300 µM TPMPA obtained by deconvolution. Top, presynaptic action potential. Middle, average evoked IPSC. Bottom, TCR. Inset, average quantal IPSC obtained in 300 µM TPMPA. Data in (A) and (B) were obtained from different pairs. (D) Summary bar graph of half-duration of TCR in control and 300 µM TPMPA. Bars indicate mean ± SEM; solid circles represent data from individual experiments (control: 8 pairs; TPMPA: 6 pairs; p = 0.38). In all experiments, [Ca2+]o was 4 mM (presumably maximizing the confounding effects of postsynaptic factors) and the recording temperature was ∼22°C.
Figure 3 with 1 supplement
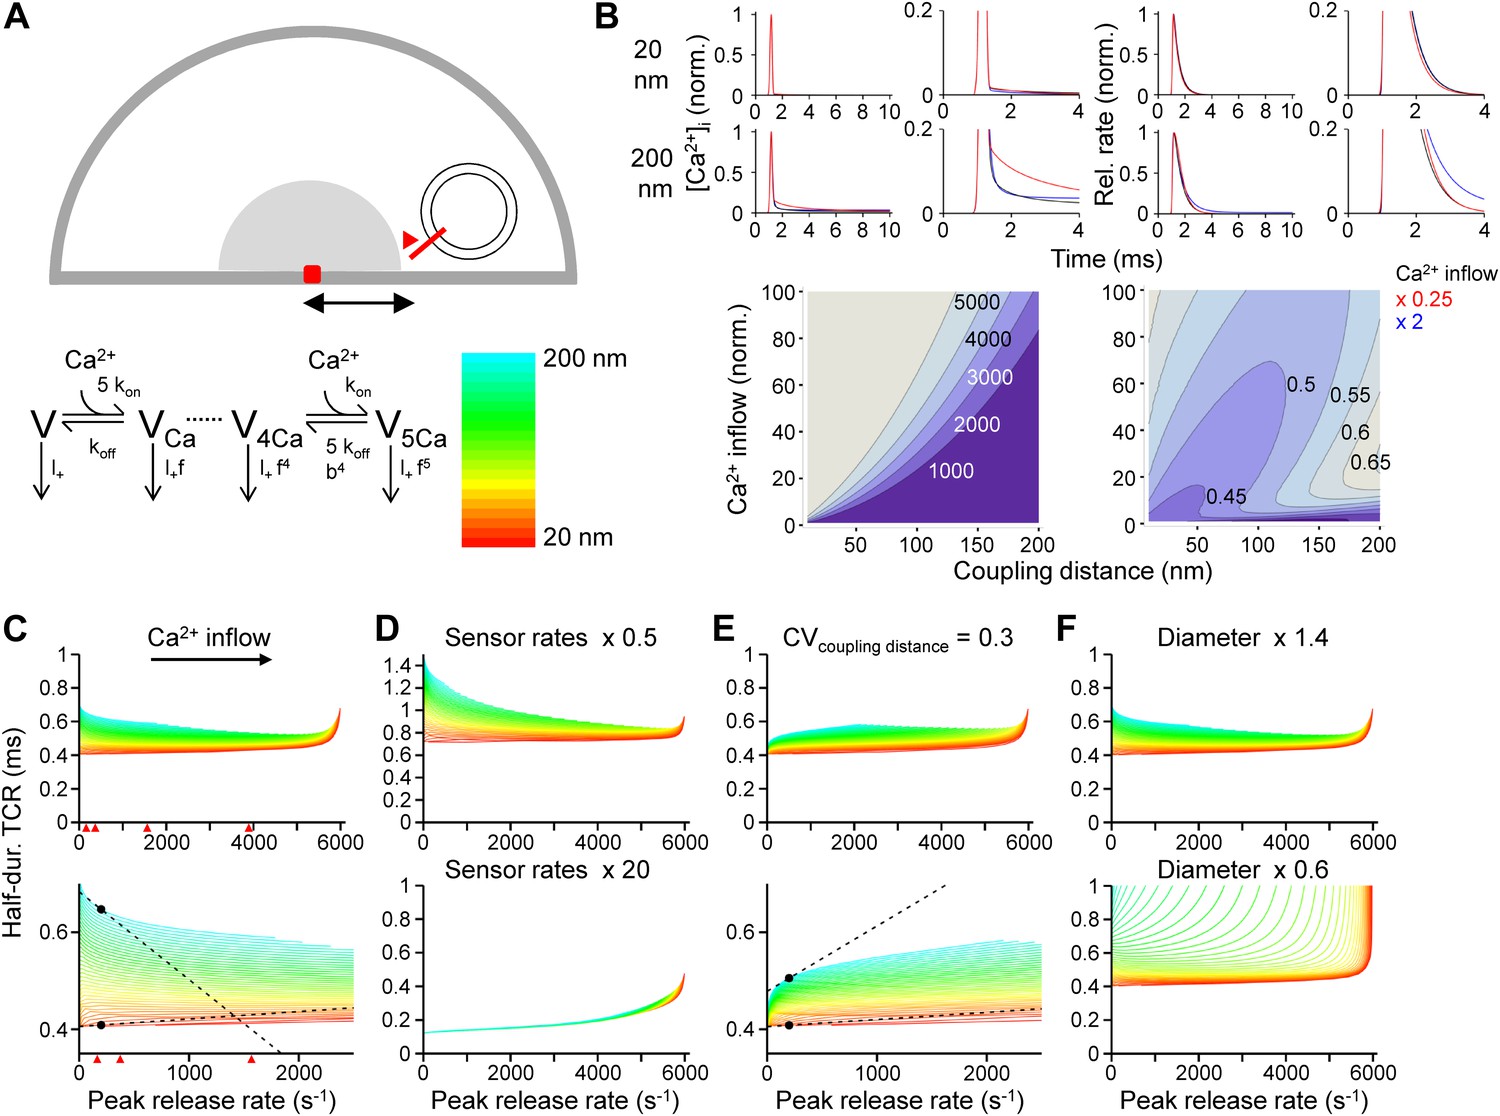
Tight Ca2+ channel–release sensor coupling reduces the [Ca2+]o dependence of the TCR in a release model.
(A) Schematic illustration of the release model. Top, location of Ca2+ source and release sensor within a schematic presynaptic terminal; bottom left, Ca2+ sensor model; bottom right, color code indicating coupling distance in subsequent plots (C–F). The presynaptic terminal was modeled as a hemisphere. Ca2+ inflow was generated by a point source in the center (red square and surrounding shaded area). The release sensor was placed at variable distance from the source (red line). Ca2+ transients were calculated as the numerical solution to the full set of partial differential reaction-diffusion equations (Smith, 2001). Transmitter release was computed using a modified version of a previously described sensor model (Lou et al., 2005). kon and koff are Ca2+-binding and unbinding rates, l+ is basal release rate, and f and b are the cooperativity factors for release and Ca2+ unbinding, respectively. (B) Left, [Ca2+]i plotted vs time. Right, corresponding release rate. Top, tight coupling (20 nm); bottom, loose coupling (200 nm distance). Black: default Ca2+ inflow (3.5 and 104.4 Ca2+ channel equivalents, leading to a vesicular release rate of ∼2000 s−1 in both cases); red: reduced Ca2+ inflow (x 0.25); blue: increased Ca2+ inflow (x 2). Bottom, contour plots of peak release rate (left) and half-duration of the TCR (right), plotted vs coupling distance (horizontal axis) and Ca2+ inflow (vertical axis, normalized to that of single Ca2+ channel). Numbers right-adjacent to the contour lines indicate peak release rate and half-duration of the TCR, respectively. Bouton diameter 1.0 µm. (C) Plot of half-duration of the TCR vs peak release rate for different coupling distances (individual curves for 10 to 200 nm in 5 nm steps; scale bar for color in (A)). Bottom graph shows expansion. Bouton diameter 1.0 µm. Red arrowheads indicate peak release rates at 0.7, 1, 2, and 4 mM [Ca2+]o, estimated from the IPSC–[Ca2+]o curve in Figure 2B. (D) Half-duration of TCR–peak release rate relations for different sensor rates. Default sensor rates were slowed (x 0.5) or accelerated (x 20, to make the kinetics of the release sensor very fast in comparison to all other processes). (E) Half-duration of TCR–peak release rate relations for variable coupling distance (CV of 0.3). Bottom graph shows expansion. (F) Half-duration of TCR–peak release rate relations for different bouton diameters. Dashed lines and points in (C) and (E) indicate the slope of the TCR–peak release rate relations for 20 nm and 200 nm coupling distance at a release rate of 200 quanta s−1. Note that the absolute value of the slope is ∼12 times and ∼7 times higher, respectively, for loose than for tight coupling. Also see Figure 3—figure supplement 1.
Figure 3—figure supplement 1

Effects of concentration and affinity of the endogenous fixed buffer on the [Ca2+]o dependence of the TCR in the release model.
(A) Plot of half-duration of the TCR vs peak release rate for different coupling distances in a model with increased concentration of the endogenous fixed buffer (0.5 mM). Red arrowheads indicate peak release rates at 0.7, 1, 2, and 4 mM [Ca2+]o, estimated from the IPSC–[Ca2+]o curve in Figure 2B. (B) Plot of half-duration of the TCR vs peak release rate for different coupling distances in a model with reduced Ca2+-unbinding rate of the fixed buffer (koff, 40 s−1; Eggermann and Jonas, 2012). Individual curves were drawn for coupling distances ranging from 10 to 200 nm in 5 nm steps; scale bar for color shown in Figure 3A. Bouton diameter 1.0 µm in all simulations. Bottom graph shows expansion. Dashed lines and points indicate the slope of the TCR–peak release rate relations for 20 nm and 200 nm coupling distance at a release rate of 200 quanta s−1. Note that the absolute value of the slope is higher for loose than for tight coupling in all cases.
Figure 4

Nanodomain coupling between Ca2+ channels and release sensors at the cerebellar BC–PC synapse.
(A) Presynaptic action potentials and evoked IPSCs recorded immediately after presynaptic BC break-in (left), 20 min after break-in to load 3 mM BAPTA into presynaptic terminals (middle), and after the presynaptic recoding pipette was changed to one containing control solution (right). 10 consecutive individual traces (gray) and the corresponding average trace (red) are shown superimposed. (B) Time course of the effect of 1 mM (○, 5 pairs), 3 mM (△, 4 pairs) and 10 mM (▿, 5 pairs) BAPTA. Data from each pair were normalized to the average amplitude obtained from the first 20 consecutive traces and averaged across pairs. (C) Similar recording as shown in (A), except that the internal solution for the presynaptic BC contained 30 mM EGTA. (D) Time course of the effect of 0.1 mM (○, control, 4 pairs), 10 mM (△, 5 pairs) and 30 mM (▿, 6 pairs) EGTA. In all experiments included in (B) and (D), the presynaptic BC was patched twice to demonstrate recovery. Symbols indicate mean, error bars represent SEM. (E) Plot of steady-state effects of chelators on IPSC peak amplitude against chelator concentration for BAPTA (red circles) and EGTA (blue circles). Curves represent Hill equations fit to the data points. IC50 values were 0.6 mM and 16.0 mM, Hill coefficients were 0.96 and 1.51, respectively. (F) Same data, fit with linearized models of Ca2+ diffusion and buffering (continuous curve, constant coupling distance; small dashing, half-normally distributed coupling distance; large dashing, skewed-normally distributed coupling distance; corresponding distributions shown as insets on the right). For the single-channel model, the coupling distance was estimated as 11.4 nm. For the half-normal distribution, the standard deviation was 10.5 nm (expectation value 13.9 nm; skewness 1.0). For the skewed-normal distribution, location, scale, and shape parameter were 13.7 nm, 8.6 nm, and −1.11, respectively (expectation value 10.1 nm; skewness 0.40). (G) Statistical errors. Histogram of coupling distance estimates in 1000 bootstrap replications. (H) Systematic errors. Plot of coupling distance against resting Ca2+ concentration and endogenous buffer product. Red point indicates default parameter values. In (G) and (H), the model with constant coupling distance was used. All experiments were performed at ∼22°C.
Download links
A two-part list of links to download the article, or parts of the article, in various formats.
Downloads (link to download the article as PDF)
Open citations (links to open the citations from this article in various online reference manager services)
Cite this article (links to download the citations from this article in formats compatible with various reference manager tools)
Nanodomain coupling explains Ca2+ independence of transmitter release time course at a fast central synapse
eLife 3:e04057.
https://doi.org/10.7554/eLife.04057


