Tuning the speed-accuracy trade-off to maximize reward rate in multisensory decision-making
- University of Rochester, United States
- École Normale 12 Supérieure, France
- Université de Genève, Switzerland
- Baylor College of Medicine, United States
Figures
Figure 1
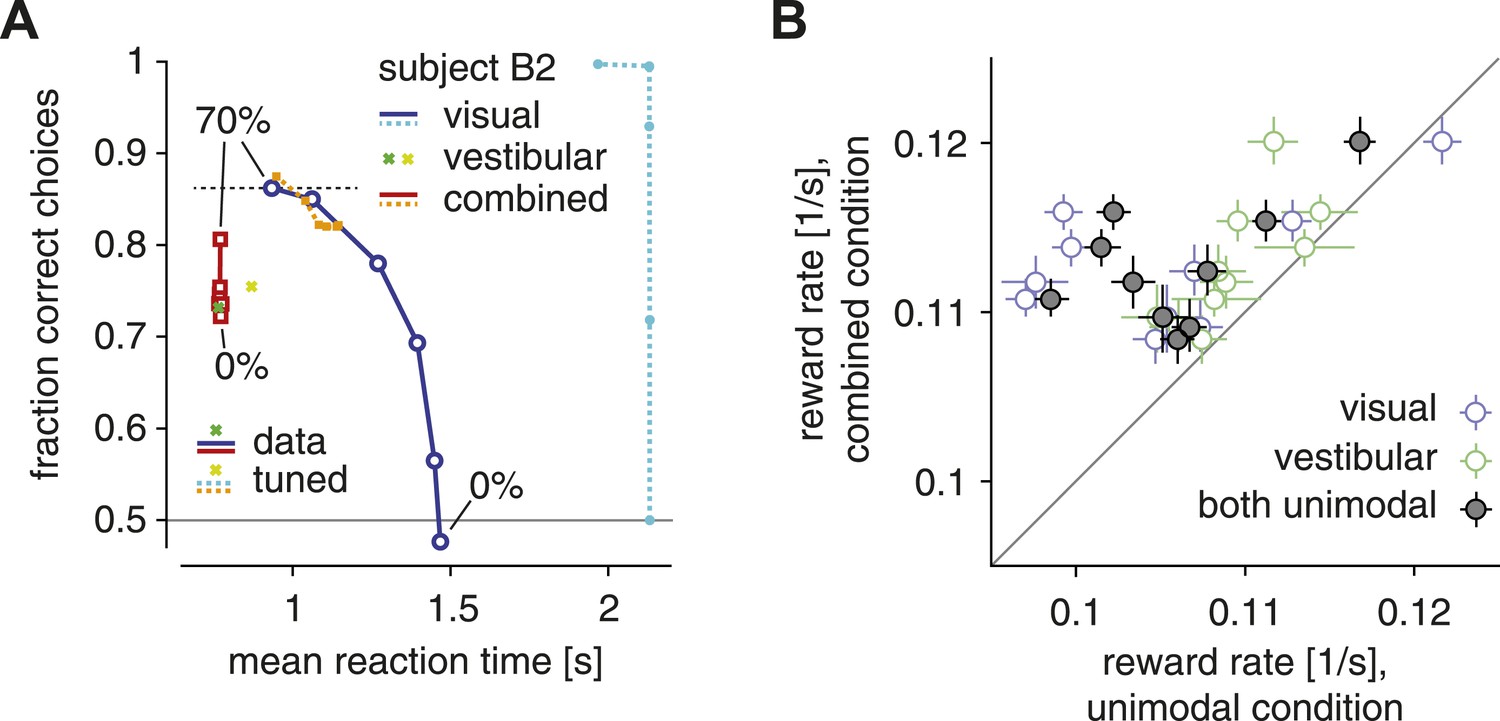
The SAT and reward rate for unimodal vs combined conditions.
(A) Fraction of correct choices is plotted as a function of mean reaction time for subject B2. Blue/cyan: visual condition; green/lime: vestibular condition; red/orange: combined condition. Solid: data; dashed: model with parametric bound tuned to maximize reward rate. Motion coherence varies across data points in the red/orange and blue/cyan curves. The tuned model generally predicts slower and more accurate choices in the visual condition, leading to the longest-possible reaction time (2 s stimulus time + non-decision time) for all but the highest stimulus coherence. (B) Reward rate for trials of the combined condition is plotted against reward rate for trials of the visual condition (open blue symbols), the vestibular condition (open green symbols) and both unimodal conditions in combination (gray filled symbols). Reward rates are computed as number of correct decisions per unit time for the respective trial subgroups, and are shown for each subject separately, with bootstrapped 95% confidence intervals.
Figure 2
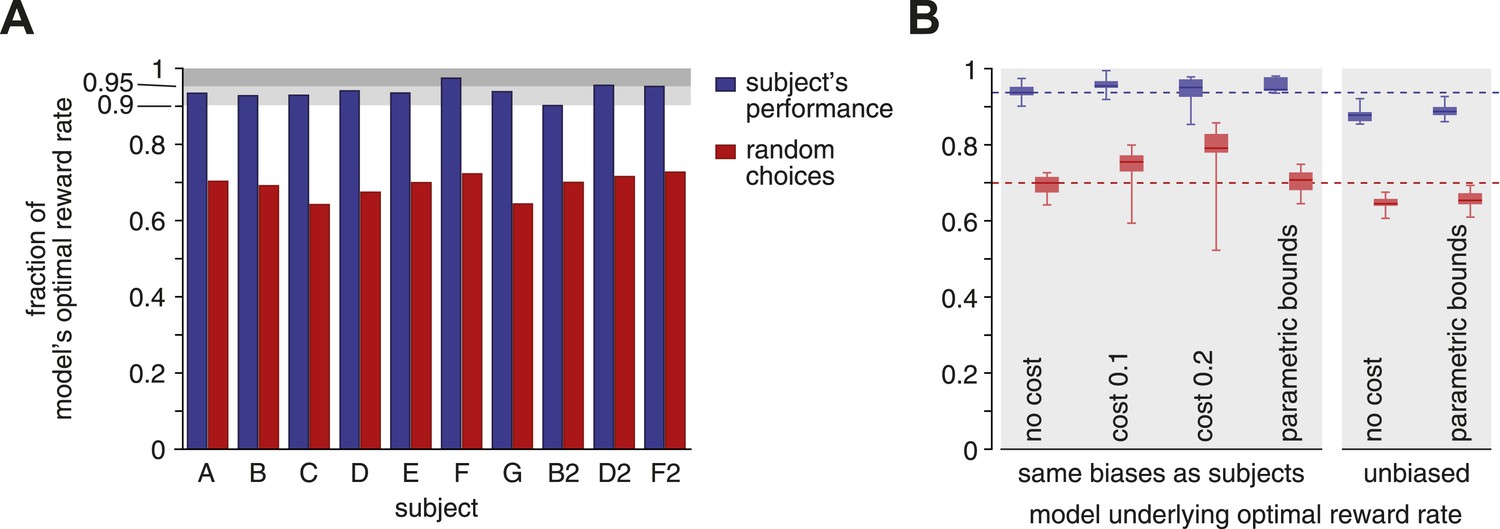
Reward rates of subjects relative to the optimal reward rate.
The optimal reward rate is the best reward rate achievable by a model with tuned decision bounds. (A) Each subject's reward rate is shown as a fraction of the optimal reward rate (blue bars). In addition, the expected reward rate is shown for immediate random decisions (red bars). (B) Box-plots show relative reward rates for different assumptions regarding how reward rate is computed. ‘no cost’ corresponds to the case shown in panel A. ‘cost 0.1’ and ‘cost 0.2’ assume a cost per second for accumulating evidence over time. ‘parametric bounds’ uses the original bounds from Drugowitsch et al. (2014), rather than a separate bound parameter for each modality and coherence. The last two bars (‘unbiased’) remove the subjects' decision biases before computing the optimal reward rate. All box-plots show the maximum/minimum relative reward rates (whiskers), the 25% and 75% percentiles (central bar), and the median (central line) value across subjects. Data are shown for the subjects' reward rates (blue) and for immediate random choices (red).
Figure 3
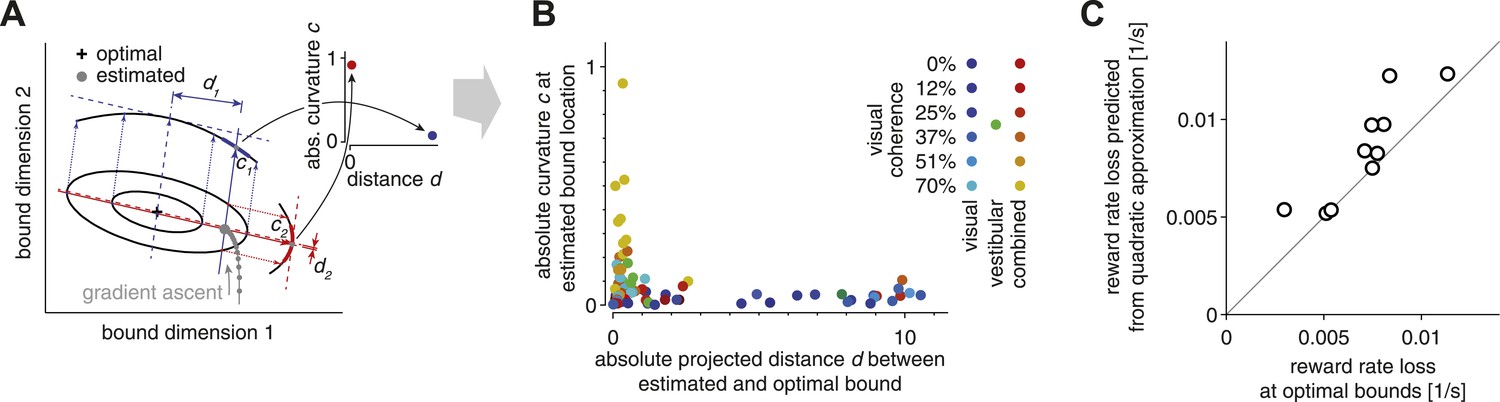
Evidence for bound mistuning due to incomplete gradient-based learning.
(A) The effects of incomplete gradient ascent on the relation between projected bound distance and local curvature (that is, second derivative of the reward rate at estimated bound) are illustrated for a fictional maximization problem with only two bounds. The grey trajectory shows a sequence of gradient ascent steps on the reward rate function, whose shape is illustrated by two iso-reward rate contours (black) around its maximum (cross). Stopping this gradient ascent procedure (large grey filled circle) before it reaches the optimum causes this stopping point to be close to the optimal bound in directions of large curvature (red), and farther away from the optimum in directions of shallow curvature (blue). (B) Curvature at the estimated bound location is plotted against the distance between the estimated and optimal bound (see text for details). This plot includes 7 (3 coherence condition) or 13 (6 coherence condition) data points per subject, one for each modality/coherence combination. Data for the visual, vestibular and combined conditions are shown in shades of blue/cyan, green, and red/yellow, respectively, and motion coherence is indicated by color saturation. (C) The reward rate loss (i.e., optimal model reward rate minus subject's reward rate) as estimated from the model (abscissa) is plotted against the loss predicted by the quadratic approximation used in the analysis in (A)–(B), for each subject (ordinate). If the reward rate has a quadratic dependence on the bounds, then all the data points would lie along the diagonal. Small deviations from the diagonal indicate that the reward rate is indeed close-to-quadratic in these bounds.
Figure 4

Subjects' bound settings relative to the optimal bound.
(A) The curves show how the reward rate changes with a simultaneous, linear change of all bounds. From left to right, bound levels increase from zero to the (reward-rate maximizing) optimal bound levels (unity values on the abscissa), and continue to bound levels well above this optimum. Different colors correspond to different assumptions about the cost for accumulating evidence over time. The optimal bound levels (unity values on the abscissa) that maximize the reward rate depend on these costs, and thus differ between the three curves. The empirical bound level estimates for individual subjects do not lie on the straight line that is defined by the simultaneous, linear change of all optimal bounds. To evaluate where these empirical bounds lie with respect to the optimal bounds, we found the closest point (along contours of equal reward rate) on this line for the empirical bounds. These points are shown for subject A for different costs by the filled circles. (B) The closest points are illustrated for all subjects, for different accumulation costs. As can be seen, for any assumption for this cost, the subjects' bounds are well below the optimal settings.
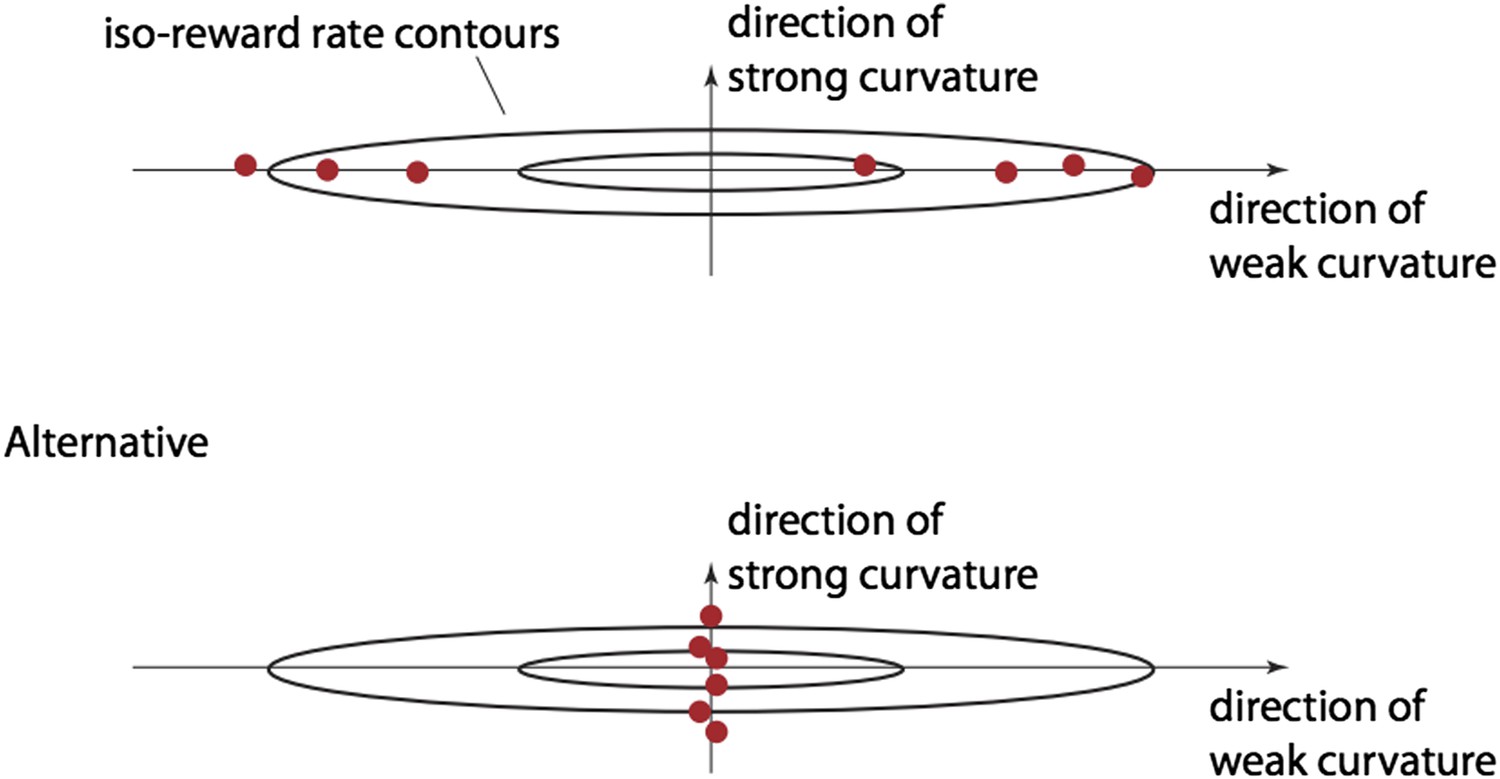
Author response image 1
Download links
A two-part list of links to download the article, or parts of the article, in various formats.
Downloads (link to download the article as PDF)
Open citations (links to open the citations from this article in various online reference manager services)
Cite this article (links to download the citations from this article in formats compatible with various reference manager tools)
Tuning the speed-accuracy trade-off to maximize reward rate in multisensory decision-making
eLife 4:e06678.
https://doi.org/10.7554/eLife.06678


