Acknowledging selection at sub-organismal levels resolves controversy on pro-cooperation mechanisms
- Fred Hutchinson Cancer Research Center, United States
Figures
Figure 1
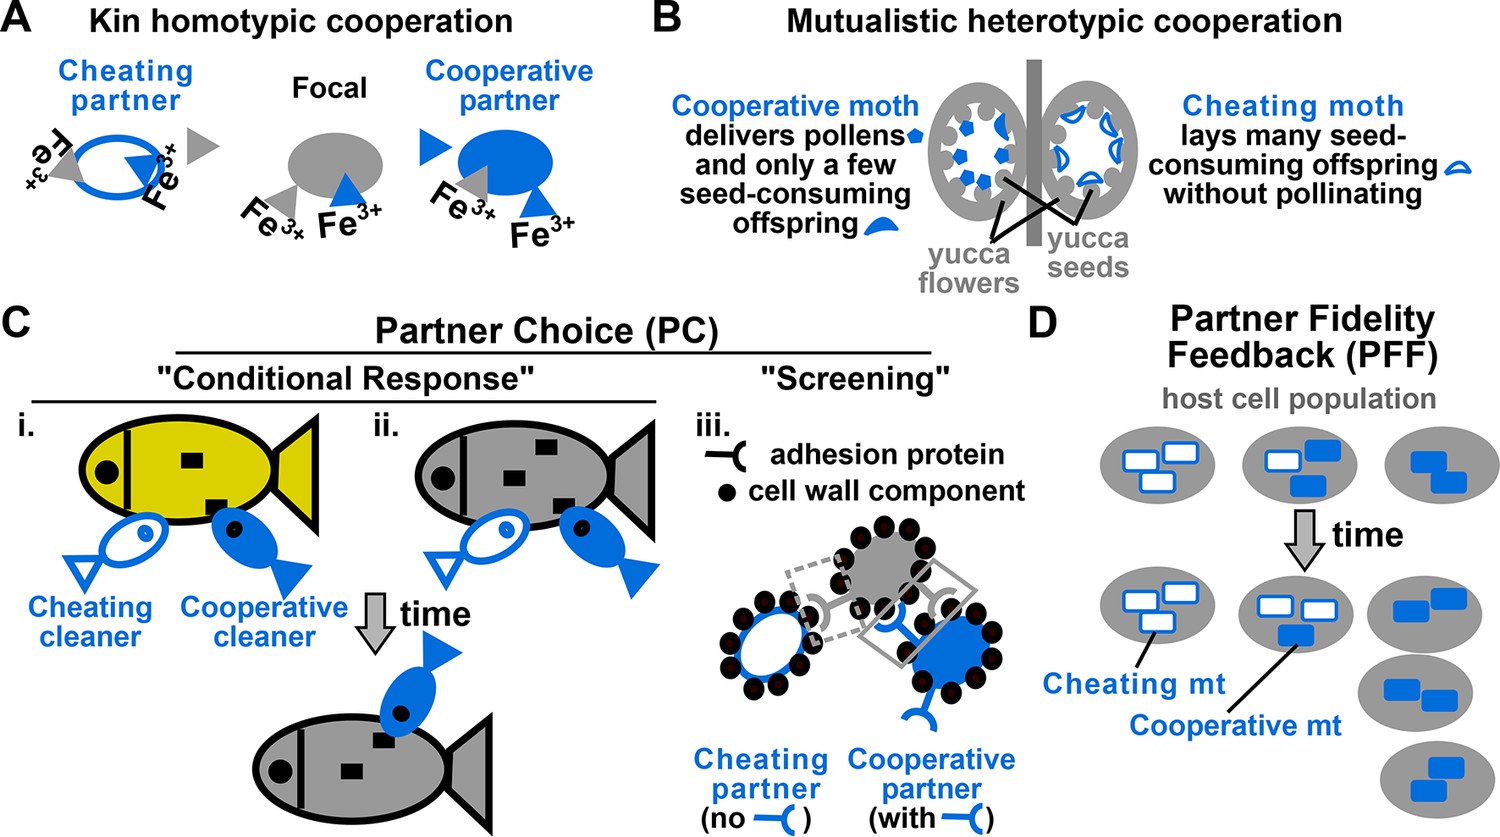
Examples of cooperation, cheating, partner choice (PC), and partner fidelity feedback (PFF).
(A) An example of homotypic (sharing an identical benefit) and kin (between genetic relatives) cooperation, and cheating. During iron limitation, a focal cooperative Pseudomonas aeruginosa cell (grey filled oval) pays a fitness cost to synthesize siderophores (grey triangles, color indicating origin) which are released into the environment to scavenge iron. Siderophore-Fe3+ complex can be taken up by the focal bacterium and partner cells. A cooperative partner (blue filled oval) also contributes siderophores which can be used by the focal cooperator. In contrast, a cheating partner (blue unfilled oval) uses siderophores without contributing any, and is competitively superior to cooperators (Griffin et al., 2004). (B) An example of heterotypic (exchanging different benefits) and mutualistic (between different species) cooperation, and cheating. In the obligatory cooperation between a yucca (grey) and yucca moths, moths can cooperate (left) or cheat (right). (C) In PC, a focal individual (grey) displays different responses ('conditional response', i and ii) or a fixed response ('screening', iii) that favors cooperative over cheating partners. (i and ii) A focal client (grey, bottom) will preferentially visit a cleaner (smaller blue fish) if the cleaner previously cooperated with (filled blue) instead of cheated (unfilled blue) another client (yellow, top) (Bshary and Grutter, 2006) or the focal client itself (grey, top) (Bshary and Schäffer, 2002). Cooperative cleaners only eat parasites (black squares), while cheating cleaners bite off nutritious client tissue. Thus, PC can operate before (i) or after (ii) interactions with partners. (iii) A focal cooperative yeast cell (grey) pays a fitness cost to express cell surface adhesive proteins. The focal adhesive cell will bind better to other adhesive cooperators (filled blue) than to non-adhesive cheaters (unfilled blue). This differential binding (solid versus dashed grey box) favors cooperation between adhesive cells, and allows the formation of cell clumps with enhanced stress resistance (Smukalla et al., 2008). (D) Cooperation between hosts (grey) and endosymbionts such as mitochondria (blue) has been traditionally used to illustrate PFF (Sachs et al., 2004; 2011). Cooperative mitochondria (filled blue) serve the host cell at a cost to their own reproduction, and are therefore displaced by cheating mitochondria (unfilled blue) in the same cell (center panel). However, vertical transmission of mitochondria means that host and mitochondria repeatedly interact with each other. This ensures that mitochondria will harm their own fitness if they do not serve their host (compare left with right). Consequently, cooperative mitochondria can persist (compare bottom with top) if their frequency varies greatly among different hosts. For this and all following figures, filled and unfilled symbols differentiate cooperative versus cheating partners.
Figure 2
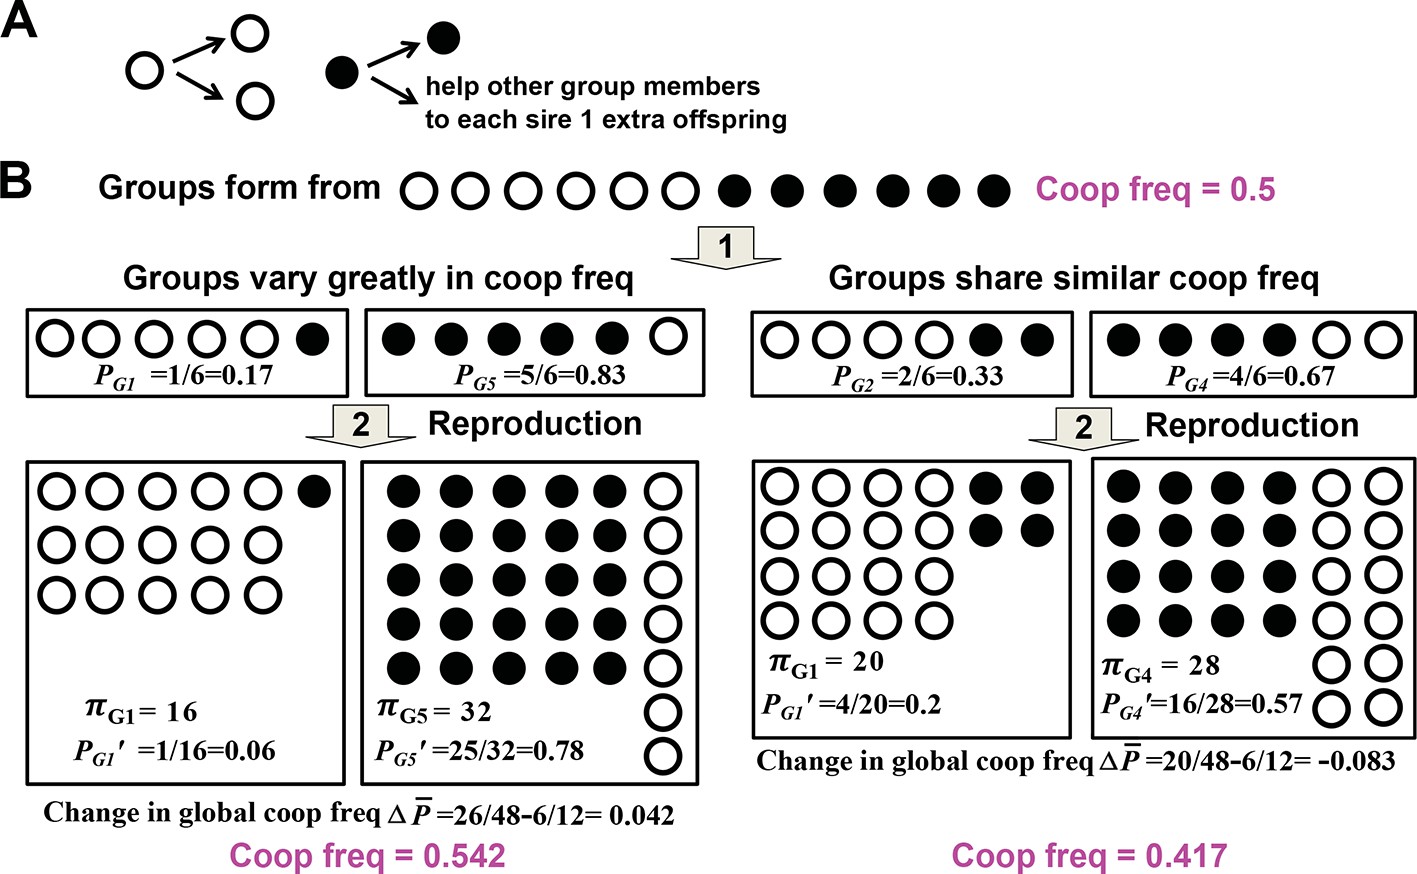
Variability in group cooperator frequency promotes cooperation.
(A) Rules of interactions: A cooperator (filled circle) gives birth to a cooperator and helps each of the rest of group members to sire one additional offspring before dying. A cheater (unfilled circle) gives birth to two cheaters and offers no help to other group members before dying. (B) Community-wide cooperator frequency can increase over time when groups vary significantly in their cooperator frequencies (left), but not when they share similar cooperator frequencies (right). Suppose that after group formation and interactions and reproduction of individuals in a group, a group with initial cooperator frequency P will have final size π and final cooperator frequency of . The Price equation states that , where is the average final group size, is the difference between and , the final and initial community-wide cooperator frequency, respectively. , the covariance between final group size and initial cooperator frequency of group, should be positive. It may be rewritten as βVar(P), and should increase as Var(P), the variance in initial cooperator frequency P across groups, increases. reflects , the change in cooperator frequency in each group, and should thus be negative. Consequently, for community-wide cooperator frequency to increase, the absolute value of must exceed that of . A numerical demonstration of the Price Equation is provided below. In the case on the left, two groups form. The group starting with 1 cooperator (G1) has an initial cooperator frequency of PG1=1/6, and ends up with final group size πG1= 16 and final cooperator frequency PG1’=1/16. The group starting with 5 cooperators (G5) has an initial cooperator frequency of PG5=5/6, and ends up with final group size πG5= 32 and final cooperator frequency PG5’=25/32. The average group size is (16+32)/2=24 while the change in global cooperator frequency is =26/48−6/12=0.042. Thus, is 1. , where E[X] represents the expected value of X. Here, 1 out of 2 groups started with 1 cooperator and 1 out of 2 groups started with 5 cooperators. Thus, ; . Hence, is also 1, equal to . This figure is simplified from a lecture given by Prof. Benjamin Kerr (University of Washington, Seattle).
Figure 3
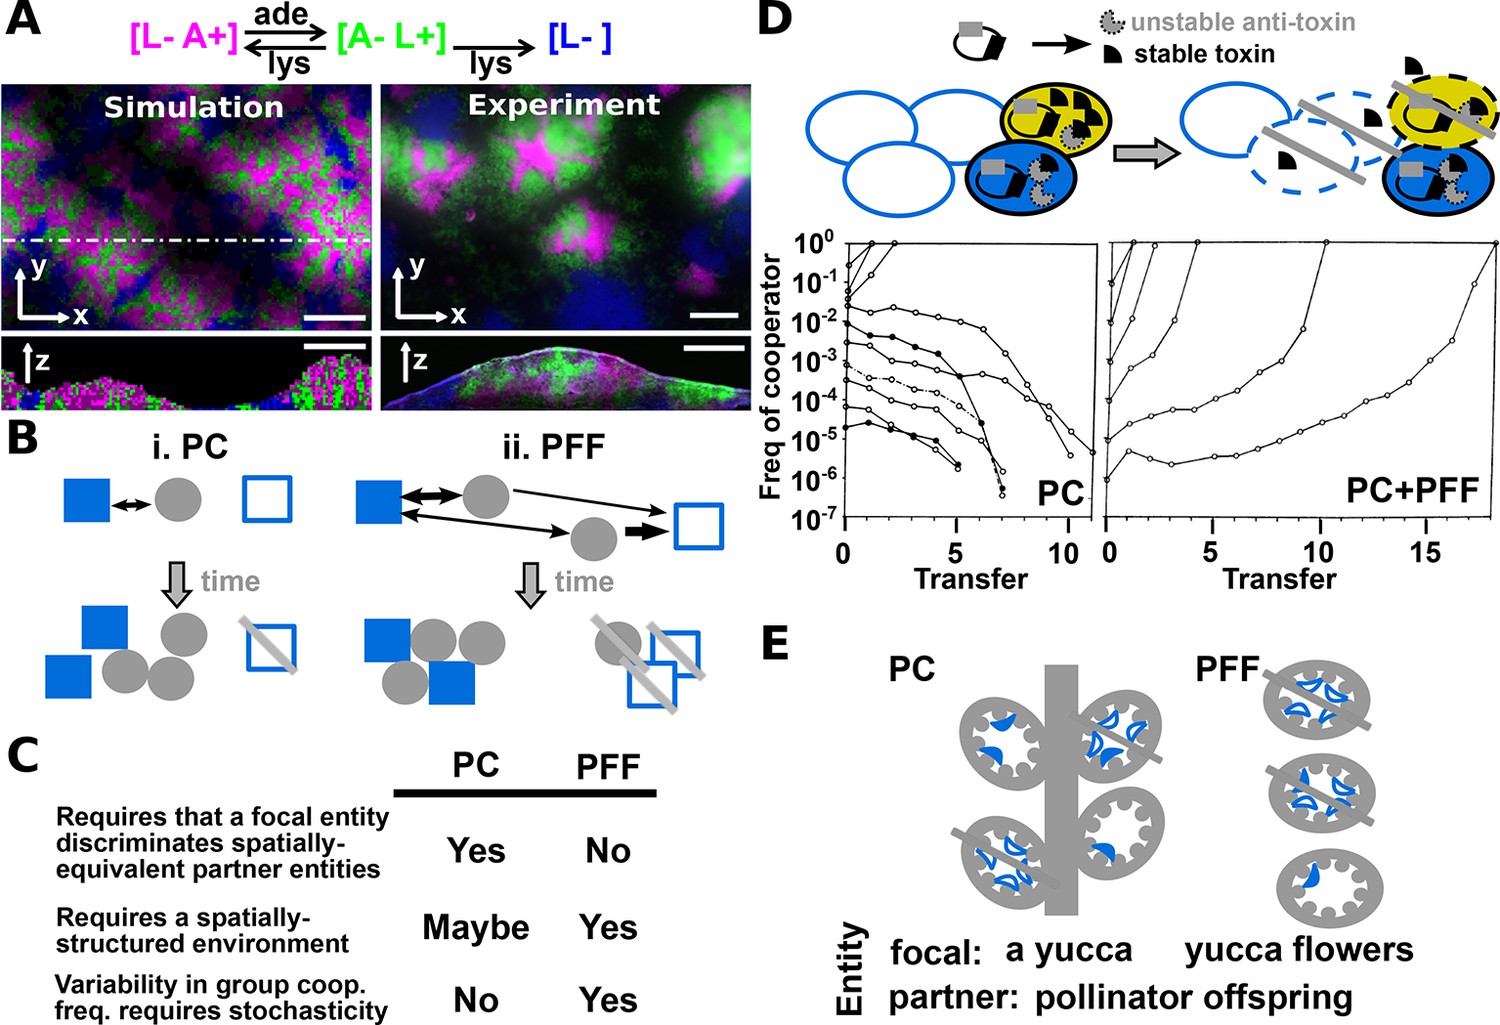
Revised definitions of PC and PFF.
(A) Adapted from Figure 3 in (Momeni et al., 2013) by B. Momeni. [L− A+], [A− L+], and [L−] are reproductively isolated yeast cells expressing different fluorescent proteins. On an agarose pad lacking adenine and lysine supplements, [A− L+] (green) and its cooperative [L− A+] (magenta) and cheating [L−] (blue) partners undergo self-organization from an initially random spatial distribution. [A− L+] and [L− A+] physically associate with each other and grow tall. [L−], isolated from [A− L+], fail to grow tall. ‘xy’: top-views; ‘z’: vertical sections. In simulated top-views, higher color intensity indicates a greater number of cells. In simulated vertical cross-sections, low and high color intensities represent dead and live cells, respectively. Scale bar: 100 μm. (B) In PC (i), a focal cooperative entity (grey filled circle) preferentially directs cooperative benefits to cooperative over cheating partner entities (filled and unfilled blue squares, respectively) despite their spatially equivalence. In PFF (ii), such discrimination does not exist. Instead, cooperative benefits are more available toward partner entities closer-by regardless of their cooperativeness. Beneficial interactions are marked by black arrows, with directions of benefit flow marked by arrowheads and interaction strength marked by line thickness. (C) A comparison of PC and PFF. (D) Top: Anti-competition cooperation in bacteria. Cooperators (filled ovals) but not cheaters (unfilled ovals) harbor toxin-antitoxin gene pair. Cooperators grow slower than cheaters. When encountering stress such as high cell density, a fraction of cooperators will 'commit suicide' (yellow) by lysing themselves (dashed outline) and release stable toxin (black). The remaining cooperators (filled blue) are immune to toxin because they express antitoxins (grey), while cheaters (unfilled blue) are sensitive to toxin-killing (dashed outline). This cell killing reduces competition, a benefit shared among surviving cooperators (filled blue) and cheaters (unfilled blue, solid outline). Bottom left: When PC acts alone in a well-mixed environment, cooperators can increase in frequency only if their initial abundance is sufficiently high. To see how this works, suppose that whenever total population size has reached 250, 10% of cooperators will commit suicide, and each suicidal cooperator can kill 2 cheaters. If starting at 210 cooperators and 40 cheaters, all cheaters will be killed off. However, if starting at 50 cooperators and 200 cheaters, the cheater population will diminish by 10 individuals (5%) only, compared to the 10% reduction in cooperators. Bottom right: In a spatially-structured environment, the joint action of PC and PFF favors cooperators even when cooperators are initially very rare. Data figures are reproduced from Chao and Levin’s work (Chao and Levin, 1981) with full permission from the authors. (E) Yucca flowers (grey ovals) dominated by cheating (unfilled blue crescent) but not cooperative (filled blue crescent) pollinator offspring are aborted. This mechanism can be interpreted as PC between a focal yucca plant and its internal, spatially-equivalent pollinator offspring (left) or PFF between yucca flowers and pollinator offspring (right). For simplicity, pollens delivered by cooperative moths are omitted from this figure. Grey cross-bar: death of an entity.
Figure 4
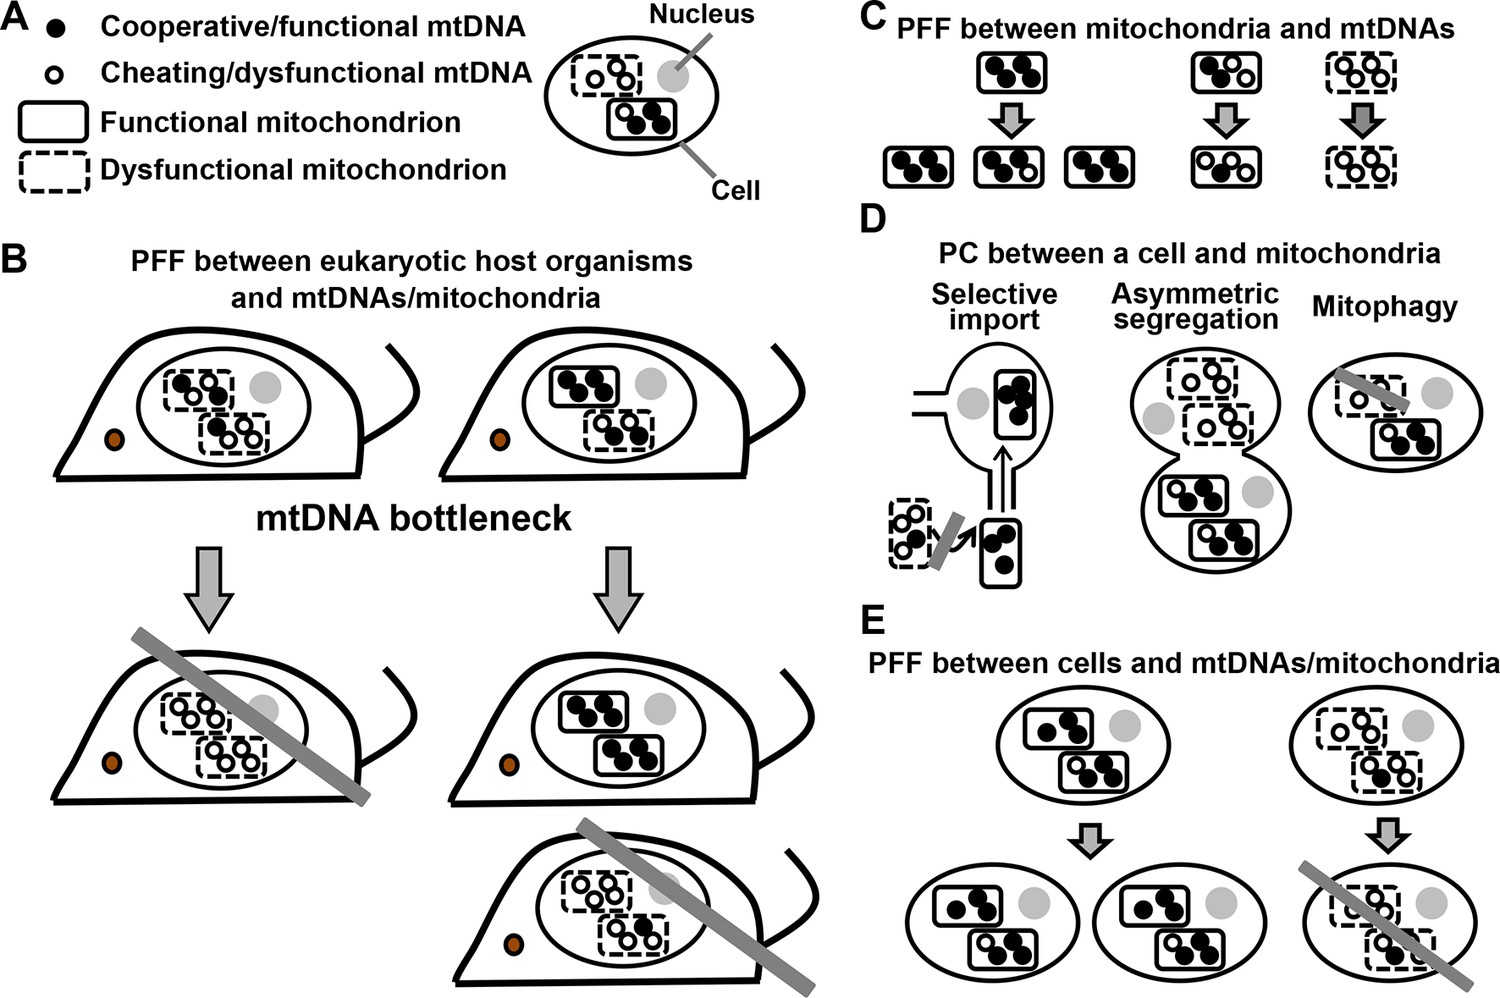
PFF and PC act at multiple levels in the mutualistic cooperation between mitochondria and multicellular eukaryotes.
(A) An eukaryotic cell contains multiple mitochondria (dashed versus solid boundaries representing dysfunctional versus functional mitochondria). Each mitochondrion contains multiple mtDNAs (unfilled versus filled circles representing dysfunctional versus functional mtDNAs). (B) The mutualistic cooperation between mitochondria and eukaryotes is traditionally thought to be stabilized by PFF between eukaryotic host organisms and their mtDNAs/mitochondria. A host organism dominated by dysfunctional mtDNAs/mitochondria leaves fewer offspring (left) than a host organism dominated by functional mtDNAs/mitochondria (right). Due to mtDNA bottleneck, oocytes and offspring exhibit large variability in the level of dysfunctional mtDNAs/mitochondria they inherit from their mother. This facilitates PFF (see text). (C) Mitochondria dominated by functional mtDNAs replicate faster than those dominated by dysfunctional mtDNAs, even though dysfunctional mtDNAs replicate as fast as or faster than functional mtDNAs in the same mitochondrion. (D) PC between a focal cell and mitochondria/mtDNAs can occur through selective import, asymmetric segregation, or mitophagy. (E) Cells dominated by functional mtDNAs/mitochondria have a higher fitness than those dominated by dysfunctional mtDNAs/mitochondria. Grey crossbars: elimination; grey arrows: time.
Download links
A two-part list of links to download the article, or parts of the article, in various formats.
Downloads (link to download the article as PDF)
Open citations (links to open the citations from this article in various online reference manager services)
Cite this article (links to download the citations from this article in formats compatible with various reference manager tools)
Acknowledging selection at sub-organismal levels resolves controversy on pro-cooperation mechanisms
eLife 4:e10106.
https://doi.org/10.7554/eLife.10106


