A Mammalian enhancer trap resource for discovering and manipulating neuronal cell types
- Brandeis University, United States
- Janelia Research Campus, Howard Hughes Medical Institute, United States
- California Institute of Technology, United States
Figures
Figure 1 with 3 supplements

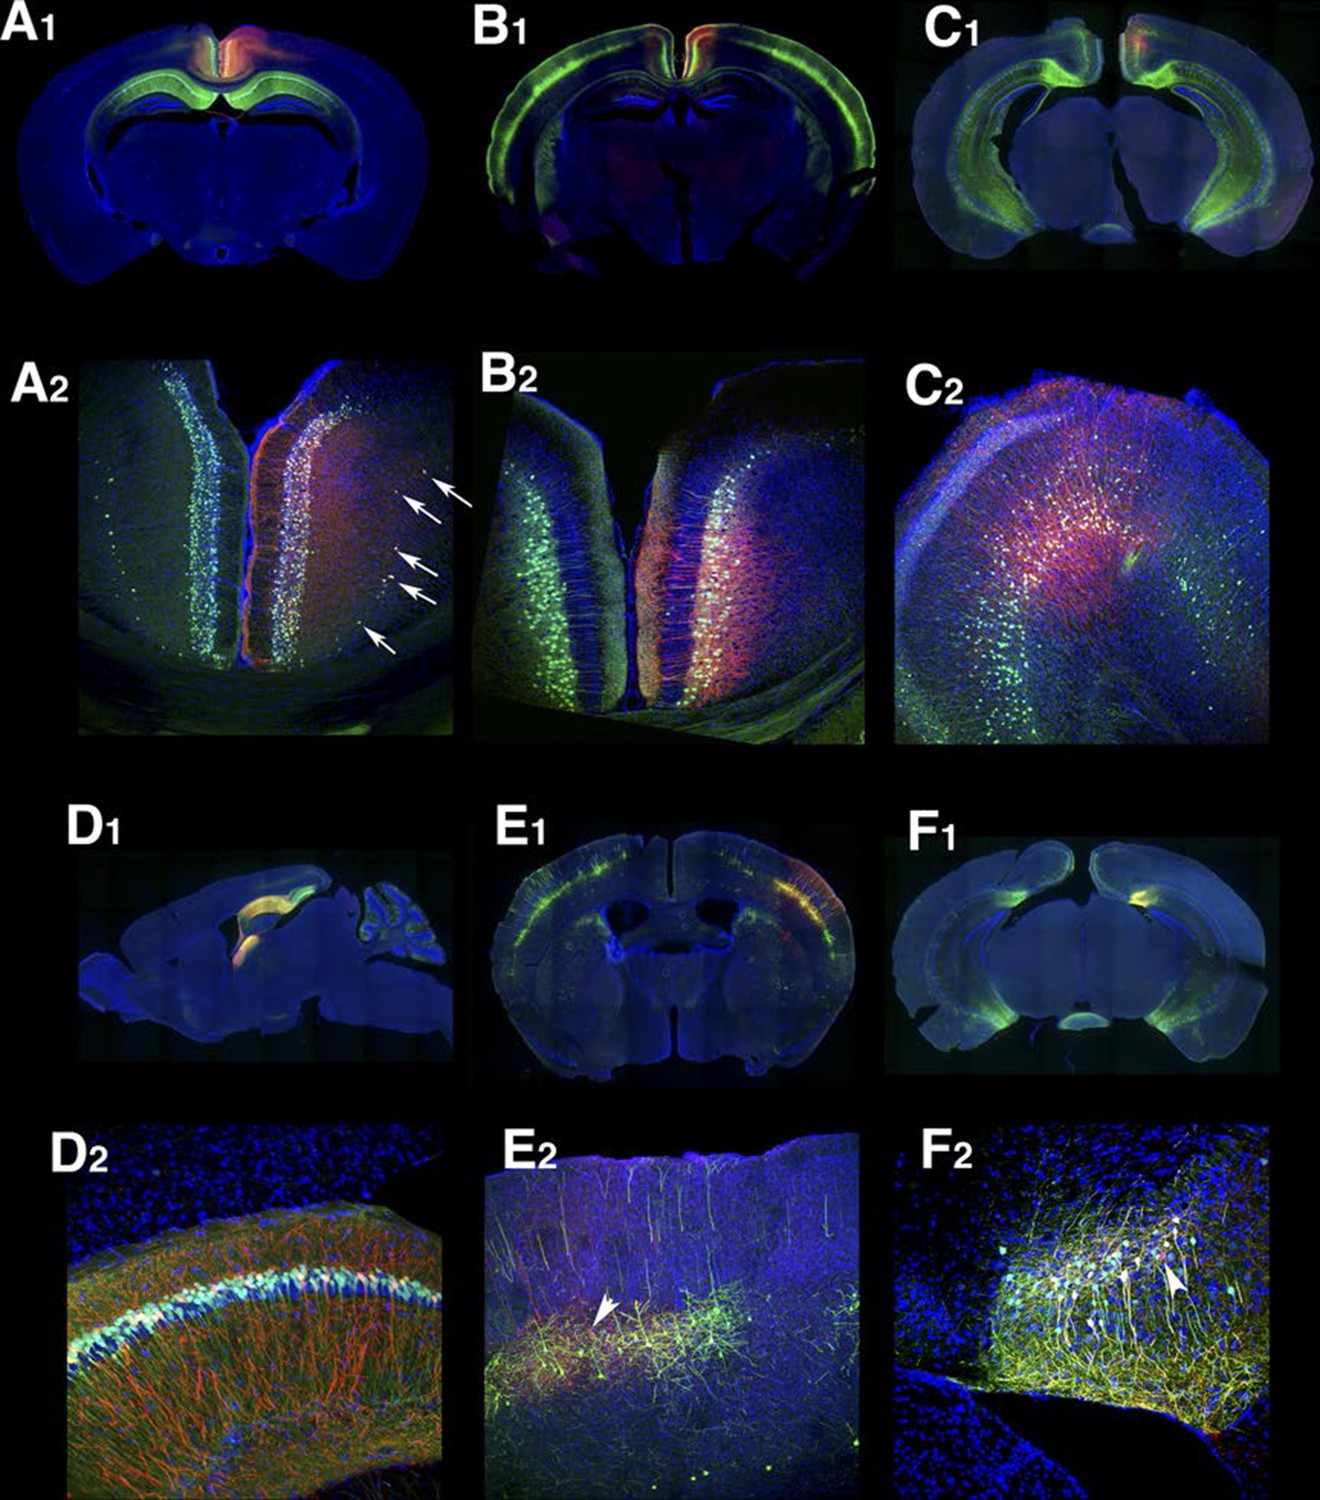
Example Lentiviral lines.
(A) 48L has expression in limbic cortex (A1, coronal section) layer 5 pyramidal cells (A2, magnified image in limbic cortex). (B) Superior colliculus (SC) of TCBV has columnar axons from retina. B1: sagittal section, B2: magnified image of superior colliculus. (C) 52L has expression in piriform cortex (see Figure 9) and Cajal-Retzius cells in dentate gyrus (DG, C2) and cerebral cortex (C3, inset: magnified image of a Cajal-Retzius cell). (D) TCGS has expression in layer 4 neurons of primary sensory cortices (primary somatosensory area: SSp and primary visual area:VISp in D3). (E) TCFQ has nearly complimentary layer 4 expression excluding primary sensory cortices. D1 and E1: sagittal sections, D2 and E2: confocal images of cortex, D3 and E3: dorsal view of whole brains. (F) TCJD has expression in dorsal part of lateral geniculate nucleus (LGd, F1), which projects to primary visual cortex (VISp). F1: sagittal section, F2: higher magnification of LGd, F3: higher magnification of axons in layers 1, 4, and 6 of VISp. Scale bars are 50 μm in A2, B2, C2, F2 and 500 μm in others.
Figure 1—figure supplement 1

Transgenesis.
(A) Lentiviral transgenesis. Lentivirus encoding an enhancer probe is injected into the perivitelline space between the single cell embryo and the zona pellucida. Infected embryos are transferred to foster mothers. Founders are genotyped by PCR and transgene copy number is estimated by southern blot or quantitative PCR and additional rounds of breeding and quantitative genotyping are carried out (not shown) to produce single copy founders. (B) PiggyBac (PB) transgenesis. Plasmid DNA for a PB enhancer probe and PB transposase (PBase) mRNA are injected into the cytosol of single cell embryos. Copy numbers of PB probes are examined as for lentiviral founders. Animals with single copy PB are selected as seed lines for PB transgenesis. Seed lines (P) are crossed with PBase animals, and their children (F1) carrying both PB and PBase are mated with wild-type (WT) animals. PB hops only in F1 PB;PBase mice, and animals with new PB insertion sites are generated in the following generation (F2). Among F2 animals, animals with hopped PB but without PBase are founders of new transgenic lines. PB; prm-PBase females can also be founders since prm-PBase will not be expressed in the female germ line.
Figure 1—figure supplement 2

Constructs for transgenesis.
(A) Lentiviral constructs. Viral sequences were inserted into the lentiviral backbone plasmid. The five variants listed are described in the text. (B) PiggyBac constructs containing tTA or tTA and Cre. Except for hsp-tet3, transcripts from lentiviral constructs use 3’ long terminal repeat (△U3-R–U5 in the backbone plasmid) as poly adenylation signal. In all constructs, tTA and mCitrine share poly adenylation signal sequences. HSPmp: minimal promoter from Hspa1a, tTA: tet transactivator, TRE: tet response element, WPRE: woodchuck hepatitis virus post-transcriptional regulatory element, 2A: FMDV-2A sequence, BGHpA: poly-adenylation signal from bovine growth hormone, HS4ins: insulator sequence from DNase hyper sensitive site in the chicken β-globin gene, PB- 5’ITR and PB-3’ITR: PiggyBac inverted terminal repeat.
Figure 1—figure supplement 3
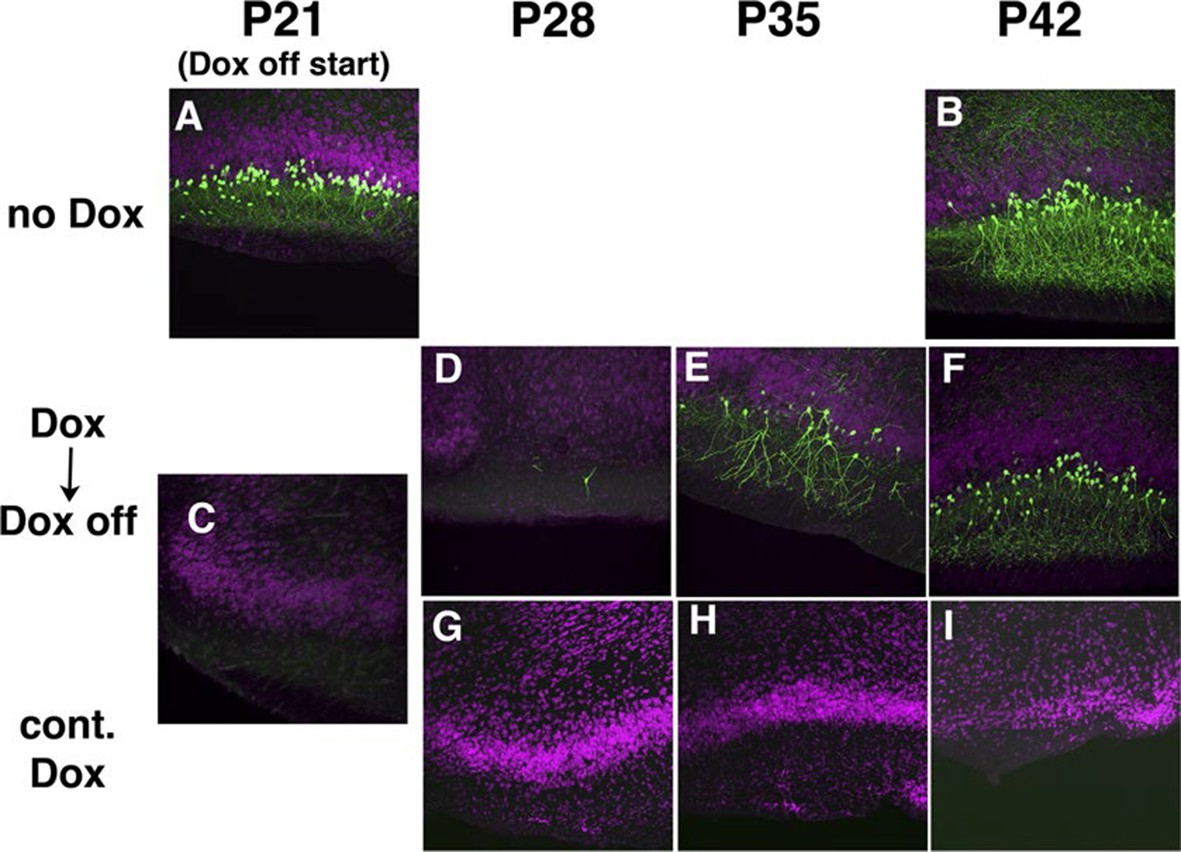
Transgene regulation by Doxycycline (Dox).
Pregnant 48L females received water with Dox (0.2 mg/ml) or regular water (control) (A–B) P21 (A) and P42 (B) images from 48L animals receiving water lacking Dox. (C–I) Images from 48L animals receiving Dox. Regular water (D–F, second row) and doxycycline water (G–I, third row) were used for 3 weeks from when pups were weaned at P21. Siblings are dissected at P21 (C), P28 (D and G), P35 (E and H) and P42 (F and I).
Figure 2 with 5 supplements
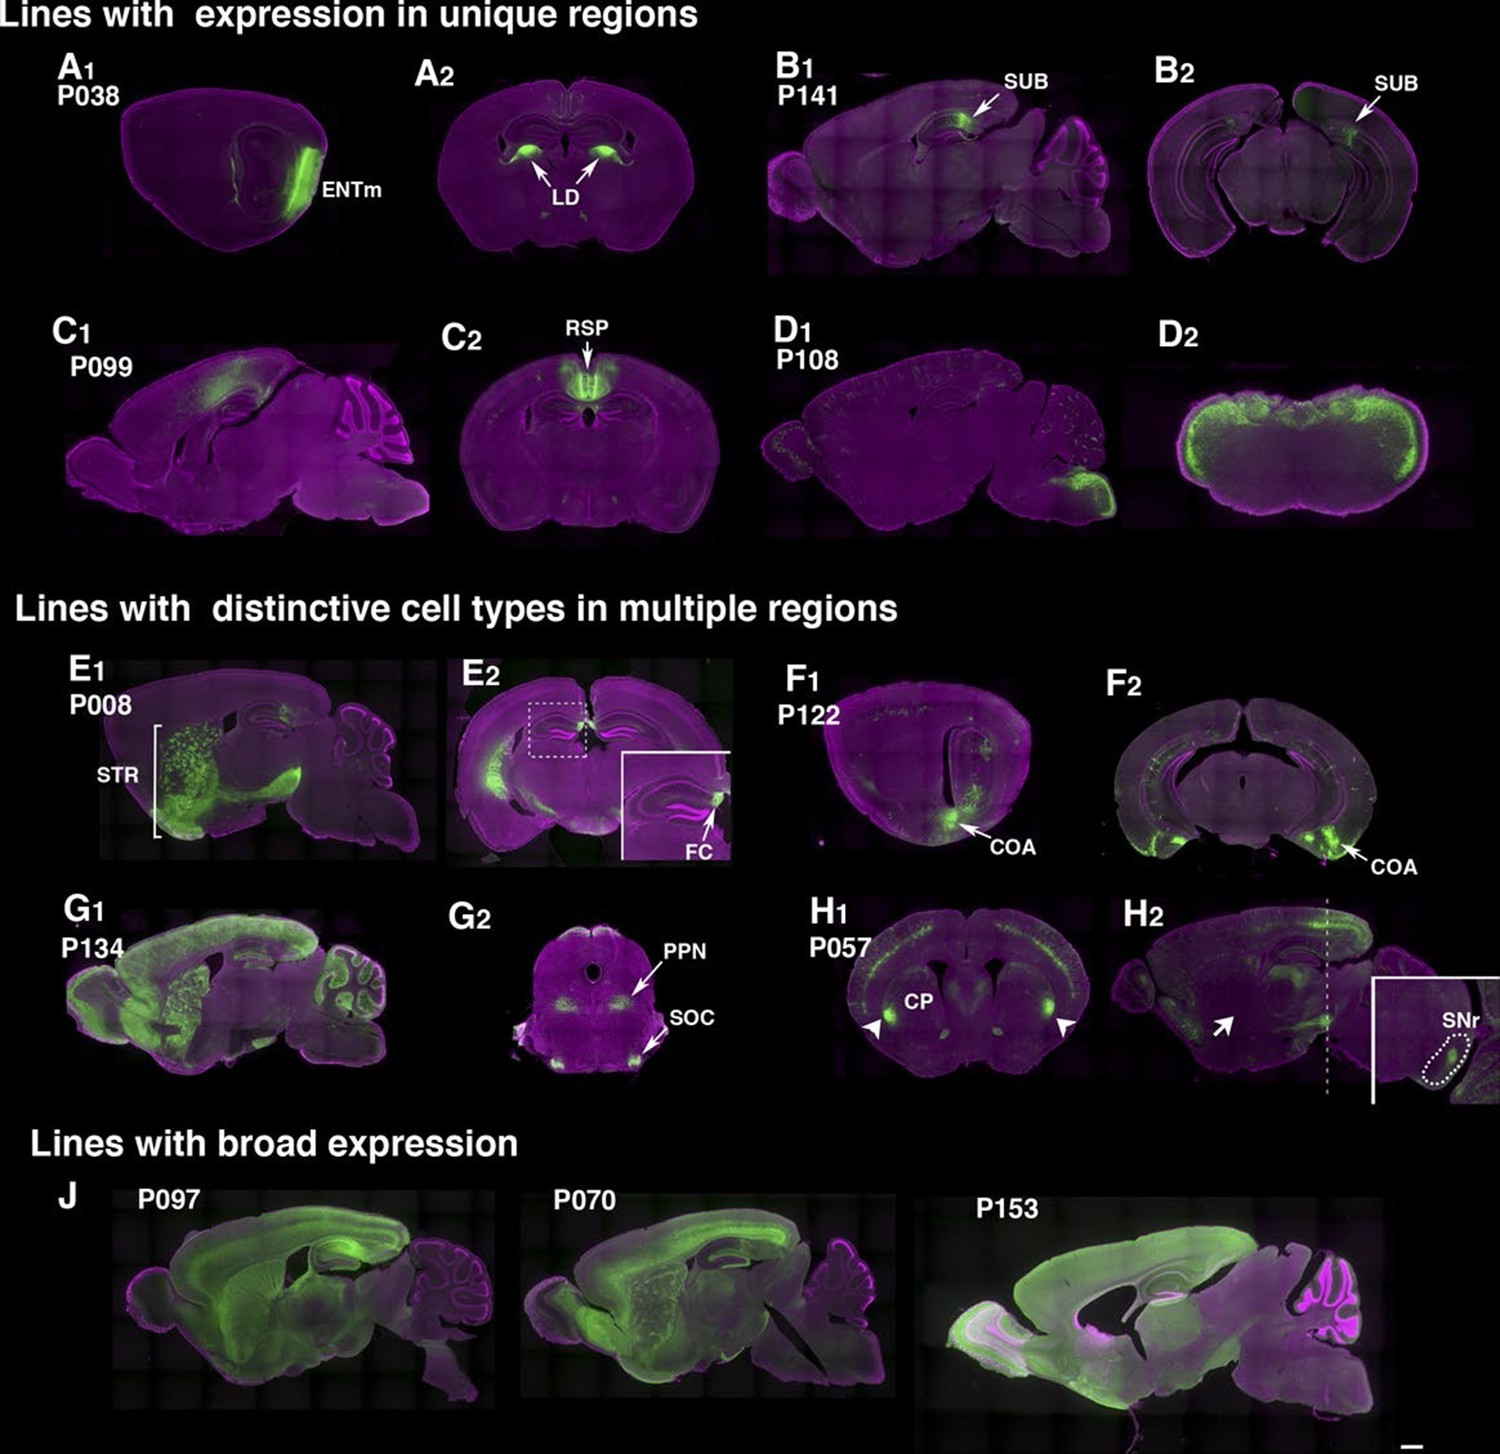
Example PiggyBac lines.
(A–D) Examples of lines that appear to label a single cell type. (d) P038 has expression in entorhinal cortex medial part (ENTm) layer 6 neurons (A1: sagittal) that send axons to lateral dorsal nucleus of thalamus (LD in A2: coronal). (B) P141 has expression in a restricted area in subiculum (SUB, B1: sagittal, B2: coronal). (C) Retrosplenial cortex (RSP) expression in P099 (C1: sagittal, C2: coronal). (D) Dorsal hindbrain expression in P108 (D1: sagittal, D2: coronal at hindbrain). (E–H) Examples of lines with regionally distinctive cell type labeling. (E) P008 has expression in striatum (STR) broadly (E1: sagittal) but its hippocampal expression is restricted to the most medial part (fasciola cinereum: FC, E2 inset) (F) P122 has scattered expression in hippocampus and strong expression in cortical amygdalar area. F1: sagittal, F2: coronal sections. (G) P134 has broad expression in cortical interneurons and cerebellar Lugaro cells (G1: sagittal). Its expression in midbrain is restricted to subnuclei (G2, superior olivary complex: SOC and presumably pedunculopontine nucleus: PPN). (H) P057 (H1:coronal, H2, sagittal section) has expression in layer 5 pyramidal cells in the cortex. Expression in caudate putamen (CP) is restricted to lateral-most areas (arrows in H1). H2 inset: coronal section at the level of the dotted line. The striatal neurons project to a small area in the reticular part of the substantia nigra, reticular part (SNr, dotted area in H2 inset) but not to globus pallidus (H2 arrow). (J) Lines with broad expressions. Scale bar: 500 μm.
-
Figure 2—source data 1
Viral reporter expression counting data One or two animals per line were injected with TRE3G –myristorylsted mCherry HA.
The numbers of cells (mCitirne+, mCherry+, mCitrine+;mCherry+, and mCitrine-:mCherry+) infection rate (mCitrine+;mCherry+/ mCitirne +) were counted from confocal image stacks from sections near injection sites (5 - 9 sections/line). Infection rates (mCherry+;mCitrine+ /mCitrine) and 'off-target' expression rate (mCherry+;mCitirne-/mCherry+) are shown in average ± SEM.
- https://doi.org/10.7554/eLife.13503.012
Figure 2—figure supplement 1
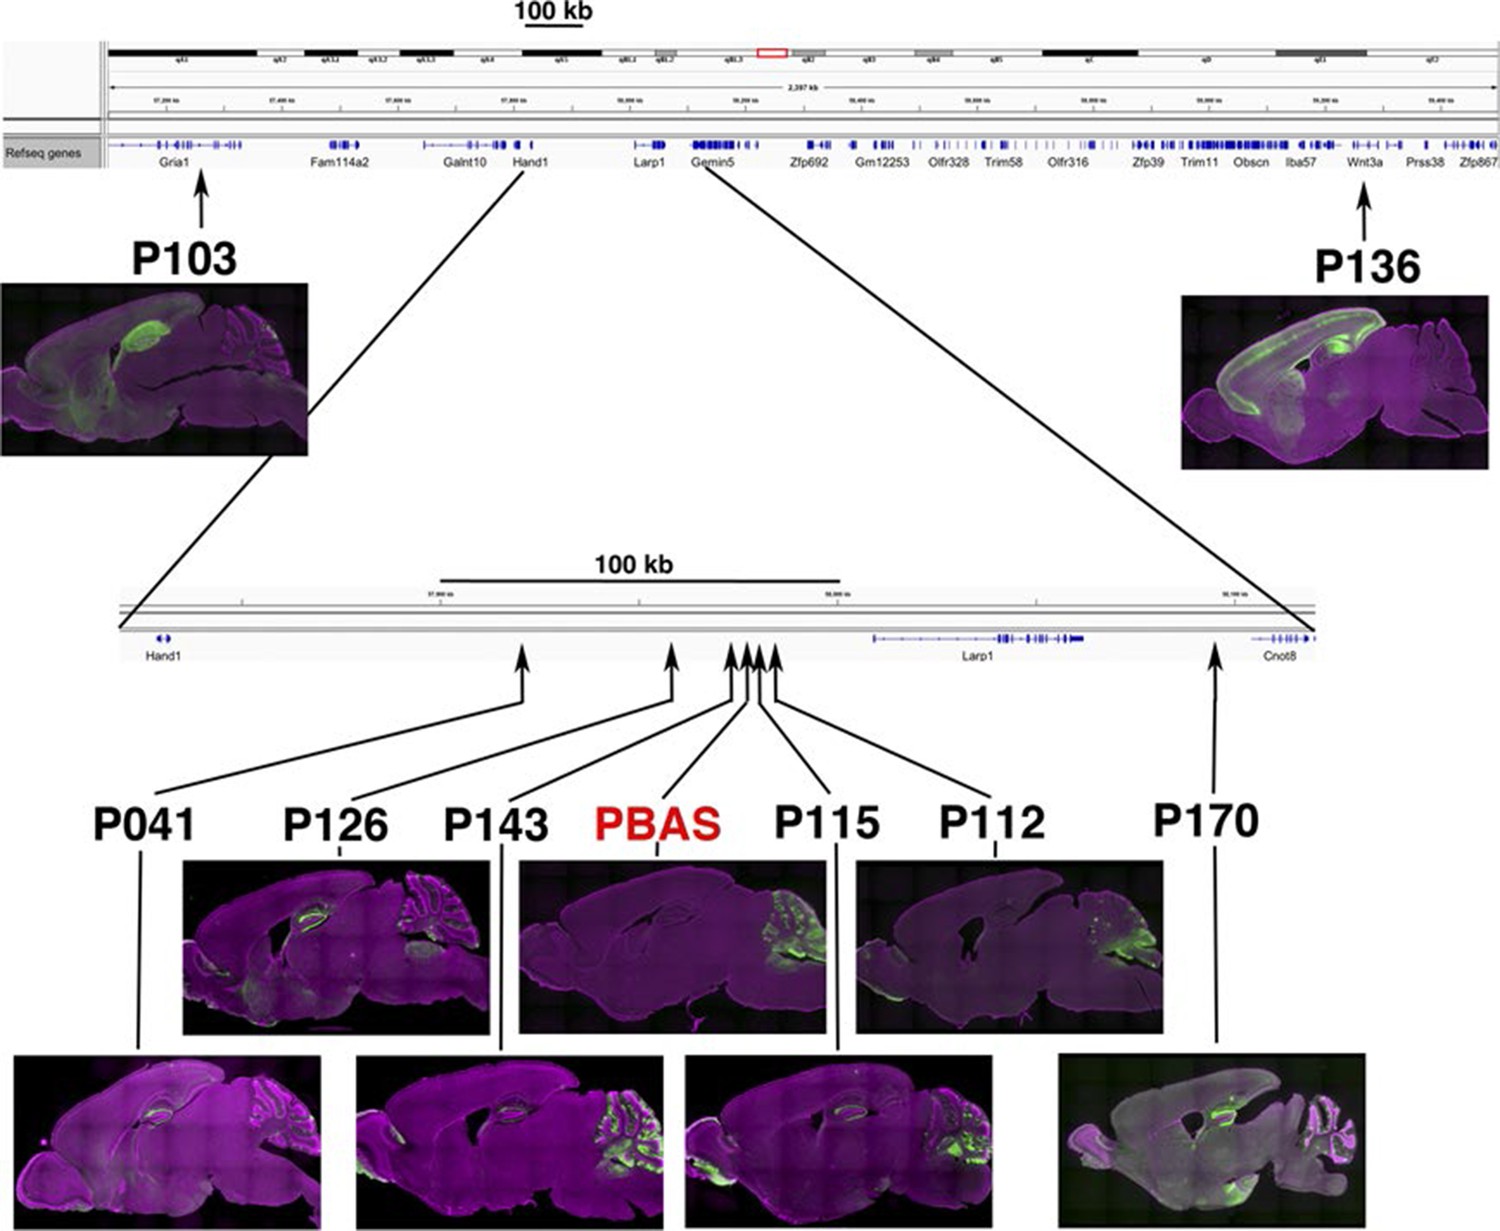
Similar expression patterns in lines with nearby insertions.
Insertion sites and expression patterns of a founder PBAS and lines generated from PBAS by local hop are shown. Lines inserted near original PBAS site have scattered expression in Purkinje cells in cerebellum. Many lines have axonal projections in dentate gyrus from entorhinal cortex. P103 and P136 have insertion sites more than 300 kb away from the origin and their expression patterns are quite different from PBAS.
Figure 2—figure supplement 2
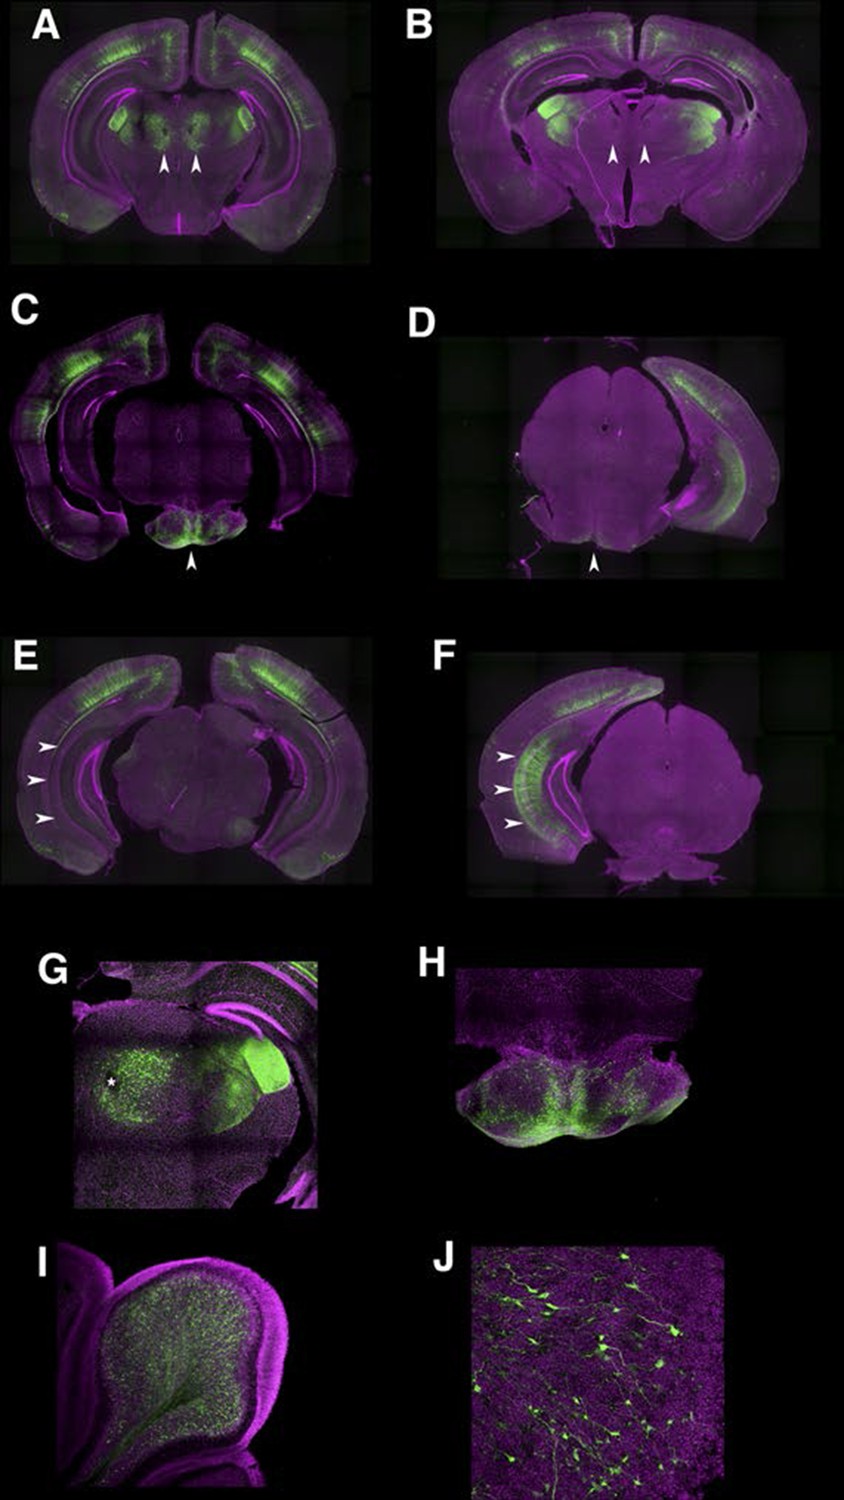
Developmental dynamics in P162 expression patterns.
(A and B) sections from P10 (A) and mature (B) animals. Parafascicular nucleus of thalamus had expression at P10 but not in mature animal (arrowheads). (C and D) P10 (C) animal expressed reporter in pontine gray (arrowhead) but matured animal (D) did not. (E and F) Subiculum expression was not seen at P10 (E) but was present in mature (F) animals (arrowheads). (G) Higher magnification of parafascicular nucleus in A. Asterisk: fasciculus retroflexus. (H) Higher magnification of pontine gray. (I) Cerebellum receives axons from pontine gray. (J) High magnification of cerebellum. Mossy terminals were labeled.
Figure 2—figure supplement 3
Examples of virus injection.
AAV–TRE3G- myristoylated mCherry-HA was injected to the brain. Wide field images (1) and confocal images (2, rectangle areas in 1) of injection sites. Note that myristoylated mCherry strongly labels axons and dendrites. (A–C) Injection to retrosplenial cortex. P160 labels layer 2/3 (A), P136 in layer 5 (B), and P160 in layer 6 (C). In P160, virus spread to entire cortex (see infected cells in deep layer (arrows in A2) but viral reporter expression is restricted to mCtirine positive cells. (D) Hippocampal CA1 injection to P160. (E–F) Examples of 'off-target' expression. Primary somatosensory cortex injection in P057 (E) and subiculum injection in P113 (F). Arrowheads: cells with viral reporter without visible mCitrine expression. Blue: DAPI, Green: anti-GFP, Red: anti-HA.
Figure 2—figure supplement 4
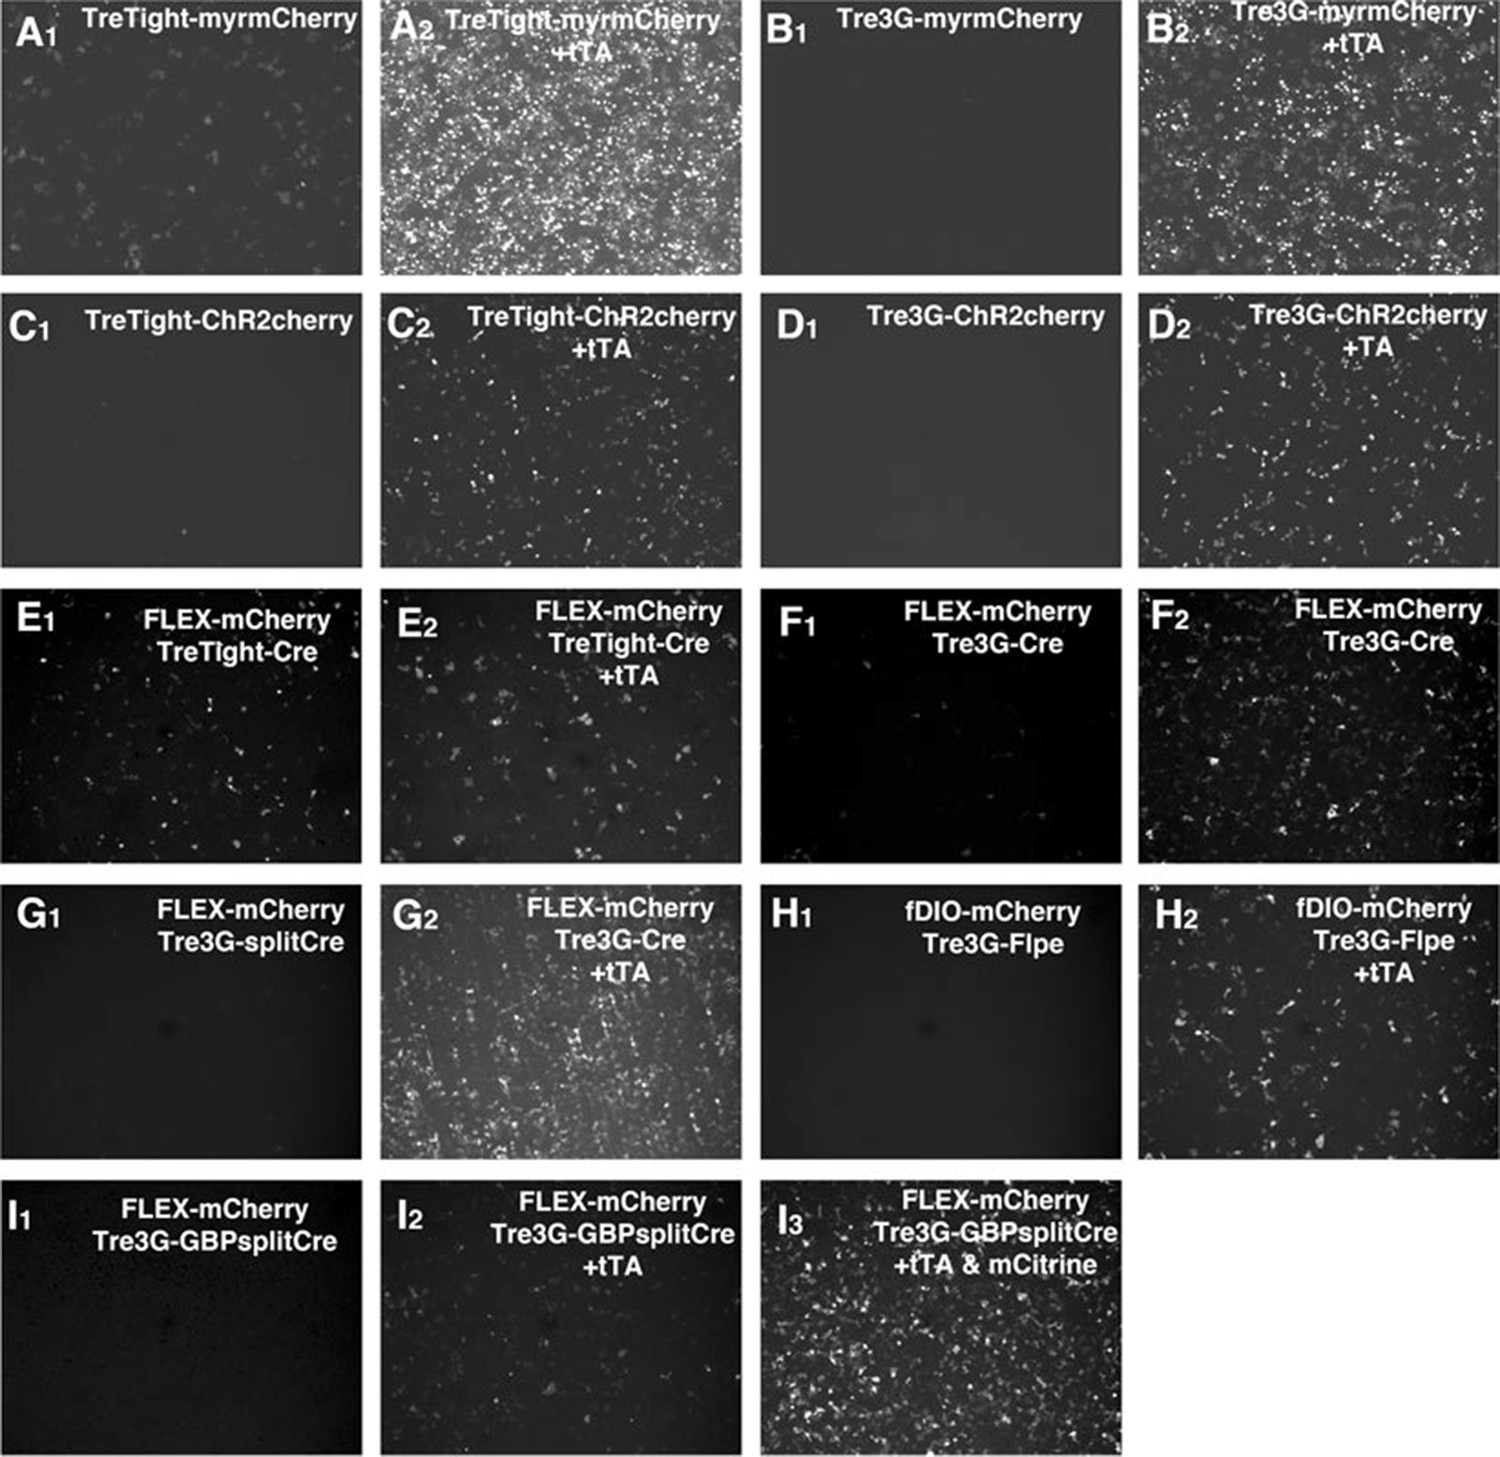
tet reporter expression in cultured cell lines.
(A–I) Induction of tet reporter constructs was tested with 293T cells. Cells were transfected without (A–I, first panels) or with (A–I, second panels) CMV-tTA plasmid. Some constructs had strong tTA-independent 'leak' expression (ex. A1, E1, and F1). GBP-split Cre had the strongest expression of Cre reporter in the presence of GFP (I3) but could activate the reporter expression without GFP expression (I2). See Supplemental note for further details.
Figure 2—figure supplement 5

Specificity of tet reporter expression in vivo.
(A) AAV–TREtight-myrmCherry expression in 56L. mCherry expression was restricted to mCitrine positive cells (mCitrine+ cells/ mCherry+ cells: 152/152). (A2) higher magnification of injection site. (B) Co-infection of AAV–TRE3G–Cre and AAV–CAG–Flex-myrmCherry HAnsulator sequence from. There was strong non-specific mCherry expression near injection site (B2). (C) TRE3G–Split Cre had specific expression of reporter without apparent leak. (D) TRE3G–Flpe had non-specific expression in a few cells (D2, arrows) (E) TRE3G split Cre had non-specific expression from Ai14 reporter allele in P113 subiculum. (F) TRE3G-nanobody Split Cre had specific expression (mCitrine+ cells/mCherry + cells: 64/64). (F2) higher magnification of the injection site. (G) Specific expression of AAV Cre repoter by TRE3G-nanobody split Cre in 56L.
Figure 3 with 1 supplement
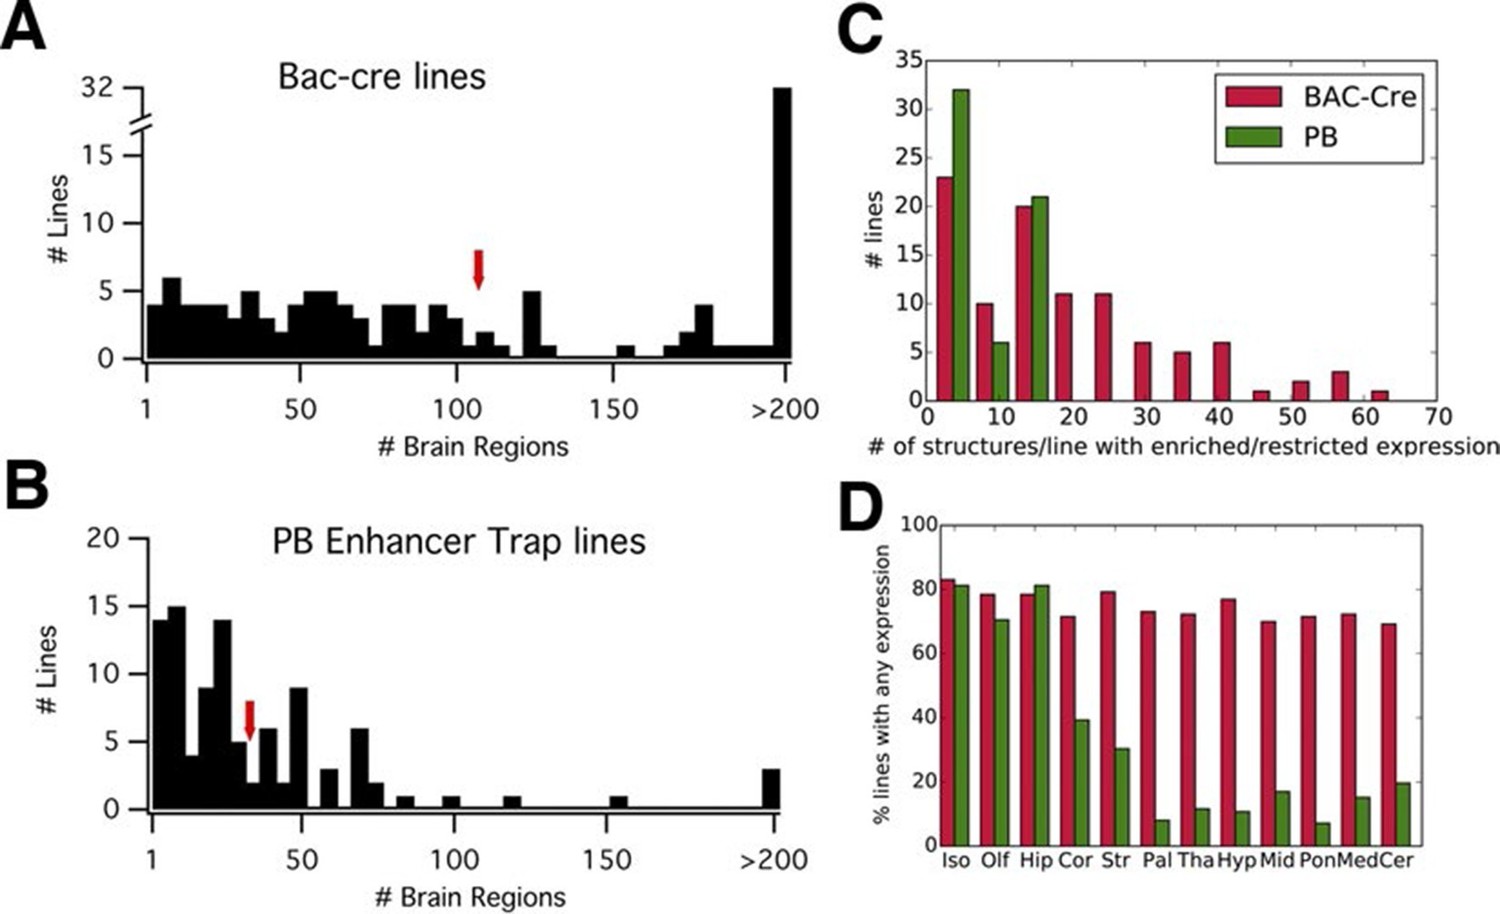
PB lines have more restricted expression than Cre lines.
(A, B) Histograms of the number of brain regions (x axis) with expression per line. Bac-Cre/Cre knock in –lines (A) have expression in more areas than PB enhancer trap lines (B). Arrows: averages. (C) Histogram of number of brain structures with enriched or restricted expression. Red: Cre lines, Green: PB lines. (D) Fraction of lines with expression in brain subregions. Iso: Isocortex, Olf: olfactory areas, Hip: hippocampal formation, Cor: cortical subplate, Str: striatum, Pal: pallidum, Tha: thal amus, Hyp: hypothalamus, Mid: midbrain, Pon: Pons, Med: medulla, Cer: cerebellum. Red: Cre lines, Green: PB lines.
Figure 3—figure supplement 1
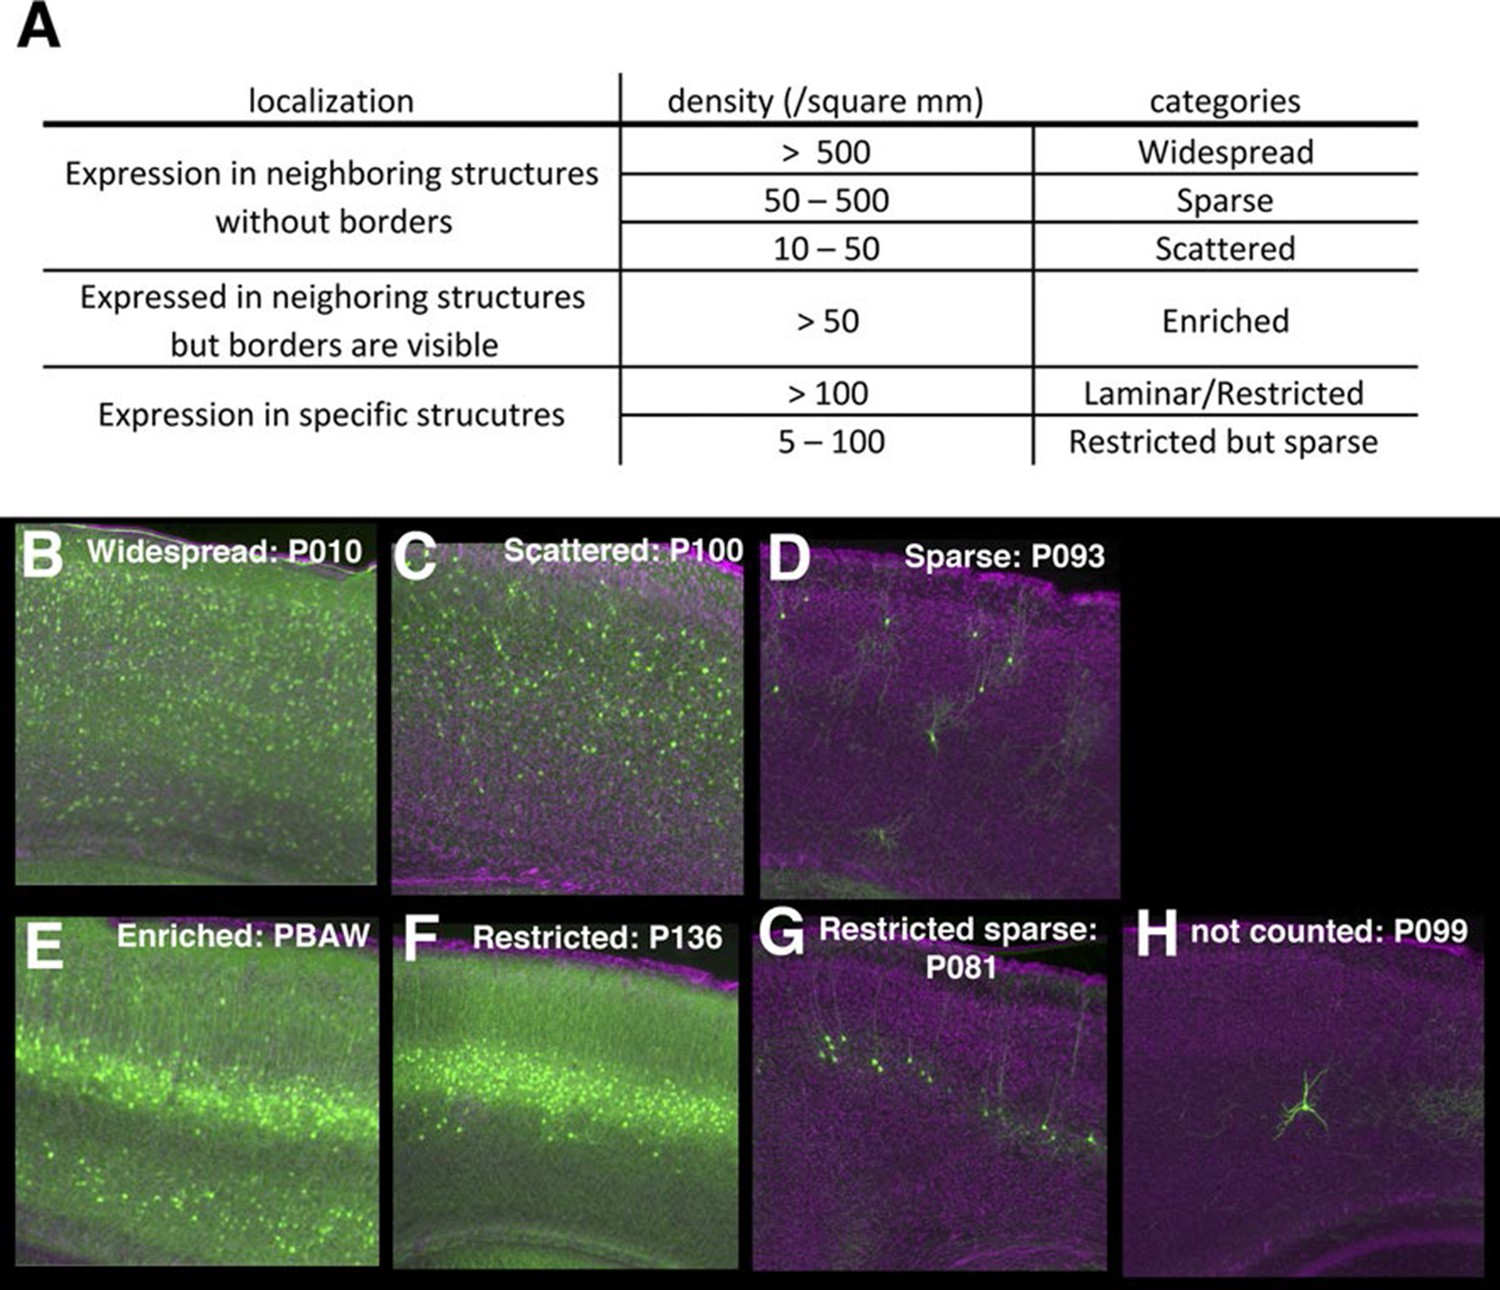
Categories of regional expression patterns.
(A) Criteria used to delineate expression categories. (B–H) Examples of expression categories (B: widespread, C: scattered, D: sparse, E: enriched, F: restricted, G: restricted sparse). Areas with less than 10 mCitrine-expressing cells/mm2 were ignored (H).
Figure 4 with 1 supplement
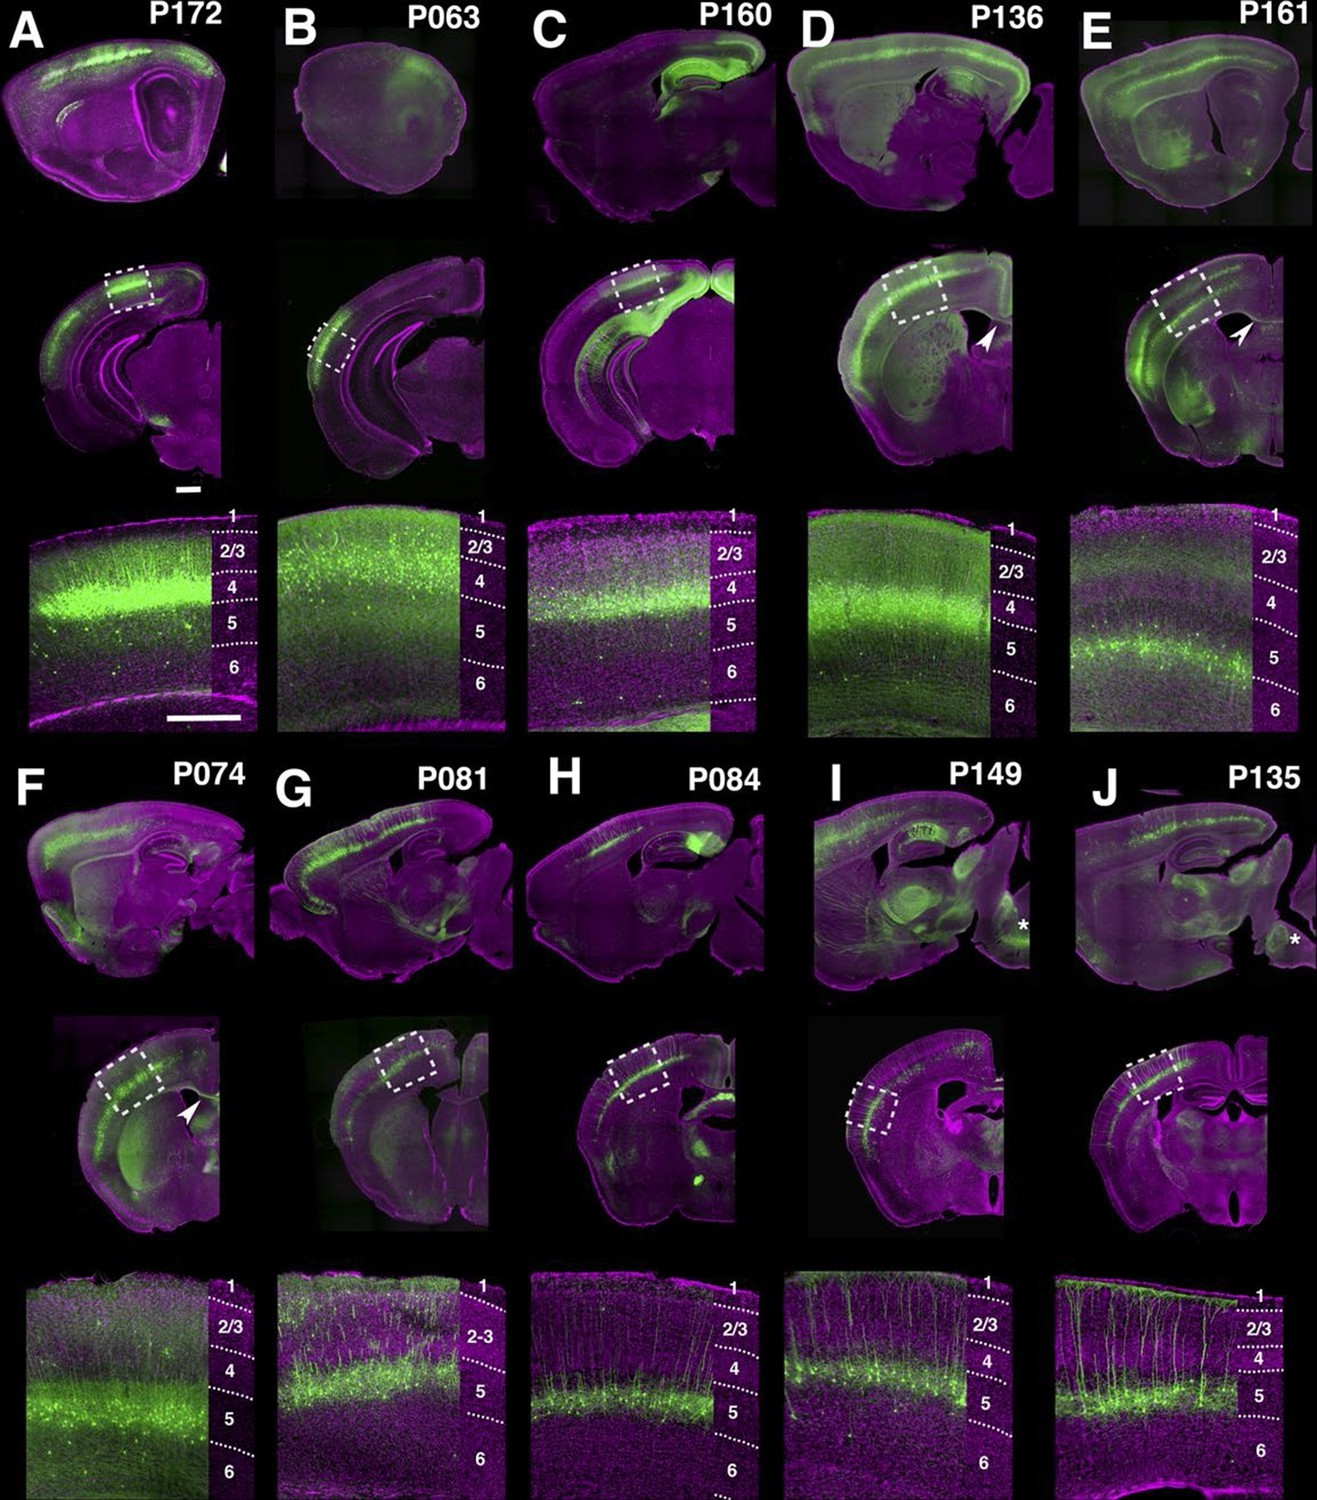
PB Lines labeling neocortical cell types.
(A–J) Images of lines with layer-specific expression. Sagittal (top rows), coronal (middle rows), and high-magnification coronal images (bottom rows) are shown. Arrowheads (D,E”): callosal projections. Asterisks (I,J”): corticospinal projections. Scale bars: 500 μm.
FIgure 4—figure supplement 1
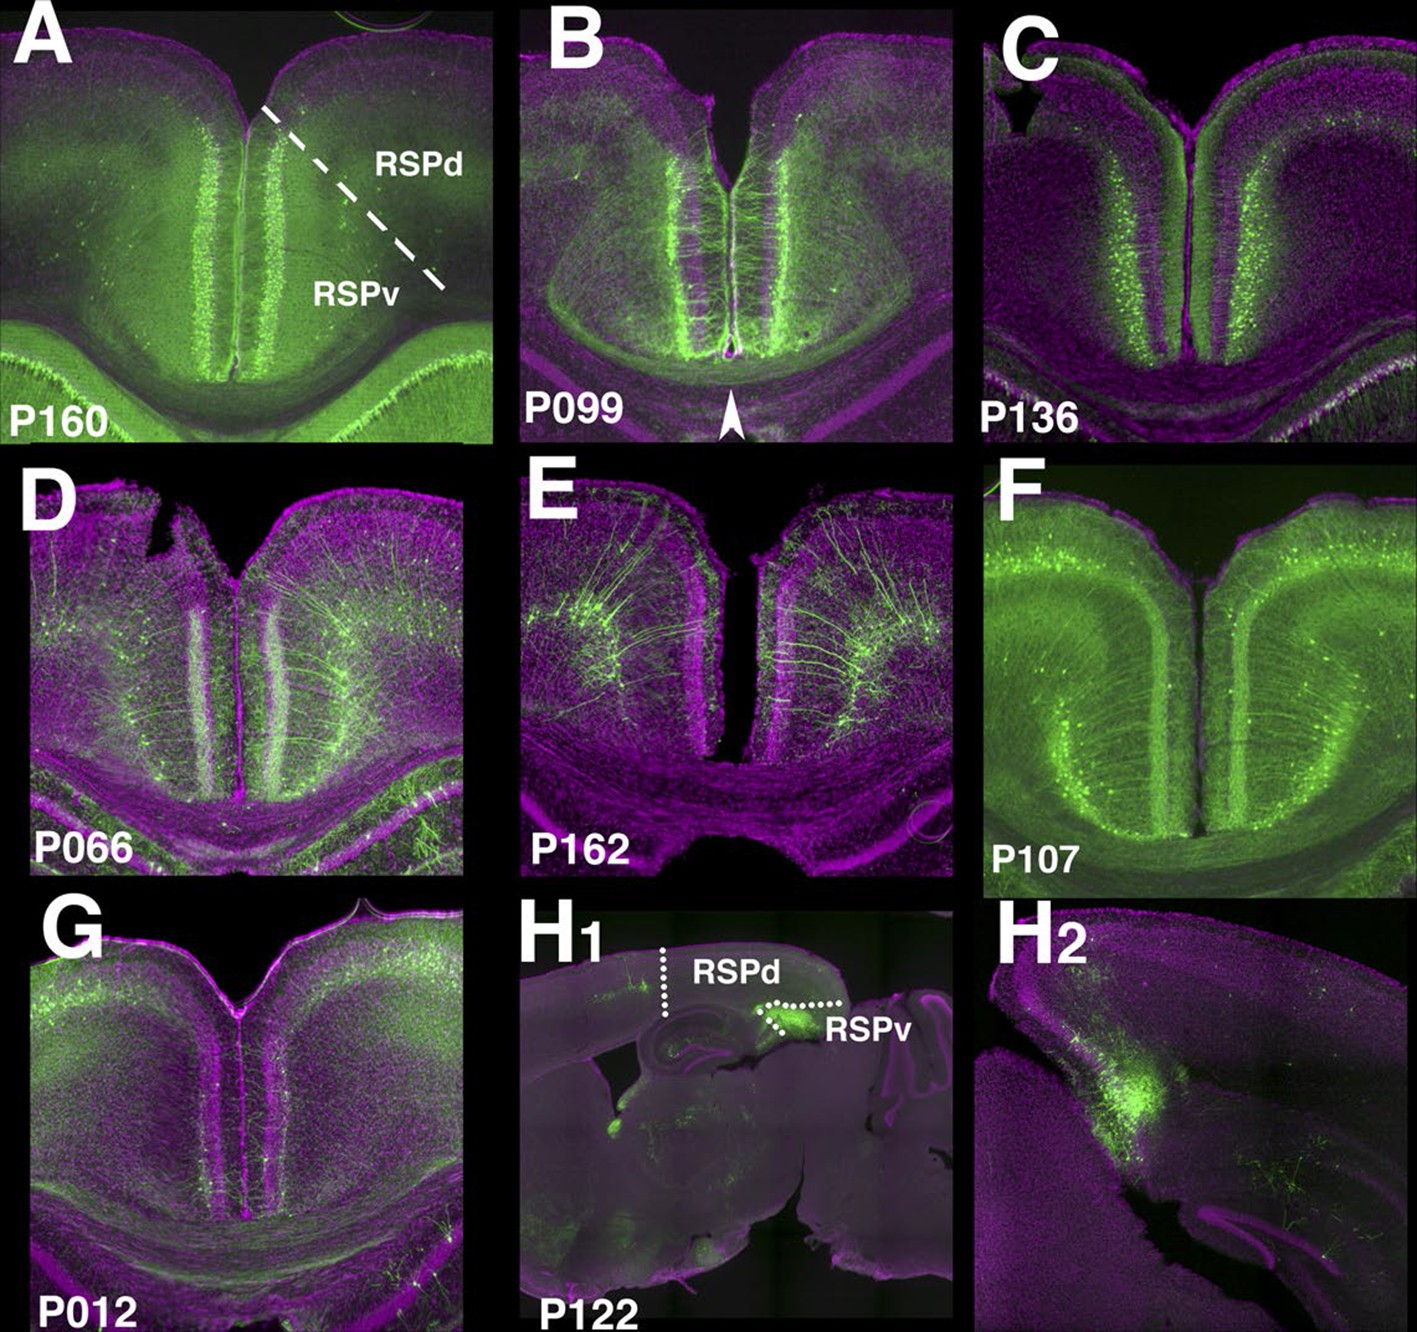
Retrosplenial cortex lines.
(A) RSPv Layer 2 expression in P160. (B) P099 has expression in upper RSPv layer 2/3 with callosal projection (arrowhead). (C) RSPv layer 2/3 expression in P136. (D and E) RSPv layer 6 expression. (F) P107 has expression in RSPd layer2/3 and layer6 in RSPd. (G) P012 has layer 2 expression in RSPv. (H) P122 has expression in posterior RSPv. (A–H1) coronal, (H2) sagittal sections.
Figure 5
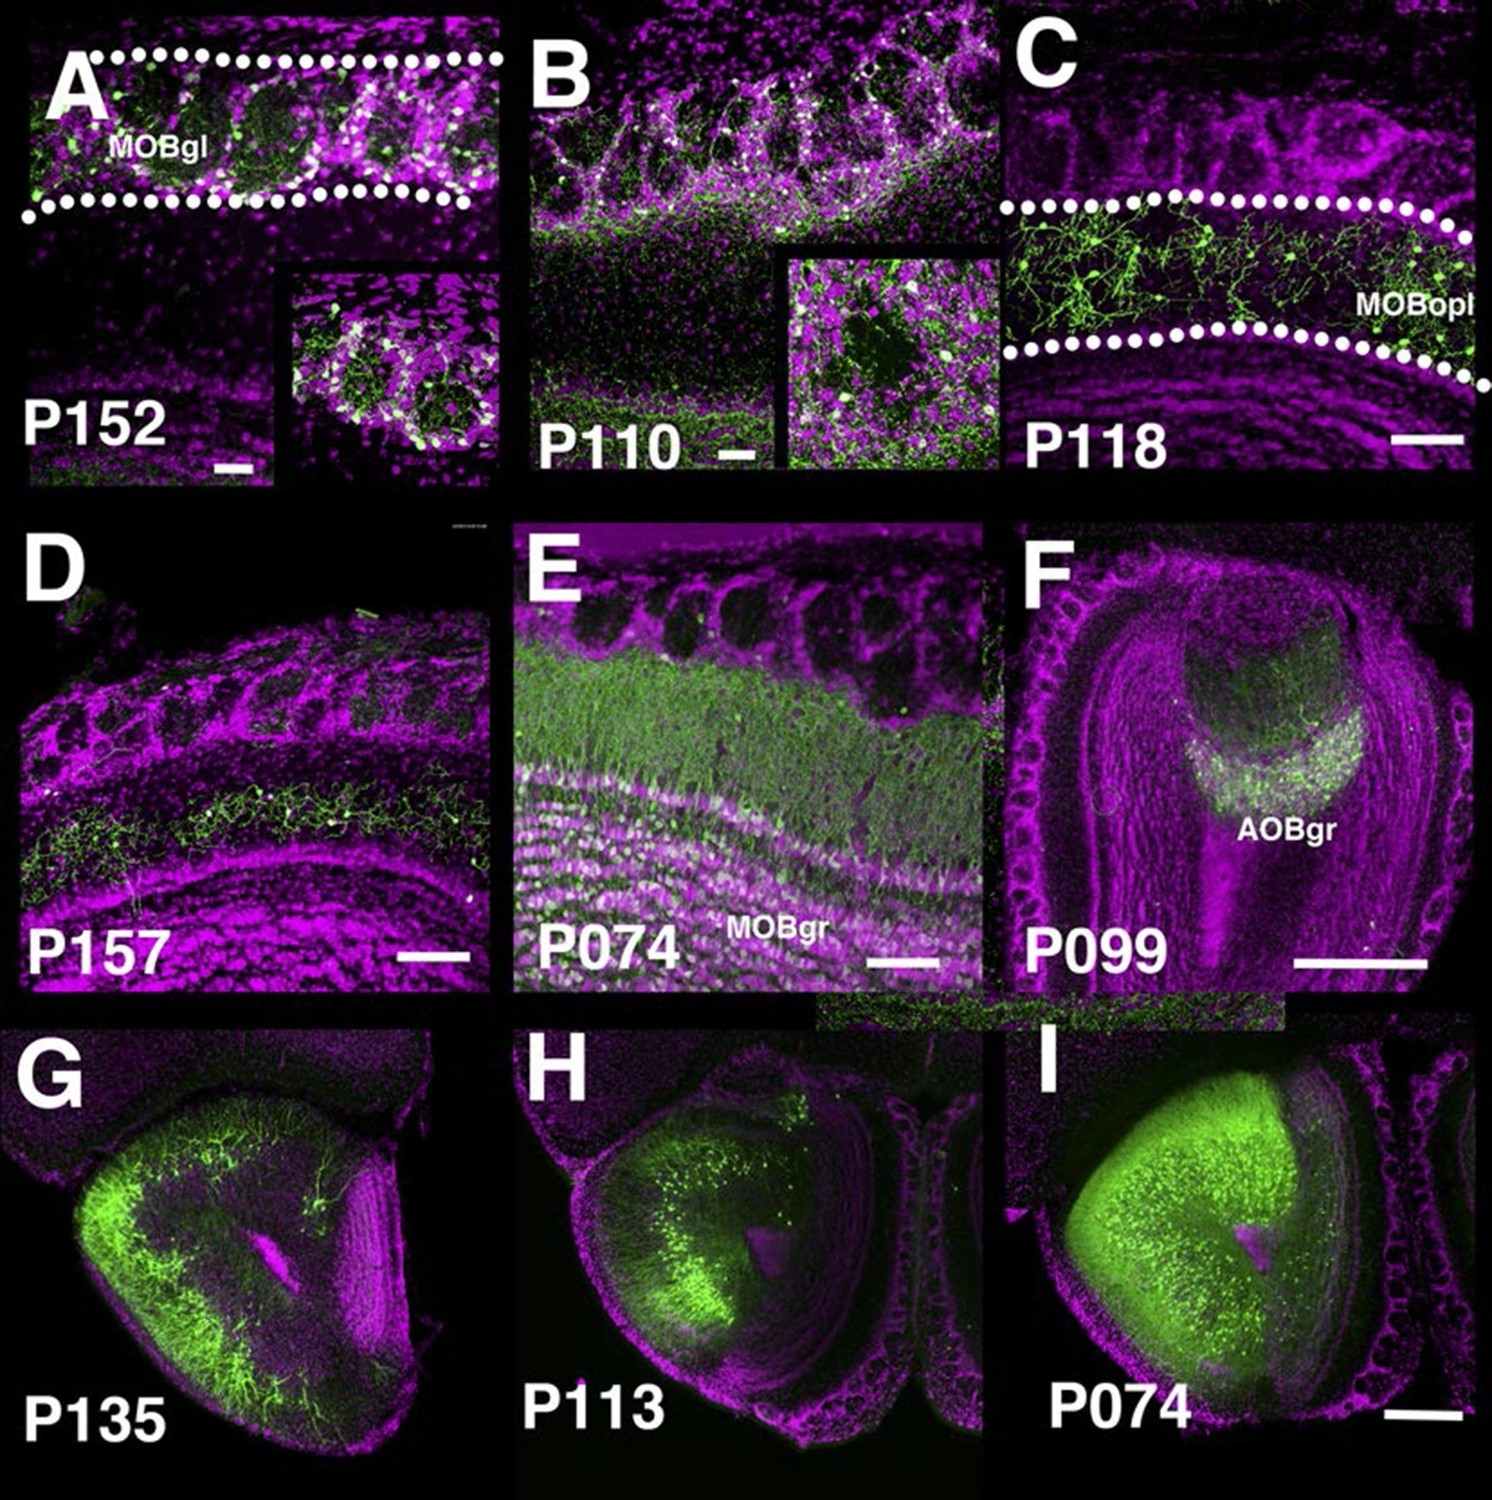
PB lines labeling olfactory bulb cell types.
Coronal sections of main olfactory bulb (A–E), accessory olfactory bulb (F), and anterior olfactory nucleus (G–I). AOBgr: accessory olfactory bulb, granule layer, MOBgl: main olfactory bulb, glomerular layer, MOBgr: main olfactory bulb, granule layer MOBopl: main olfactory bulb, outer plexiform layer. Scale bars in A–E: 100 μm, others: 500 μm.
Figure 6 with 1 supplement
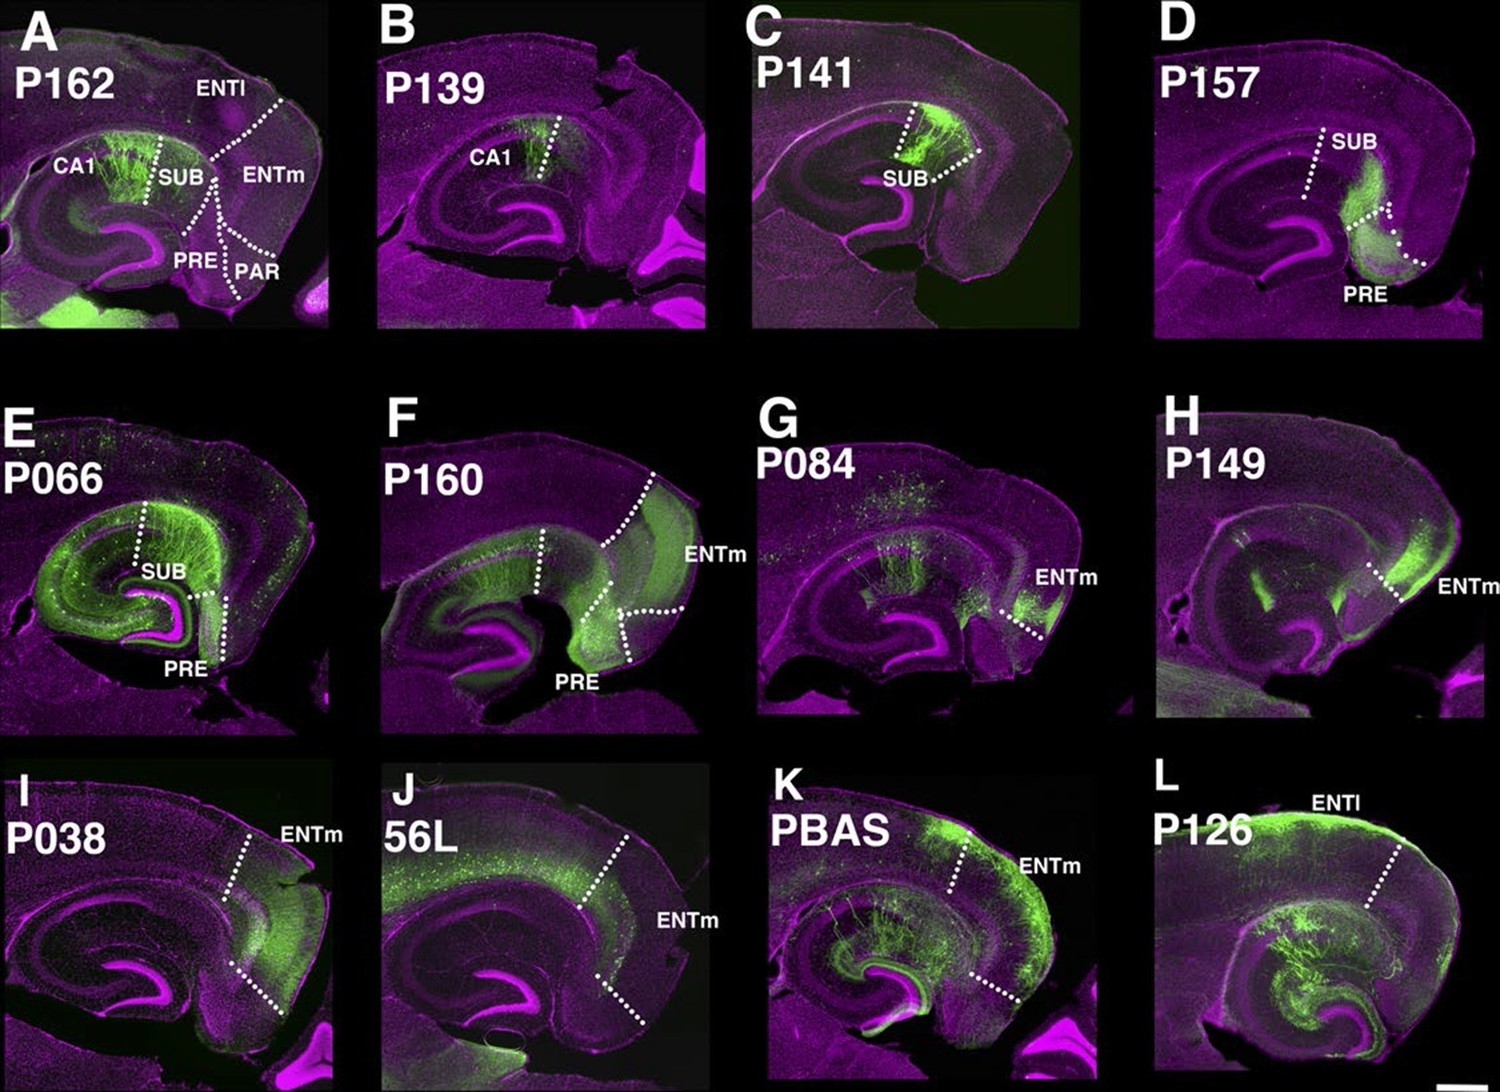
Lines with expression in the hippocampal formation.
Horizontal sections through the hippocampal formation. (A–B) Expression closer to CA1 (P162, A) and to subiculum (P139, B) at the region of their border. CA1: Ammon’s horn, field CA1, SUB: subiculum, PRE: presubiculum, PAR: parasubiculum, ENTm: entorhinal cortex, medial part, ENTl: entorhinal cortex, lateral part. Arrowheads in (A–C) distal end of CA1 pyramidal layer. (C–E) Subiculum expression in P141(C), P157 (D) and P066 (E). (F) Presubiculum expression in P160. (G and H) Expression in medial entorhinal cortex layer 5 in P084 (G) and P149 (H). (I and J) medial entorhinal cortex layer6 expression in P038 (I) and 56L (J). (K and L) medial entorhinal (PBAS, K) and lateral entorhinal (P126, L).layer 2 expression. Scale bar: 500 μm.
Figure 6—figure supplement 1
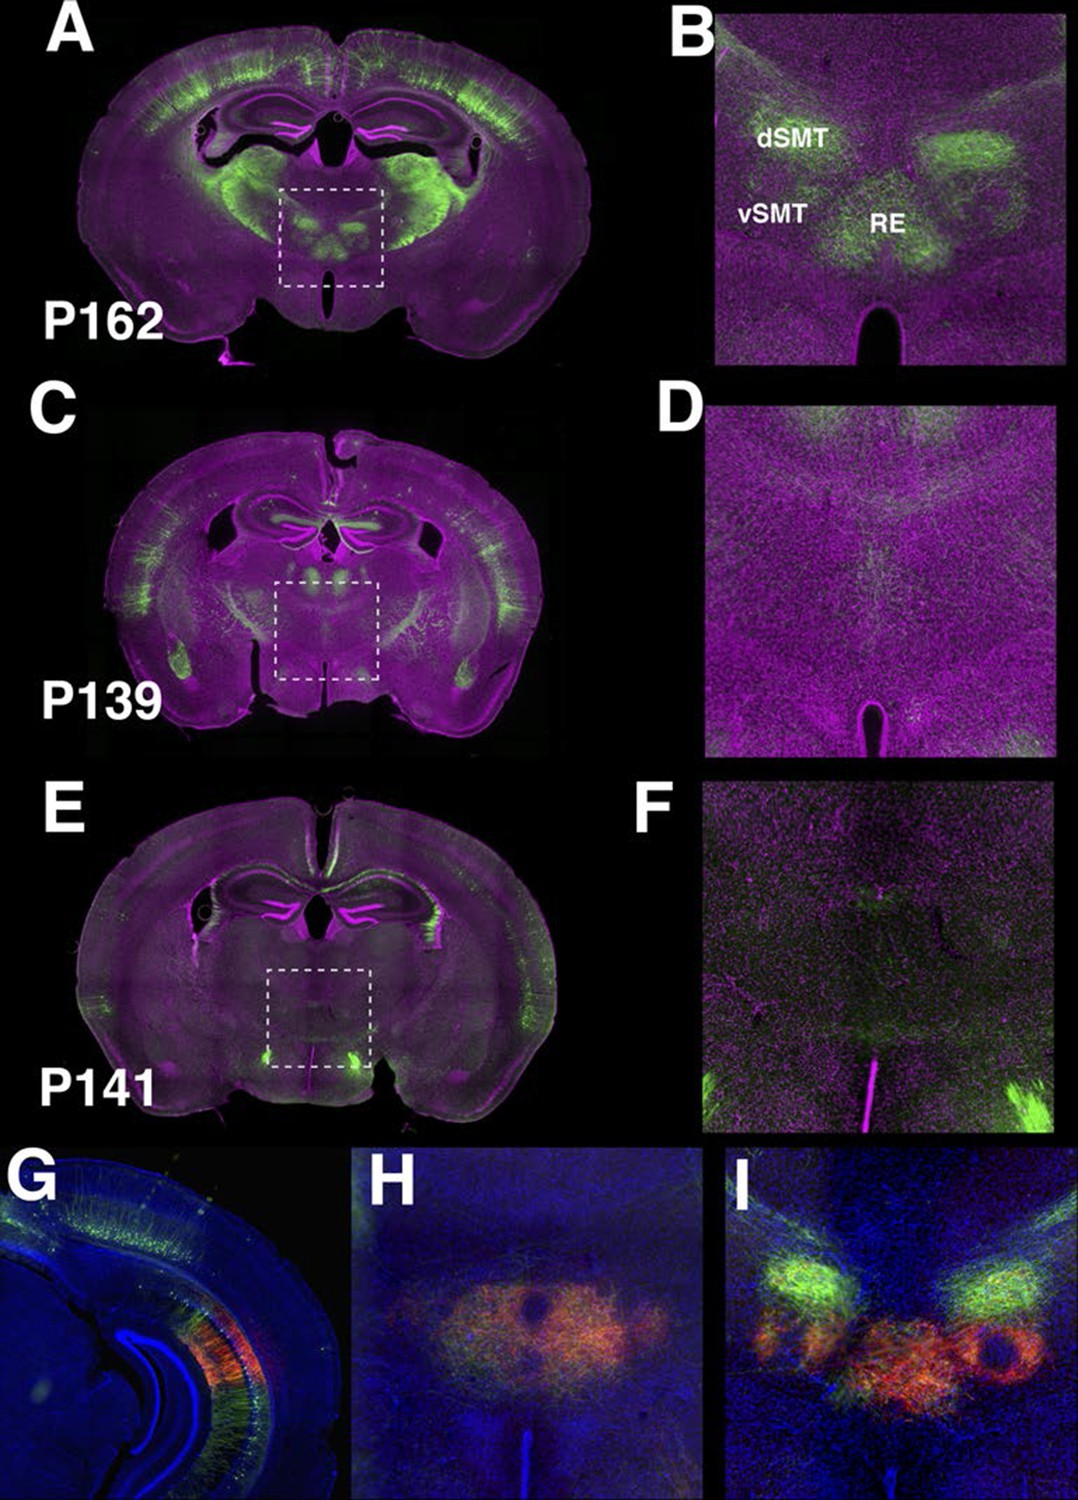
P162 subiculum neurons project to thalamus.
(A–F) Axonal projection in nucleus of reunions (RE), dorsal (dSMT), and ventral (vSMT) submedial nuclei are prominent in P162 (A–B) but are weak or absent in p139 (C–D) and P141 (E–F). B, D, and F magnified images of areas shown A, C, and E, respectively. (G–I) TRE3G-myrmCherryHA injection to P162. (G) the injection site. (H) axons in RE. (I) axons in RE and vSMT.
Figure 7
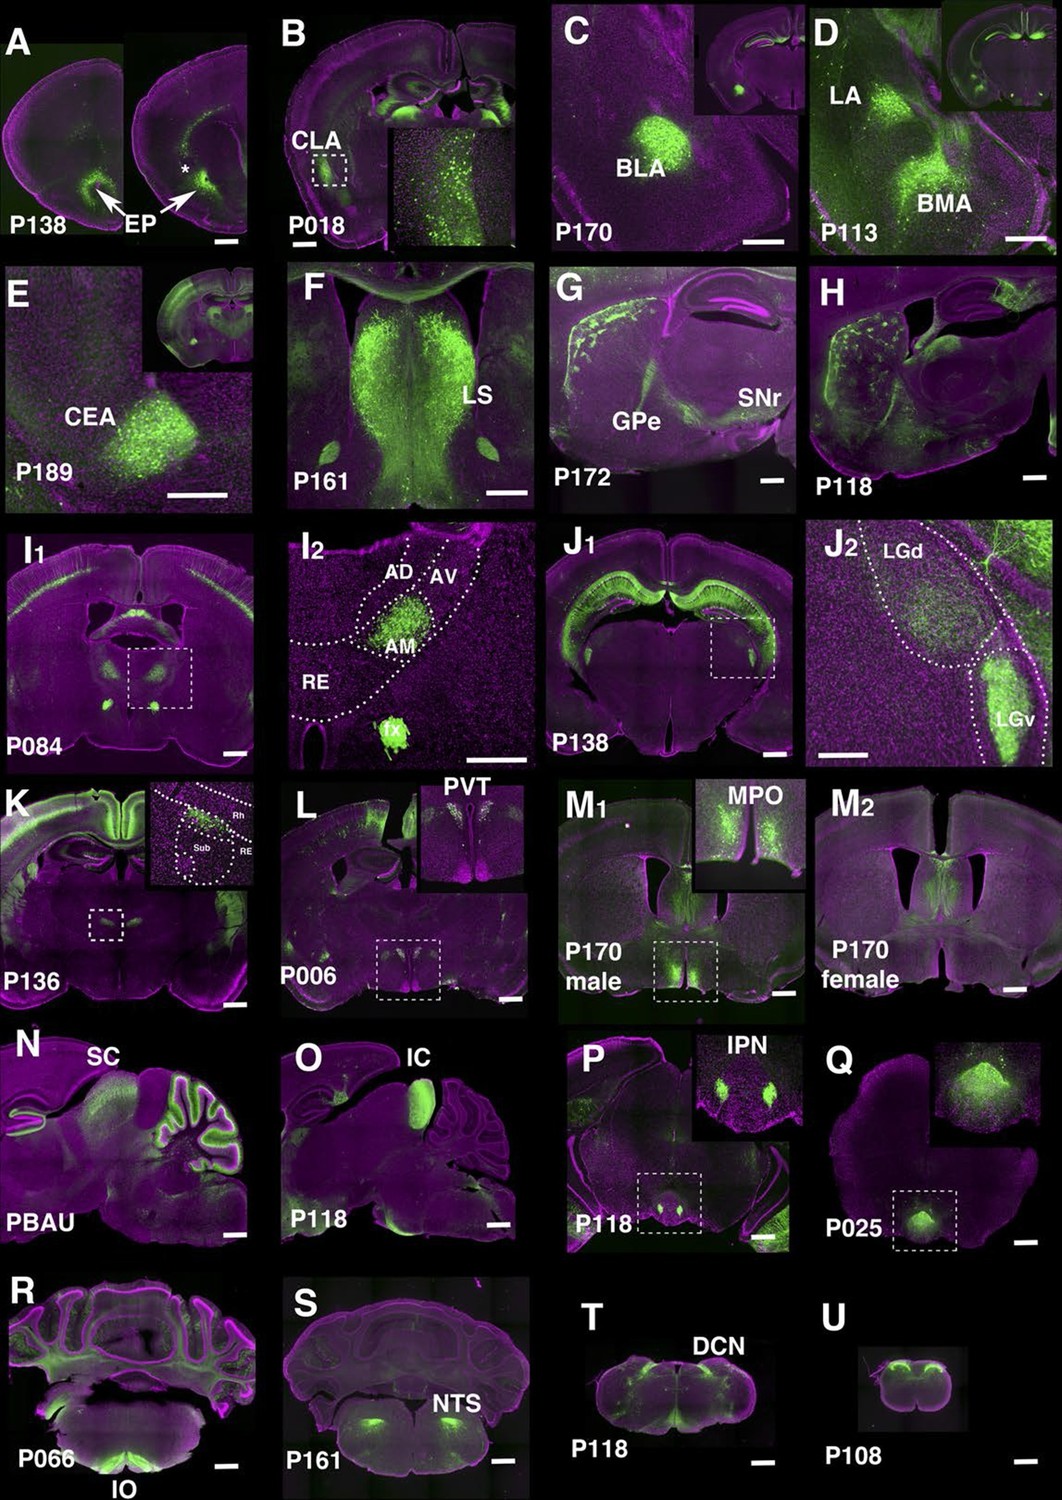
Lines labeling cortical subplate, mesencephalic, and diencephalic cell types.
(A) Endopiriform nucleus (EP) expression in P138 near anterior olfactory nucleus (left) and claustrum (asterisk). Note claustrum does not express mCitrine. (B) Claustrum (CLA) expression in P018. (C and D) Amygdalar nucleus expression in P170 (C, BLA:basolateral) and P113 (D, LA: lateral and BMA: basomedial). (E) Central amygdalar nucleus (CEA) expression in P189. (F) Expression in P161 lateral septum (LS) (G and H) Striosome expression in P172 (G) and P118 (H). GPe: globus pallidus, external part, SNr: substantia nigra, reticular part. (I) Anterior medial nucleus (AM) expression in P084. I2: close up of the rectangle area in I1. AD: anterior dorsal, AV: anterior ventral, RE: nucleus of reunions (J) Expression in ventral lateral geniculate nucleus in P138. J2: close up of the rectangle area in J1. LGd: dorsal lateral geniculate nucleus. (K) Dorsal submedius nucleus expression in P136. Inset: close-up of the rectangle. Sub: submedius nucleus, Rh: rhomboid nucleus. (L) Paraventricular nucleus (PVT) expression in P006 (M) P170 displayed sexually dimorphic expression (M1:male, M2: female) in medial preoptic area (MPO). (N) Superior colliculus (SC) expression in PBAU (O) Inferior colliculus (IC) expression in P118. (P and Q) Expression in subnuclei in interpeduncular nucleus (IPN) in P118 (P) and P025 (Q) (R) Inferior olivary complex (IO) expression in P066. (S) Nucleus of solitary tract (NTS) expression in P161. (T) Dorsal column nucle (DCN) expression in P118. (U) Expression in dorsal spinal cord in P108. Scale bars: 500 μm.
Figure 8
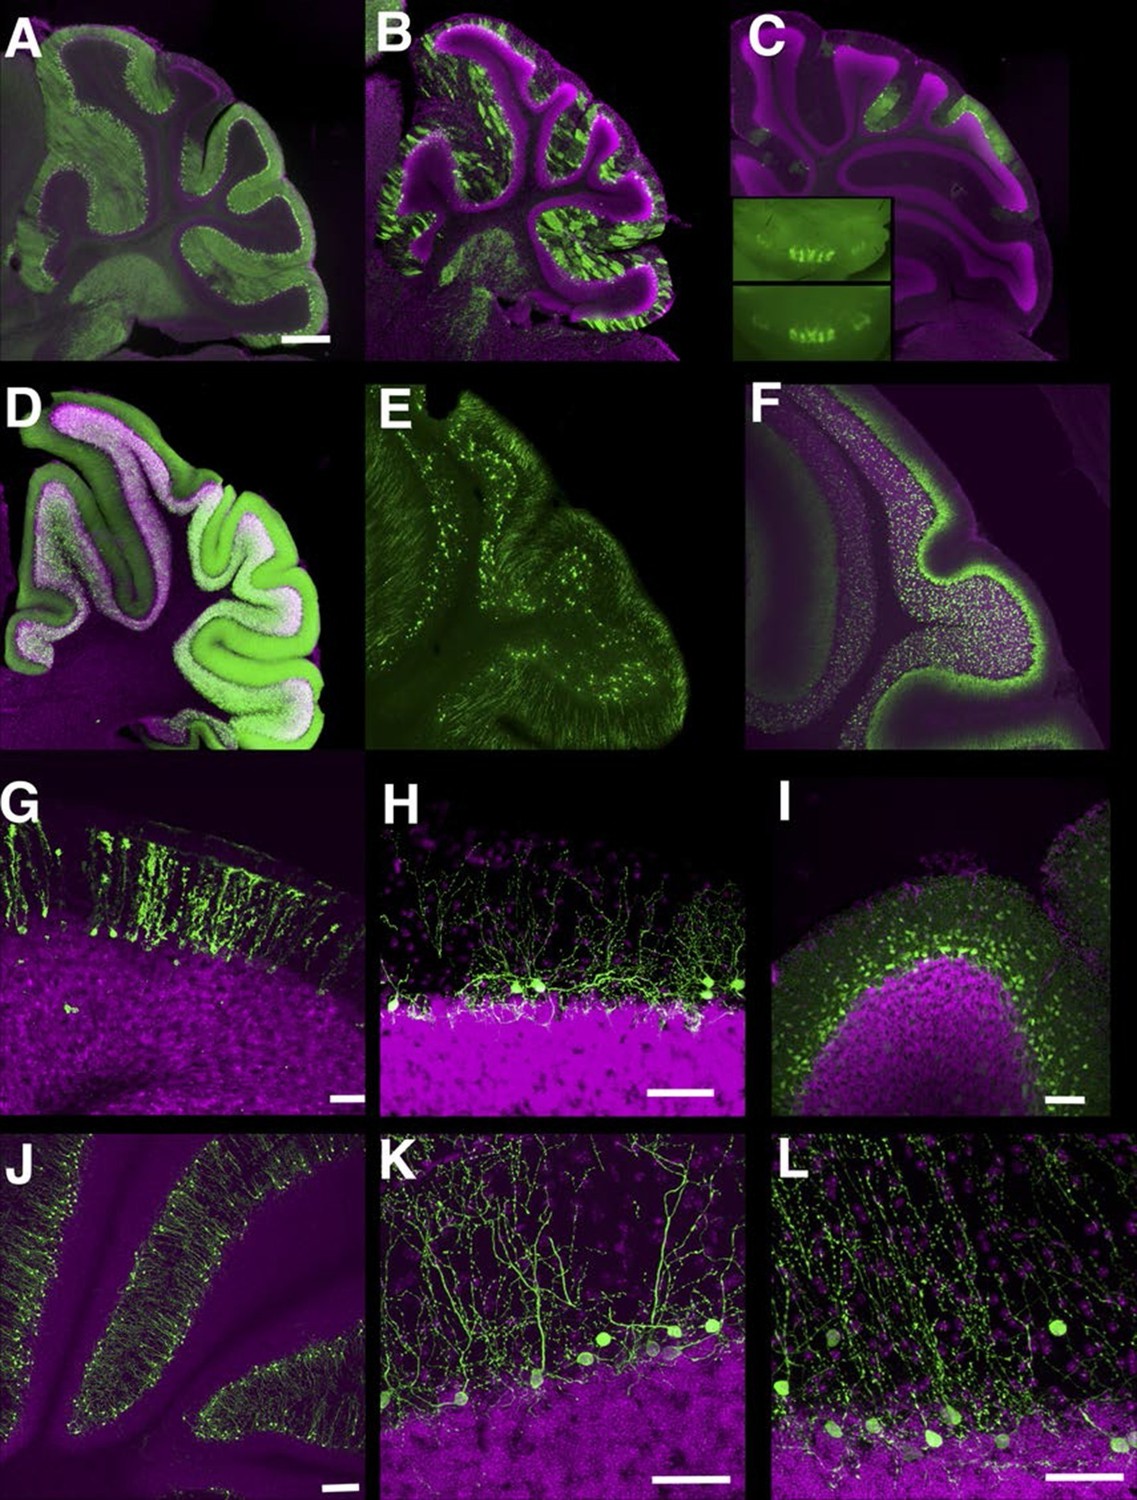
Lines labeling cerebellar cell types.
(A–C) Purkinje cells labeled densely (A, P034), sparsely (B, P096), and in restricted regions (C, P014). C inset: dorsal views of cerebellums from two different individuals. (D–F) Granule cells labeled densely (D, P012), sparsely (E, TCGC), and in a population projecting axons to the basal half of the molecular layer (F, P033). (G) Bergman glia labeling in TCFQ. (H) P102 has sparse labeling in basket cells. (I) P034 has expression in basket cells and stellate cells. (J–K) Lugaro cell like expression in P134 (J and K) and P159 (L). Scale bar in A–F: 500 μm, others: 100 μm.
Figure 9
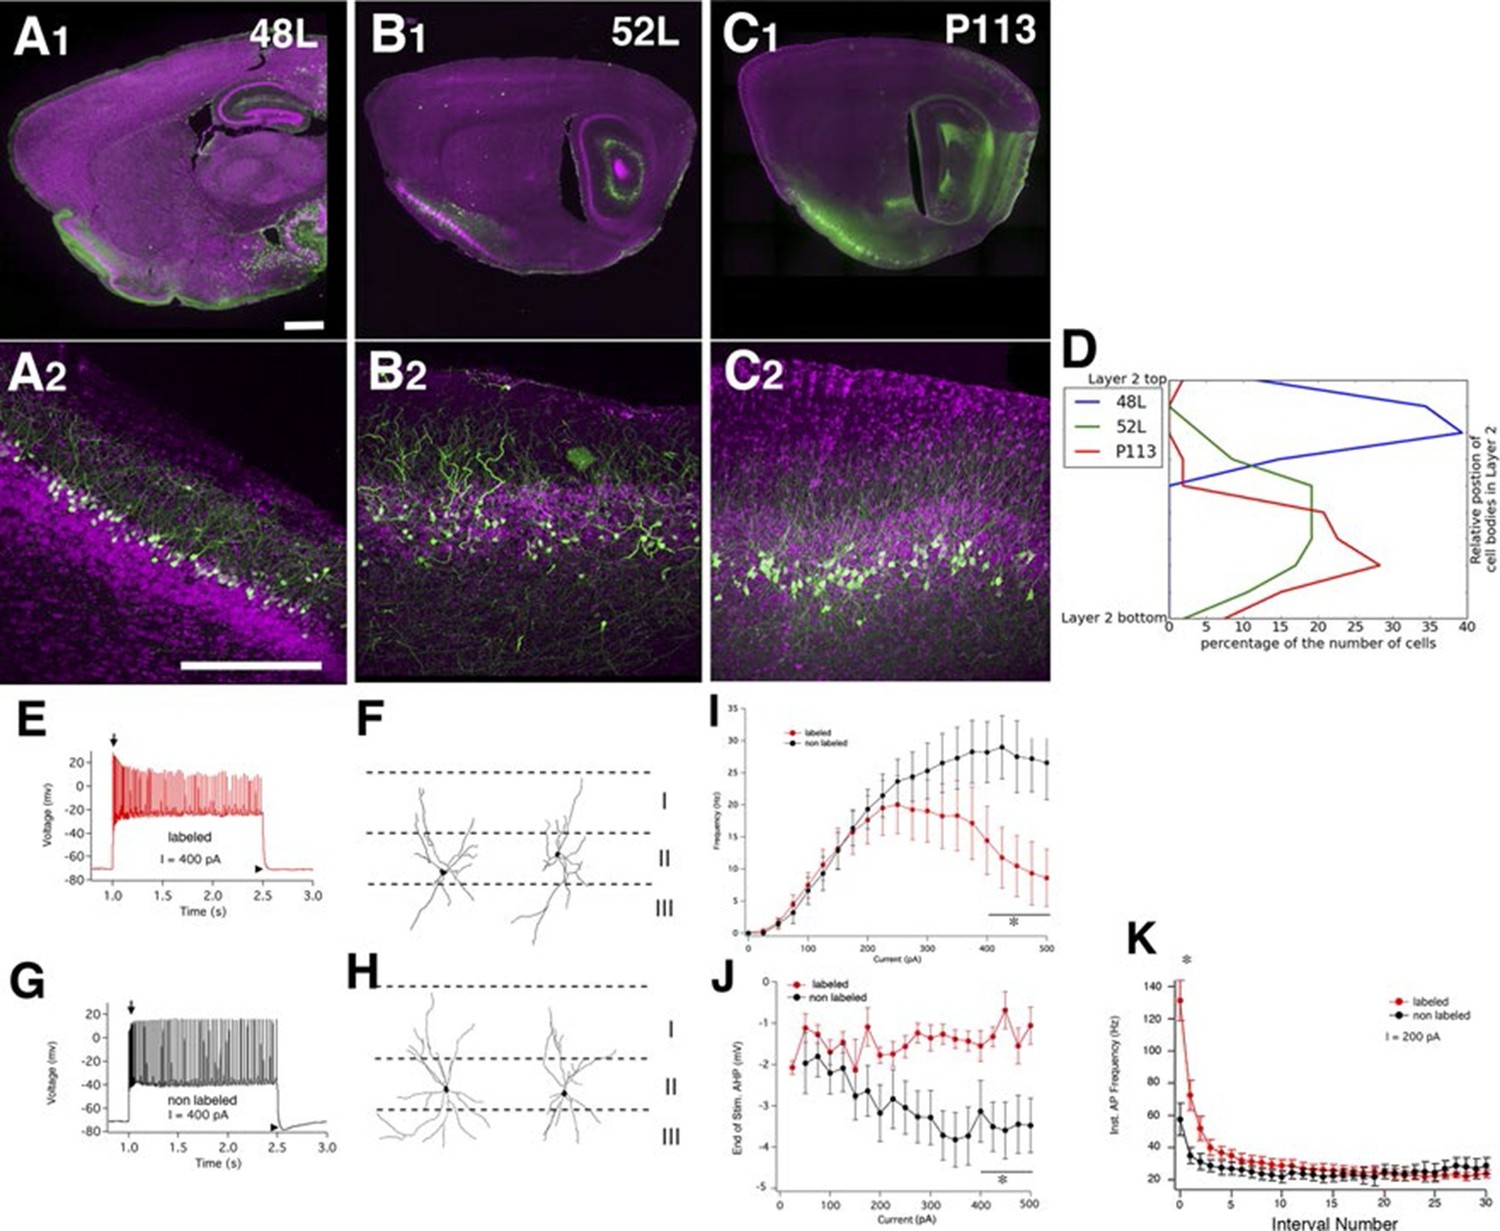
Piriform cortex cell types.
(A–C) Expression in three distinct populations within piriform cortex. (D) Cell body distributions in layer 2. (E–K) 52L labels a previously undistinguished cell type. Firing patterns (E and G) and morphologies (F and H) of labeled (E and F) and non-labeled (G and H) cells in 52L piriform cortex. Arrows: initial burst present in labeled, but not unlabeled cells’ arrowheads: AHP at the end of train present in unlabeled but not labeled cells. Average F–I curves (I), AHP amplitude (J), and instantaneous firing frequency (K) for labeled cells (red) and non-labeled cells (black) were significantly different (asterisks): mean firing frequencies (averaged over 400–500 pA current injection, 11 ± 5 Hz and 28 ± 5 Hz, p = 0.025), AHP amplitude (-1.2 ± 0.3 mV and -3.4 ± 0.6 mV, p=0.0073, labeled and non-labeled cells, respectively), and in instantaneous firing frequencies (131 ± 12 Hz and 58 ± 10 Hz, p = 0.00019). n= 10 for each; line. Scale bars: 500 μm.
Figure 10 with 4 supplements
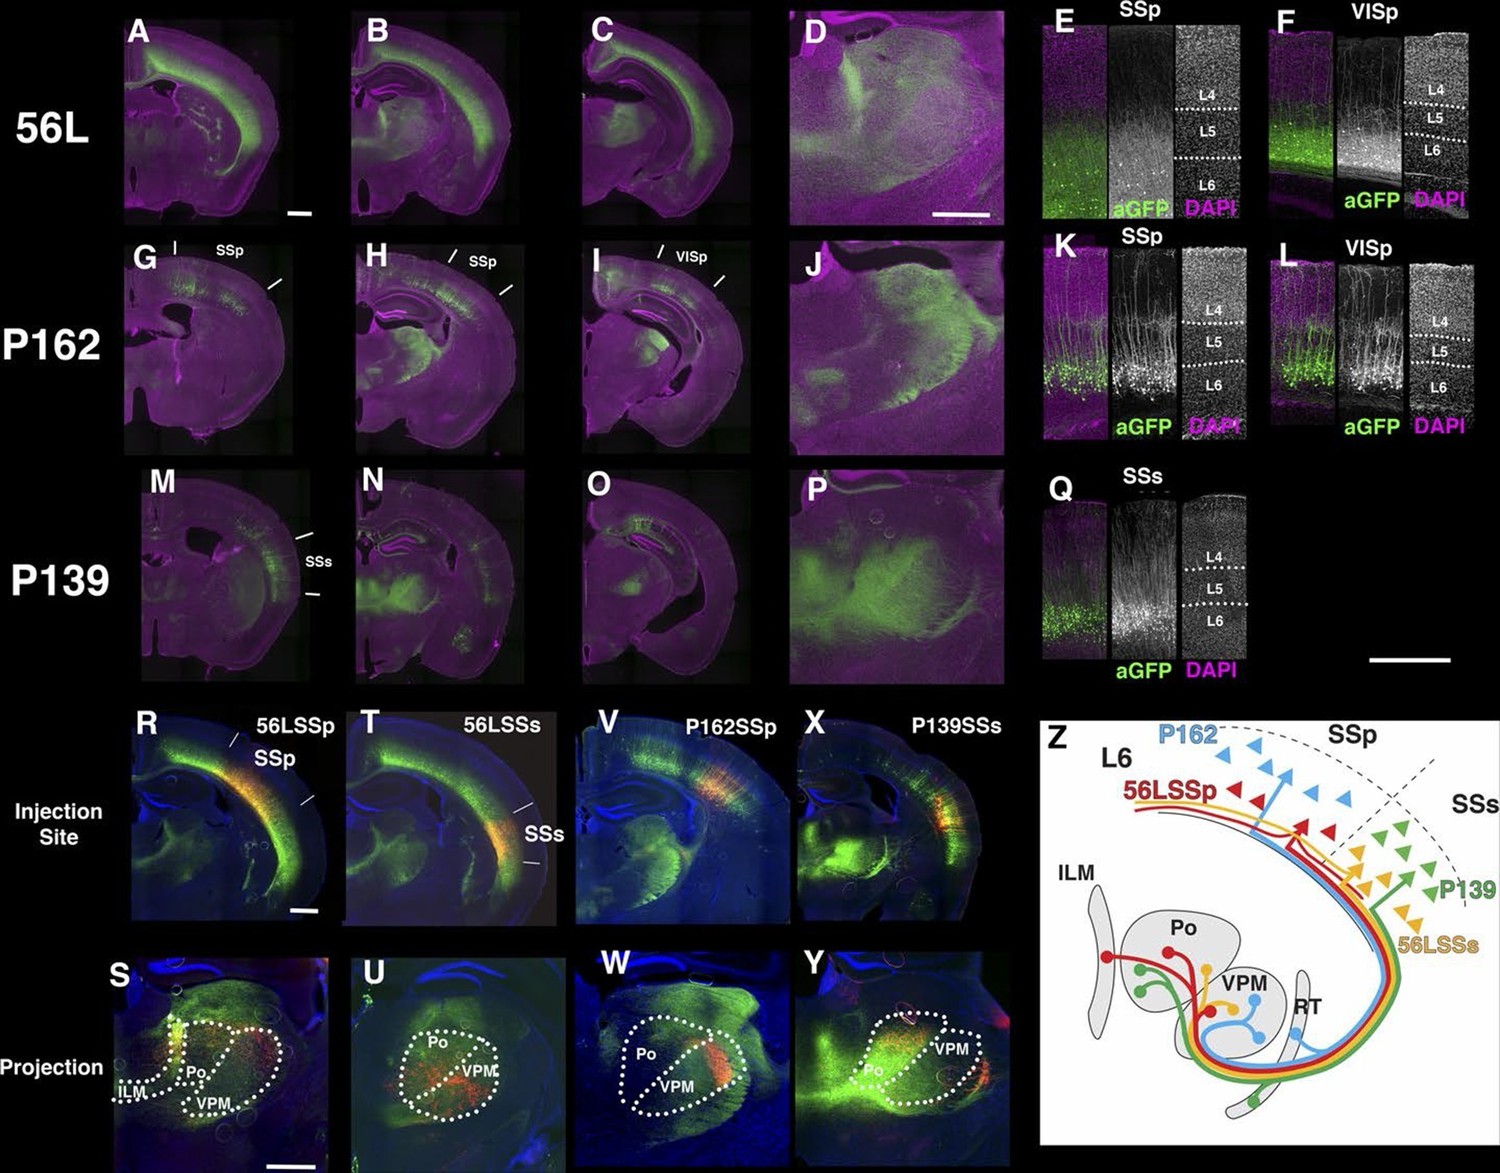
Projections of layer 6 corticothalamic (CT) neurons.
(A–D) Coronal images from 56L. (E and F) confocal images from SSp (E) and VISp (F) from 56L. (G–J) Coronal sections from P162. (K and L) Confocal images from SSp (K) and VISp (L) from P162. (M–P) Coronal images from P139. (Q) Confocal image from P139 SSs. Sections were taken from 0.7 mm (A, G, and M), 1.7 mm (B, D, H, J, N, and P), 2.3 mm (C, I, and O) caudal from bregma. (R–W) tet-reporter virus injection into 56L SSp (R), 56L SSs (T), P162 SSp (V), and P139 SSs (X) and their projection to thalamus (S, U, W, and Y, respectively). (Z) Schematic view of projections in layer 6 lines. ILM: interlaminar nucleus, Po: posterior complex, VPM: ventral posteomedial nucleus. Scale bars: 500 μm.
Figure 10—figure supplement 1
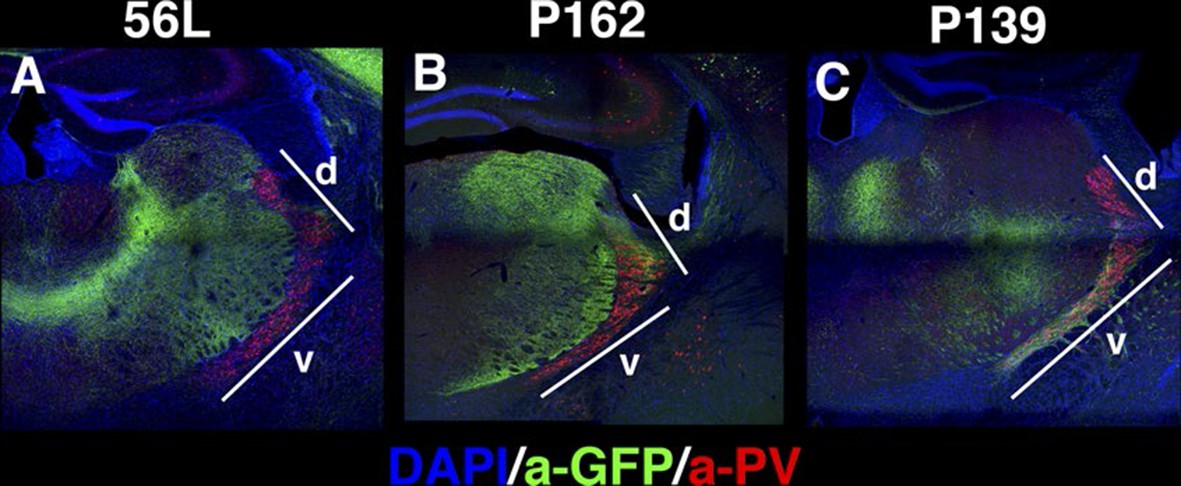
Projections to the reticular nucleus of the thalamus (RT) (A–C) DAPI (blue), anti-GFP (green), and anti-Parvalbumin (PV, red) staining for thalamus of 56L (A), P162 (B), and P139 (C).
Few or no mCitrine-positive axons from 56L (A) project to the PV-positive RT. P162 (B) axons project only to the dorsal (d) part of RT, whereas the ventral (v) part receives axons from P139 (C).
Figure 10—figure supplement 2

Sublaminar location and intrinsic physiology of layer 6 neurons.
(A and B) Positions of mCitrine-positive cell bodies in Layer 5–6 are plotted. (A) P162 (green) and 56L (blue) in SSp. (B) P139 (green) and 56L (blue) in SSs. Dotted lines: averaged borders between layers 5 and 6. (C) Current clamp responses of P162, 56L SSp, P139, 56L SSs to 100 pA current injections. Input resistance (D) whole cell capacitance (E) of layer 6 cells. Asterisks: p<0.05 with Turkey-Kremer’s post hoc test. (F and G) Current clamp responses of labeled (F) and nearby non-labeled (G) neurons in 56L layer 6 during current injection. (H) Firing frequency – current injection plot for labeled and non-labeled neurons in 56L layer 6. n = 16–20.
Figure 10—figure supplement 3
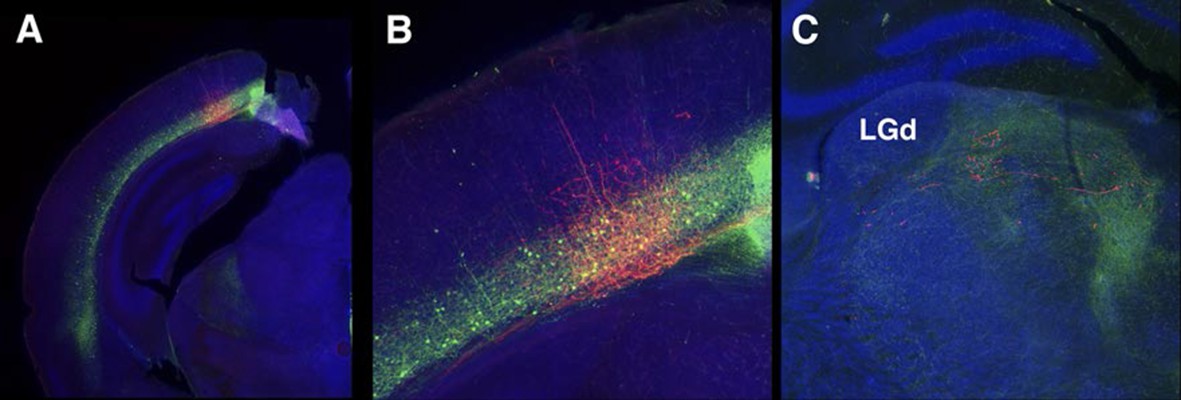
56L axonal projection from VISp to thalamus.
(A) Injection site. (B) High magnification of injection site. (C) Axonal projections to thalamus avoid the dorsal leteral geniculate nuceus (LGd).
Figure 10—figure supplement 4
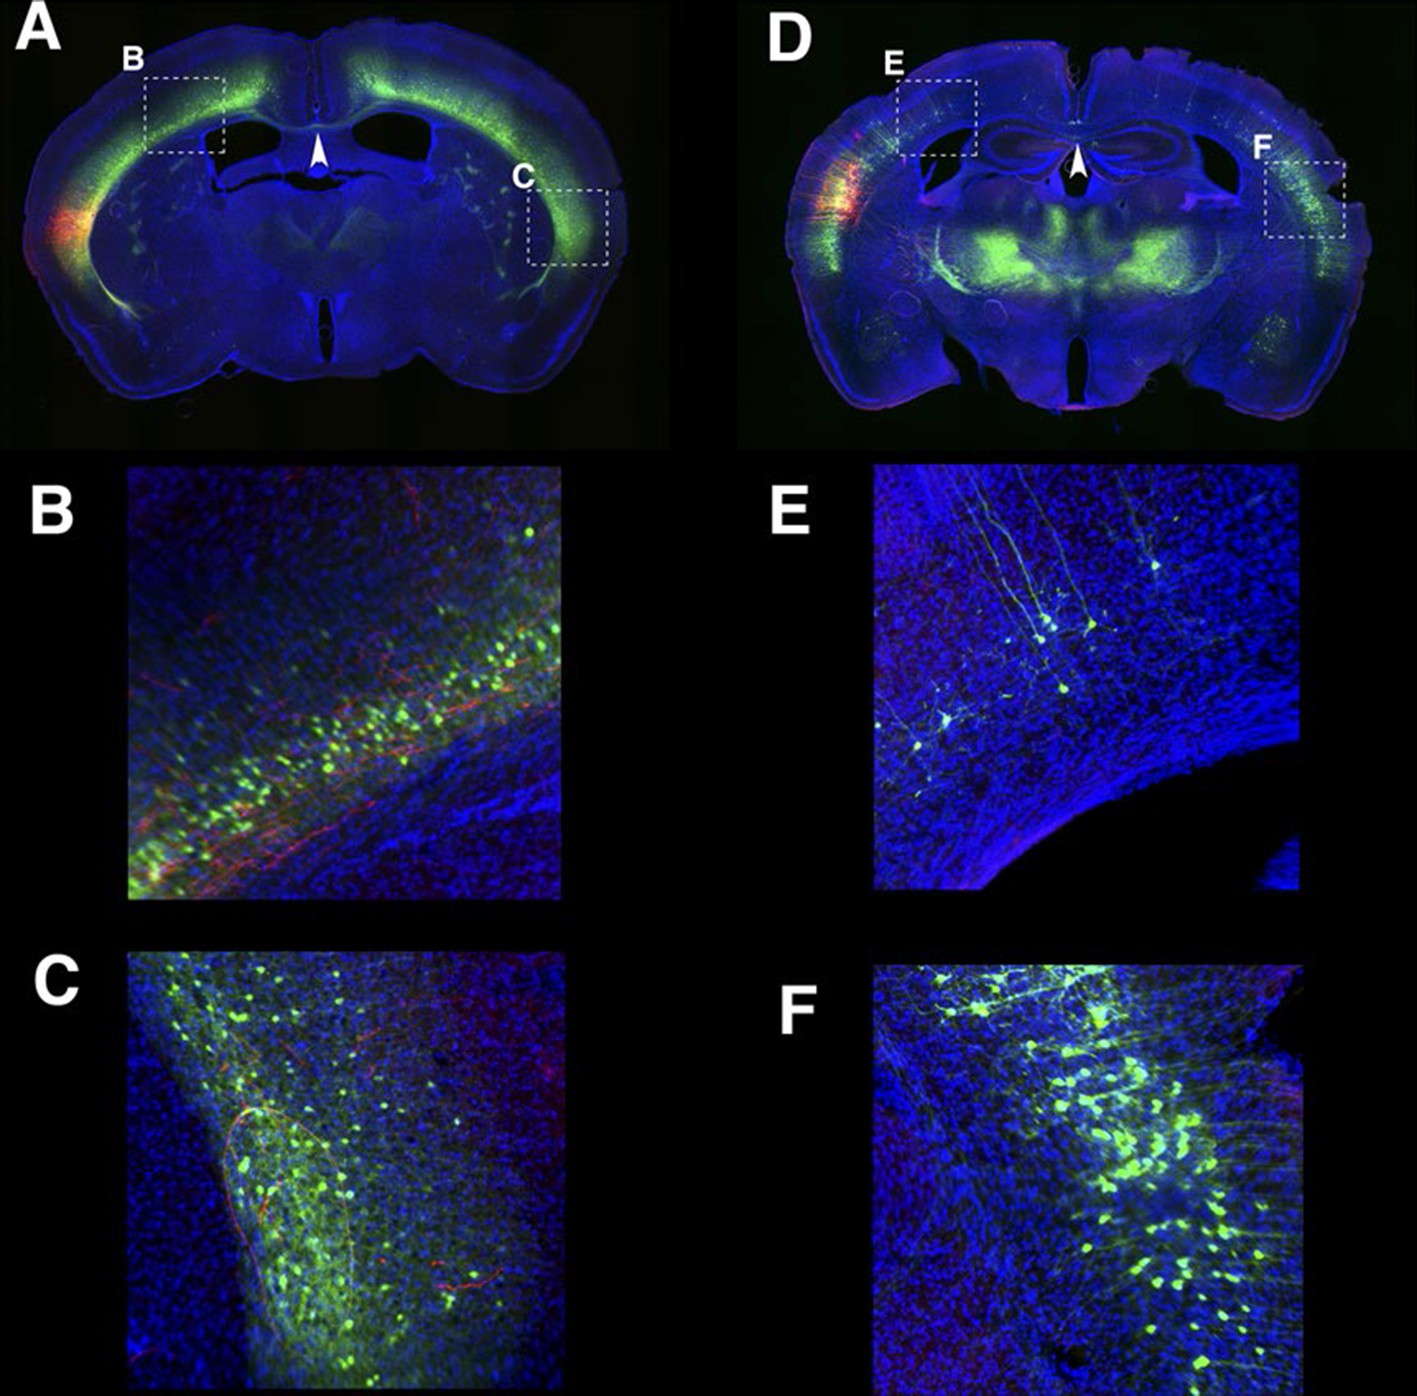
Long lateral projections in 56L and P139 AAV–TRE3GmCherryHA was injected to 56L.
(A–C) and P139 (D–F). B and C high magnification of designated area in A. E and F high magnification of designated area in D. 56L had callosal projections (arrowhead in A) but these were not seen in P139 (arrowhead in C). Red: anti-HA, Green: anti-GFP, Blue: DAPI. Images in D–F and Figure 10X were taken from the same section.
Figure 11 with 2 supplements
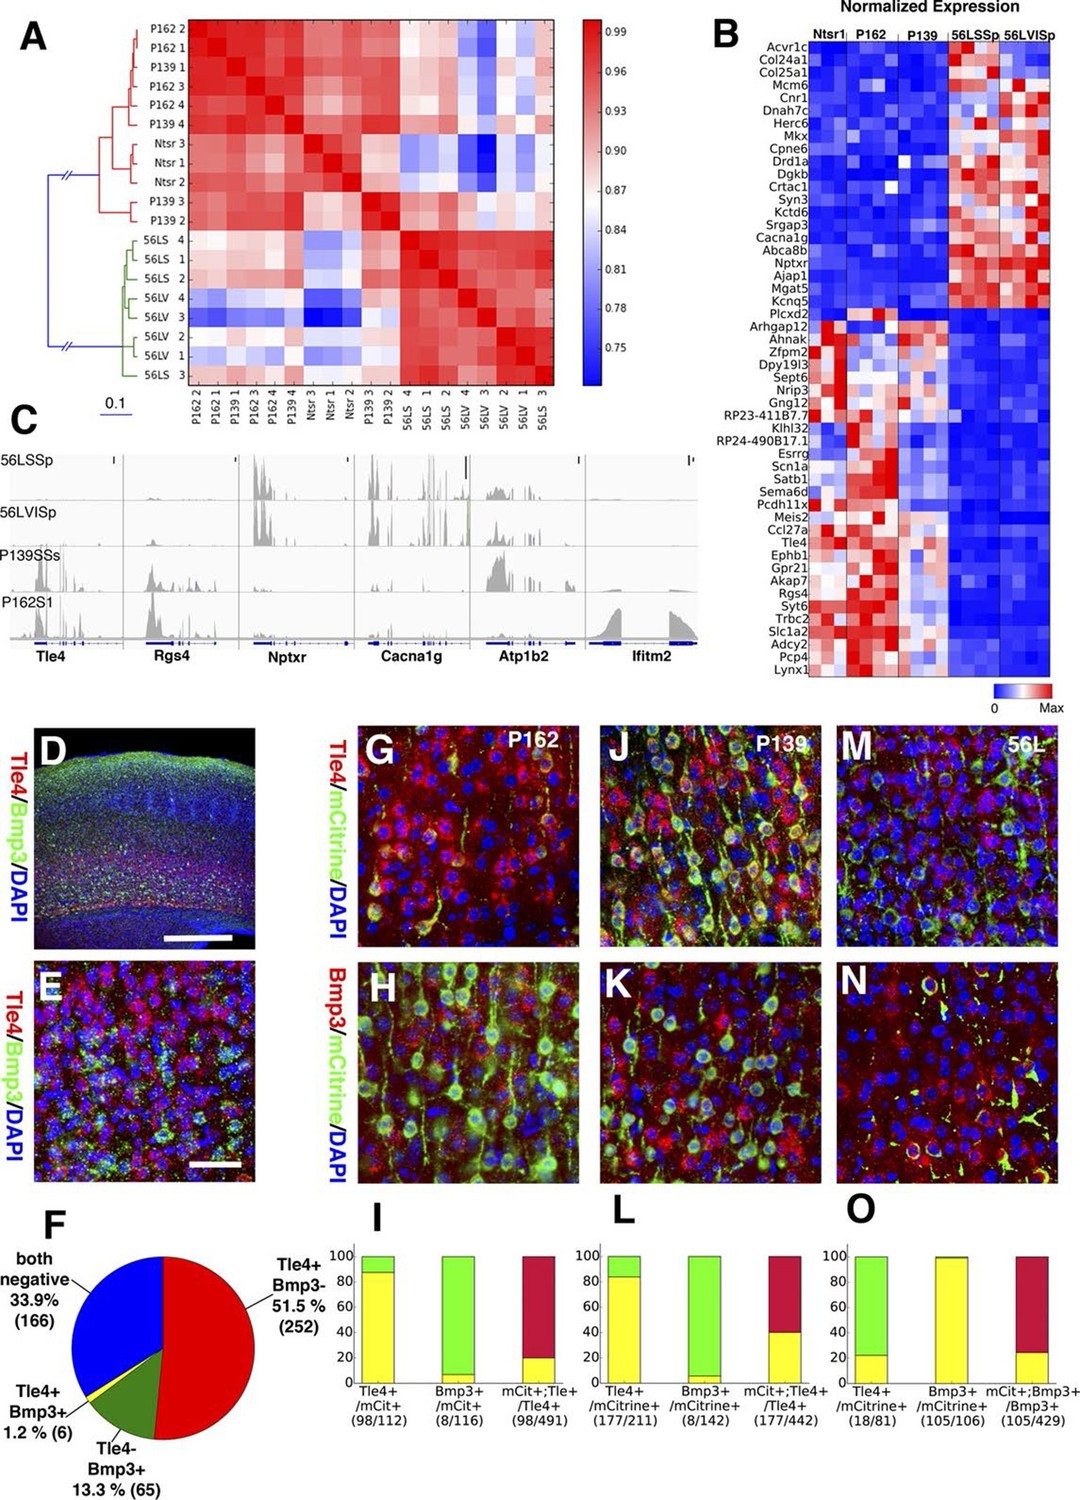
Two main subtypes of L6 CT neurons distinguished by gene expression .
(A) Clustering of L6 CT neuron samples based on correlations (color scale) between expression profiles. (B) Heat map of normalized gene expression (TPM) of 50 genes with lowest ANOVA p-values. Except for Plcxd2 (asterisk), the genes had dominant expression in either Ntsr1/P162/P139 or 56L. (C) Coverage histograms of differentially expressed genes. Examples of genes expressed in P162/P139 (Tle4 and Rgs4), 56L (Nptxr and Cacna1g), P139 (Atp1b2), and P162 (Ifitm2). Scale bars: 100 counts. (D–F) In situ hybridization for Tle4 (red) and Bmp3 (green) in wild type P10 animal SSp. (E) high-magnification image. (F) Proportion of cells expressing Tle4 and Bmp3 in SSp layer 6. (G–O) In situ hybridization for mCitrine and Tle4 (G, J, and M) or Bmp3 (H, K and N) in P162 SSp (G and H), P139 SSs (J and K) and P56 SSp (M and N). (I, L, O) Proportions of mCitrine+ cells that expressTle4 or Bmp3 and converse proportions of cells expressing the dominant marker (Tle4 for I,L Bmp3 for O) that are mCitrine+ from P162 (I), P139 (L) and 56L (O). Colors in bar graphs represent in situ signal patterns (Red: cells with marker gene but not mCitrine, Green: cells with mCitrine signal but not marker gene, and Yellow: cells with both marker and mCitrine signals). Scale bar in D: 500 μm, in E: 50 μm.
Figure 11—figure supplement 1
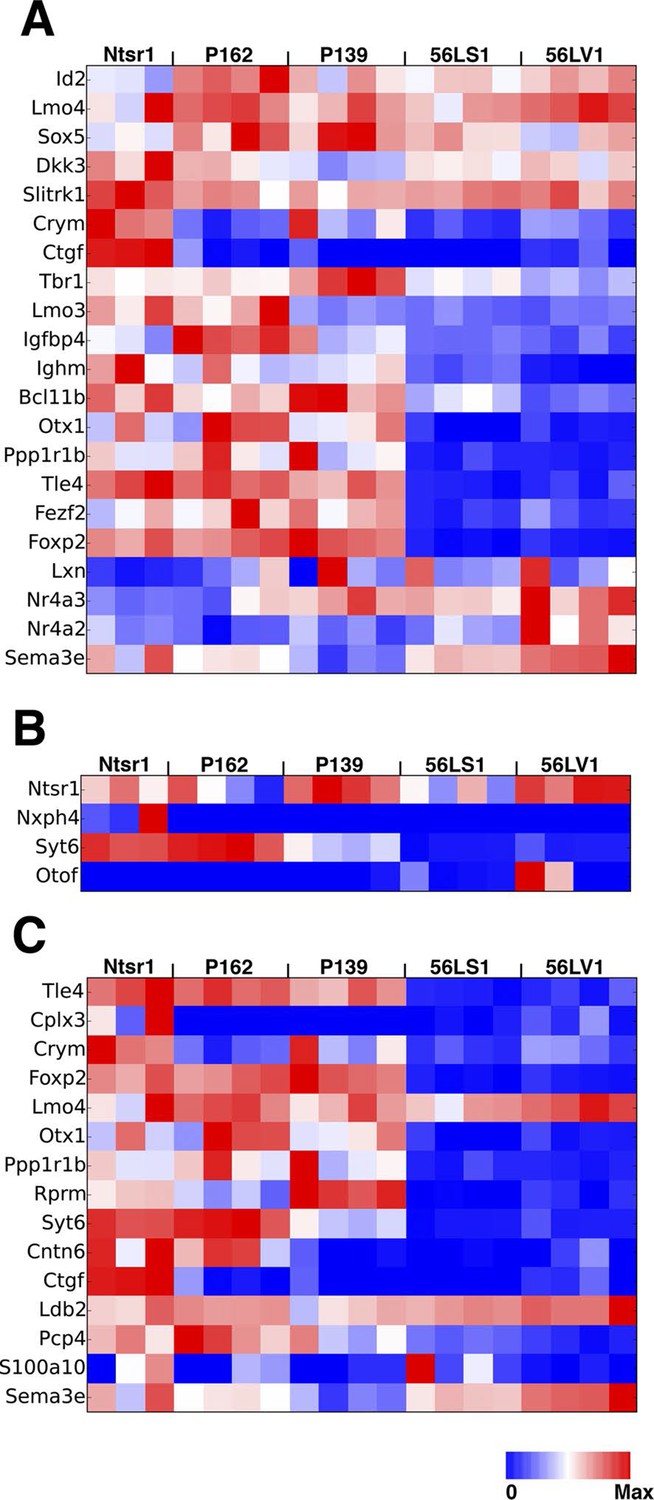
Expression of known L6 marker genes.
(A) Expression levels of known layer 6 marker genes (Molyneaux et al., 2007). (B) Expression levels of genes used to make BAC transgenic lines with layer 6 expression (Harris et al., 2014). (C) Layer 6 marker genes found by single cell RNAseq (Zeisel et al., 2015).
Figure 11—figure supplement 2
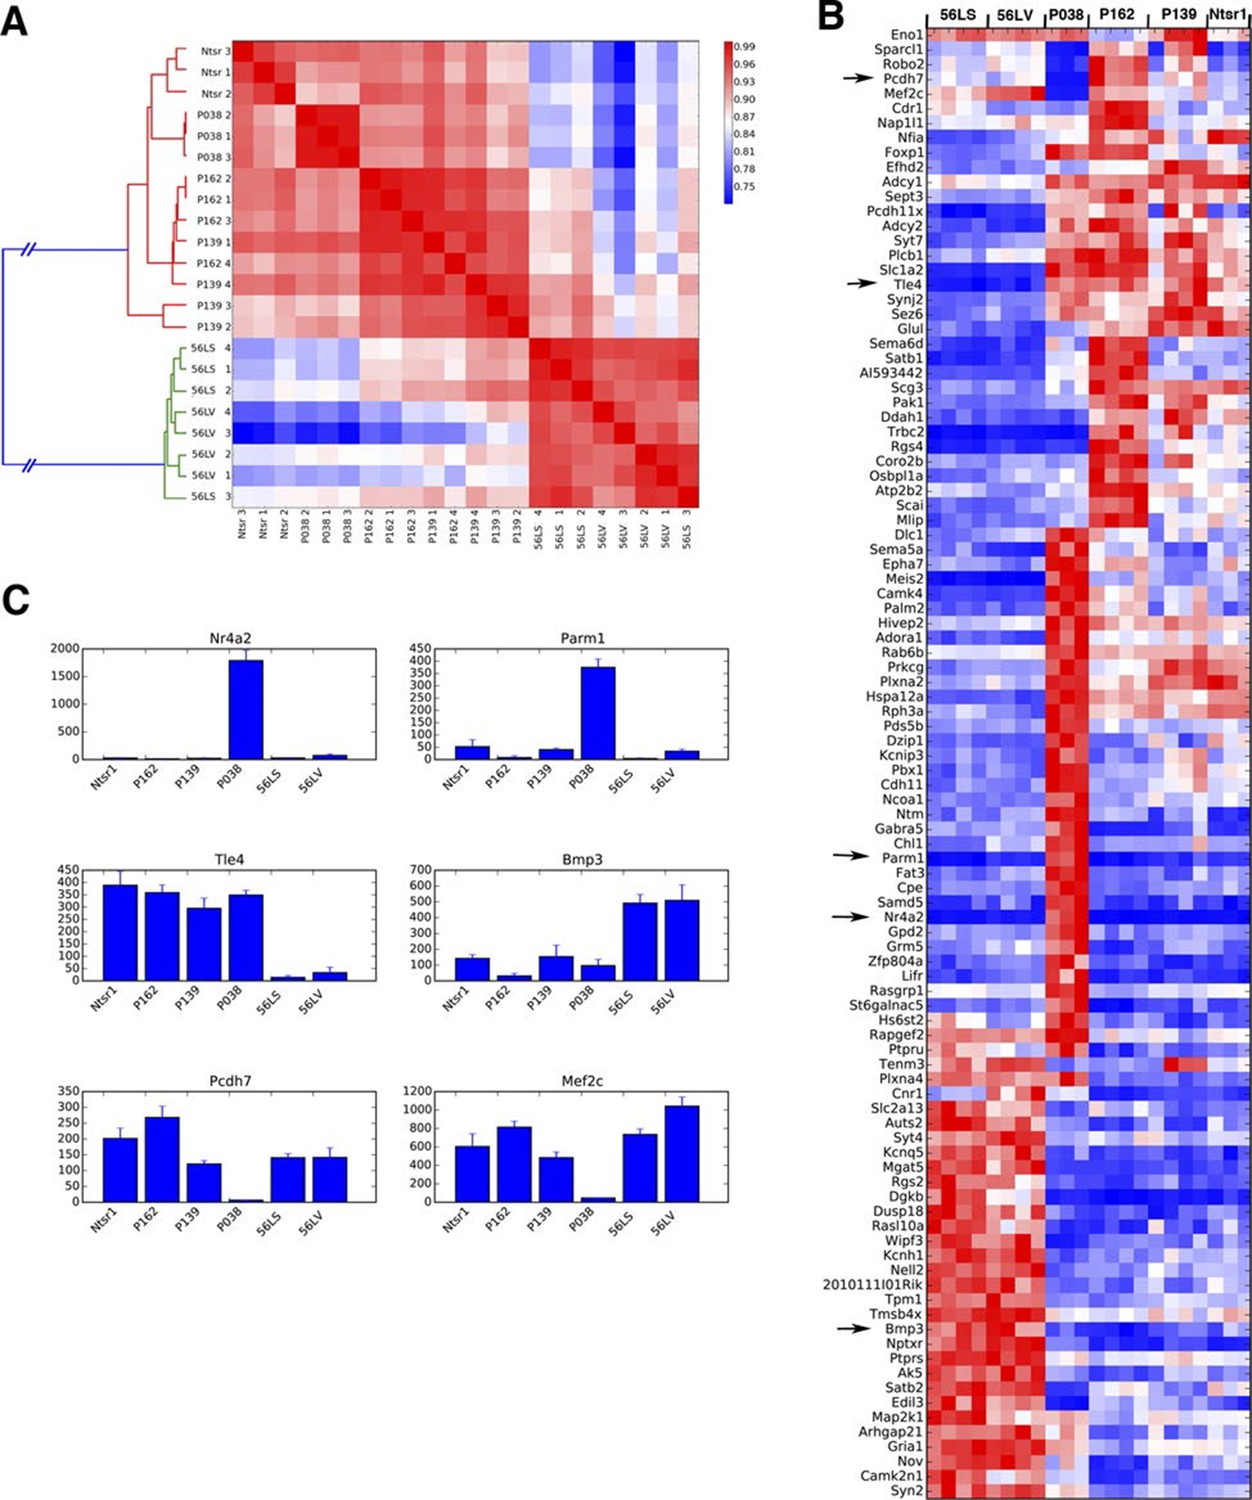
P038 entorhinal cortex layer 6 neurons are a distinct population.
(A) Sample clustering (B) Heat map for top 100 genes with lowest ANOVA p-values. Arrows: genes shown in C. (C) Example of genes uniquely expressed in P038 (Nr4a2 and Parm1), Ntsr1 group and 56L markers (Tle4 and Bmp3), and selectively not expressed in P038 (Pcdh7 and Mef2c). y-axes: TPM.
Tables
Table 1
Efficiency of transgenesis. The numbers of lines dissected and the number of lines with brain expression are shown separately for each construct used.
construct | analyzed | with expression |
lentivirus | ||
| HSP-tet | ||
HSP-tet | 132 | 38 |
hsp-tet2 | 7 | 4 |
hsp-tet3 | 12 | 0 |
promoter-tet | ||
CamKII-tet | 18 | 4 |
minCamKN-te | 17 | 7 |
Thy1-tet | 15 | 0 |
minThy1-tet | 11 | 0 |
Gad1-tet | 9 | 0 |
Slc-tet | 6 | 0 |
enhancer-tet | ||
119-tet | 13 | 1 |
121-tet | 2 | 0 |
122-tet | 15 | 2 |
170-tet | 2 | 1 |
PiggyBac | ||
| HSP-tet | ||
tet | 101 | 81 |
tet-Cre | 57 | 43 |
Table 2
Transposition efficiency PB;PBase double hemizygous animals (PB/+; PBase/+) were crossed with wild type animals and genotypes of pups from the mating were examined (see the mating scheme in Figure 1—figure supplement 1B). Numbers of animals are shown in parentheses. PB transmission rate: number of PB+ animals / total number of animals, PB transposition rate: number of PB in new sites / number of animals tested for transposition. (Note: we did not test transposition for PB/+;Rosa-PBase/+ and PB/+;Prm1-PBase/+ males because transgenes might not be stably transmitted to the next generation in these animals). New line production efficiency: number of animals with new insertion site / total number of animals born. *: All PB+ animals were female.
Seed line | PBase line | PB transmission rate | Transposition efficiency | Efficiency of new line production |
PBAG | Rosa | 28.6% (54/189) | 41.4 % (12/29) | 6.4 % (12/189) |
| Prm1 | 29.2% (21/72) | 56.3 % (9/16) | 12.5% ( 9/72) |
PBAW | Rosa | 21.56% (80/371) | 62.2 % (23/37) | 6.2 % (23/371) |
| Prm1 | 33.0 % (97/294) * | 67.4 % (62/92) | 21.1% ( 62/294) |
PBAS | Rosa | 30.8 % (33/107) | 25.0 % (3/12) | 3.3 % ( 3/97) |
| Prm1 | 35.6 % (130/365) | 41.9 % (39/93) | 10.7 % (39/365) |
PBAU | Rosa | 22.2 % (30/135) | 38.9 % (7/18) | 5.2 % (7/135) |
| Prm1 | 34.3 % (46/134) | 57.1 % (20/35) | 14.9 % (20/134) |
PBAQ | Rosa | 37.5 % (6/16) | 0 % (0/3) | 0 % (0/16) |
| Prm1 | 60.0 % (9/15) | 12.5 %( 1/8) | 6.6 % (1/15) |
Table 3
Numbers of insertion events occurring in genes and intergenic regions.
Insertion Sites | Number of lines |
gene | 60 |
coding exon | 1 |
3'UTR | 4 |
intron | 55 |
intergenic | 81 |
repetitive sequence | 26 |
Table 4
Rates of inter-chromosomal, intrachromosomal and local (within 2 Mb) transposition events. Some insertions were not located due to insertion in repetitive sequences.
line | number of lines | inter-chromosomal hop | intra-chromosomal hop | local (<2 Mb) hop | not located |
PBAW | 69 | 46 (66.7 %) | 11(15.9 %) | 8(11.6 %) | 12 (17.4 %) |
PBAS | 46 | 26 (56.5 %) | 18 (39.1%) | 9 (19.6%) | 2 (4.3 %) |
PBAU | 26 | 13 (50.0 %) | 8 (30.8 %) | 2 (7.7%) | 5 (19.2 %) |
Total | 141 | 85 (60.2 %) | 37 (26.2 %) | 19 (13.4%) | 19 (13.4 %) |
Additional files
-
Supplementary file 1
Enhancer trap line data List of lines generated in this study.
Line names beginning with the letter P are PiggyBac lines, others are lentiviral. Insertion sites and brief description of expression patterns are shown.
- https://doi.org/10.7554/eLife.13503.036
-
Supplementary file 2
Annotations of line expression Expression evaluation of the PB lines.
- https://doi.org/10.7554/eLife.13503.037
Download links
A two-part list of links to download the article, or parts of the article, in various formats.
Downloads (link to download the article as PDF)
Open citations (links to open the citations from this article in various online reference manager services)
Cite this article (links to download the citations from this article in formats compatible with various reference manager tools)
A Mammalian enhancer trap resource for discovering and manipulating neuronal cell types
eLife 5:e13503.
https://doi.org/10.7554/eLife.13503


