Causal evidence for lateral prefrontal cortex dynamics supporting cognitive control
- Florida State University, United States
- University of California, Berkeley, United States
Figures
Figure 1

Task, cTBS targets, and dynamic causal model.
(A) The design orthogonally manipulated factors of Stimulus Domain (verbal, spatial) and two forms of cognitive control: Contextual Control (low – Control, Delay; high – Restart, Dual) and Temporal Control (low – Control, Restart; high – Delay, Dual). These factors were fully crossed in a 2 × 2 × 2 design. (B) The basic task required participants to judge whether a stimulus followed the previous stimulus in a sequence. The sequence in the verbal task was the order of the letters in the word ‘tablet.’ The sequence in the spatial task was a trace of the points of a star. The start of each sequence began with a decision regarding whether the currently viewed stimulus is the start of the sequence (e.g. ‘t’ in the verbal task). Factors were blocked with each block containing a basic task phase, a sub-task phase, a return trial, and a second basic task phase (not depicted), for all but the Control blocks. Control blocks consisted only of the basic task phase extended to match the other conditions in duration. Colored frames indicated whether letters or locations were relevant for the block (verbal – purple; spatial – orange in this example; verbal condition depicted). The basic task was cued by square frames. Other frames cued the different sub-task conditions. In the Delay condition (circle frames), participants held in mind the place in the sequence across a distractor-filled delay. In the Restart condition (diamond frames), participants started a new sequence. In the Dual condition (cross frames), participants simultaneously started a new sequence, and maintained the place in the previous sequence. (C) Each sphere represents a stimulus target for an individual. Red – rostral LPFC, green – mid LPFC, blue – caudal LPFC, black – S1 (control site). (D) The dynamic causal model estimated previously (Nee and D'Esposito, 2016). Colored arrows denote modulations of effective connectivity during different cognitive control demands (orange – attention to spatial features; purple – attention to verbal features; green – Contextual Control; red – Temporal Control). Colors of the circles denote univariate sensitivities to Feature Control (blue), Contextual Control (green), and Temporal Control (red). Lightning bolts indicate targets for continuous theta-burst transcranial magnetic stimulation (cTBS). cTBS was predicted to affect behavior for which a given region was responsive, and also behaviors supported by downstream regions that require processing in upstream targets. cMFG, caudal middle frontal gyrus; FPl, lateral frontal pole; IFJ, inferior frontal junction; MFG, middle frontal gyrus; SFS, superior frontal sulcus; VLPFC, ventrolateral prefrontal cortex.
Figure 2 with 5 supplements
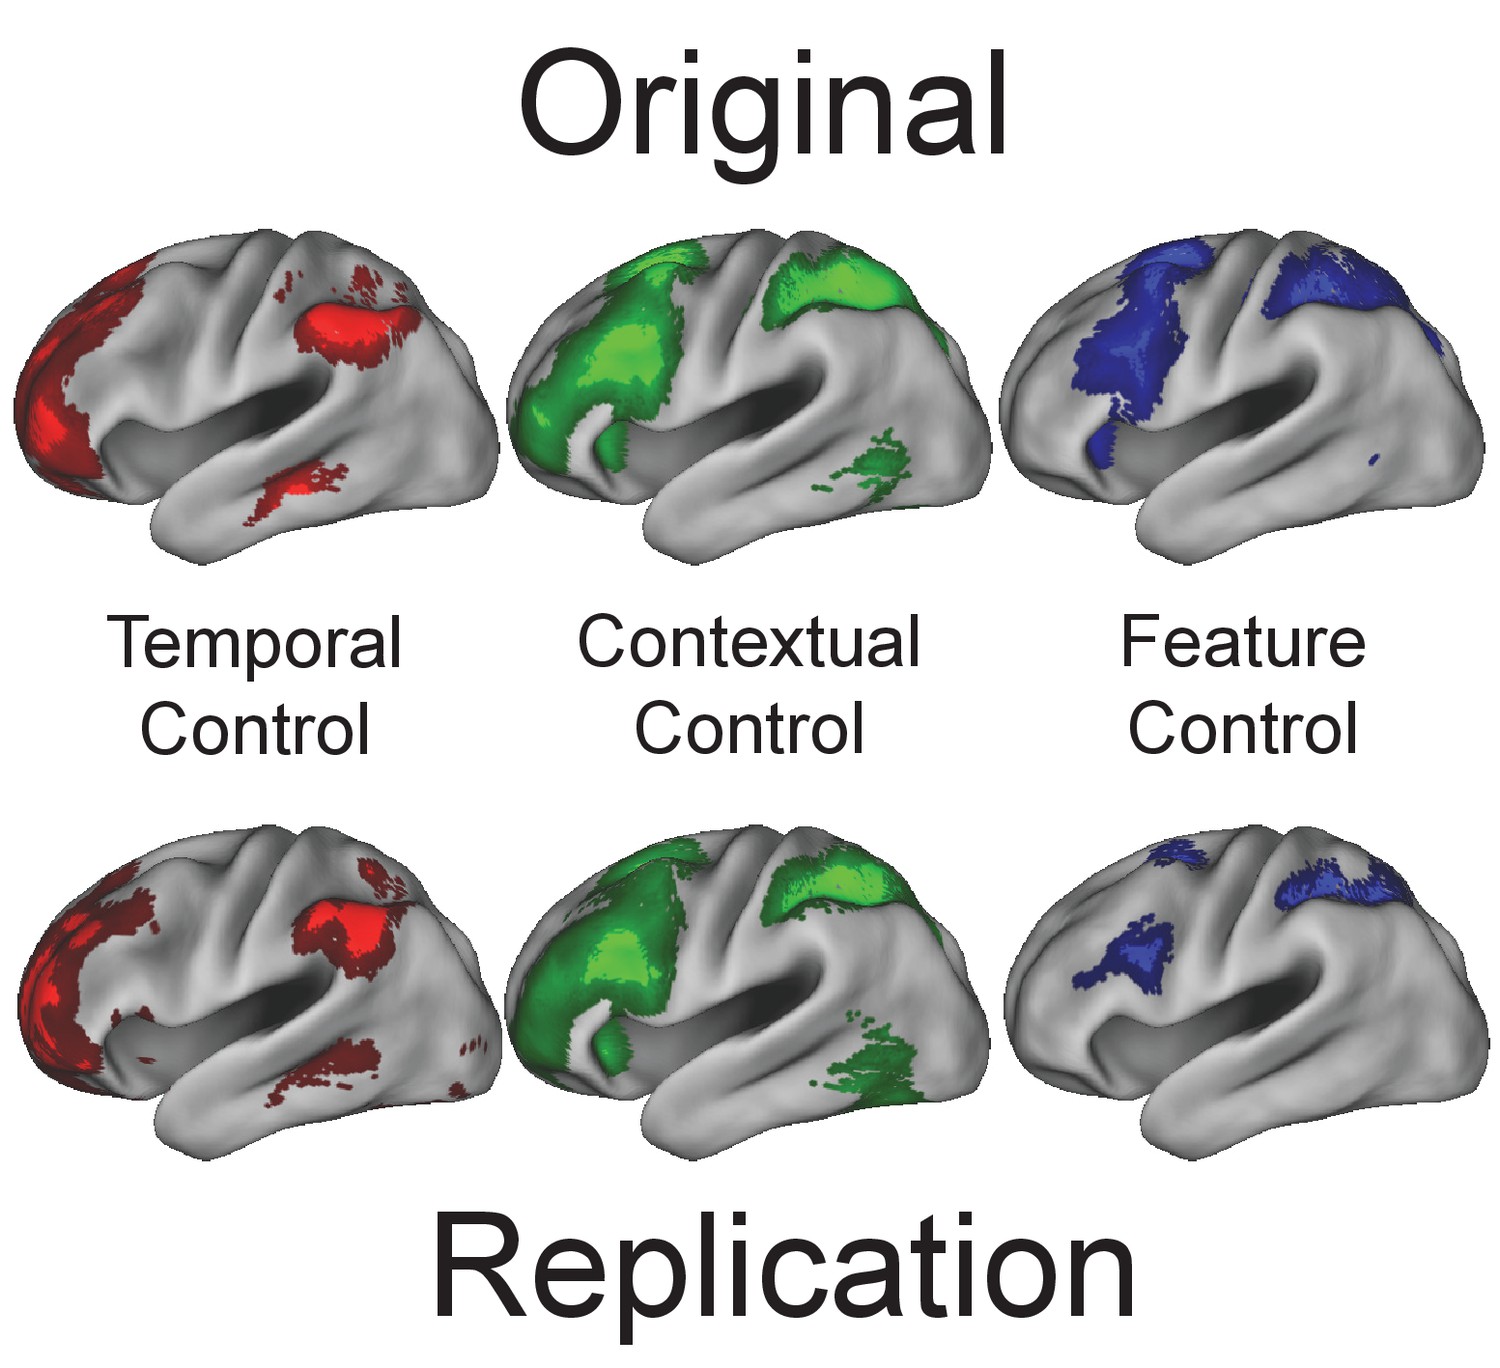
Univariate replication.
Top: previously reported univariate effects. Bottom: univariate effects in the present study. In both cases, Temporal Control elicited activation of rostral LPFC, Contextual Control of mid LPFC, and Feature Control of caudal LPFC, indicating a rostral-caudal gradient of cognitive control. All results thresholded at p<0.001 at the voxel level with cluster extent providing family-wise error correction at p<0.05.
Figure 2—figure supplement 1
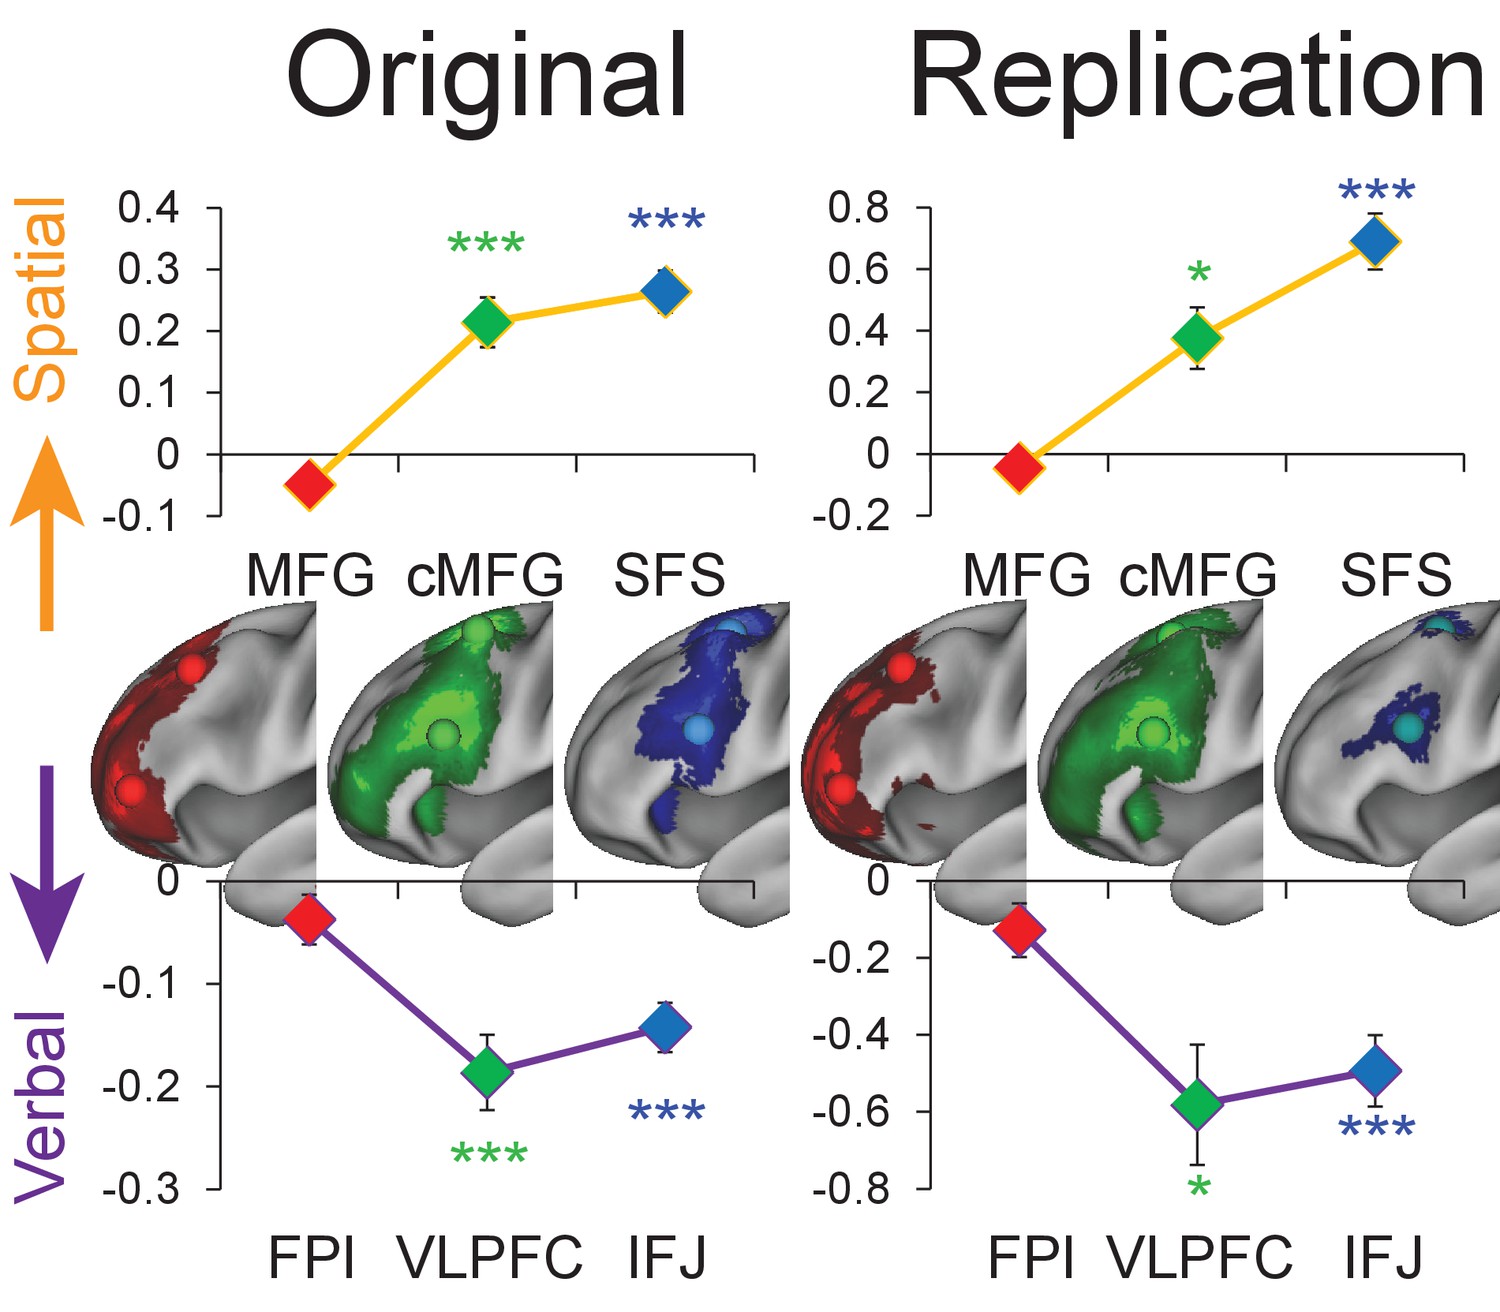
Stimulus domain abstraction replication.
Left: previously reported univariate effects of Stimulus Domain. Right: Univariate effects of Stimulus Domain in the present study. The y-axis depicts the contrast of Stimulus Domain with positive effects indicating increasing spatial sensitivity and negative effects indicating increasing verbal sensitivity. Effects of Stimulus Domain were present in caudal (SFS – t(23) = 10.50, pcorrected <10−8; IFJ – t(23) = −4.73, pcorrected <0.001) and mid LPFC (cMFG – t(23) = 3.35, pcorrected <0.05; VLPFC – t(23) = −3.70; pcorrected <0.01), but not rostral (MFG – t(23) = −0.70, p>0.4; FPl – t(23) = −0.87, p>0.3) LPFC, consistent with rostral areas performing abstract cognitive control that does not depend on stimulus features. Statistics reflect Bonferroni-corrected tests in the present study. *pcorrected<0.05; **pcorrected<0.005; ***pcorrected<0.0005.
Figure 2—figure supplement 2
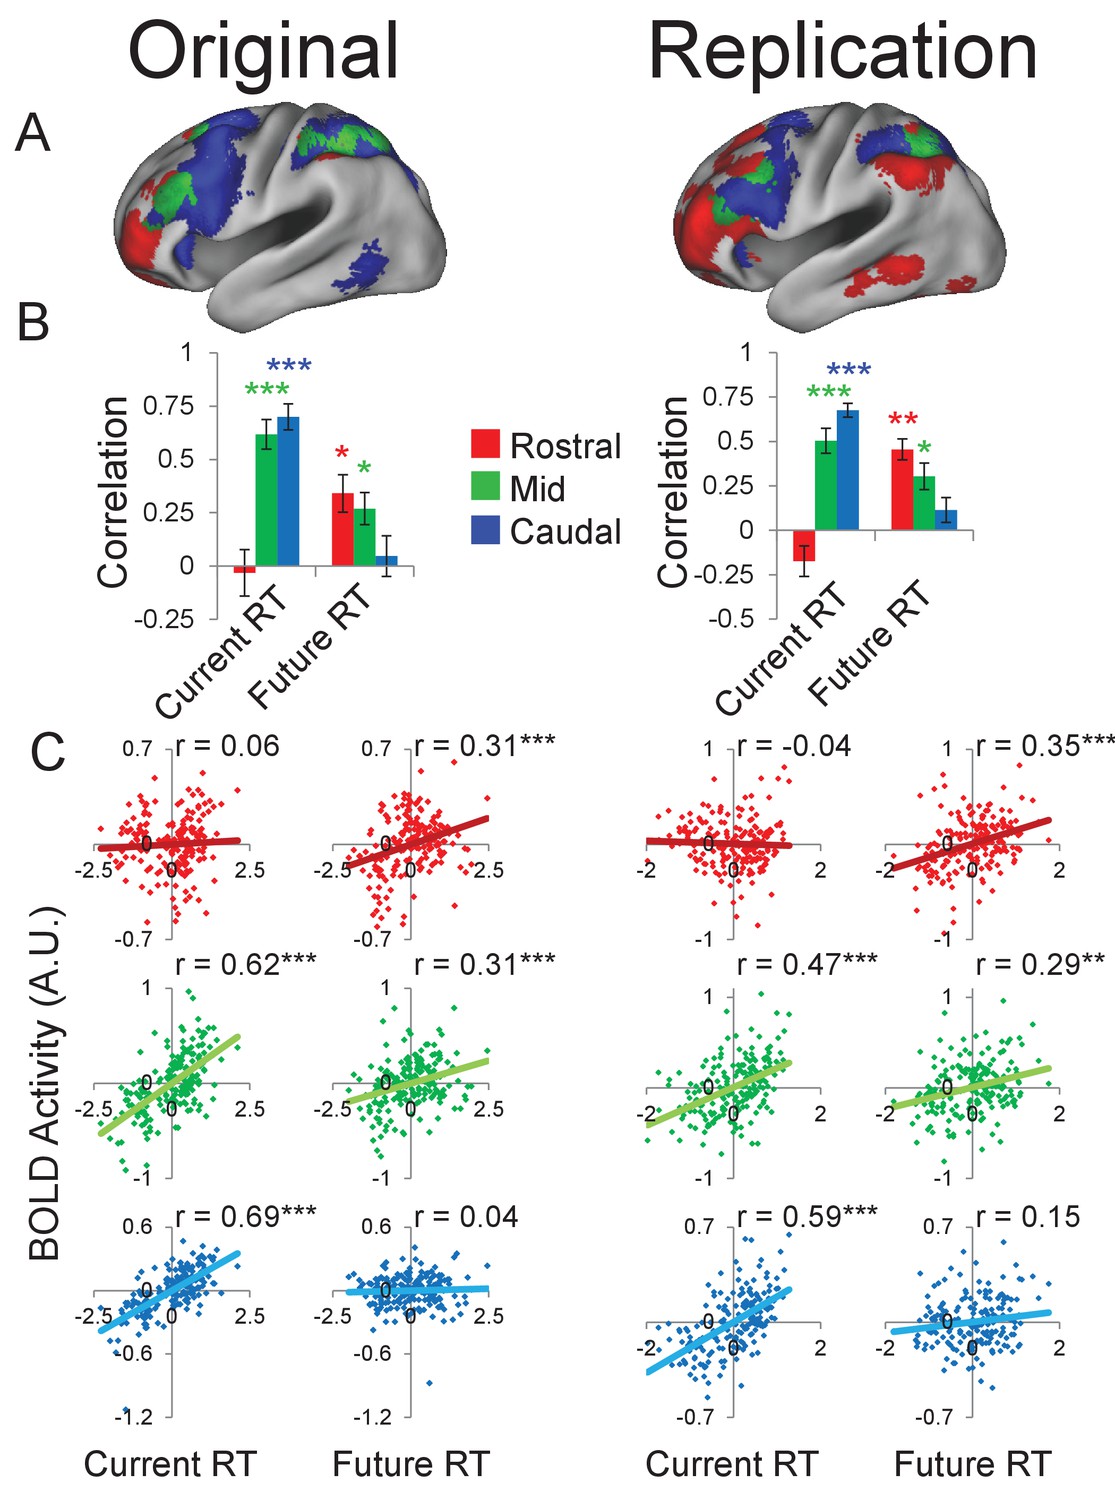
Temporal activation-behavior relationship replication.
Left: previously reported partial correlations between activation and behavior. Right: partial correlations between activation and behavior in the present study. Current reaction time (RT) corresponds to sub-task trials whereas future RT corresponds to return trials. RT measures have been normalized within-subject across the 8 conditions of interest. (A) Voxel-wise regression of Current and Future RT onto activations for the 8 conditions of interest across subjects. Individual subject terms have been regressed out. Red: significant correlations with Future RT only. Blue: significant correlations with Current RT only. Green: both. (B) Average partial correlation between activation and RT for the 8 conditions of interest computed separately for each subject (summary-statistic approach). (C) Partial correlations between activation and RT for the 8 conditions of interest for all subjects. Individual subject terms have been regressed out. Red: rostral LPFC. Green: mid LPFC. Blue: caudal LPFC. In all cases, caudal LPFC was sensitive to Current (summary statistic approach– t(23) = 8.70, pcorrected<10-7; full partial correlation – r = 0.59, pcorrected<10−15), but not Future RT (summary statistic approach – t(23) = 0.74, p>0.4; full partial correlation – r = 0.15, pcorrected>0.3). Rostral LPFC was sensitive to Future (summary statistic approach – t(23) = 4.29, pcorrected<0.005; full partial correlation – r = 0.35, pcorrected<0.0001), but not Current RT (summary statistic approach – t(23) = t(23)=−1.29, p>0.2; full partial correlation – r = −0.04, p>0.6). Mid LPFC was sensitive to both Current (summary statistic approach – t(23) = 5.36, pcorrected<0.0005; full partial correlation – 0.47, pcorrected<10−9) and Future RT (summary statistic approach – t(23) = 3.48, pcorrected<0.05; full partial correlation r = 0.29, p<0.001). Collectively, these results indicate a temporal abstraction gradient. Statistics reflect Bonferroni-corrected tests in the present study. *pcorrected<0.05; **pcorrected<0.005; ***pcorrected <0.0005.
Figure 2—figure supplement 3
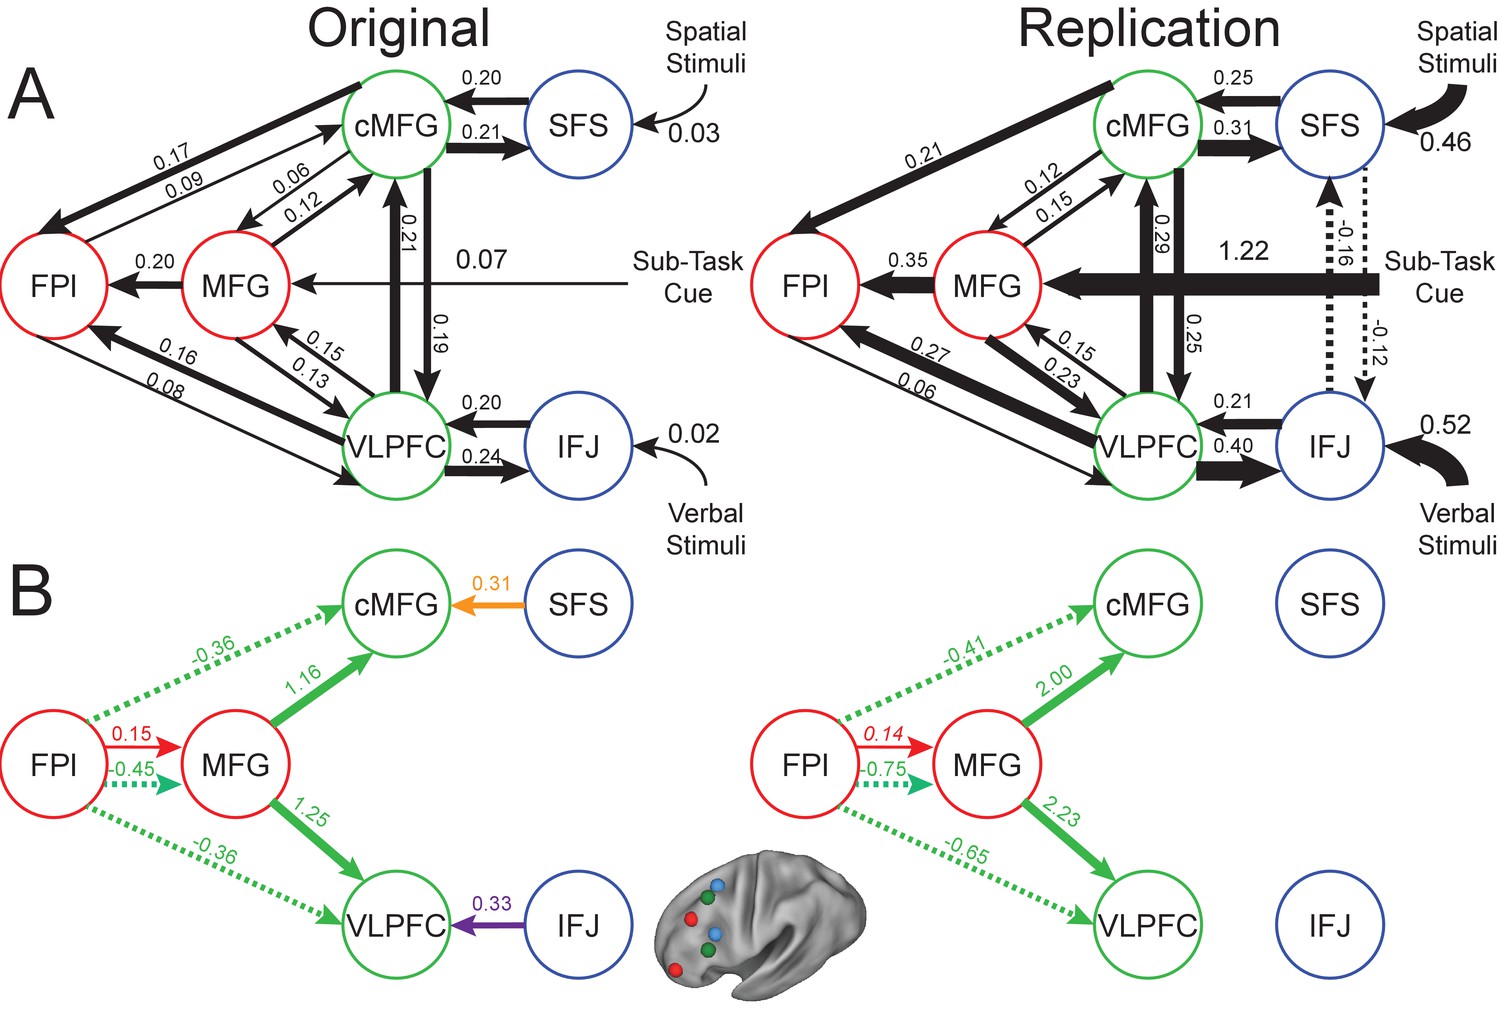
LPFC dynamic causal model replication.
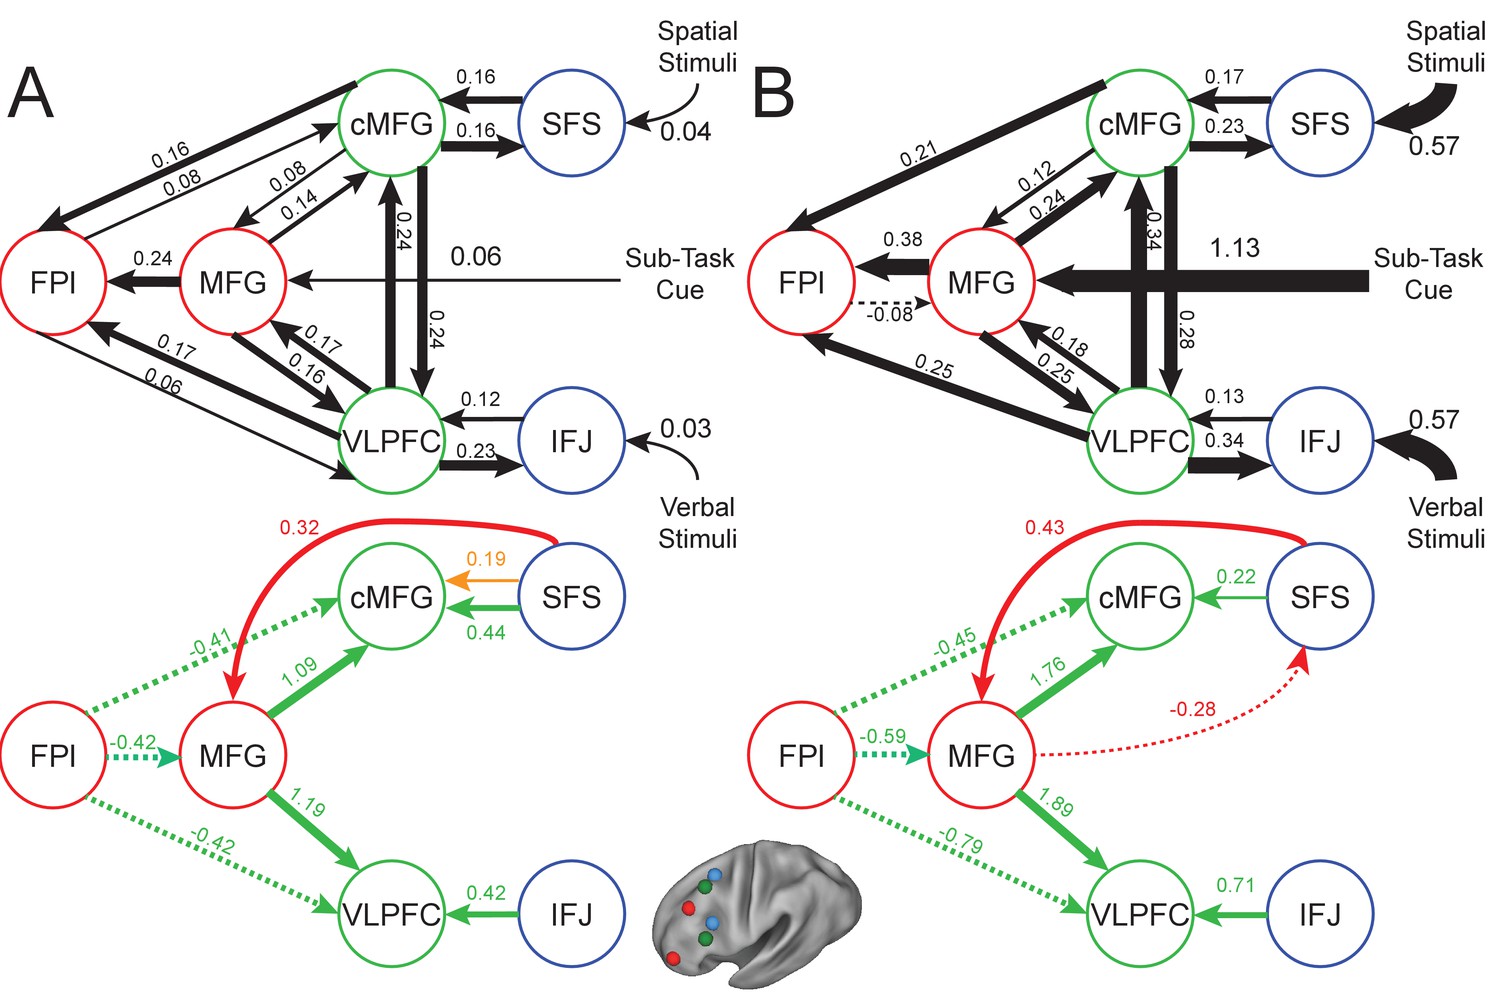
Left: parameter estimates for the best model indicated by random effects Bayesian model selection previously. Right: parameter estimates for the same model in the present data. Arrows indicate direction of influence, numbers and line widths indicate the strength of influence, and dashed arrows indicate inhibitory influences. (A) Fixed connectivity and inputs depicted in black. (B) Modulations of connectivity by Spatial Stimulus Domain (orange), Verbal Stimulus Domain (purple), Contextual Control (green), and Temporal Control (red) demands. All depicted parameters are significant after correction using false-discovery rate with the exception of the italicized modulation of connectivity between FPl and MFG in the replication sample, which just missed significance (q = 0.057). cMFG, caudal middle frontal gyrus; FPl, lateral frontal pole; IFJ, inferior frontal junction; MFG, middle frontal gyrus; SFS, superior frontal sulcus; VLPFC, ventrolateral prefrontal cortex.
Figure 2—figure supplement 4
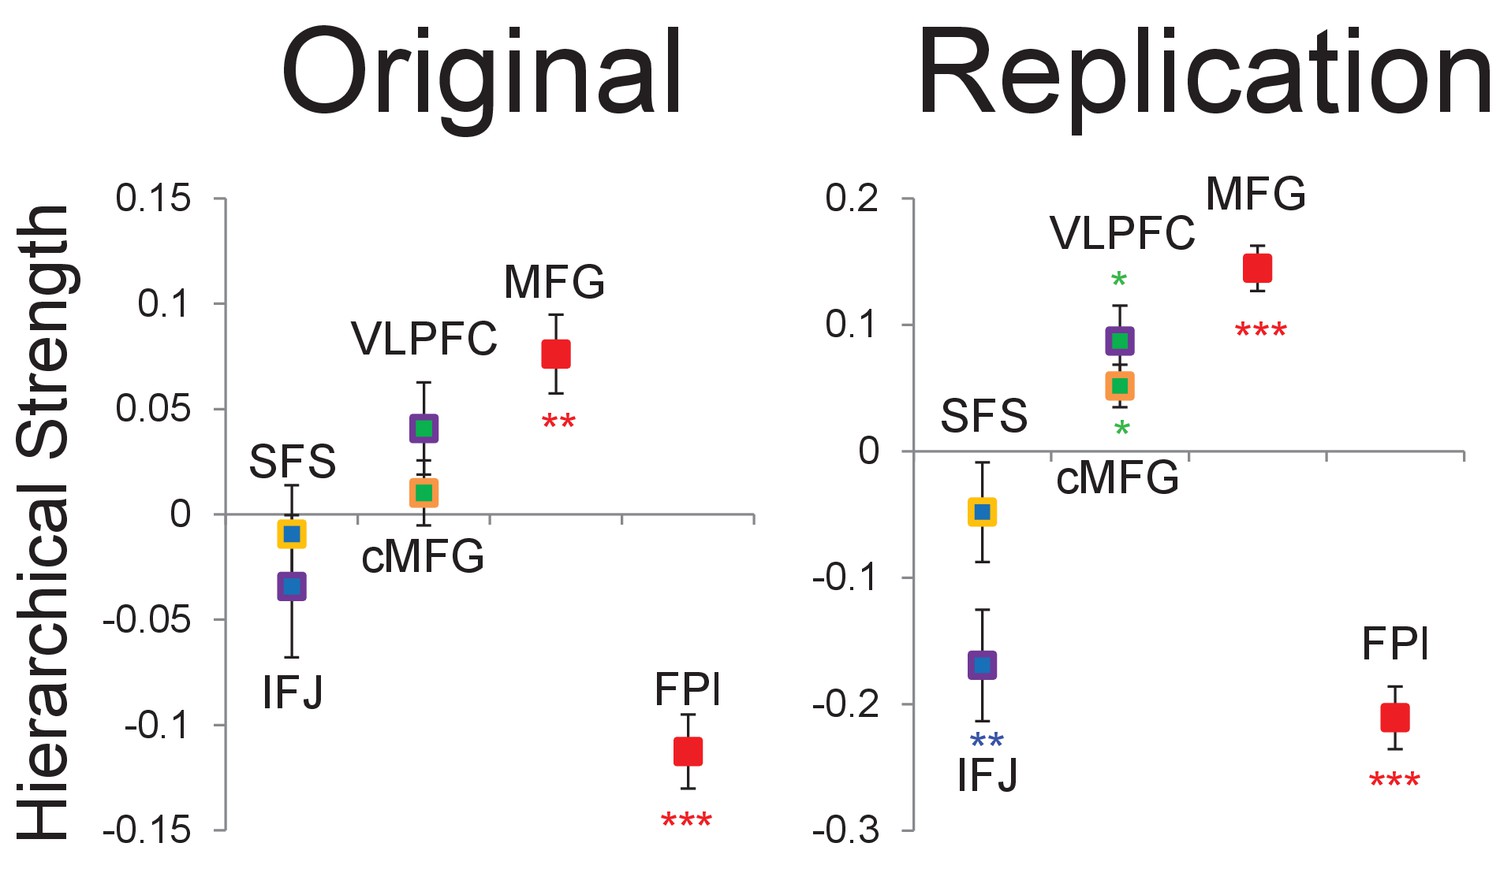
Hierarchical fixed dependencies replication.
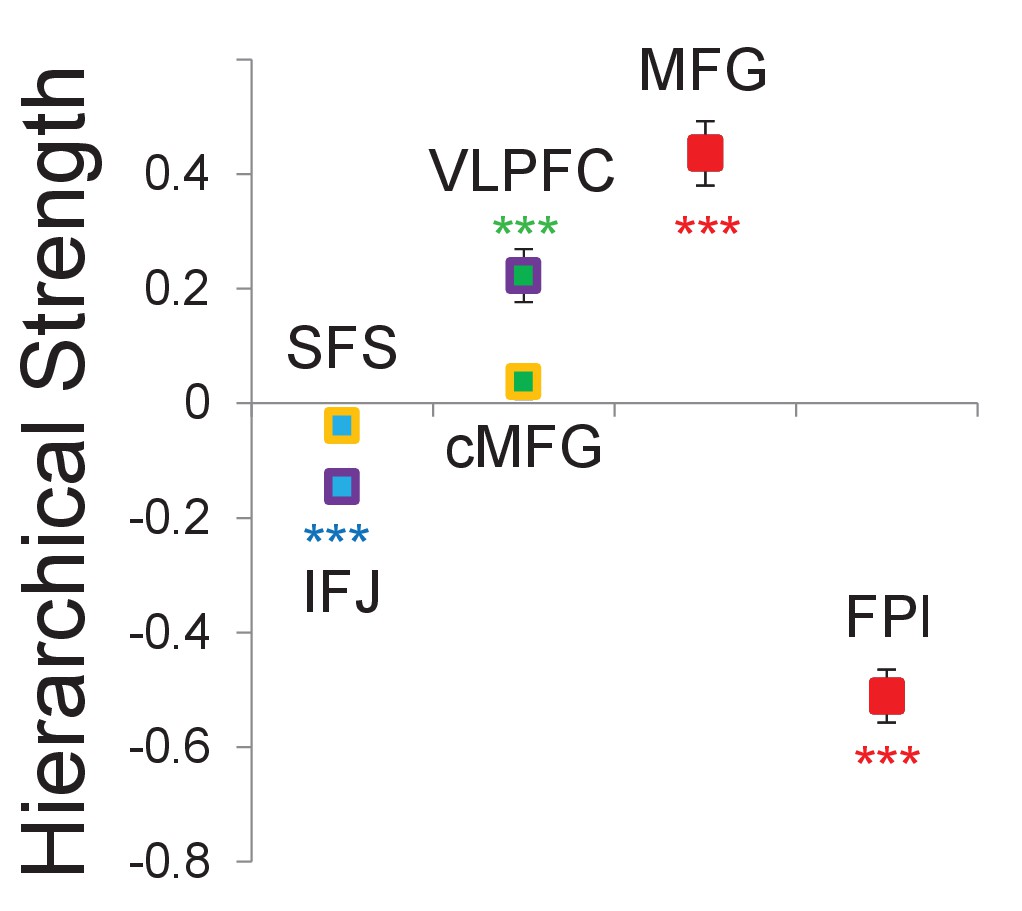
On the basis of the fixed connectivity of the dynamic causal model, hierarchical strength was calculated as the difference between outward and inward projections along the rostral/caudal axis with relatively greater outward connectivity indicating more hierarchical strength. Left: previous data. Right: present data. A parabolic function fitting the relationship between rostral/caudal position (y-coordinate in MNI space) and hierarchical strength indicated a positive vertex across individuals (t(23) = 3.95, p<0.001) positioned at mid LPFC (mean y-coordinate 27.5). **pcorrected<0.005; ***pcorrected<0.0005. cMFG, caudal middle frontal gyrus; FPl, lateral frontal pole; IFJ, inferior frontal junction; MFG, middle frontal gyrus; SFS, superior frontal sulcus; VLPFC, ventrolateral prefrontal cortex.
Figure 2—figure supplement 5
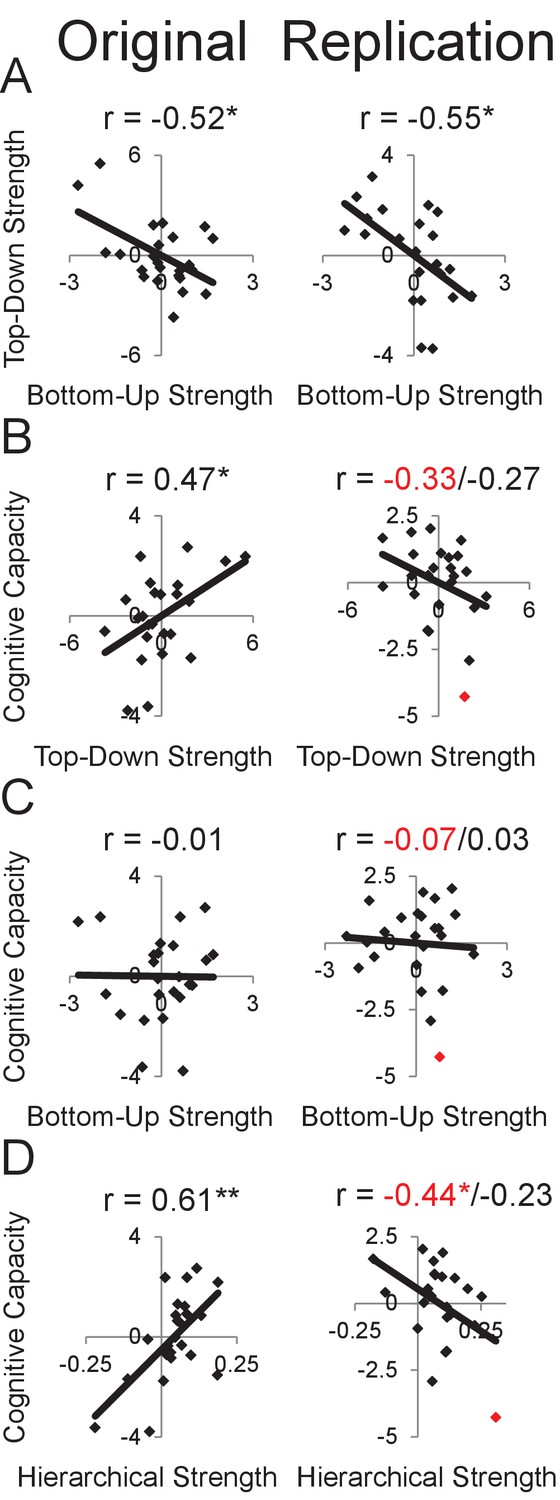
LPFC dynamics and higher-level cognitive ability replication failure.
Neural metrics were based on modeled estimates of effective connectivity and their modulations. Metrics reflecting top-down LPFC modulations by cognitive control demands (top-down strength), and metrics reflecting bottom-up LPFC modulations by Stimulus Domain demands (bottom-up strength) were combined, respectively using principle components analysis. Left: previous data. Right: present data. (A) Top-down and bottom-up strength were anti-correlated. (B) Top-down strength predicted trait-measured higher-level cognitive capacity in the previous sample, but this pattern was non-significantly reversed in the present sample. Red indicates an outlier whose cognitive capacity was more than 2.5 standard deviations from the mean. With outlier included r = −0.33, p>0.1; excluded r = −0.27, p>0.2. (C) Bottom-up strength did not correlate with higher-level cognitive capacity in either sample. (D) Hierarchical strength reflected the degree to which mid LPFC showed greater outward than inward fixed connectivity. This metric was also positively related to higher-level cognitive capacity previously, but was negatively related in the present sample with an outlier included (r = −0.43, p<0.05) but not with the outlier excluded (r = −0.23, p>0.25). *p<0.05; **p<0.005.
Figure 3 with 1 supplement
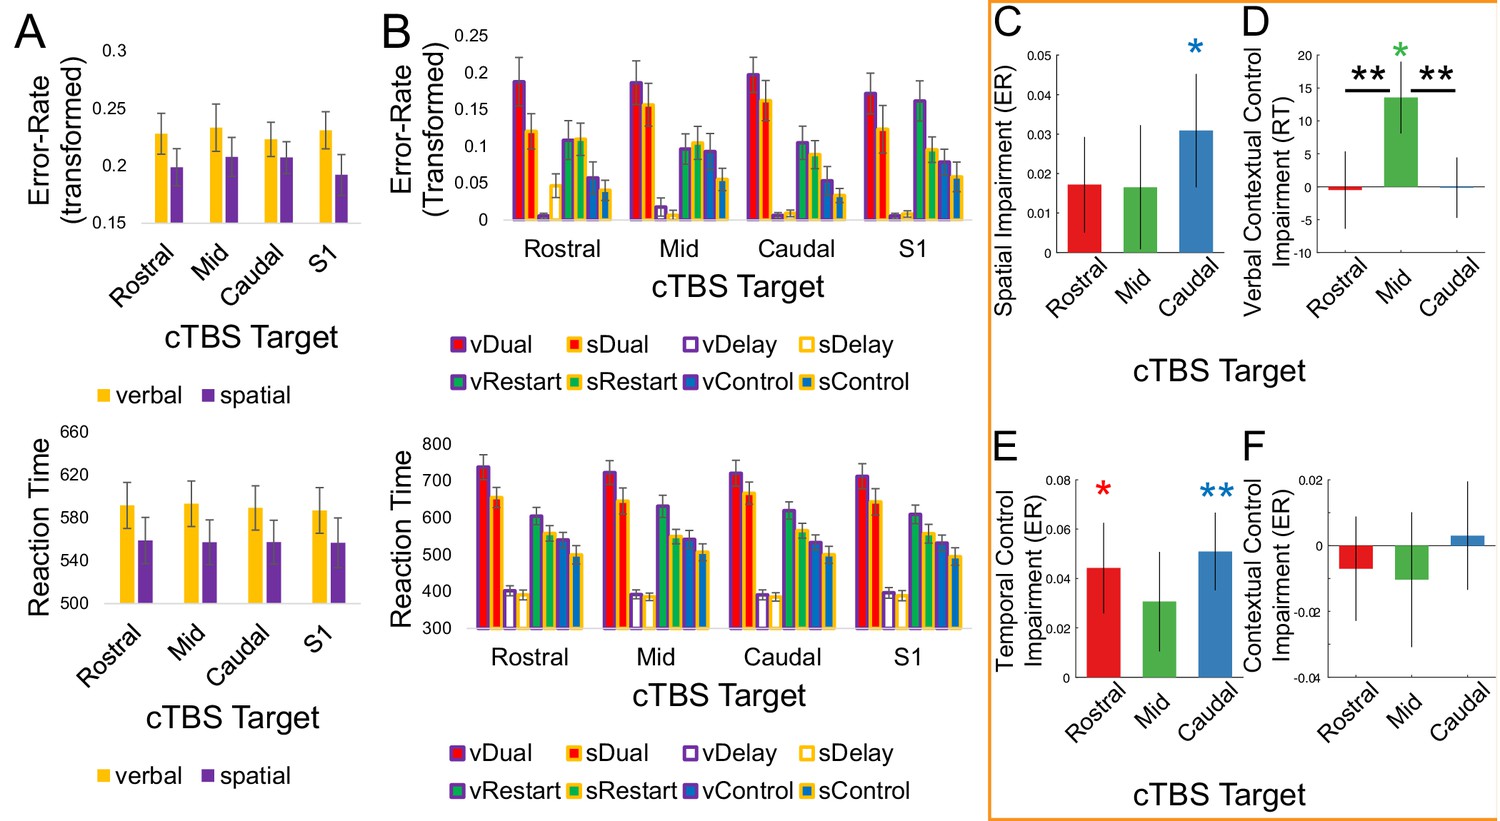
Behavioral effects following cTBS.
Left: Uncontrasted data from (A) all trials averaged across the verbal and spatial tasks, respectively, and (B) sub-task trials averaged across the eight factors of the task design. Right: Contrasted data. In all bars, performance following cTBS to the control target (S1) has been subtracted out such that the y-axis indicates a behavioral impairment relative to control stimulation. Effects of Time have been regressed out (see Figure 3—figure supplement 1 for data that do not control for effects of Time). The x-axis indicates the stimulation target (rostral – rostral LPFC/FPl; mid – mid LPFC/VLPFC; caudal – caudal LPFC/SFS). (C) Impairments in Spatial Stimulus Domain relative to Verbal Stimulus Domain in error-rate (ER). (D) The interaction between Stimulus Domain x Contextual Control in reaction time (RT) contrasted such that relative verbal impairments are positive (i.e. greater verbal Contextual Control cost relative to spatial Contextual Control cost). (E) Impairments in the main effect of Temporal Control in ER. (F) Impairments in the main effect of Contextual Control in ER. *p<0.05; **p<0.005.
Figure 3—figure supplement 1
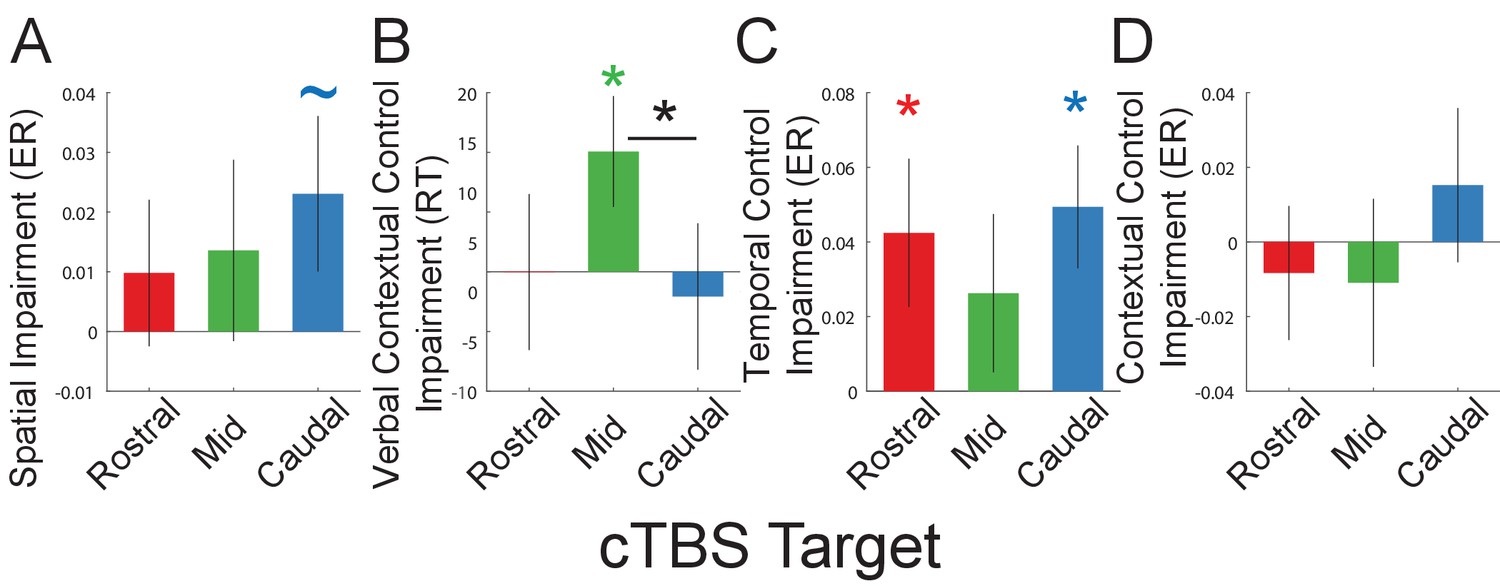
Contrasts without controlling for effects of Time.
These are the raw contrasts corresponding to Figure 3C–F. Here, we also report standard repeated measures ANOVAs. (A) A 2 × 4 ANOVA with
factors of Stimulus Domain (verbal, spatial) revealed a significant main effect of Stimulus Domain in ER and RT (ER – F(1,22) = 13.75, p<0.005; RT – F(1,22) = 24.27, p<0.005), but no main effects of Target nor interactions between Target and Stimulus Domain (ER and RT all p>0.3). However, a planned contrast comparing cTBS to SFS and S1 revealed a significant Stimulus Domain x Target interaction in ER (F(1,22) = 3.13, p<0.05, one-tailed), but not RT (F(1,22) < 1). (B) A 2 × 2×4 ANOVA with factors of Stimulus Domain, Contextual Control, and Target revealed main effects of Stimulus Domain (ER – F(1,22) = 6.83, p<0.05; RT – F(1,22) = 22.03, p<0.0005) and Contextual Control (ER – F(1,22) = 135.22, p<10−9; RT – F(1,22) = 212.52, p<10−11), as well as a Stimulus Domain x Contextual Control interaction in RT (F(1,22) = 16.54, p<0.001). The interaction was driven by reduced costs associated with Contextual Control for the spatial relative to verbal task. No main effect of Target nor interactions with Target were observed (ER and RT all p>0.1). However, a planned contrast comparing cTBS to VLPFC and S1 revealed a significant Stimulus Domain x Contextual Control x Target interaction in RT (F(1,21) = 4.51, p<0.05; Figure 3B), but not in ER (F(1,21) = 2.51, p>0.1). This interaction was driven by increased Contextual Control costs for the verbal relative to spatial task following cTBS to VLPFC. Furthermore, similar interactions were observed when comparing cTBS to VLPFC with the other LPFC sites (VLPFC vs. FPl –F(1,22) = 3.87, p=0.06; VLPFC vs. SFS – F(1,22) = 5.08, p<0.05). (C) A 2 × 2×4 ANOVA with factors of Contextual Control, Temporal Control, and Target. This analysis revealed a main effect of Contextual Control (reported above), but no main effects of Temporal Control or Target (ER and RT, all p>0.05). Temporal Control and Contextual Control interacted (ER – F(1,21) = 31.26, p<0.0001; RT –F(1,21) = 137.55, p<10−9). While there were no significant 2- or 3-way interactions with Target, the Temporal Control x Target interaction approached significance in ER (F(1,21) = 2.47, p=0.07). Planned contrasts comparing cTBS to FPl and S1 revealed a significant Temporal Control x Target interaction in ER (F(1,21) = 4.55, p<0.05; Figure 3C), but not RT (F(1,21) = 1.37, p>0.25), and no interactions between Contextual Control x Target either alone (Figure 3D) or with Temporal Control (ER and RT, all p>0.05). A post-hoc 2 × 2×2 ANOVA examining effects of Contextual Control, Temporal Control, and Target comparing SFS to S1 revealed a similar pattern to that observed with cTBS to FPl: a significant Temporal Control x Target interaction in ER (F(1,21) = 8.99, p<0.01), but not RT (F(1,21) < 1), and no interactions between Contextual Control x Target either alone or with Temporal Control (ER and RT, all p>0.2). No such effects were observed comparing cTBS to VLPFC with S1 (all interactions with Target p>0.1). ~ - p<0.05, one-tailed; * - p<0.05.
Figure 4 with 2 supplements
Revised LPFC dynamic causal model.
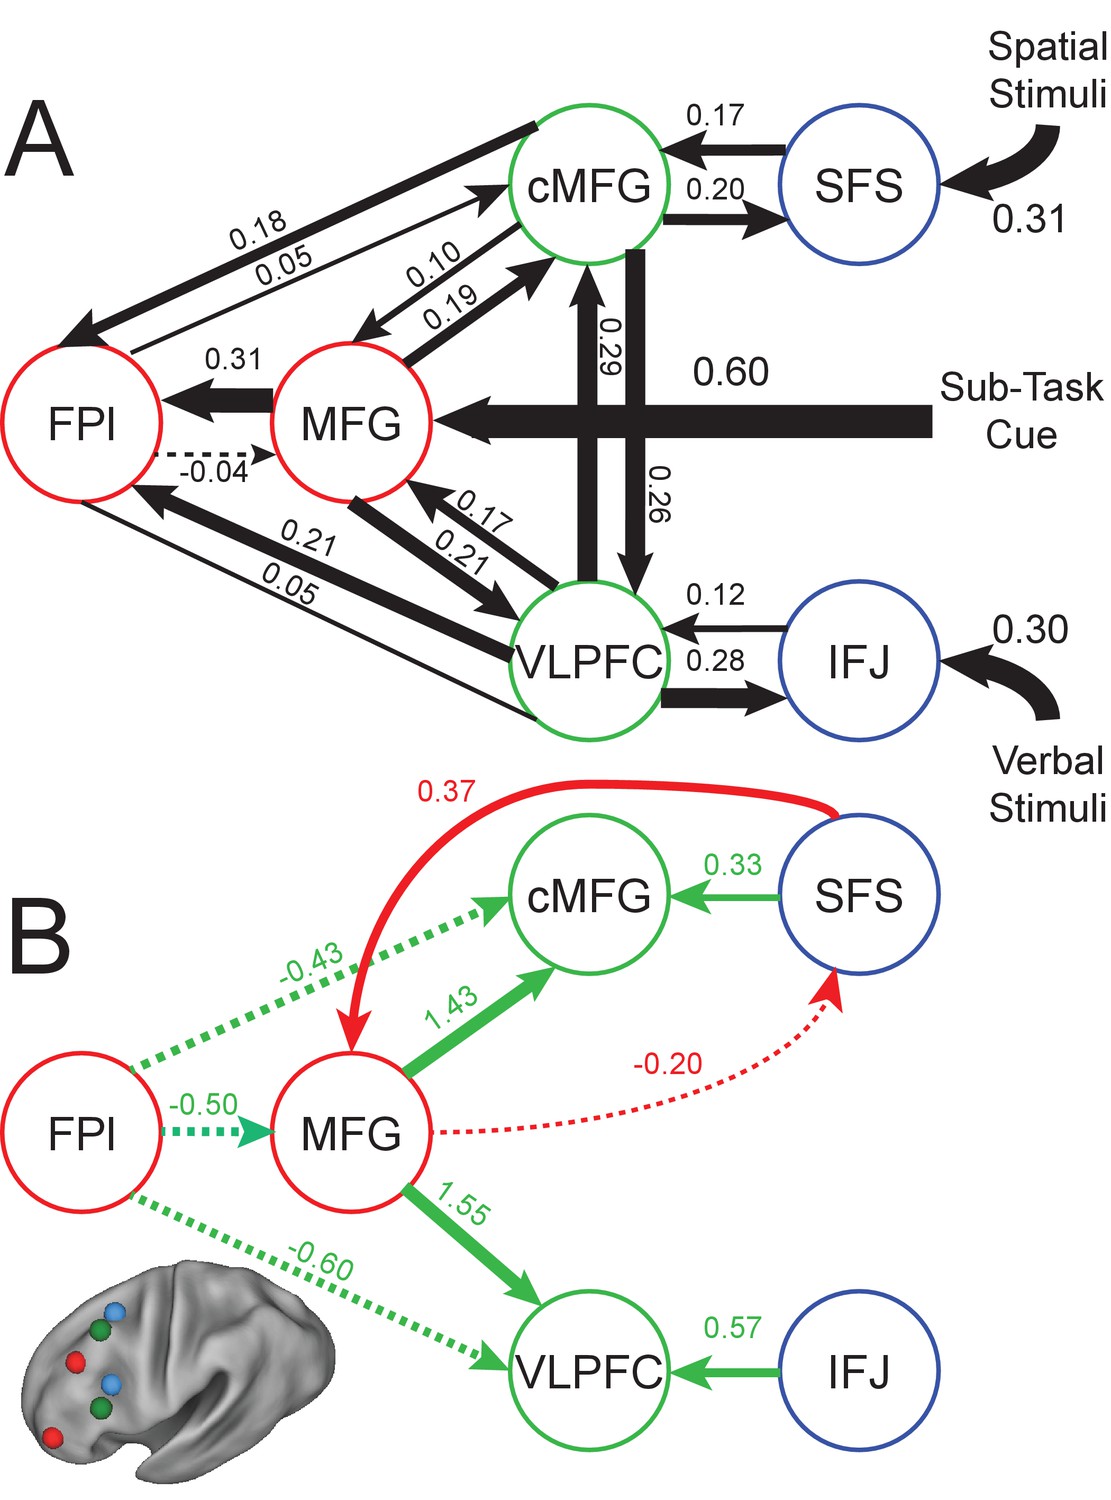
Bayesian model selection indicated that the depicted model was the best model of the dynamics among the models tested. Arrows indicate direction of influence, numbers and line widths indicate the strength of influence, and dashed arrows indicated inhibitory influences. Parameter estimates have been averaged across the previous and present samples. (A) Fixed connectivity and inputs depicted in black. (B) Modulations of connectivity by Contextual Control (green), and Temporal Control (red) demands depicted in colors. All depicted parameters are significant after correction using false-discovery rate. cMFG, caudal middle frontal gyrus; FPl, lateral frontal pole; IFJ, inferior frontal junction; MFG, middle frontal gyrus; SFS, superior frontal sulcus; VLPFC, ventrolateral prefrontal cortex.
Figure 4—figure supplement 1
Revised LPFC dynamic causal model.
Left: Original study data. Right: Current study data.
Figure 4—figure supplement 2
Revised hierarchical fixed dependencies.
Hierarchical strength is detailed averaged across the previous and present samples. Details are otherwise identical to Figure 2—figure supplement 4.
Additional files
-
Transparent reporting form
- https://doi.org/10.7554/eLife.28040.014
Download links
A two-part list of links to download the article, or parts of the article, in various formats.
Downloads (link to download the article as PDF)
Open citations (links to open the citations from this article in various online reference manager services)
Cite this article (links to download the citations from this article in formats compatible with various reference manager tools)
Causal evidence for lateral prefrontal cortex dynamics supporting cognitive control
eLife 6:e28040.
https://doi.org/10.7554/eLife.28040


