Swimming eukaryotic microorganisms exhibit a universal speed distribution
- University of Cambridge, United Kingdom
- University of Warsaw, Poland
Figures
Figure 1

The tree of life (cladogram) for unicellular eukaryotes encompassing the phyla of organisms analyzed in the present study.
Aquatic organisms (living in marine, brackish, or freshwater environments) have their branches drawn in blue while parasitic organisms have their branches drawn in red. Ciliates are indicated by an asterisk after their names. For each phylum marked in bold font, a representative organism has been sketched next to its name. Phylogenetic data from Hinchliff et al. (2015).
Figure 2 with 3 supplements
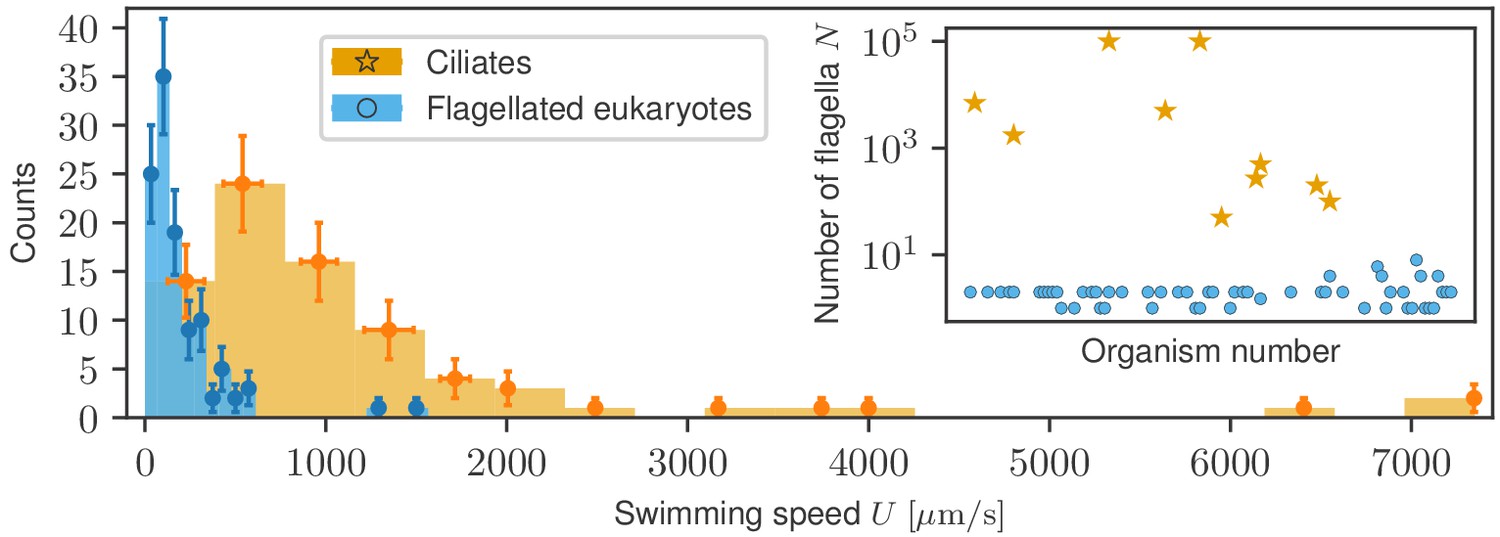
Histograms of swimming speed for ciliates and flagellates demonstrate a similar character but different scales of velocities.
Data points represent the mean and standard deviation of the data in each bin; horizontal error bars represent variability within each bin, vertical error bars show the standard deviation of the count. Inset: number of flagella displayed, where available, for each organism exhibits a clear morphological division between ciliates and flagellates.
Figure 2—figure supplement 1
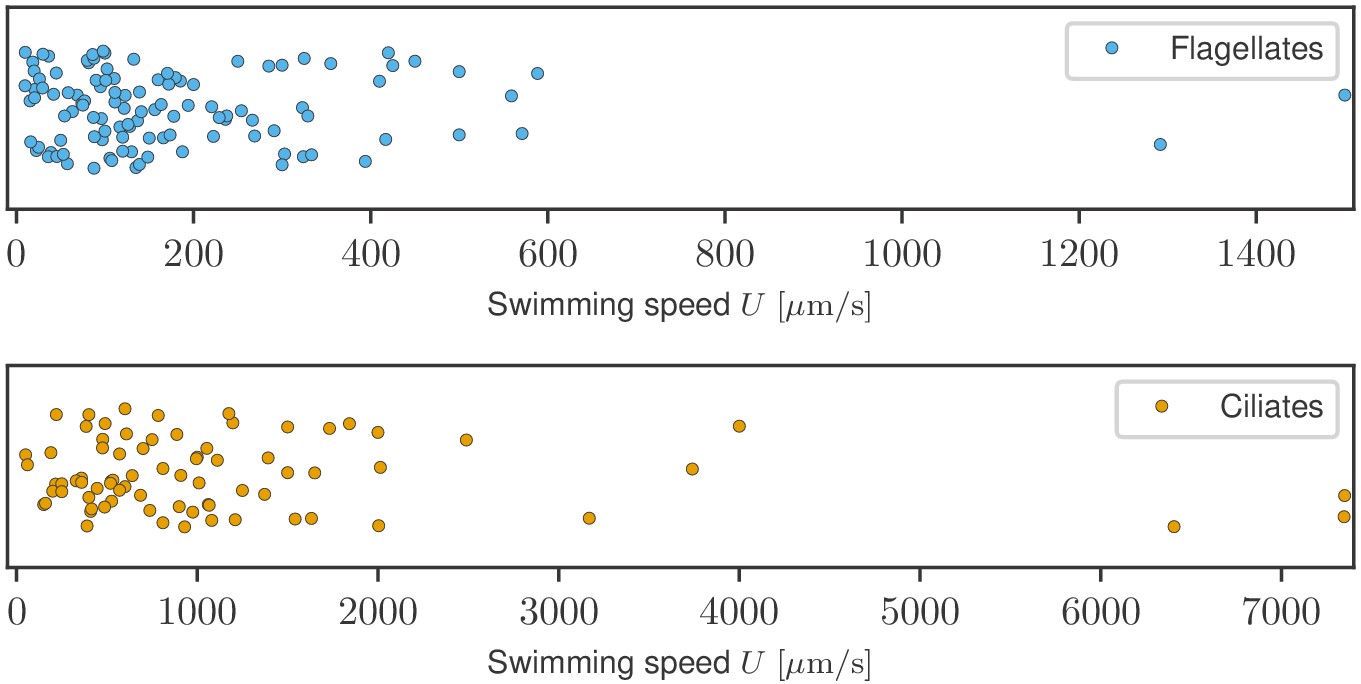
Linear distribution of swimming speed data.
Symbols have been randomly placed vertically to avoid overlap.
Figure 2—figure supplement 2
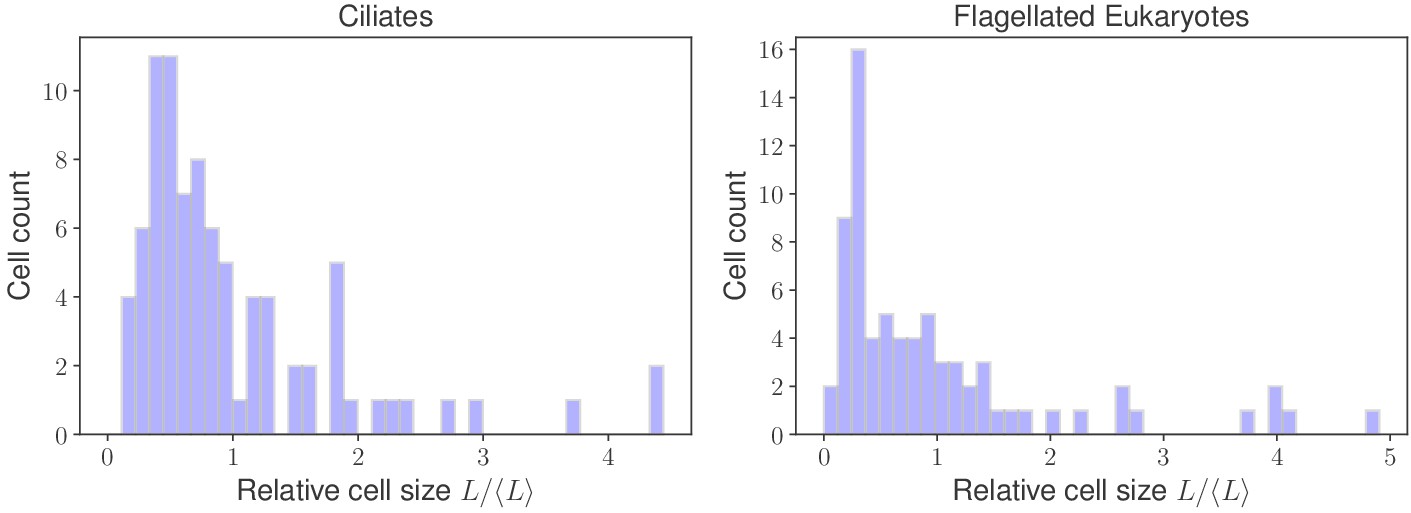
Distribution of organism sizes in analyzed groups.
Each histogram has been rescaled by the average cell size for each group. Although both distributions exhibit a qualitatively similar shape biased toward the low limit, no quantitative similarity is found.
Figure 2—figure supplement 3
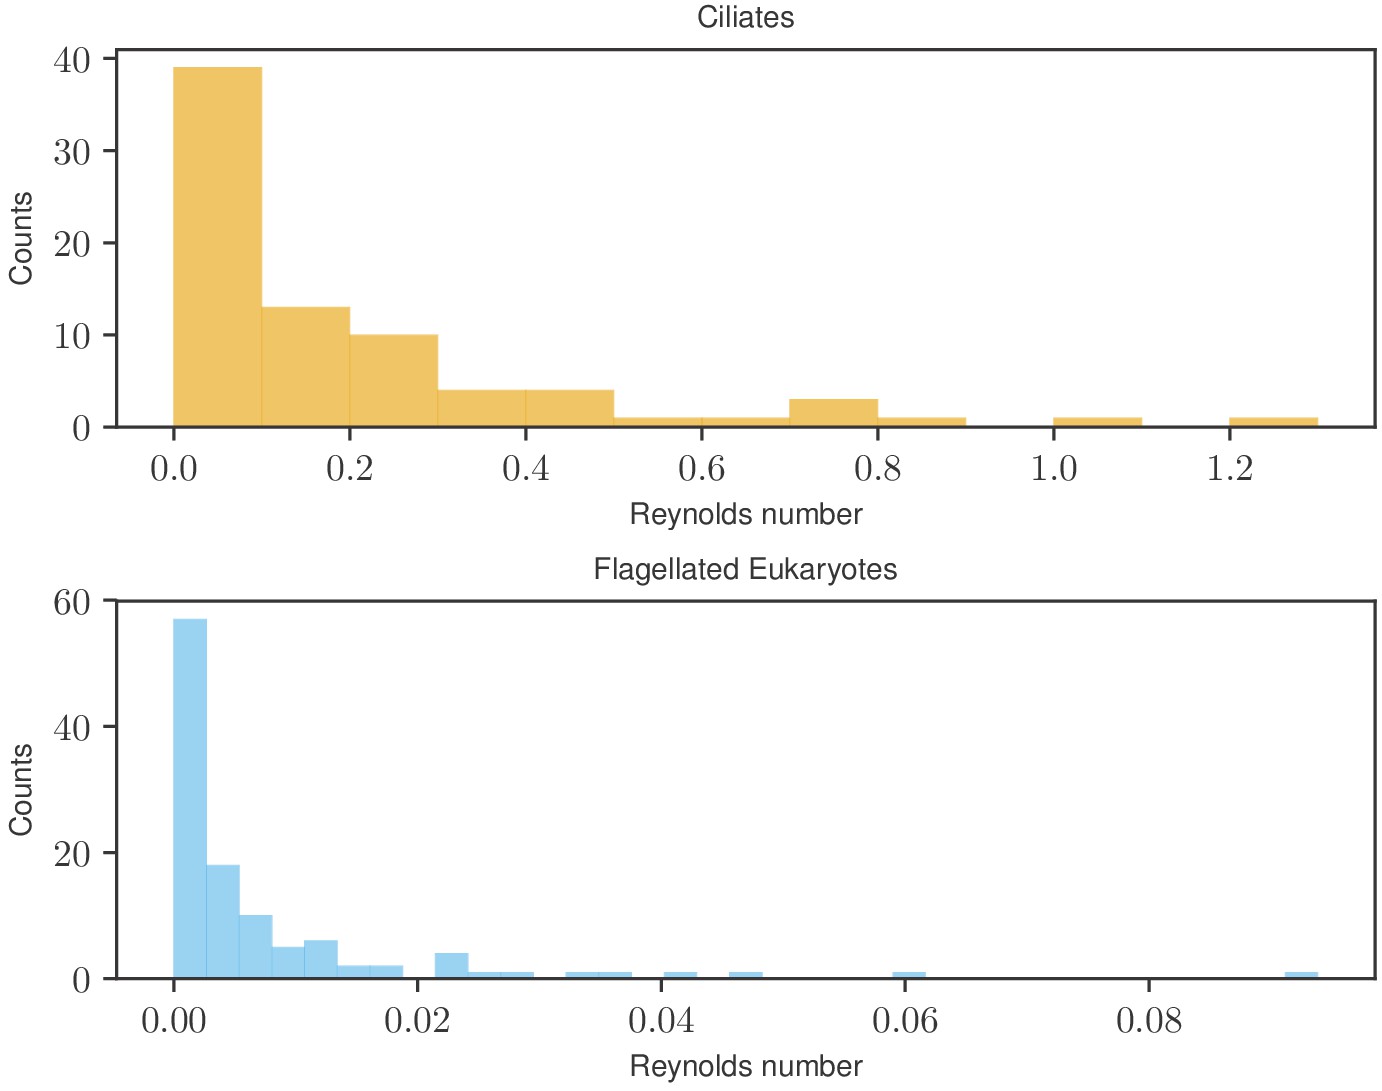
Distribution of Reynolds numbers for organisms in analyzed groups.
Source data for the characteristic size and swimming speeds are listed in Appendix 1.
Figure 3 with 1 supplement
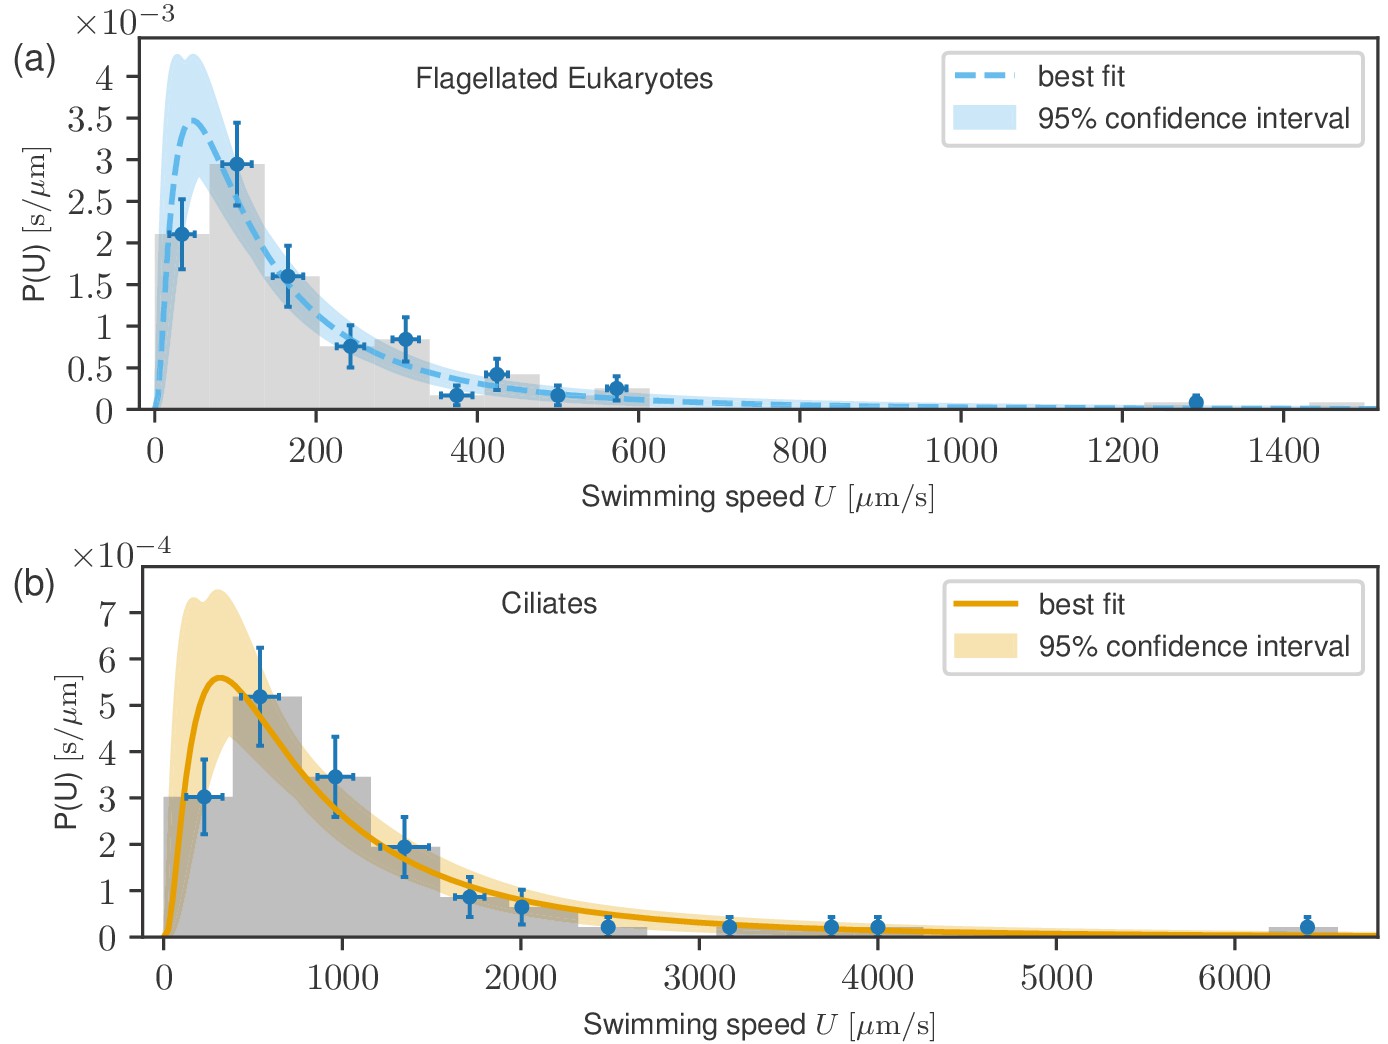
Probability distribution functions of swimming speeds for flagellates (a) and ciliates (b) with the fitted log-normal distributions.
Data points represent uncertainties as in Figure 2. Despite the markedly different scales of the distributions, they have similar shapes.
Figure 3—figure supplement 1
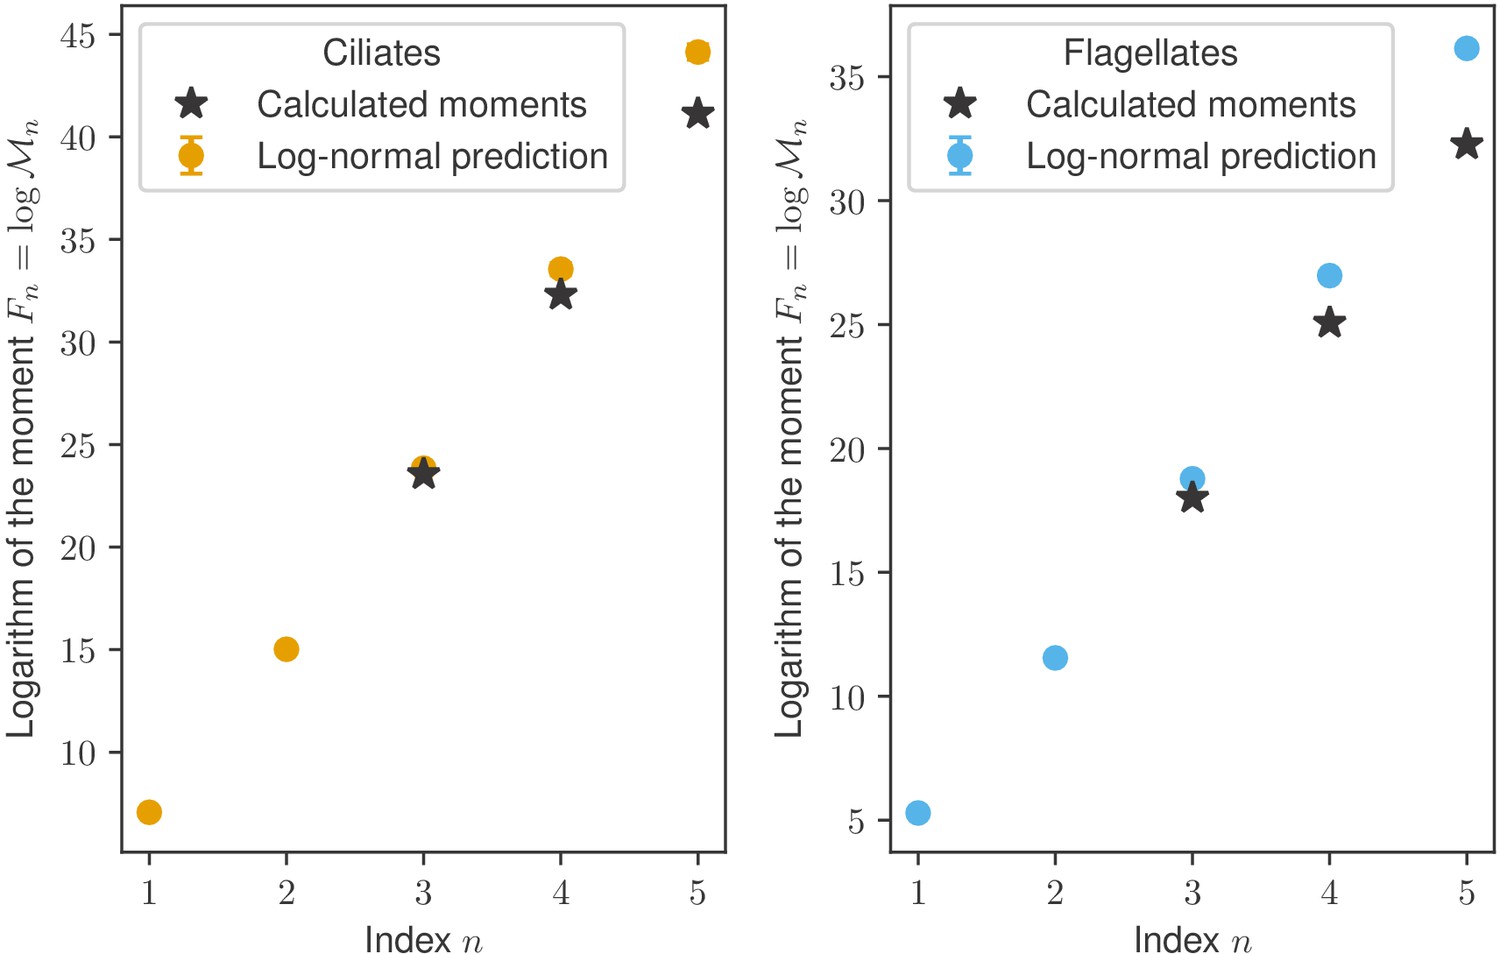
Higher moments of the swimming speed distributions obtained from the data compared with those calculated from the fitted log-normal distribution.
The algebraic moments are defined in Equation (4). Error bars representing 95% confidence intervals for fitted parameters, are obscured by markers.
Figure 4 with 1 supplement
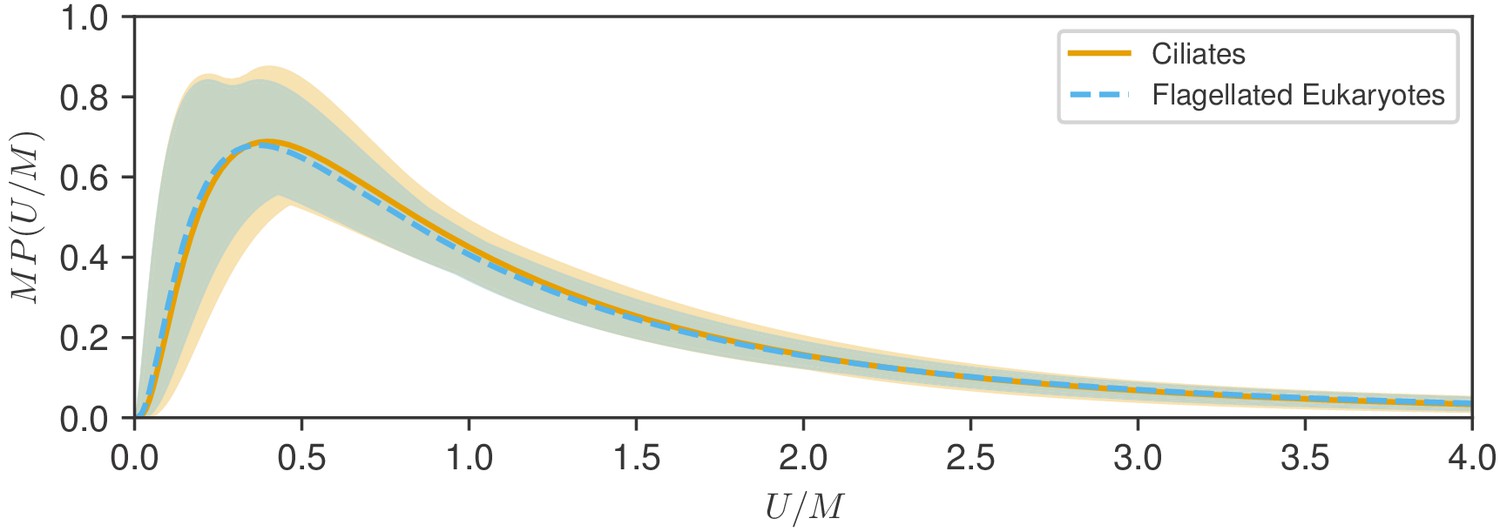
Test of rescaling hypothesis.
Shown are the two fitted log-normal curves for flagellates and ciliates, each multiplied by the distribution median , plotted versus speed normalized by . The distributions for show remarkable similarity and uncertainty of estimation.
Figure 4—figure supplement 1

Data collapse as in the main figure, but using the mean speeds instead of the median .
A similar quality of data collapse is seen.
Additional files
-
Source data 1
Spreadsheet data for swimming eukaryotes listed in Appendix 1 and Appendix 2.
- https://doi.org/10.7554/eLife.44907.011
-
Transparent reporting form
- https://doi.org/10.7554/eLife.44907.012
Download links
A two-part list of links to download the article, or parts of the article, in various formats.
Downloads (link to download the article as PDF)
Open citations (links to open the citations from this article in various online reference manager services)
Cite this article (links to download the citations from this article in formats compatible with various reference manager tools)
Swimming eukaryotic microorganisms exhibit a universal speed distribution
eLife 8:e44907.
https://doi.org/10.7554/eLife.44907


