Philosophy of Biology: Drawing and the dynamic nature of living systems
- University of Exeter, United Kingdom
Figures
Figure 1
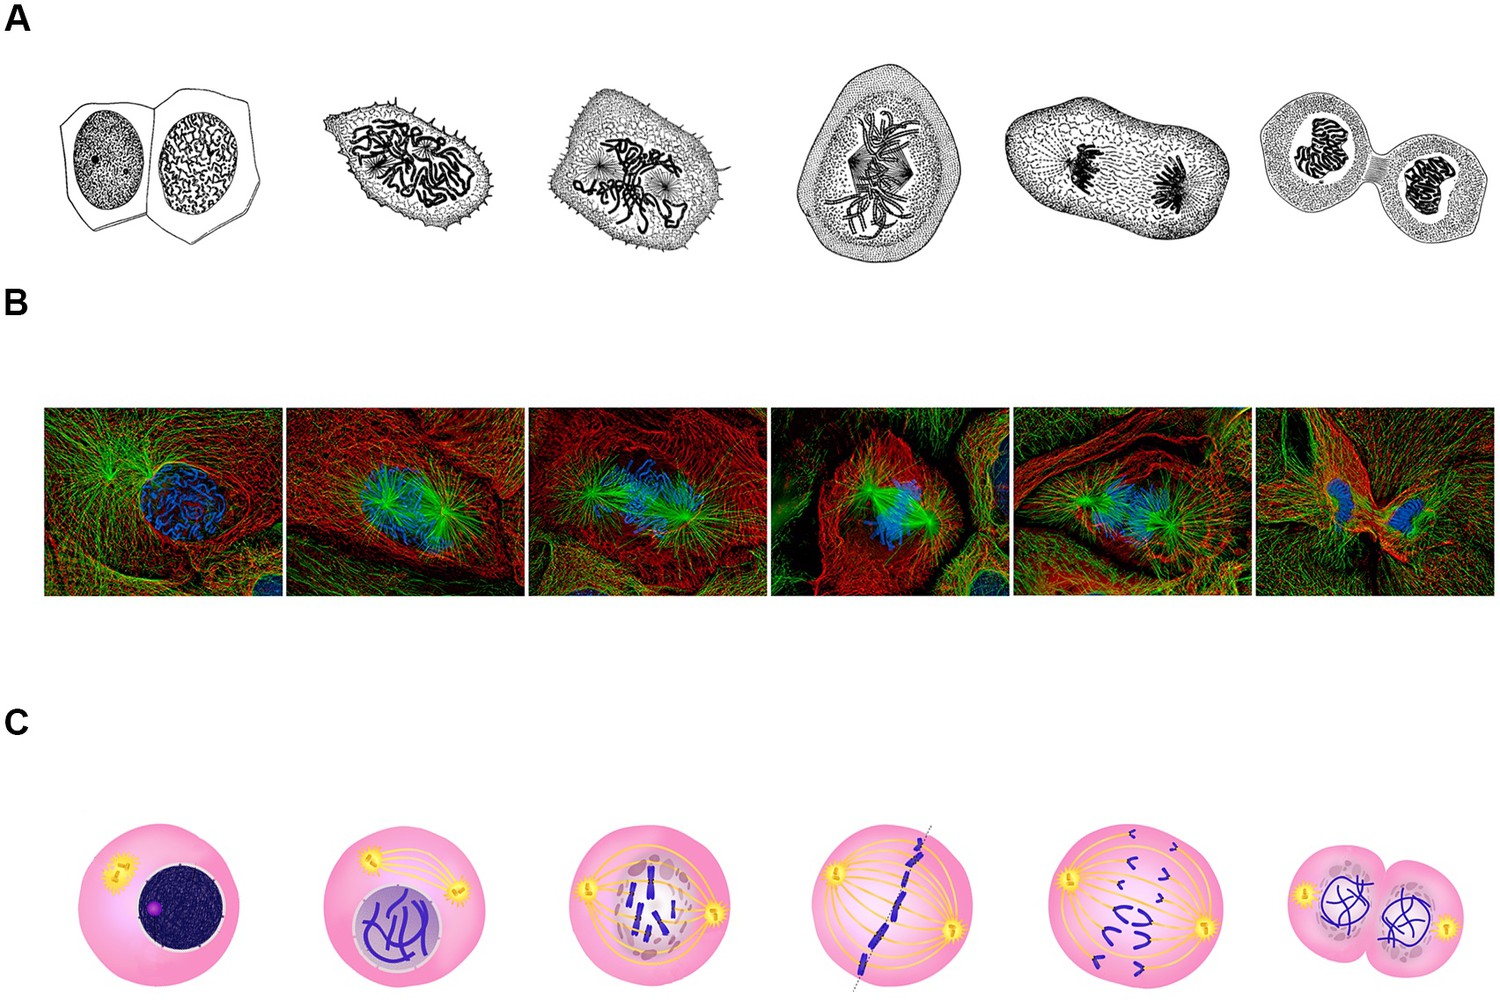
Classical representations of cell division.
(A) Walther Flemming's 1888 drawings of eukaryotic mitosis (Image credit: adapted from Walther Flemming, CC0). (B) Confocal fluorescent microscopy images of newt lung cells during mitosis in culture (Image credit: Alexey Khodjakov, CC BY 4.0). (C) A diagram of the stages of cell division (Image credit: Ali Zifan, CC BY-SA 4.0).
Figure 2
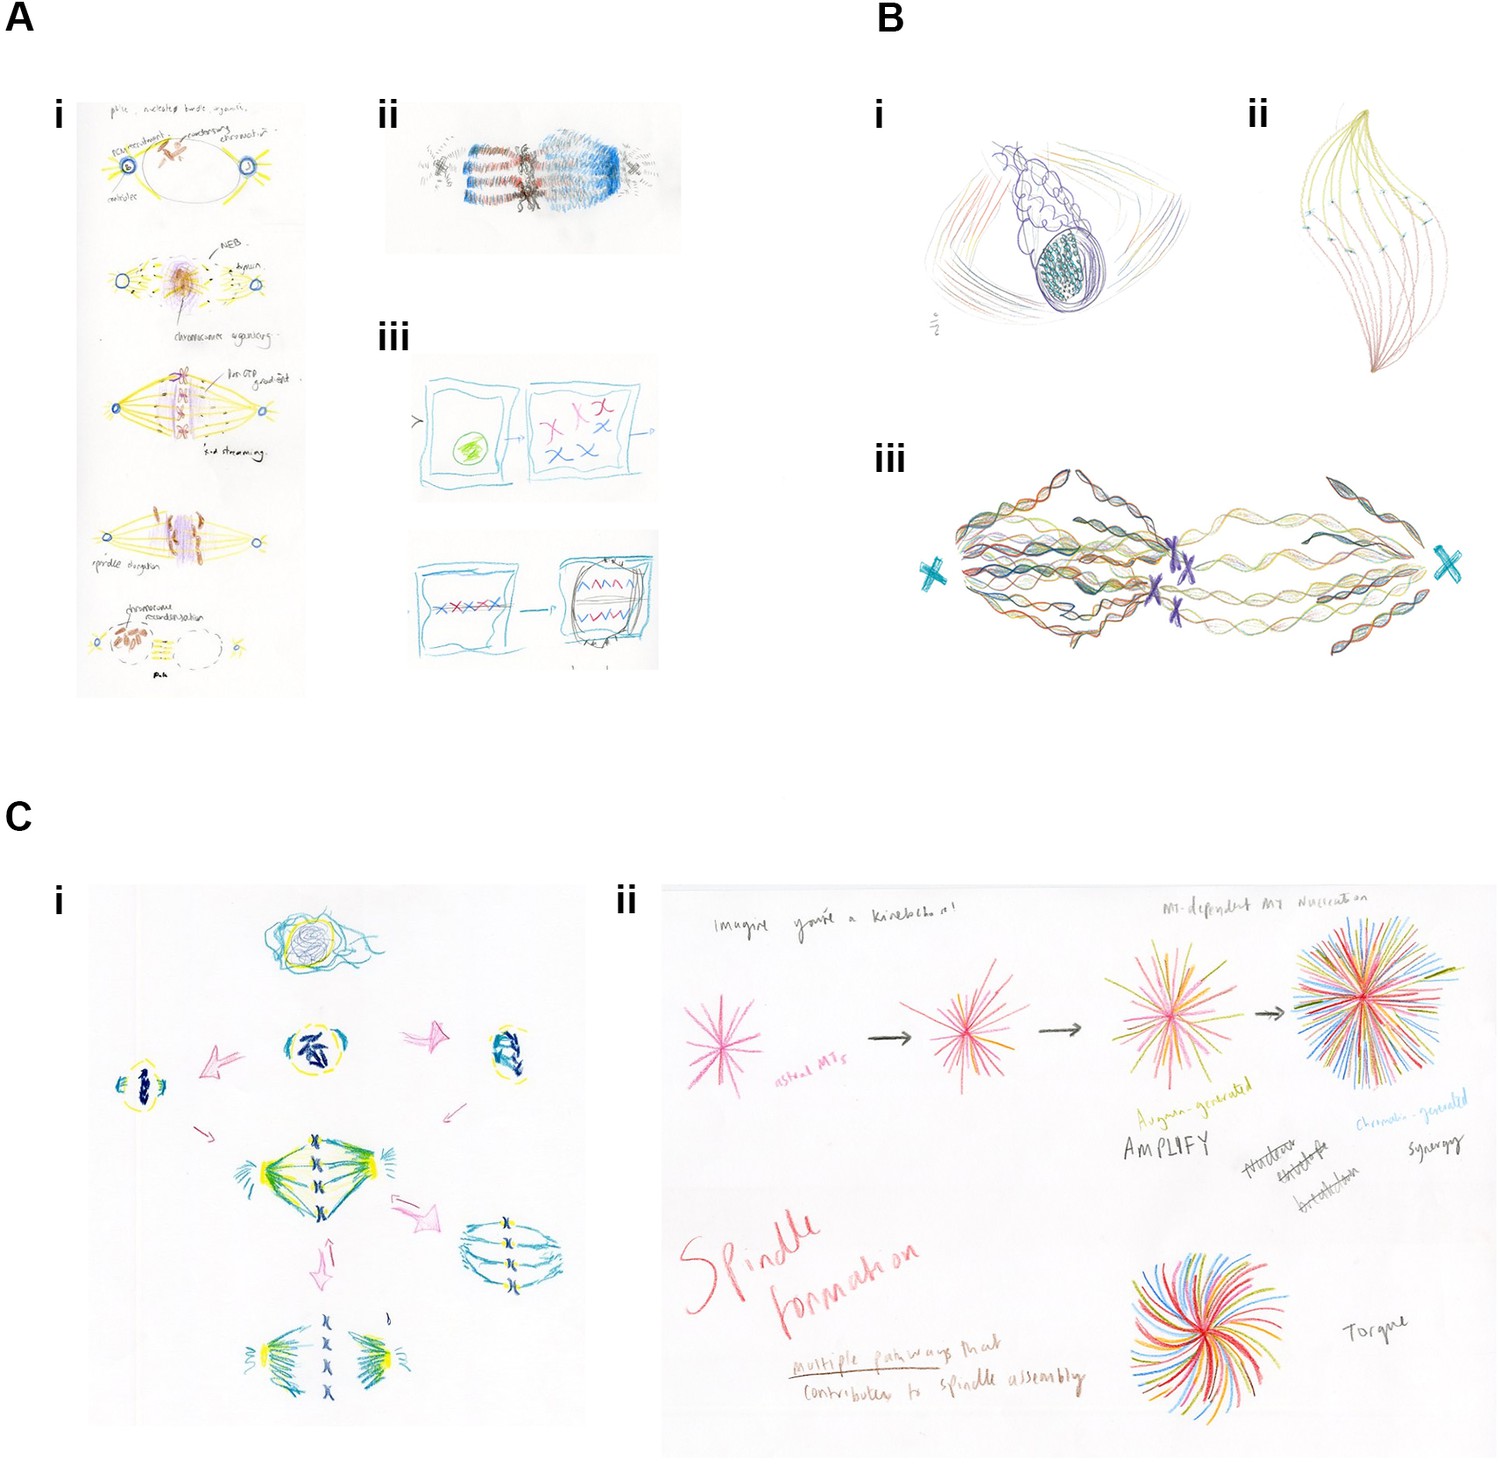
Examples of drawings from the Drawing Labs.
(A) Results from session one. (i) PhD student drawing of stages of mitosis. (ii) Researcher drawing of mitotic spindle, emphasizing differences between kinetochore microtubules (left) and spindle microtubules (right). (iii) Researcher drawing of stages of mitosis. (B) Results from session two. (i) Researcher drawing, imagining the spindle from alternative angle. (ii) Anderson (artist) drawing mitotic spindle, emphasizing chirality. (iii) Researcher drawing of metaphase, emphasizing the helical nature of microtubules, emanating from the centrosome (right), and from both the centrosome and the chromosomes (left). (C) Results from session three. (i) Researcher drawing, with arrows reflecting the many possibilities associated with mitosis. (ii) PhD student drawing of mitotic microtubule generation. Words, colours and shapes combine to accentuate relationships in time and space and between the forces acting upon and within the spindle.
Figure 3
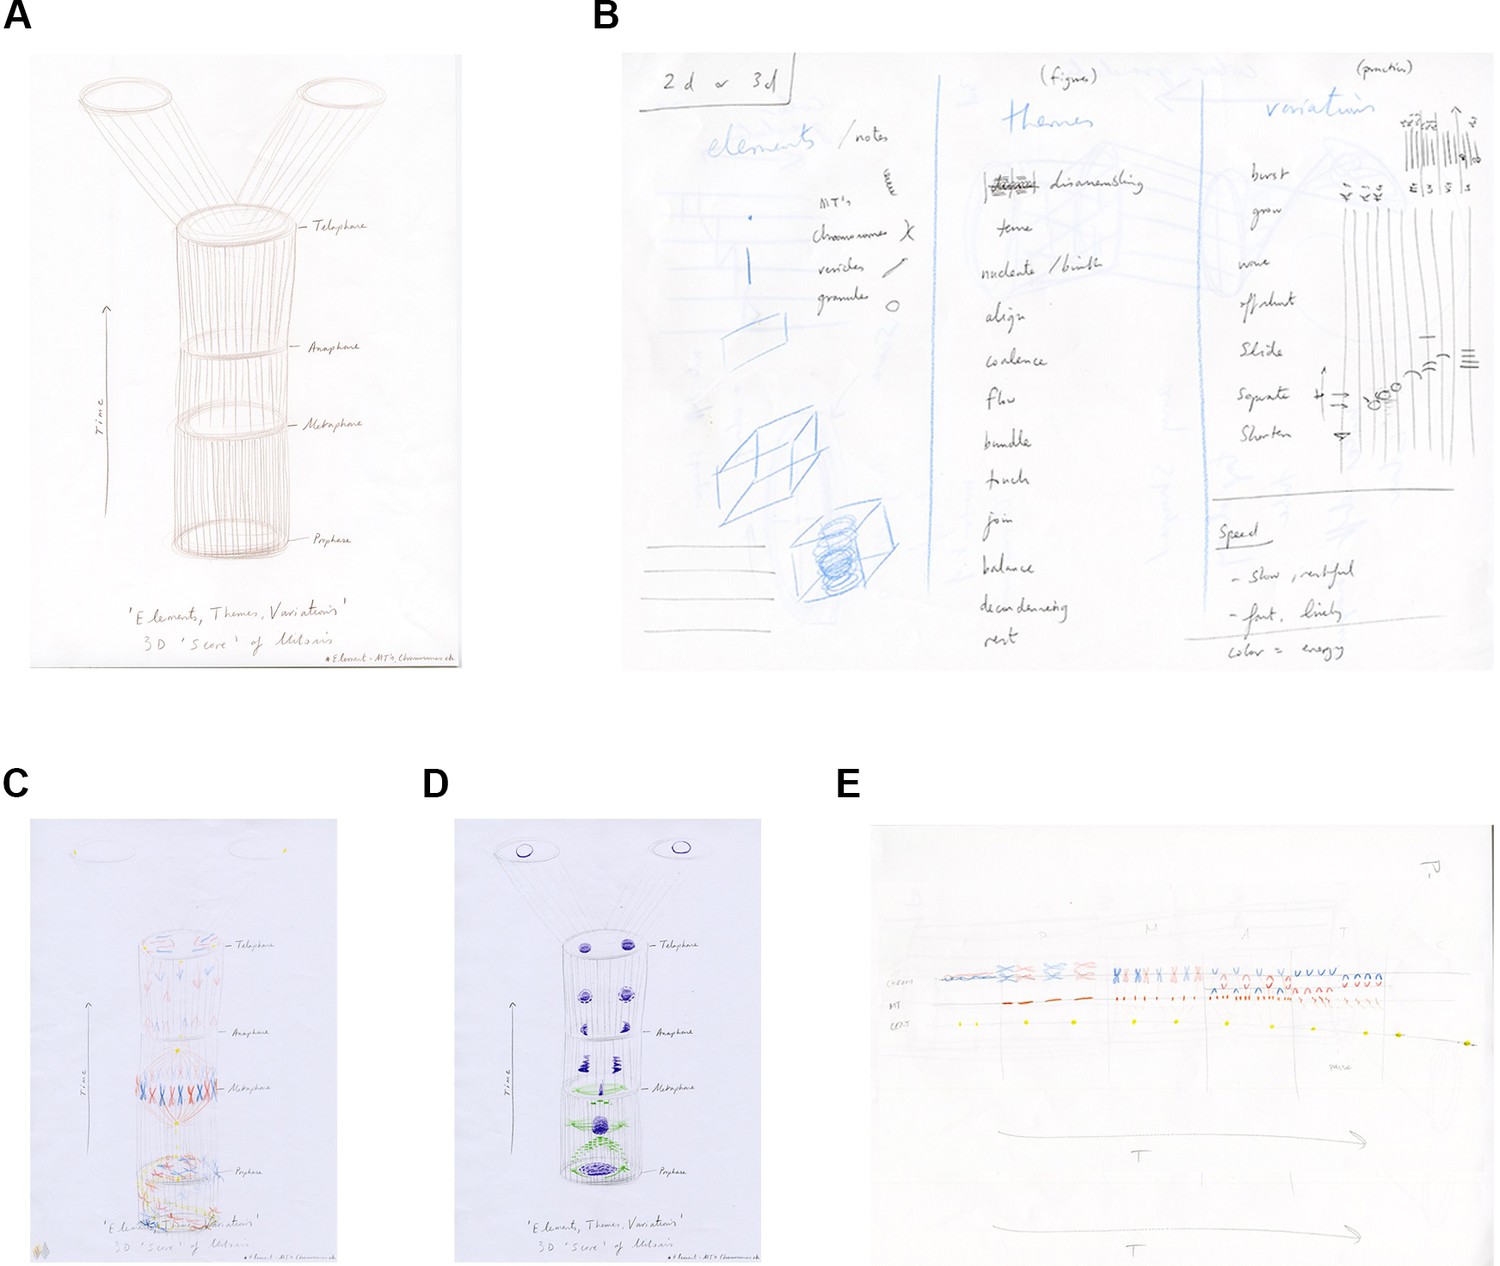
The score template and initial exploratory drawings.
(A) Artist's drawing of a 4D (3D plus time) score template for session four. (B) Artist sketch of the contents for the flow system: elements of mitosis, choreographic and musical terms and verbs. (C, D) PhD student drawings of 'polyphony' of mitosis elements within the 4D score template. (E) PhD student drawing of the 2D score template: the decision of this student to rotate the template may have reflected their interest in classical music.
Figure 4
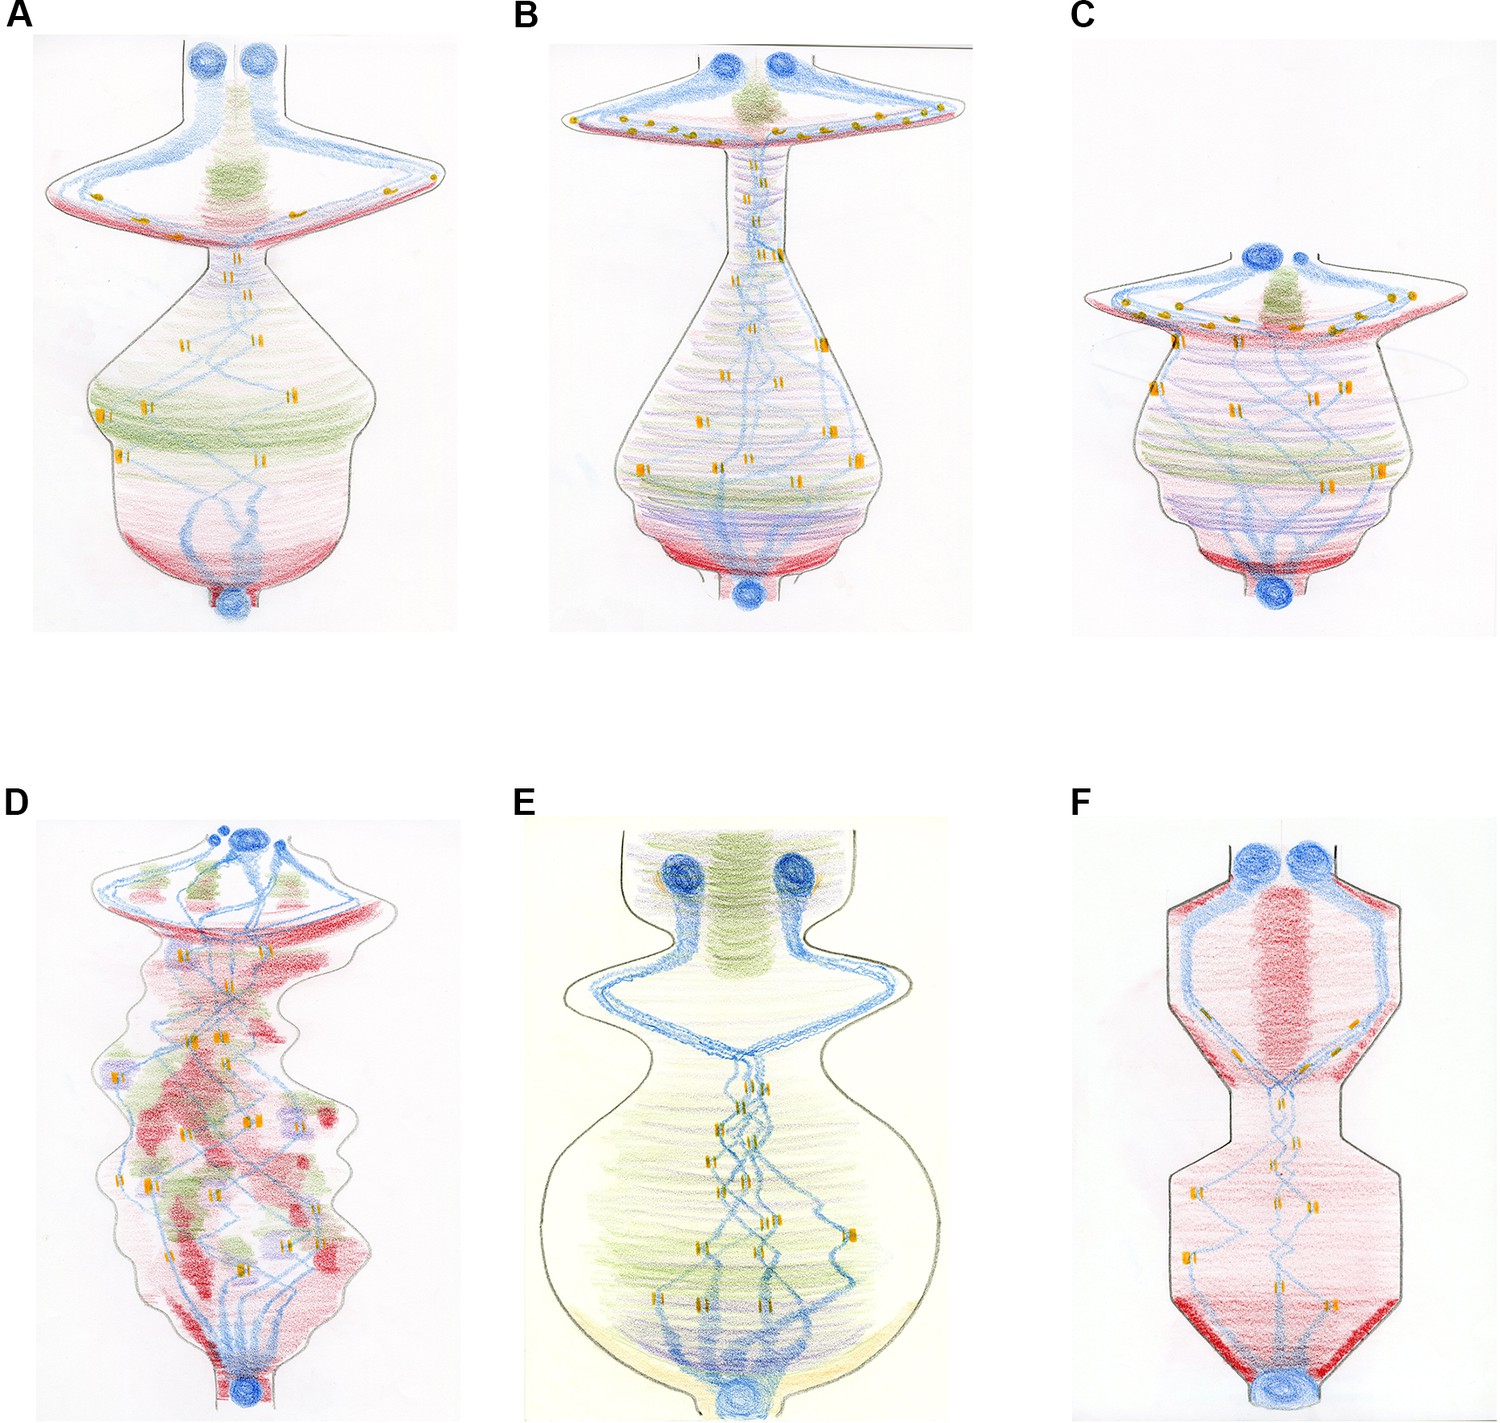
The mitosis score in different cell types.
Creating a more 'processual image' by changing the shape of the score and depicting specific microtubule-generating pathways in different colours. The images describe the movement of chromosomes (blue) and kinetochores (which attach the spindle microtubules to the chromosomes; orange) during the different phases of mitosis: mitosis starts at the bottom of the drawing and ends at the top. The condensation and decondensation of chromosomes and the push/pull forces upon kinetochores are indicated through different shapes (circles and bars; where the forces applied to individual kinetochores within a pair are represented by the thickness of the bar). The generation of new microtubules by the centrosomes is shown in red, with chromosome-dependent microtubule generation in purple and augmin-dependent microtubule generation in green. (A) Mitosis in a Drosophila embryo over time. The overall shape directly corresponds to the sum of the spindle/microtubule-generating pathways and their interactions with chromosomes. As mitosis starts, there is a large burst of microtubule nucleation from the centrosomes, roughly coincidental with the condensation of chromosomes. A full mitotic spindle forms, supplemented by augmin-dependent microtubules. Chromosome congression happens quickly as the microtubule generating pathways reach steady state. A very short spindle assembly checkpoint is followed by the segregation of chromosomes, driven by microtubule depolymerization. A population of microtubules, originally generated by centrosomes and supplemented by augmin-generated microtubules, form the central spindle required to keep the decondensing chromosomes/reforming nuclei apart. (B) Mitosis in a human tissue culture cell. The same principles as (A) apply. The extended 'body' reflects the increased time needed to align chromosomes (23 pairs instead of the four pairs in Drosophila) and the increased time between metaphase and anaphase (about 20 minutes in humans, compared with about 1 minute in Drosophila). Chromatin-dependent microtubule generation is visible due to the extended time required for chromosome alignment. (C) Abnormal mitosis in a human cell lacking the spindle assembly checkpoint (shown by the truncated shape), which results in abnormal chromosome segregation and the generation of nuclei of different sizes. (D) Abnormal mitosis in a human cell with a defective spindle stability, which causes ongoing spindle rebooting and the production of an instable protein mass. (E) Mitosis in a plant cell. With centrosomes absent in higher plant cells, the formation of microtubules is facilitated predominantly by chromatin and by the nuclear envelope, amplified by augmin-dependent microtubules. (F) Mitosis in fission yeast demonstrating a closed mitosis and a bar-like mitotic spindle, generated purely from spindle pole body-nucleated microtubules. Both spindle formation and anaphase are intuited as 'ratchet-like' and measured, rather than explosive.
Figure 5
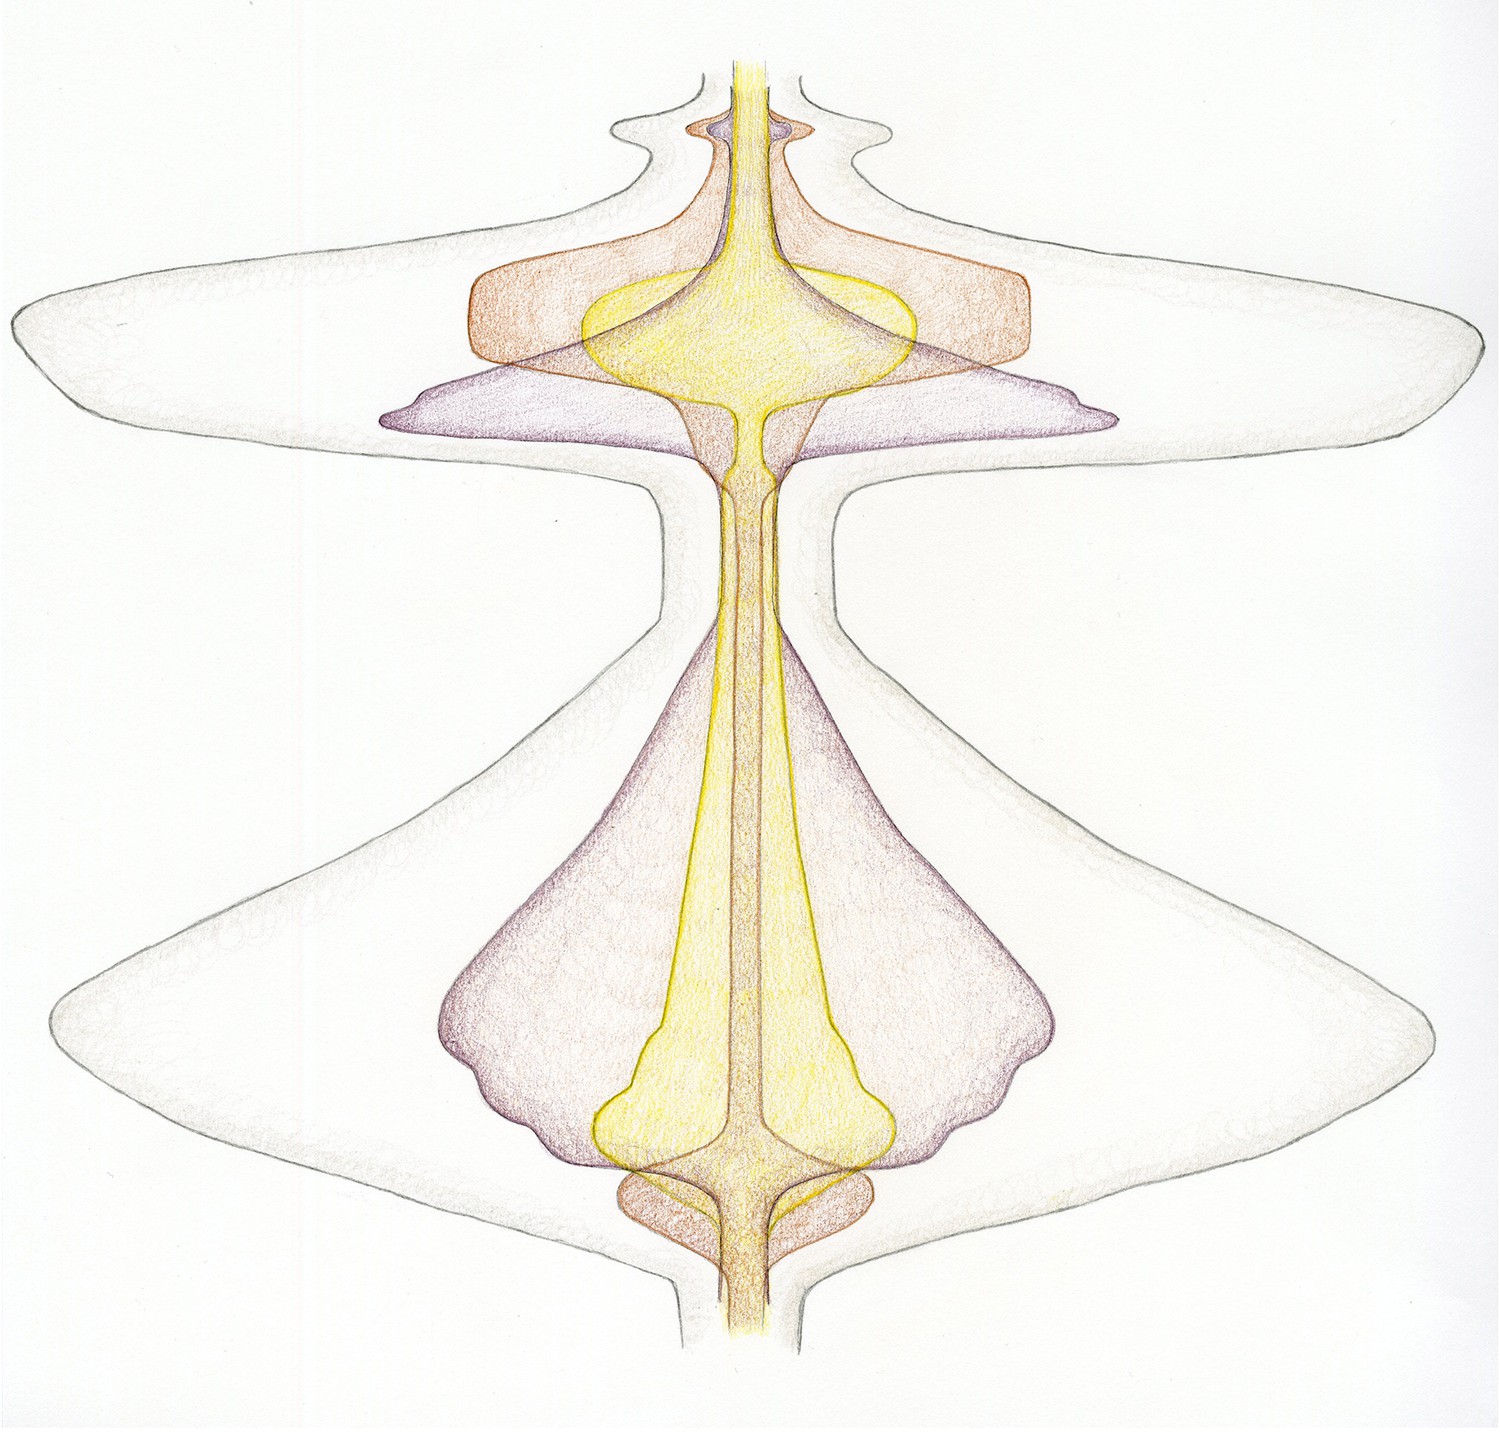
A new dynamic representation of cell division.
Cell division, beginning at the transition from the G2 phase of the cell cycle to mitosis (bottom), and finishing after cytokinesis, when the cells divide (top). The energy related to the input of microtubule-generating pathways are now combined in purple, with chromosome-related processes in yellow and activities related to the cell cortex/membrane in brown. Just before mitosis starts, the cell actively rounds up. Then, during prophase, the microtubules nucleate, the chromosomes condense and are moved within the spindle. As chromosome alignment proceeds from prometaphase to metaphase, microtubules and chromosomes reach a steady state – hence the narrowing of the corresponding shapes. The activity of microtubules dramatically increases early in anaphase, which helps to segregate the chromosomes, which are just 'passive passengers'. By late anaphase, however, the decondensation of the chromosomes begins at the same time as the cortical acto-myosin contractile ring forms and contracts. Finally, cytokinesis itself occurs, requiring a small co-ordinated input from microtubules and the cell cortex. The outer grey shape represents the combined input of each activity described above – therefore corresponding to the overall energy/level of activity of cell division.
Additional files
-
Supplementary file 1
List of verbs describing mitosis.
- https://cdn.elifesciences.org/articles/46962/elife-46962-supp1-v1.pdf
-
Supplementary file 2
Comments from expert observers.
- https://cdn.elifesciences.org/articles/46962/elife-46962-supp2-v1.pdf
-
Supplementary file 3
Full explanation of the drawings.
- https://cdn.elifesciences.org/articles/46962/elife-46962-supp3-v1.pdf
-
Supplementary file 4
A cell biologist’s thoughts on the final drawing.
- https://cdn.elifesciences.org/articles/46962/elife-46962-supp4-v1.pdf
Download links
A two-part list of links to download the article, or parts of the article, in various formats.
Downloads (link to download the article as PDF)
Open citations (links to open the citations from this article in various online reference manager services)
Cite this article (links to download the citations from this article in formats compatible with various reference manager tools)
Philosophy of Biology: Drawing and the dynamic nature of living systems
eLife 8:e46962.
https://doi.org/10.7554/eLife.46962


