Combined deletion of Glut1 and Glut3 impairs lung adenocarcinoma growth
- Swiss Institute for Experimental Cancer Research (ISREC), School of Life Sciences, Ecole Polytechnique Fédérale de Lausanne, Switzerland
- Swiss Cancer Center Léman, Switzerland
- Bioinformatics Core Facility, Swiss Institute of Bioinformatics, Switzerland
- Laboratory for Biological Geochemistry, School of Architecture, Civil and Environmental Engineering, Ecole Polytechnique Fédérale de Lausanne, Switzerland
- Institute of Animal Pathology (COMPATH), University of Bern, CH-3012 Bern, and Histology Core Facility, School of Life Sciences, Ecole Polytechnique Fédérale de Lausanne, Switzerland
- Laboratory for Functional and Metabolic Imaging (LIFMET), Ecole Polytechnique Fédérale de Lausanne, Switzerland
- Center for Biomedical Imaging (CIBM), Ecole Polytechnique Fédérale de Lausanne, Switzerland
- Institute of Pathology, University of Bern, Switzerland
- BioEM Facility, School of Life Sciences, Ecole Polytechnique Fédérale de Lausanne, Switzerland
- Vanderbilt Center for Immunobiology, Vanderbilt University Medical Center, United States
- Fraternal Order of Eagles Diabetes Research Center and Division of Endocrinology and Metabolism, Carver College of Medicine, University of Iowa, United States
- Center for Advanced Surface Analysis, Faculty of Geosciences and Environment, University of Lausanne, Switzerland
Figures
Figure 1 with 2 supplements
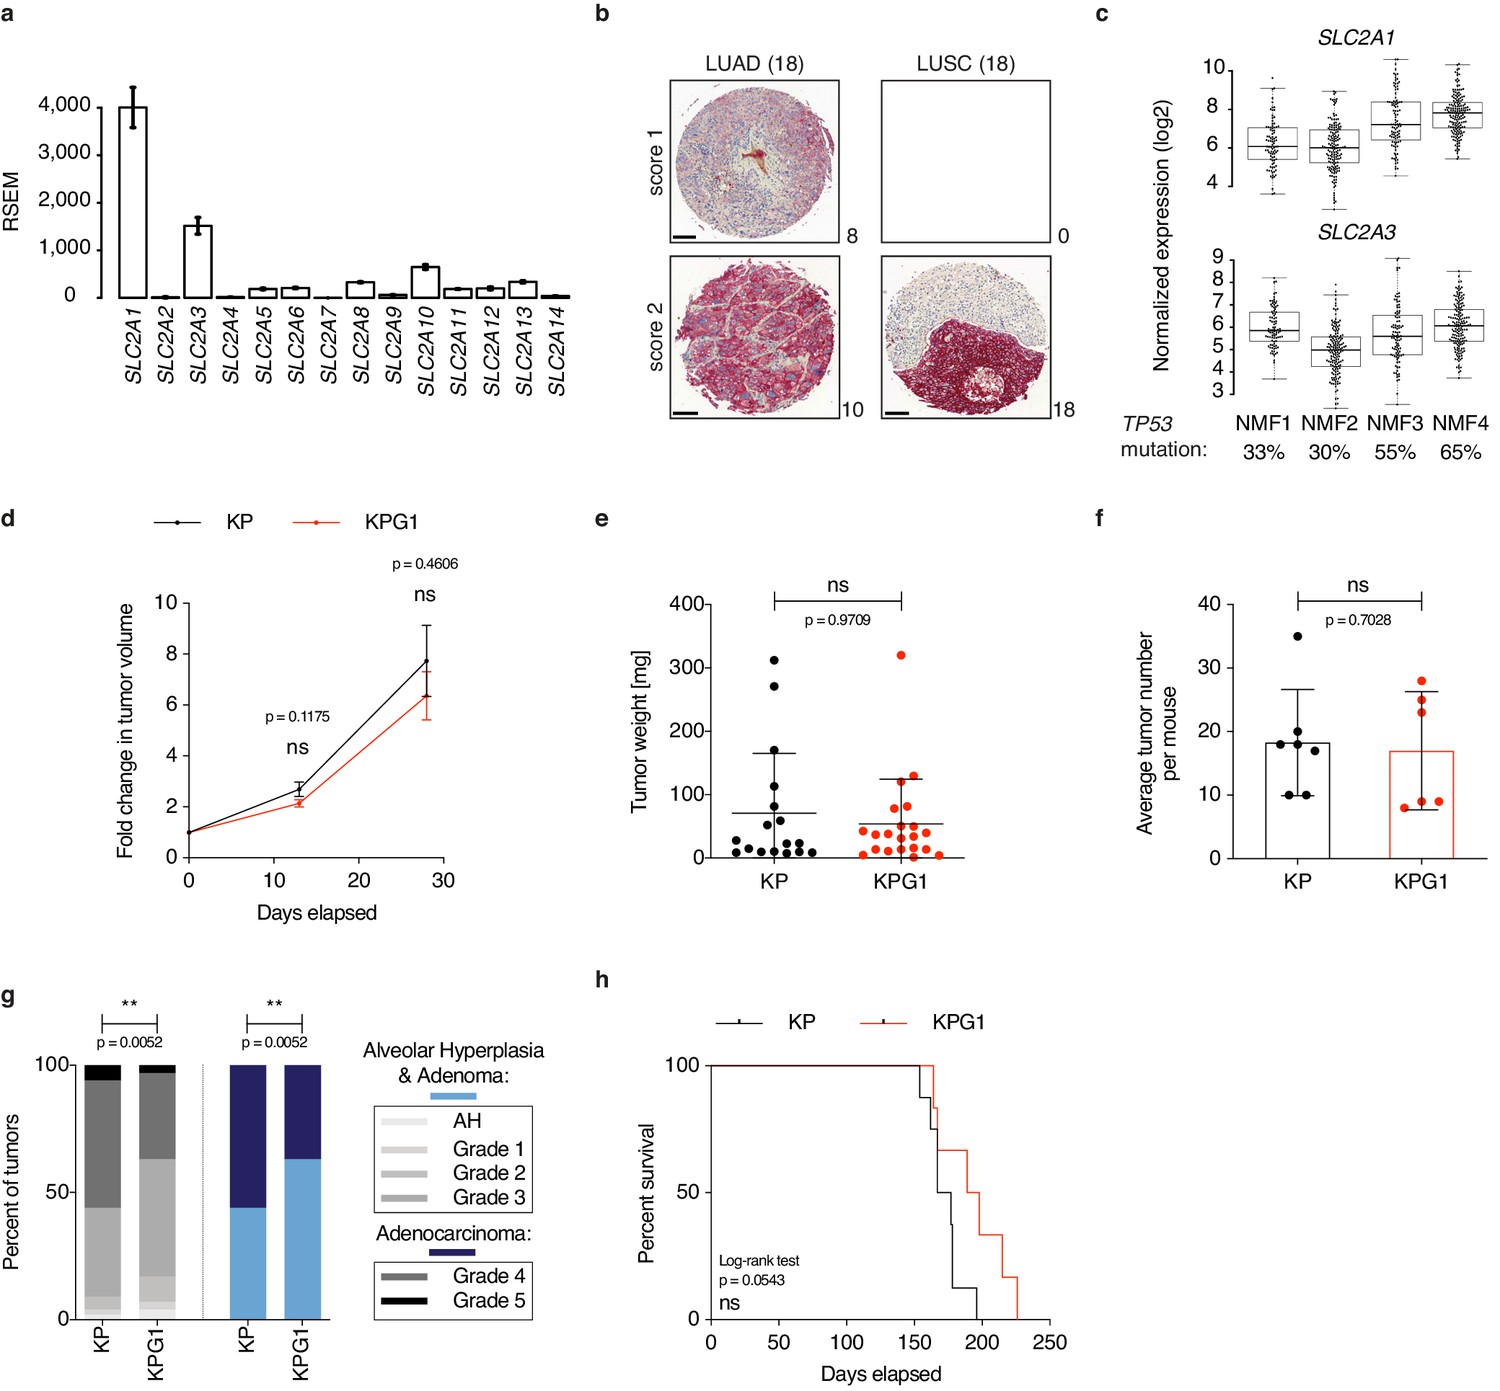
Glut1 deletion does not impact disease progression in KrasLSL-G12D/WT; Trp53Flox/Flox mice.
(a) Gene expression level (RSEM) of glucose transporters in TCGA-LUAD samples (n = 511). (b) Immunohistochemistry (IHC) from a next-generation tissue microarray of human LUAD and LUSC showing score 1 (intermediate) or score 2 (strong) GLUT1 staining. The number of cases per score and histology are indicated. Scale bars: 100 μm. (c) Expression level (log2 normalized) of SLC2A1 and SLC2A3 in the 4 NMF LUAD subtypes. Percent of TP53 mutation in each subtype is indicated. (d) Graph with mean ± s.e.m. shows the fold changes of KP and KPG1 tumor volumes (n = 32 and 26, respectively) monitored during 28 days by μCT, starting at 16 weeks and 6 days post-tumor initiation with tumor volumes set to 1. ns: not significant by Mann-Whitney test. (e) Dot plot with mean ± s.d. shows KP and KPG1 tumor weights (n = 17 and 21) at sacrifice 29 weeks post-tumor initiation. ns: not significant by Mann-Whitney test. (f) Dot plot with mean ± s.d. shows the average number of KP and KPG1 tumors per mouse (n = 7 and 6 mice). ns: not significant by Mann-Whitney test. (g) Percent of KP (n = 128) and KPG1 (n = 102) lesions classified by tumor grades, either detailed from alveolar hyperplasia (AH) to grade 5 or discriminated between alveolar hyperplasia and adenomas, and adenocarcinomas. Alveolar hyperplasia and adenomas include the AH and the tumor grades 1, 2, and 3. Adenocarcinomas contain the tumor grades 4 and 5. **: p < 0.01. Fisher test was applied when comparing AH, grade 1, grade 2, grade 3, grade 4, and grade 5. Chi-square for trend was applied when comparing alveolar hyperplasia and adenomas, and adenocarcinomas. (h) Kaplan-Meier survival analysis of KP (n = 8) and KPG1 (n = 6) mice. ns: not significant by Log-rank test.
-
Figure 1—source data 1
Source files for tumor growth, grades and survival of KP and KPG1 mice.
- https://cdn.elifesciences.org/articles/53618/elife-53618-fig1-data1-v1.xlsx
Figure 1—figure supplement 1
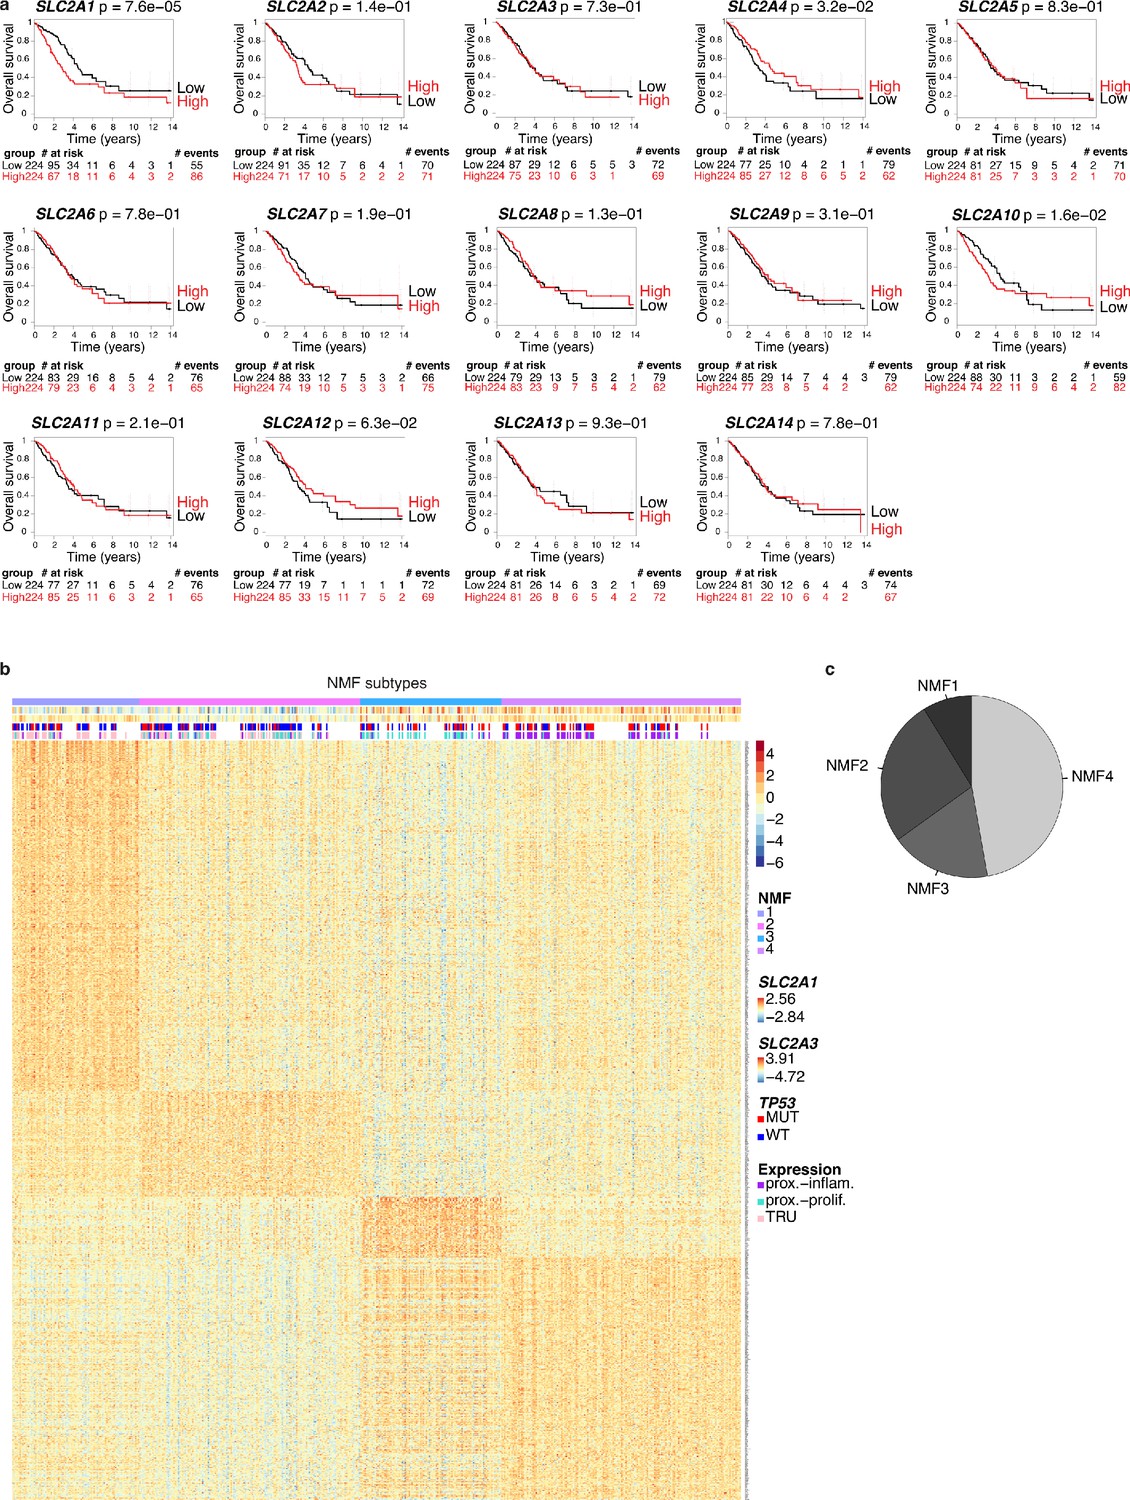
Non-negative matrix factorization generates four LUAD subtypes, with NMF4 being the closest to KP tumors.
(a) Kaplan-Meier survival analyses of glucose transporters in TCGA-LUAD (n = 448). Samples are split by median expression into high and low groups. p-values were computed with Wald test. (b) Heatmap showing gene expression (log2 normalized) of 935 metagenes selected by NMF to identify the 4 LUAD subtypes: NMF1-4 (top bar 1). Top bars 2 and 3: SLC2A1 and SLC2A3 expression, respectively. Top bar 4: TP53 mutation status. Top bar 5: samples identified as proximal proliferative, proximal inflammatory and terminal respiratory unit (The Cancer Genome Atlas Research Network, 2014). (c) NMF subtype prediction applied to KP mouse bulk Lenti tumors; NMF1: 8%, NMF2: 26%, NMF3: 18% and NMF4: 48% (average of 4 samples).
Figure 1—figure supplement 2
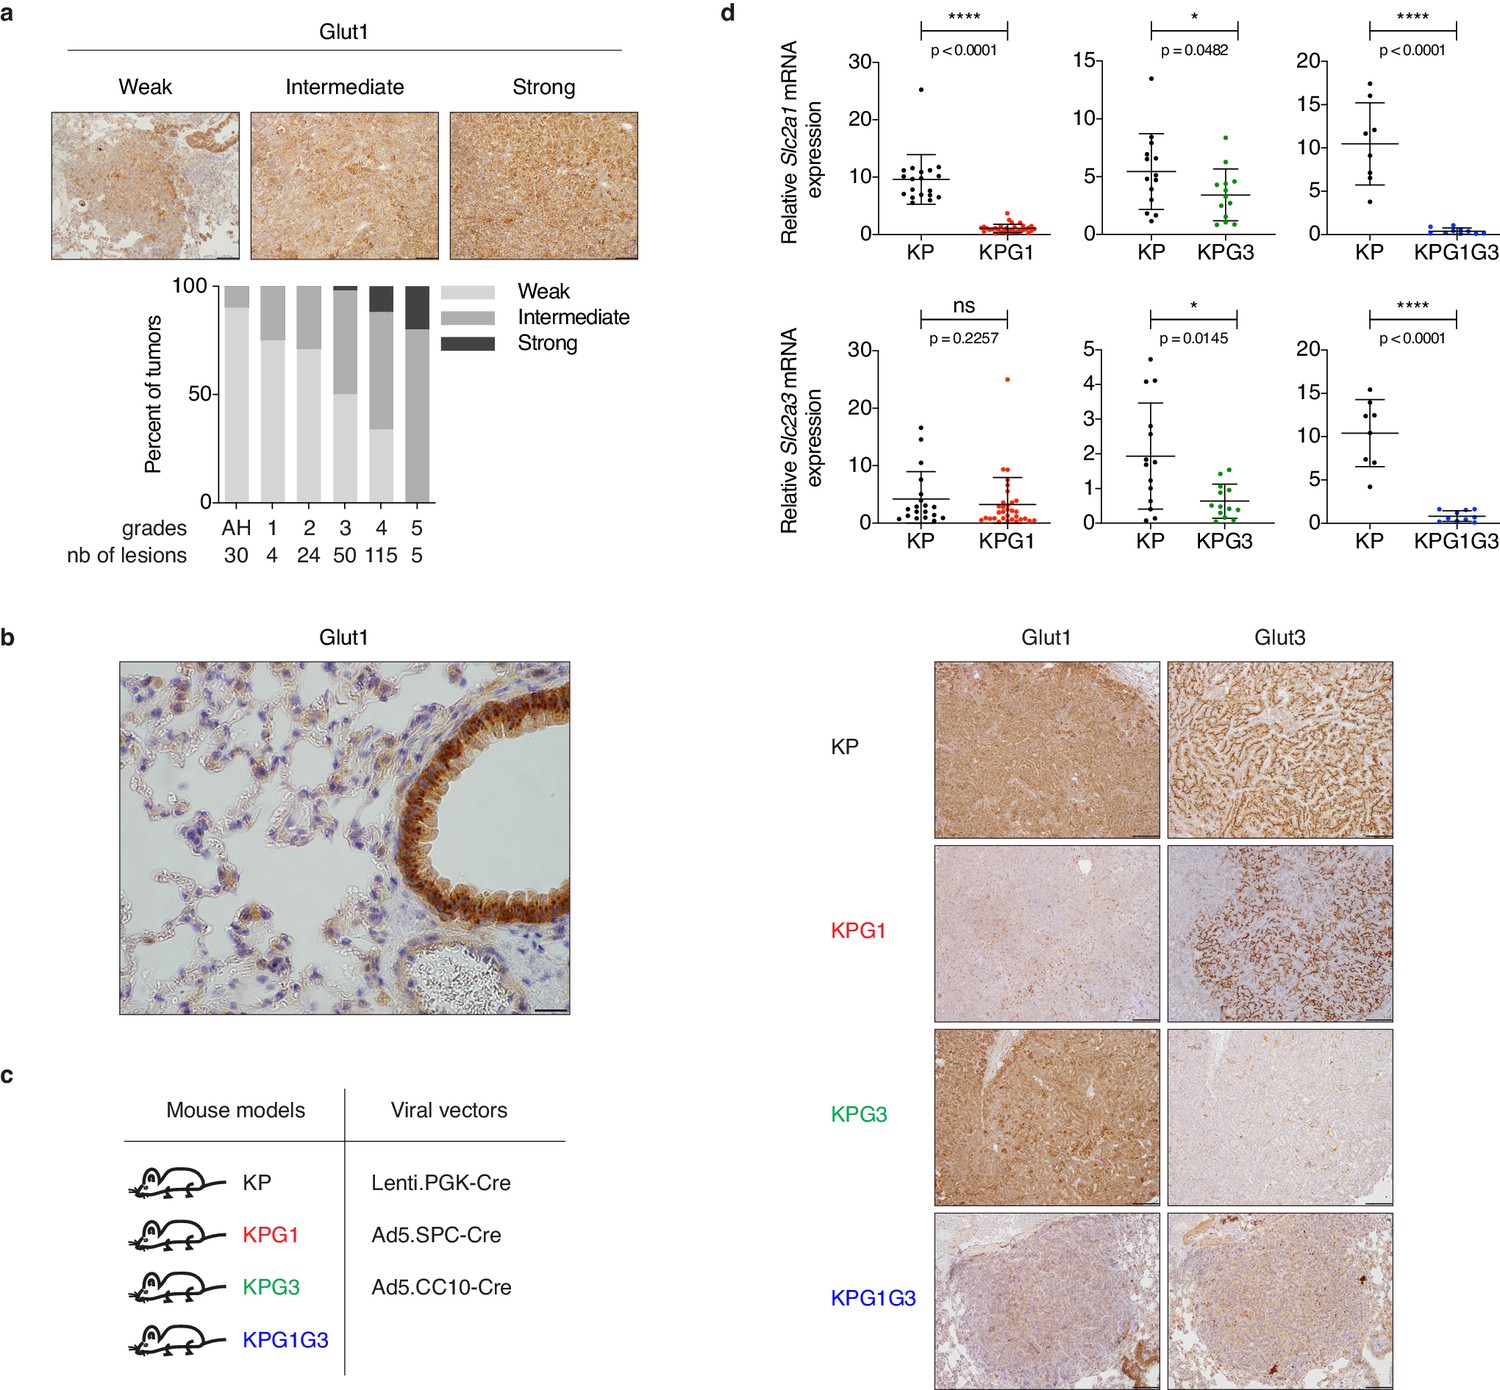
Glut1 is detectable in tumors and the bronchiolar epithelium but not in the alveolar compartment.
(a) (upper panels) Representative examples of Glut1 staining by immunohistochemistry (IHC) in KP tumors showing weak, intermediate or strong expression. Scale bars: 100 μm. (lower panel) IHC quantification of KP lesions from alveolar hyperplasia (AH) to grade 5 tumors shows percent of Glut1 staining defined as weak, intermediate or strong. The number of lesions monitored per grade is indicated. (b) Representative Glut1 staining in a KP lung, showing weak expression in the alveolar compartment and strong staining in the bronchiolar epithelium. Scale bar: 20 μm. (c) Mouse models and viral vectors used. (d) Validation of Glut1 or Glut3 deletion by (upper panels) real-time PCR from purified CD45 - tumor fractions (KP & KPG1: n = 19, 32, respectively; KP & KPG3: n = 14, 13, respectively; KP & KPG1G3: n = 8, 10, respectively) or by (lower panels) Glut1 or Glut3 staining with IHC. ns: not significant by Mann-Whitney test; *: p < 0.05 by Mann-Whitney test; ****: p < 0.0001 by Mann-Whitney test. Scale bars: 200 μm (KP, KPG1 and KPG3 rows). Scale bars: 100 μm (KPG1G3 row).
-
Figure 1—figure supplement 2—source data 1
Source files for Glut1 protein expression analysis by KP tumor grade.
- https://cdn.elifesciences.org/articles/53618/elife-53618-fig1-figsupp2-data1-v1.xlsx
Figure 2
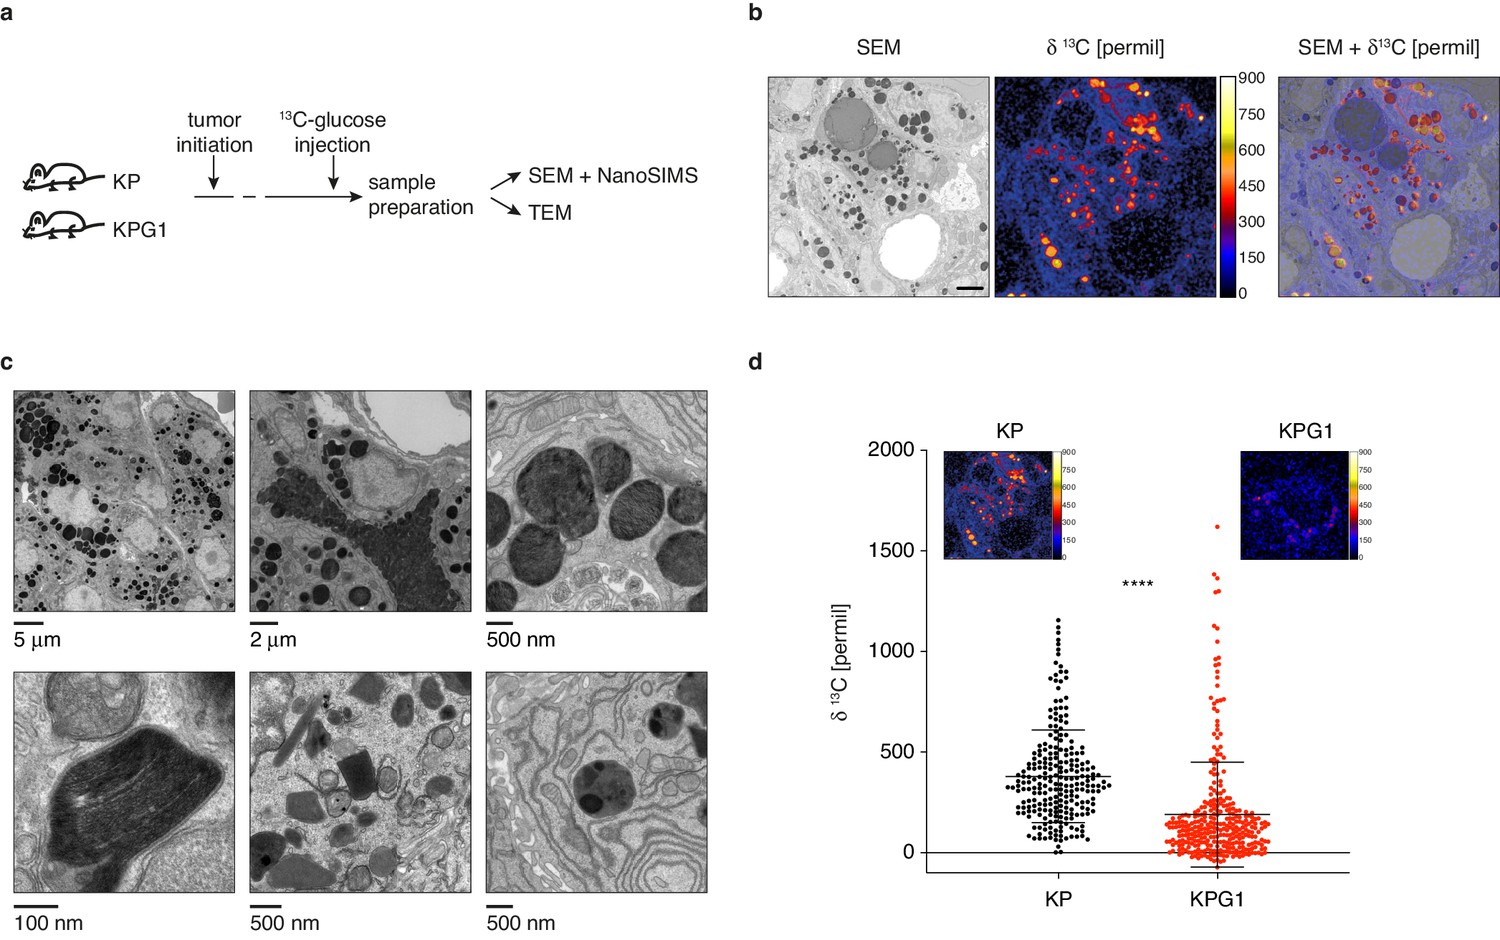
Lamellar body-like organelles are produced by tumor cells and accumulate most glucose-derived biomass.
(a) Experimental setting. (b) Representative examples of a scanning electron microscopy (SEM) images (left), NanoSIMS isotopic image (middle) and their superposition (right) obtained from a KP tumor. Scale bar: 2 μm. (c) (upper panels) Representative transmission electron microscopy (TEM) images from KP tumors showing lamellar body-like organelles (LBOs) with different sizes, secretory behavior and presence of lamellae. (lower panels) High-resolution TEM micrographs showing high magnification lamellae (left), and LBOs with morphologies reminiscent of immature lamellar bodies (LBs) (middle and right). (d) Dot plot with mean ± s.d. showing the NanoSIMS quantification of 13C-enrichments in LBOs from KP and KPG1 tumors. Each dot represents the measurement of an individual LBO (n = 239 KP LBOs and n = 325 KPG1 LBOs). ****: p < 0.0001 by Mann-Whitney test. Representative NanoSIMS isotopic images of a (left) KP and (right) KPG1 tumor cell.
Figure 3 with 3 supplements

Glut1-deficient tumor analyses suggest Glut3- or PPARα-dependent compensatory mechanisms.
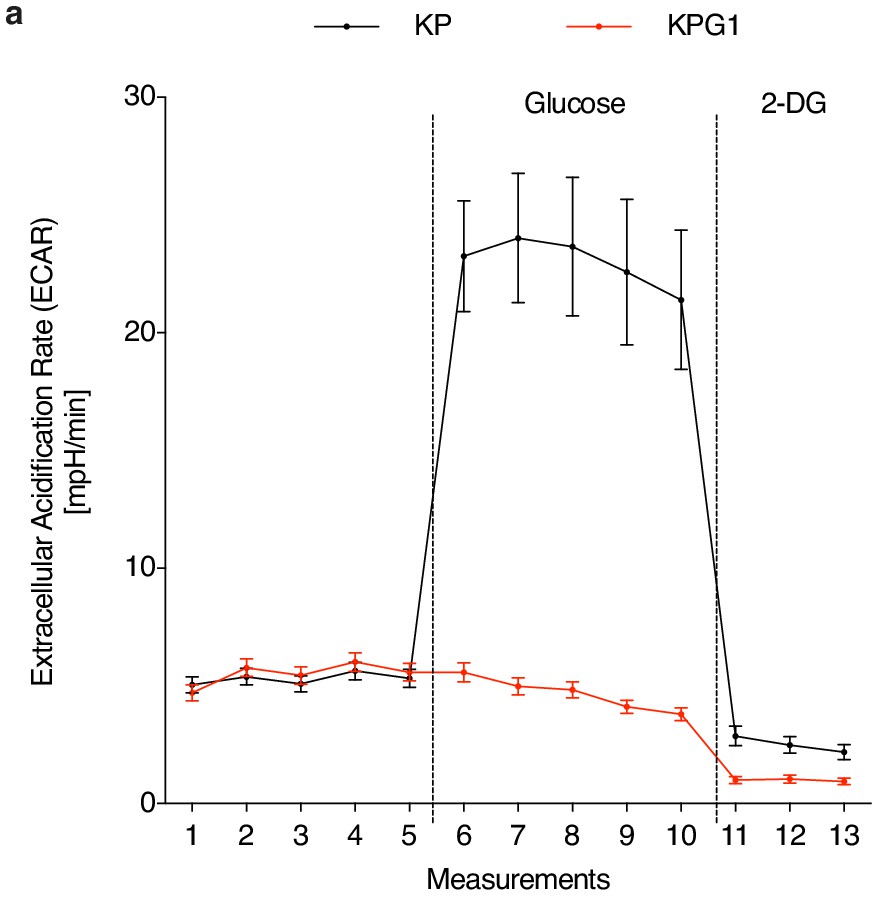
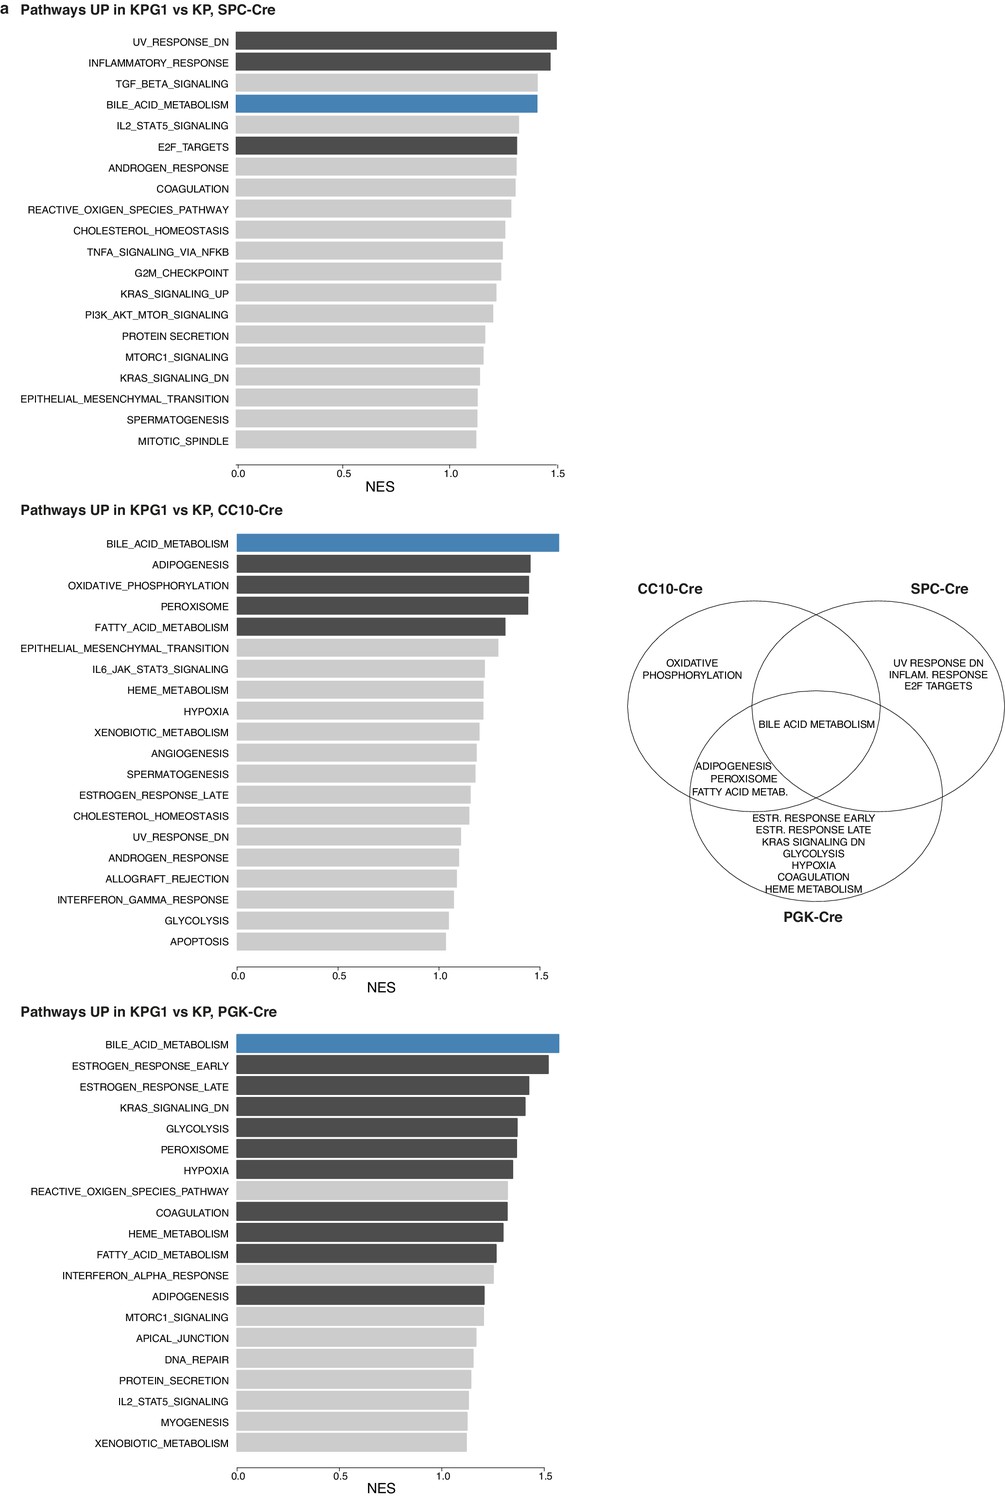
(a) (left) Tumor-derived single cell preparations were placed in a Seahorse XF analyzer and subjected to longitudinal extracellular acidification rate (ECAR) measurements. Glucose or 2-deoxyglucose (2-DG) were added where indicated. Data are means ± s.e.m. of 3 KP and 3 KPG1 tumor-derived single cells each analyzed in ten or five technical replicates. The data from the outlier KPG1 are shown separately (orange) from the 2 other KPG1 tumors (red). (right) Real-time PCR and western blot analyses of Glut1 and Glut3 from the samples analyzed by Seahorse. (b) Bile acid metabolism genes from Hallmark collection (mSigDB) induced in KPG1 compared to KP from SPC-Cre, CC10-Cre and PGK-Cre tumors. Expression above the median is shown in red, below in green. Genes in red are PPARα targets (Rakhshandehroo et al., 2010). (c) Gene Set Enrichment Analysis (GSEA) of PPARα targets on genes ranked based on t-statistics when comparing KPG1 and KP tumors in SPC-Cre, CC10-Cre and PGK-Cre. p-values were obtained by normalized enrichment score (NES) of 105 random permutations. (d) Model illustrating two possible alternatives to Glut1 deficiency for tumor growth.
-
Figure 3—source data 1
Source files for Seahorse analysis of KP and KPG1 tumors.
- https://cdn.elifesciences.org/articles/53618/elife-53618-fig3-data1-v1.xlsx
Figure 3—figure supplement 1
Glut1 deletion compromises ex vivo glycolytic metabolism.
(a) Freshly-isolated tumor-derived cells were placed in a Seahorse XF analyzer and subjected to longitudinal extracellular acidification rate (ECAR) measurements. Glucose or 2-deoxyglucose (2-DG) were added where indicated. Data are means ± s.e.m. of 3 KP and 3 KPG1 tumor-derived cells each analysed in ten technical replicates.
-
Figure 3—figure supplement 1—source data 1
Source files for Seahorse analysis of KP and KPG1 tumors.
- https://cdn.elifesciences.org/articles/53618/elife-53618-fig3-figsupp1-data1-v1.xlsx
Figure 3—figure supplement 2
Hallmark ‘bile acid metabolism’ is upregulated in Glut1-deficient tumors.
(a) (left panels) Top 20 Hallmark pathways enriched in genes induced in KPG1 versus KP in SPC-Cre (top left), CC10-Cre (middle left) and PGK-Cre (bottom left). Bar length shows the normalized enrichment score obtained by Gene Set Enrichment Analysis (GSEA). Genesets with significant enrichment (p-value < 0.05) are shown in dark gray. Bile acid metabolism pathway is highlighted in blue. (right panel) Venn diagram showing induced pathways shared between SPC-Cre, CC10-Cre and PGK-Cre tumors in KPG1 compared to KP tumors.
Figure 3—figure supplement 3
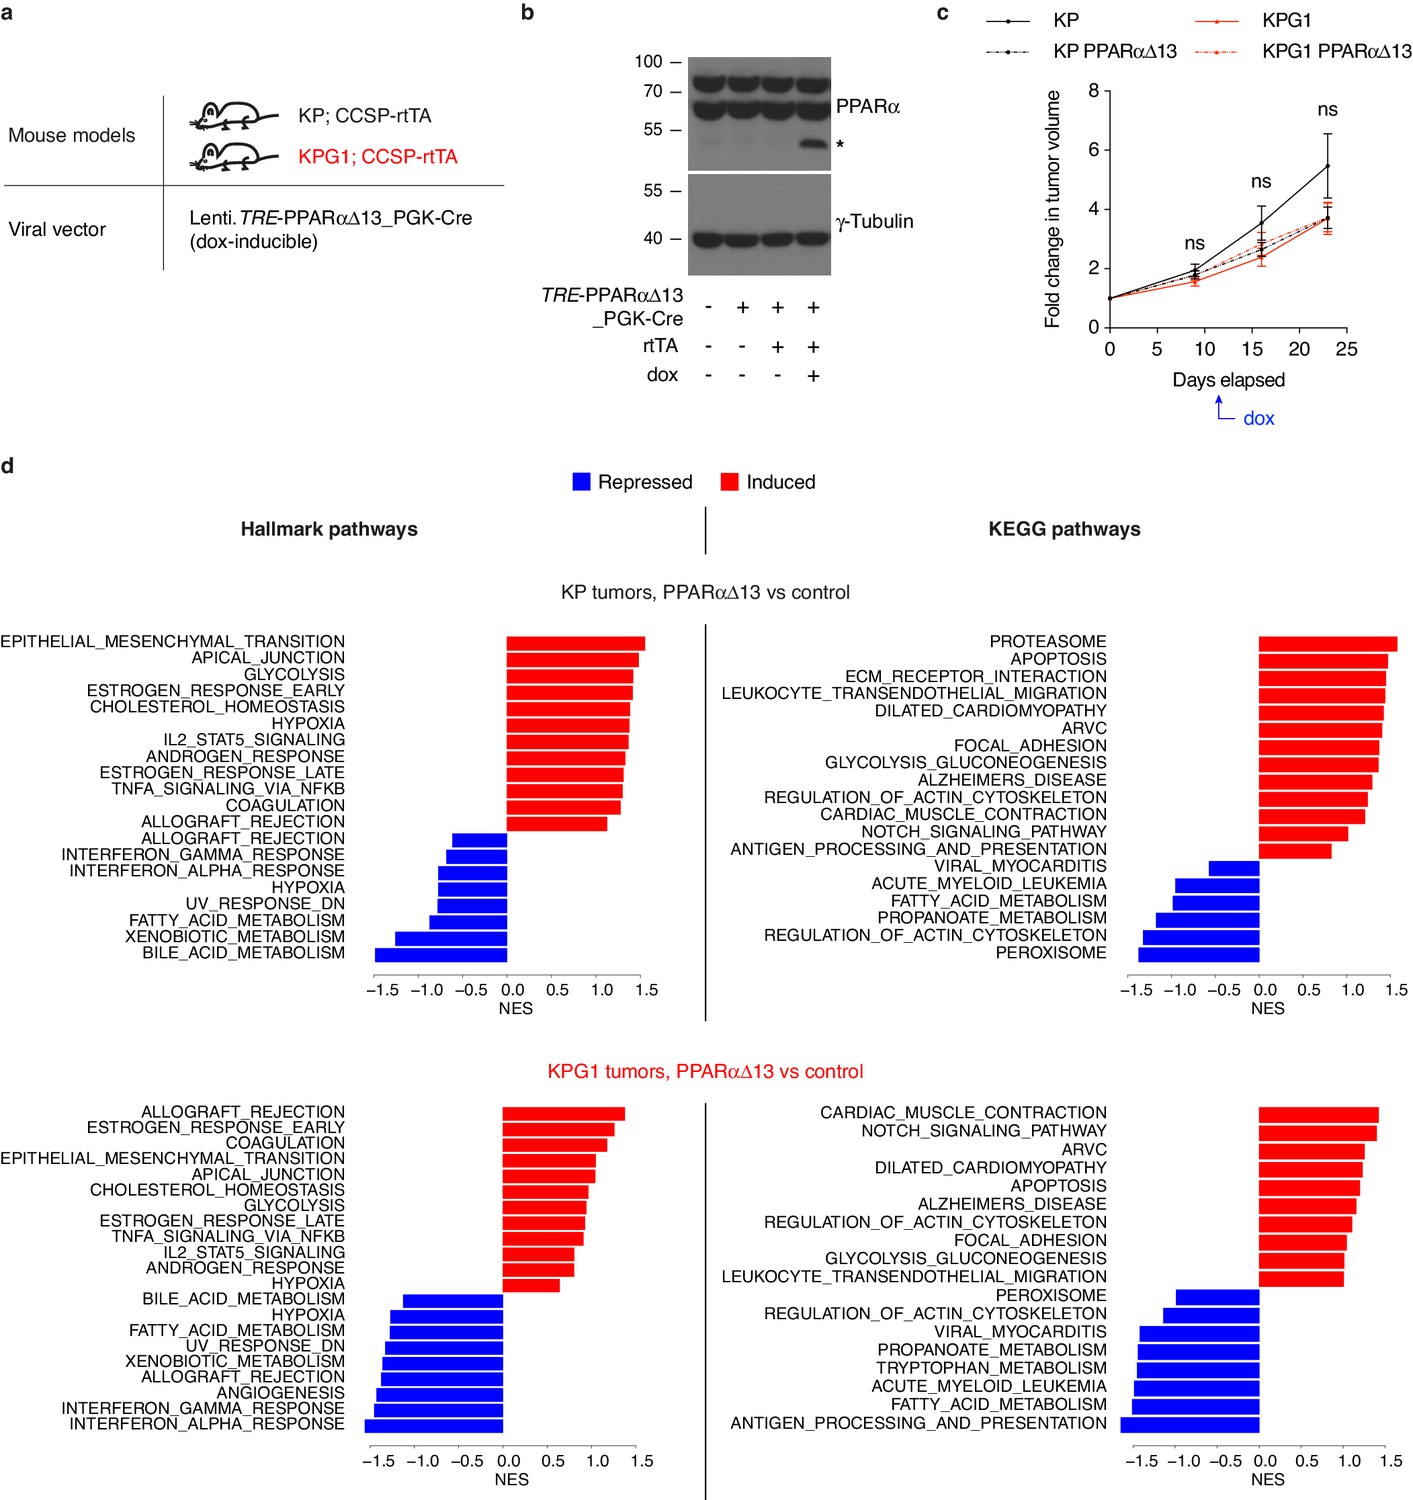
PPARαΔ13 does not interfere with tumor development of KP and KPG1 mice.
(a) Mouse models and viral vector used for in vivo PPARαΔ13 induction in tumor cells. (b) Western blot from transfected 293T cells’ extracts validating the doxycycline-mediated PPARαΔ13 induction in presence of a co-transfected rtTA construct, indicated by the asterisk. (c) Graph with mean ± s.e.m. shows the fold changes of KP, KP-PPARαΔ13, KPG1 and KPG1-PPARαΔ13 (n = 11, 16, 11 and 8, respectively) tumor volumes monitored during 23 days by μCT, before and during doxycycline diet, starting at 22 weeks and 4 days post-tumor initiation with tumor volumes set to 1. ns: not significant by Mann-Whitney test. (d) Hallmark and KEGG pathways regulated (induced in red and repressed in blue) by PPARαΔ13 versus control in KP (top panels) and KPG1 (bottom panels) tumors. Bar length represents the normalized enrichment score (NES) obtained by GSEA. Genesets with significant enrichment (p-value < 0.05) are shown.
-
Figure 3—figure supplement 3—source data 1
Source files for tumor growth of KP and KPG1 mice, with or without PPARαΔ13 induction.
- https://cdn.elifesciences.org/articles/53618/elife-53618-fig3-figsupp3-data1-v1.xlsx
Figure 4 with 4 supplements
Combined Glut1 and Glut3 deletion impairs lung tumor growth.
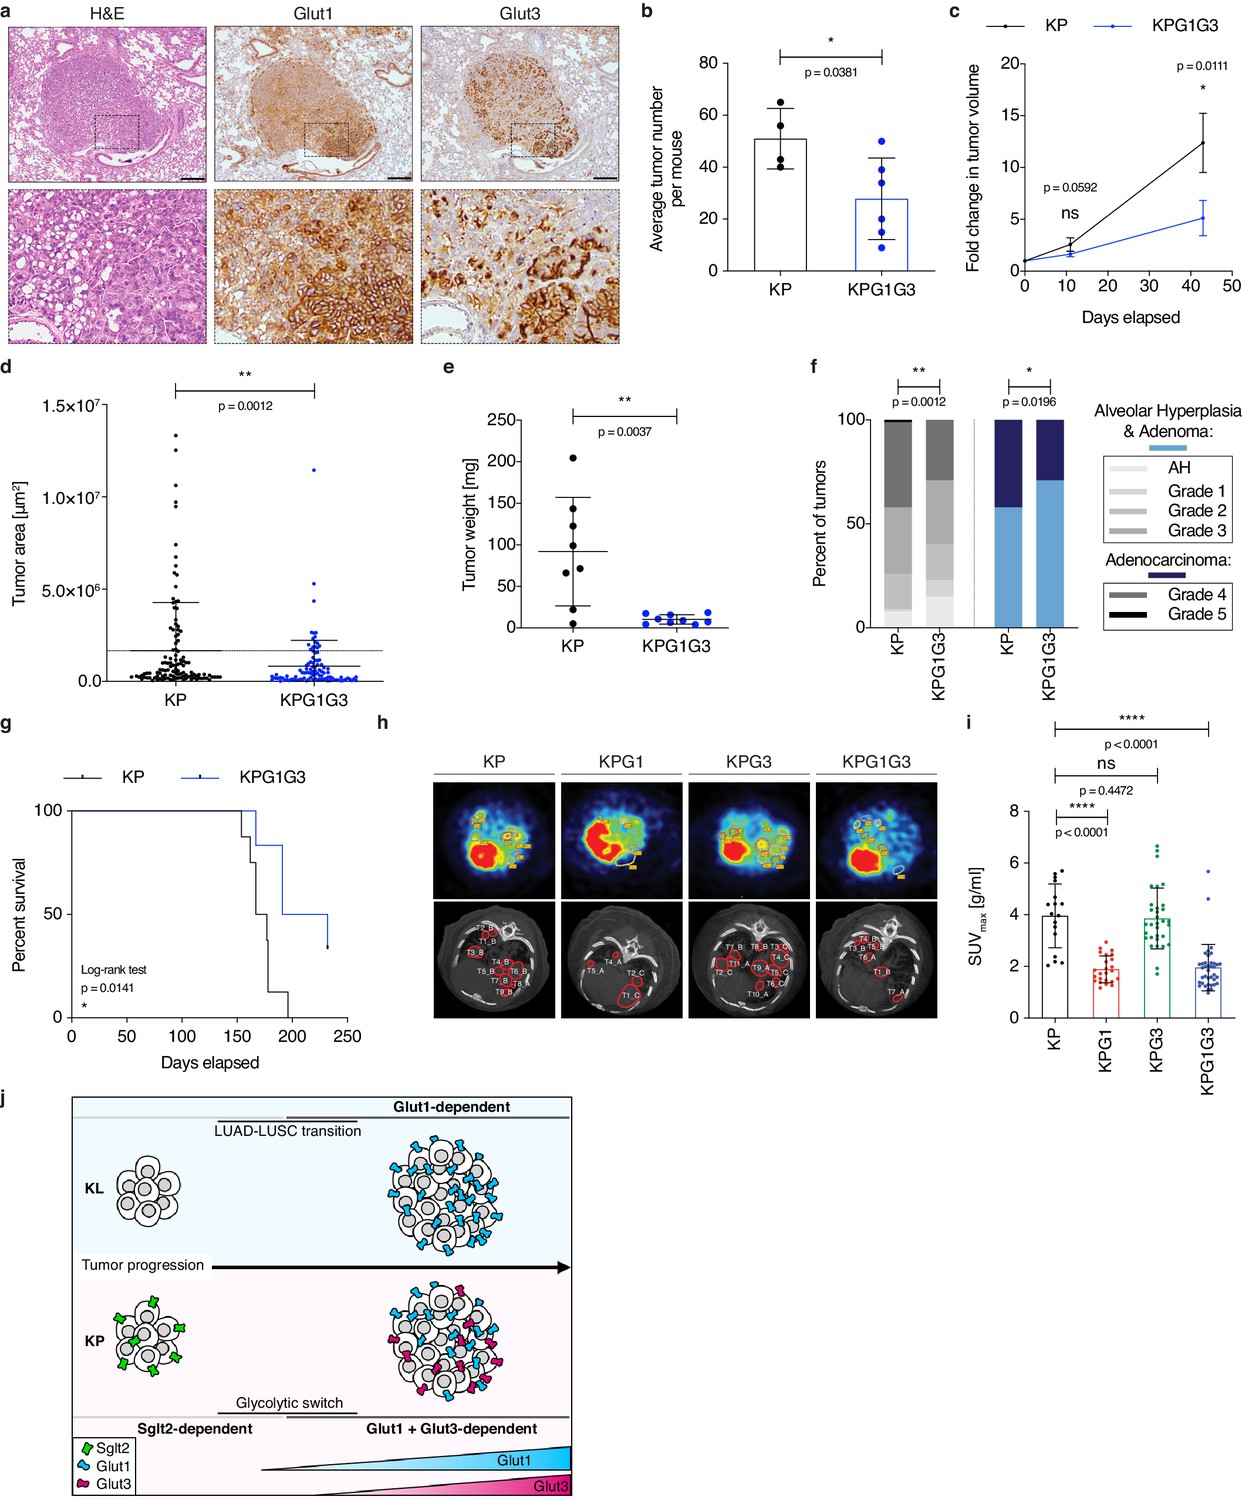
(a) Representative examples of H&E, Glut1 or Glut3 staining by IHC from serial sections of a KP tumor showing Glut1-3 co-localization. Scale bars: 200 μm. (b) Histogram with mean ± s.d. shows the average number of KP and KPG1G3 tumors per mouse (n = 4 and 6 mice). *: p < 0.05 by Mann-Whitney test. (c) Graph with mean ± s.e.m. shows the fold changes of KP and KPG1G3 tumor volumes (n = 8 and 9 tumors) monitored during 43 days by μCT, starting at 15 weeks and 2 days post-tumor initiation with tumor volumes set to 1. ns: not significant by Mann-Whitney test; *: p < 0.05 by Mann-Whitney test. (d) Dot plot with mean ± s.d. shows tumor areas in KP and KPG1G3 mice (n = 115 and 101 tumors) calculated from lung sections. **: p < 0.01 by Mann-Whitney test. (e) Dot plot with mean ± s.d. shows KP and KPG1G3 tumor weights (n = 8 and 9 tumors, respectively) at sacrifice. **: p < 0.01 by Mann-Whitney test. (f) Percent of KP (n = 150) and KPG1G3 (n = 170) lesions classified by tumor grades, either detailed from alveolar hyperplasia (AH) to grade 5 or discriminated between alveolar hyperplasia and adenomas, and adenocarcinomas. Alveolar hyperplasia and adenomas include the AH and the tumor grades 1, 2, and 3. Adenocarcinomas contain the tumor grades 4 and 5. *: p < 0.05; **: p < 0.01. Fisher test was applied when comparing AH, grade 1, grade 2, grade 3, grade 4, and grade 5. Chi-square for trend was applied when comparing alveolar hyperplasia and adenomas, and adenocarcinomas. (g) Kaplan-Meier survival analysis of KP (n = 8) and KPG1G3 (n = 6) mice. *: p < 0.05 by Log-rank test. (h) Representative (upper panels) positron emission tomography (PET) scan and (lower panels) μCT scan images illustrating the 18F-FDG absorption of KP, KPG1, KPG3 and KPG1G3 tumors. (i) Dot plot with mean ± s.d. displays maximum standardized uptake value (SUV max ) of KP (n = 17), KPG1 (n = 24), KPG3 (n = 32) and KPG1G3 (n = 38) lesions. ns: not significant by Mann-Whitney test; ****: p < 0.0001 by Mann-Whitney test. (j) Model illustrating the dependency on glucose transporters for KP and KL tumor progression.
-
Figure 4—source data 1
Source files for tumor growth, grades and survival of KP and KPG1G3 mice.
- https://cdn.elifesciences.org/articles/53618/elife-53618-fig4-data1-v1.xlsx
Figure 4—figure supplement 1
Glut1 and Glut3 co-localize frequently within tumors.
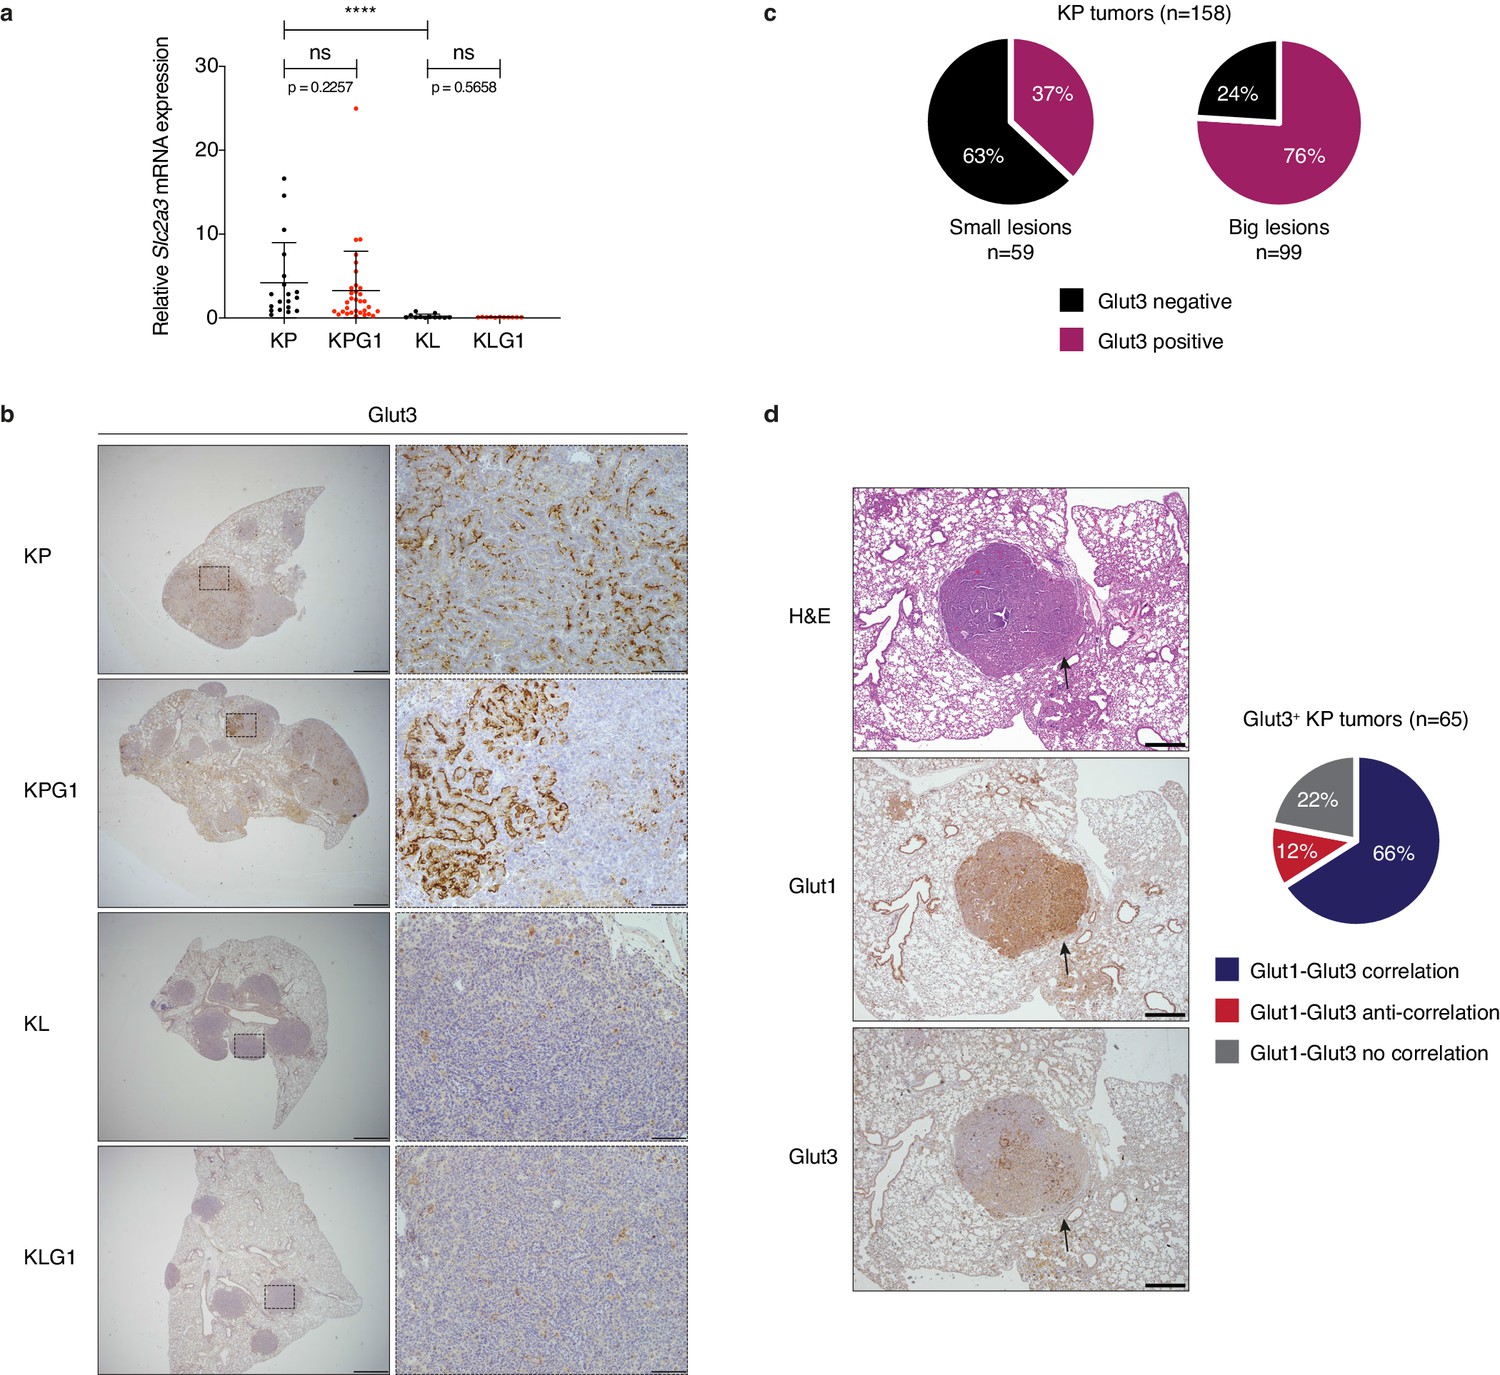
(a) Real time PCR for Slc2a3 on KP (n = 19), KPG1 (n = 32), KL (n = 12) and KLG1 (n = 11) tumors. ns: not significant by Mann-Whitney test; ****: p < 0.0001 by Mann-Whitney test. (b) Representative examples of Glut3 staining by immunohistochemistry (IHC) from KP, KPG1, KL and KLG1 tumor-bearing lungs. (left panels) Scale bars: 1 mm. (right panels) Scale bars: 100 μm. (c) Percent of KP tumors showing Glut3 positive staining in small and big lesions assessed by IHC. (d) (left panels) Representative example of H&E, Glut1 or Glut3 staining by IHC from serial sections of a KP tumor shows co-localization. Arrows indicate localization of strong Glut1 and Glut3 expression. Scale bars: 500 μm. (right panel) Percent of Glut3 positive KP tumors showing Glut1 and Glut3 expression correlation, no correlation or anti-correlation assessed by IHC.
Figure 4—figure supplement 2
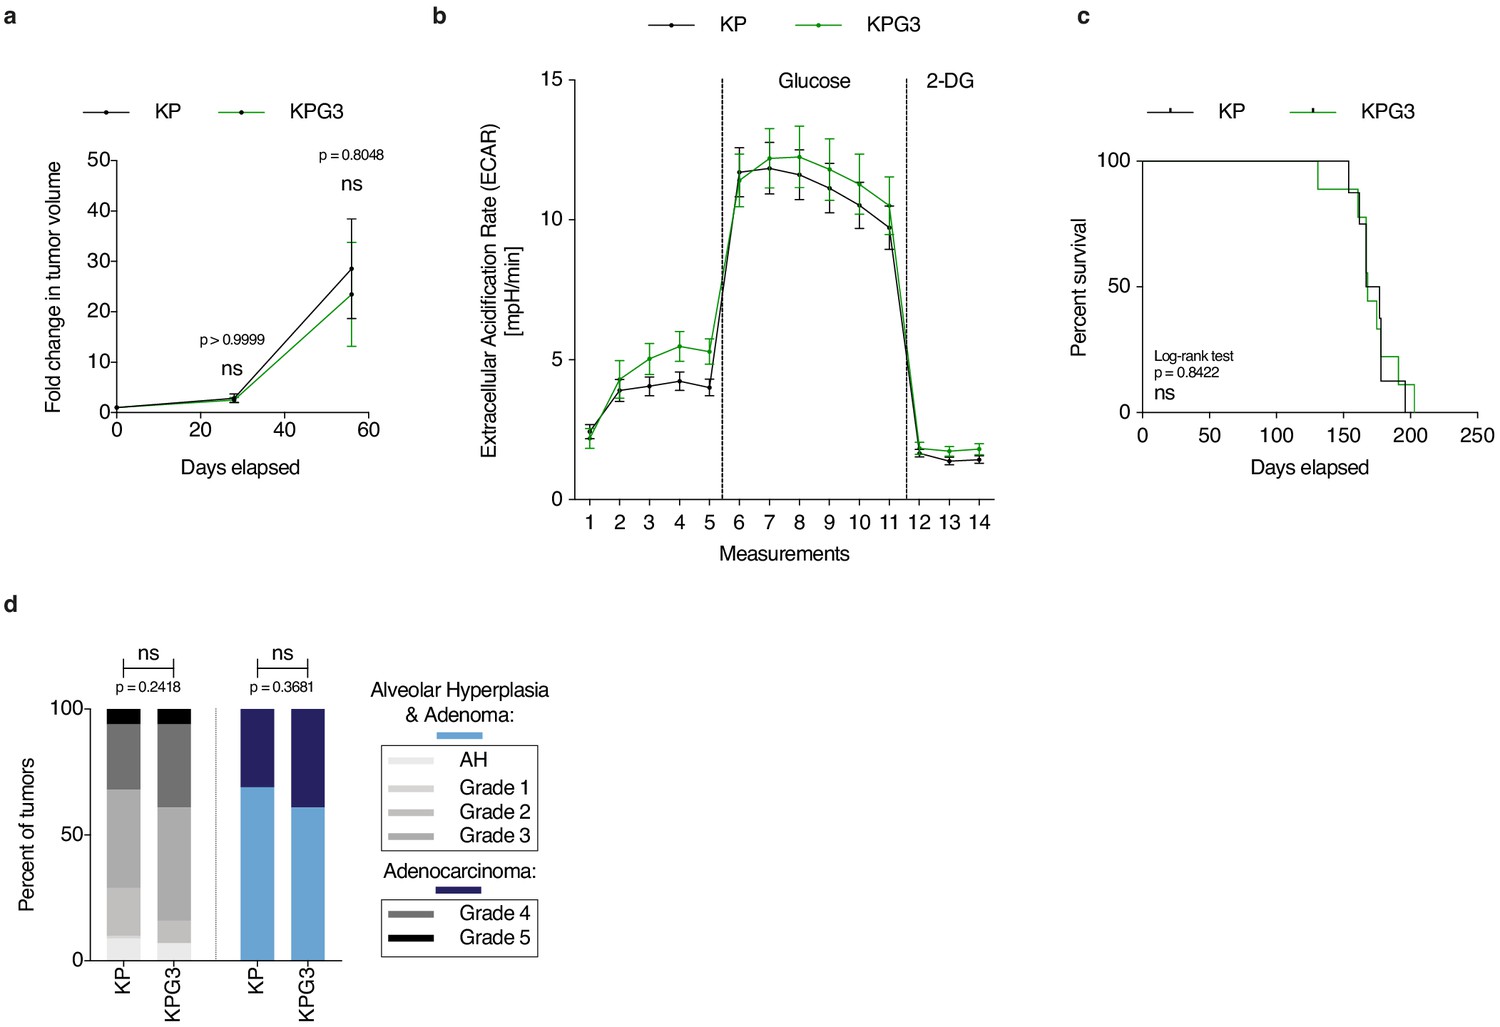
Glut3 deletion alone does not affect lung tumor development.
(a) Graph with mean ± s.e.m. shows the fold changes of KP and KPG3 tumor volumes (n = 7, respectively) monitored during 56 days by μCT, starting at 16 weeks post-tumor initiation with tumor volumes set to 1. ns: not significant by Mann-Whitney test. (b) Freshly-isolated tumor-derived cells were placed in a Seahorse XF analyzer and subjected to longitudinal extracellular acidification rate (ECAR) measurements. Glucose or 2-deoxyglucose (2-DG) were added where indicated. Data are means ± s.e.m. of 4 KP and 2 KPG3 tumor-derived cells each analysed in ten technical replicates. (c) Kaplan-Meier survival analysis of KP (n = 8) and KPG3 (n = 9) mice. ns: not significant by Log-rank test. (d) Percent of KP (n = 86) and KPG3 (n = 54) lesions classified by tumor grades, either detailed from alveolar hyperplasia (AH) to grade 5 or discriminated between alveolar hyperplasia and adenomas, and adenocarcinomas. Alveolar hyperplasia and adenomas include the AH and the tumor grades 1, 2, and 3. Adenocarcinomas contain the tumor grades 4 and 5. ns: not significant. Fisher test was applied when comparing AH, grade 1, grade 2, grade 3, grade 4, and grade 5. Chi-square for trend was applied when comparing alveolar hyperplasia and adenomas, and adenocarcinomas.
-
Figure 4—figure supplement 2—source data 1
Source files for tumor growth, Seahorse analysis, survival and grades of KP and KPG3.
- https://cdn.elifesciences.org/articles/53618/elife-53618-fig4-figsupp2-data1-v1.xlsx
Figure 4—figure supplement 3
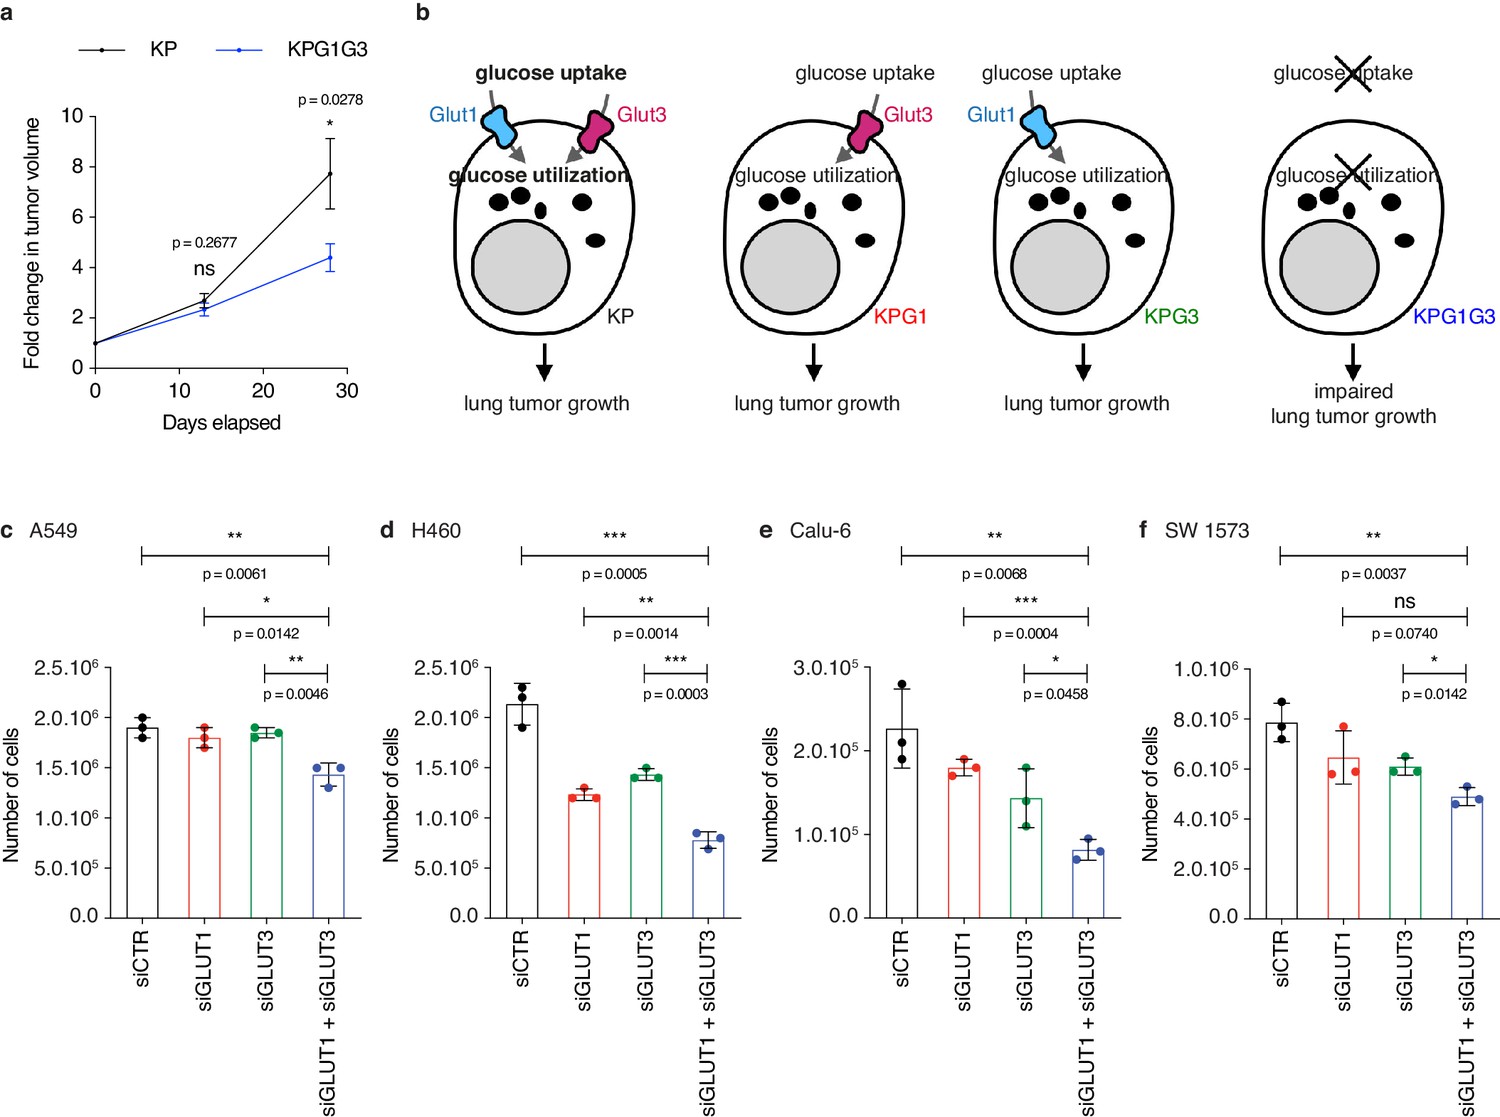
Dual knockdown of GLUT1 and GLUT3 most strongly reduces human non-small cell lung cancer cell viability in vitro, corroborating the in vivo data.
(a) Graph with mean ± s.e.m. shows the fold changes of KP and KPG1G3 tumor volumes (n = 32 and 20, respectively) monitored during 28 days by X-rays micro-computed tomography (μCT), starting at 16 weeks and 6 days post-tumor initiation with tumor volumes set to 1. ns: not significant by Mann-Whitney test; *: p < 0.05 by Mann-Whitney test. (b) Model illustrating the different studied scenarios. (c-f) Dot plots with mean ± s.d. exhibit the average number of cells 72 hours after transfection with siCTR, siGLUT1, siGLUT3, or siGLUT1 + siGLUT3 in (c) A549, (d) H460, (e) Calu-6, and (f) SW 1573 cells. Each condition was performed in 3 technical replicates. ns: not significant by t-test; *: p < 0.05 by t-test; **: p < 0.01 by t-test; ***: p < 0.001 by t-test.
-
Figure 4—figure supplement 3—source data 1
Source files for tumor growth of KP and KPG1G3 mice.
- https://cdn.elifesciences.org/articles/53618/elife-53618-fig4-figsupp3-data1-v1.xlsx
Figure 4—figure supplement 4

KP tumors do not express differently another glucose transporter upon dual Glut1 and Glut3 deletion.
(a) Dot plots with mean ± s.d. show the relative glucose transporter mRNA expression in CD45 negative fraction from KP and KPG1G3 tumors (Slc2a1 and Slc2a3: n = 8 and 10 tumors, respectively; Slc2a2, Slc2a4, Slc2a5, Slc2a6, Slc2a7, Slc2a8, Slc2a9, Slc2a10, Slc2a12, Slc2a13 and Slc50a1: n = 7 and 3 tumors, respectively). ns: not significant by Mann-Whitney test; ****: p < 0.0001 by Mann-Whitney test
Author response image 1
All human NSCLC cell lines were mycoplasma negative.
(a) PCR showing that Calu-6, H460, A549, and SW 1573 were tested negative for mycoplasma. Black arrow indicates the positive band for mycoplasma detection.
Author response image 2
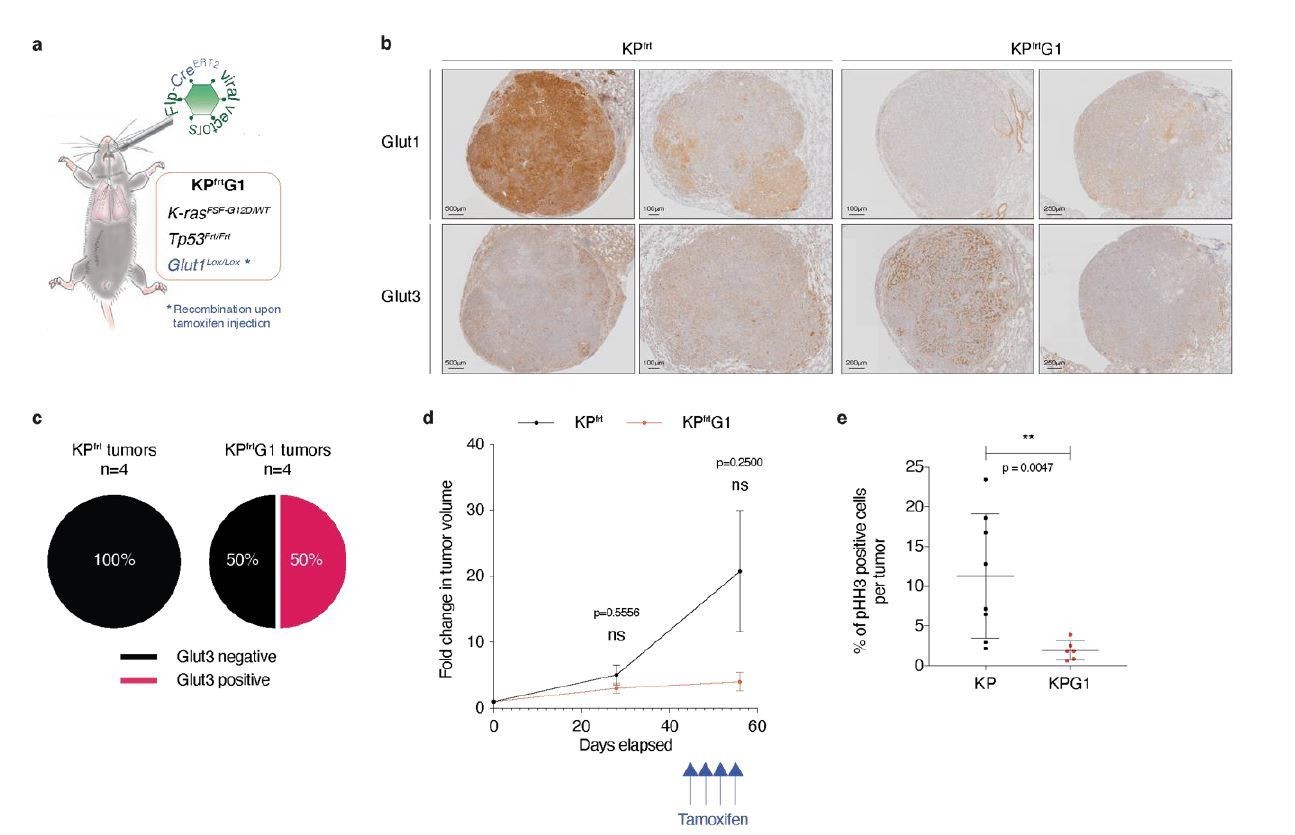
Acute Glut1 deletion in established KPfrt tumors may decrease tumor growth and may induce Glut3 expression.
(a) Mouse model of acute Glut1 deletion. Flp-frt recombinations upon Flp-recombinase induce KrasG12D activation and Tp53 deletion, driving tumor development. Intraperitoneal injection of tamoxifen during tumor development leads to Cre-recombinase activation and the subsequent Cre-lox recombination resulting in Glut1 deletion. (b) Glut1 and Glut3 immunohistochemistry (IHC) in KPfrt and KPfrtG1. (c) Percent of Glut3 positive and negative tumors among (left panel) Glut1 proficient (KP) and (right panel) Glut1 deficient (KPG1) tumors. (d) Graph with mean ± s.d. displaying KP and KPG1 tumor fold change (n = 5 and 3 tumors, respectively) monitored during 56 days by X-rays micro-computed tomography (μCT), starting at 35 weeks and 5 days post-tumor initiation with tumor volumes set to 1. Blue arrows indicate the 4 tamoxifen injections leading to Glut1 deletion. ns: not significant by Mann-Whitney test. (e) Dot plot with mean ± s.d. showing the percent of pHH3 positive cells per tumor between KP (n = 8) and KPG1 (n = 6) lesions. **: p < 0.01 by Mann-Whitney test.
Author response image 3
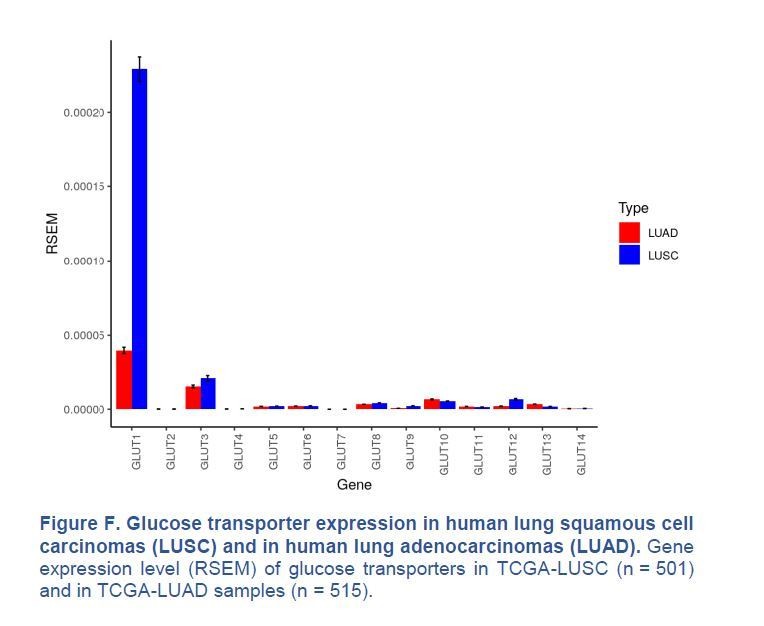
Glucose transporter expression in human lung squamous cell carcinomas (LUSC) and in human lung adenocarcinomas (LUAD).
Gene expression level (RSEM) of glucose transporters in TCGA-LUSC (n = 501) and in TCGA-LUAD samples (n = 515).
Author response image 4

Survival analysis of 448 lung adenocarcinoma patients (TCGA-LUAD) and 475 lung squamous cell carcinoma patients (TCGA-LUSC).
Median glucose transporter GLUT1 expression value splits down the patient tumors into low and high GLUT1 expressers. Kaplan-Meier plots show that GLUT1 expression is associated with a poor overall survival in patients with (a) LUAD tumors, whereas it is not prognostic in patients with (b) LUSC lesions. p-values were computed with Wald test.
Author response image 5

KPG1G3 tumors proliferate significantly more than KP lesions.
(a) Dot plot with mean ± s.d shows percent of pHH3 positive cells per KP or KPG1G3 tumors (n = 4, 6 mice and n = 115, 101 tumors, respectively) at sacrifice. ****: p < 0.0001 by Mann-Whitney test.
Author response image 6
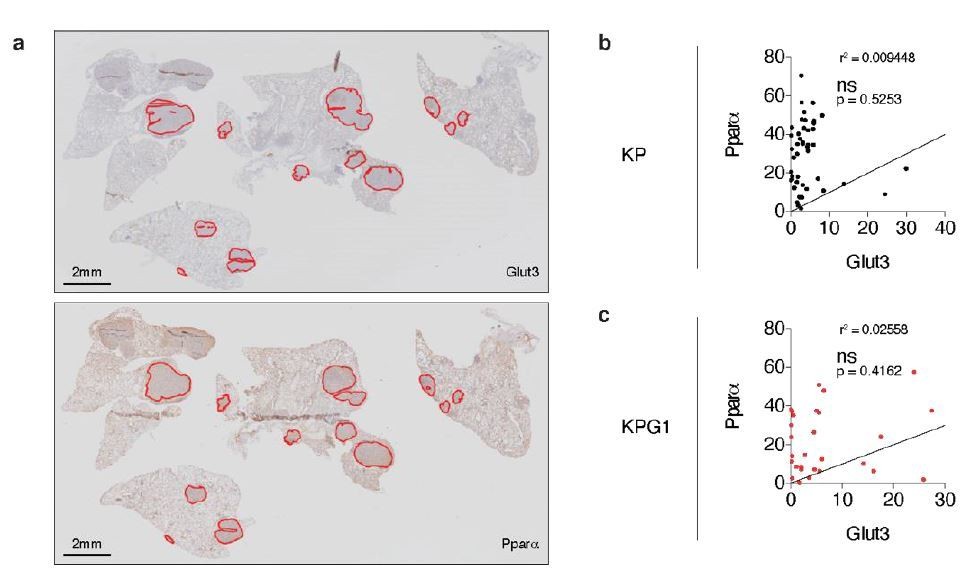
Glut3 and Pparα expressions correlate neither in KP nor in KPG1 tumors.
(a) Representative serial KPG1 tumor-bearing lung sections stained by immunohistochemistry (IHC) for (upper panel) Glut3 and (lower panel) Pparα. Tumors analyzed for this KPG1 mouse are encircled in red. Scale bars: 2 mm. (b-c) Graphs showing the Pearson correlation between Glut3 and Pparα expressions determined by IHC staining in (b) KP (n = 45) and (c) KPG1 (n = 28) tumors. Line of identify, R squared are indicated on graphs. ns: not significant.
Author response image 7

The increased KLG1 tumor growth does not impact the overall mouse survival.
Tables
Key resources table
| Reagent type (species) or resource | Designation | Source or reference | Identifiers | Additional information |
|---|---|---|---|---|
| Strain, strain background (M. musculus, male, female) | K | The Jackson Laboratory | RRID:IMSR_JAX:008179 | KrasLSL-G12D/WT Trp53Flox/Flox K and P interbred at EPFL |
| Strain, strain background (M. musculus, male, female) | P | The Jackson Laboratory | RRID:IMSR_JAX:008462 | KrasLSL-G12D/WT Trp53Flox/Flox K and P interbred at EPFL |
| Strain, strain background (M. musculus, male, female) | KPG1 | Interbred at EPFL | KrasLSL-G12D/WT Trp53Flox/Flox Slc2a1Flox/Flox | |
| Strain, strain background (M. musculus, male, female) | KPG3 | Interbred at EPFL | KrasLSL-G12D/WT Trp53Flox/Flox Slc2a3Flox/Flox | |
| Strain, strain background (M. musculus, male, female) | KPG1G3 | Interbred at EPFL | KrasLSL-G12D/WT Trp53Flox/Flox Slc2a1Flox/Flox Slc2a3Flox/Flox | |
| Strain, strain background (M. musculus, male, female) | KPR | Interbred at EPFL | KrasLSL-G12D/WT Trp53Flox/Flox CCSP-rtTA | |
| Strain, strain background (M. musculus, male, female) | KPRG1 | Interbred at EPFL | KrasLSL-G12D/WT Trp53Flox/Flox Slc2a1Flox/Flox CCSP-rtTA | |
| Strain, strain background (M. musculus, male, female) | KL | Interbred at EPFL | KrasLSL-G12D/WT Stk11Flox/Flox | |
| Strain, strain background (M. musculus, male, female) | KLG1 | Interbred at EPFL | KrasLSL-G12D/WT Stk11Flox/Flox Slc2a1Flox/Flox | |
| Cell line (Homo sapiens) | A549 | ATCC | RRID:CVCL_0023 | Authentication: 100% |
| Cell line (Homo sapiens) | Calu-6 | ATCC | RRID:CVCL_0236 | Authentication: 100% |
| Cell line (Homo sapiens) | H460 | ATCC | RRID:CVCL_0459 | Authentication: 100% |
| Cell line (Homo sapiens) | SW 1573 | ATCC | RRID:CVCL_1720 | Authentication: 93.3% |
| Transfected construct (Homo sapiens and M. musculus) | siCTR | Invitrogen | Cat# 4390843 | Transfected construct |
| Transfected construct (Homo sapiens) | siSLC2A1#1 | ThermoFisher Scientific | s12926 Cat# 4390824 | Transfected construct |
| Transfected construct (Homo sapiens) | siSLC2A1#2 | ThermoFisher Scientific | s12927 Cat# 4390824 | Transfected construct |
| Transfected construct (Homo sapiens) | siSLC2A3#1 | ThermoFisher Scientific | s12931 Cat# 4390824 | Transfected construct |
| Transfected construct (Homo sapiens) | siSLC2A3#2 | ThermoFisher Scientific | s12932 Cat# 4390824 | Transfected construct |
| Antibody | GLUT1 (Rabbit monoclonal) | Abcam | RRID:AB_10903230 | IHC (1:650) |
| Antibody | GLUT1 (Rabbit polyclonal) | Millipore | RRID:AB_1587074 | IHC (ngTMA) (1:5000); WB (1:1000) |
| Antibody | GLUT3 (Rabbit polyclonal) | Abcam | RRID:AB_732609 | IHC (1:200); WB (1:1000) |
| Antibody | PPARα (Rabbit polyclonal) | ThermoFisher Scientific | RRID:AB_2165595 | WB (1:1000) |
| Antibody | β-tubulin (Rabbit polyclonal) | Santa Cruz Biotechnology | RRID:AB_2241191 | WB (1:1000) |
| Antibody | γ-tubulin (Mouse monoclonal) | Sigma-Aldrich | RRID:AB_477584 | WB (1:10000) |
| Recombinant DNA reagent | rtTA (plasmid) | Produced at EPFL | ||
| Recombinant DNA reagent | Lenti.PGK-Cre (Viral construct) | Produced at EPFL | ||
| Recombinant DNA reagent | Lenti.TRE-PPARαΔ13_ PGK-Cre (Viral construct) | Produced at EPFL | Cloned from PPARαΔ13 plasmid (L. Michalik, UNIL, Lausanne) | |
| Recombinant DNA reagent | Ade5.SPC-Cre (Viral construct) | University of Iowa Viral Vector Core Facility | Ade5. SPC-Cre | |
| Recombinant DNA reagent | Ade5.CC10-Cre (Viral construct) | University of Iowa Viral Vector Core Facility | Ade5. CC10-Cre | |
| Sequence-based reagent | Rpl30 (M. musculus) | ThermoFisher Scientific | Mm01611464_g1 Cat# 4331182 | Taqman probe (Housekeeping gene) |
| Sequence-based reagent | Slc2a1 (M. musculus) | ThermoFisher Scientific | Mm00441480_m1 Cat# 4331182 | Taqman probe |
| Sequence-based reagent | Slc2a2 (M. musculus) | ThermoFisher Scientific | Mm00446229_m1 Cat# 4331182 | Taqman probe |
| Sequence-based reagent | Slc2a3 (M. musculus) | ThermoFisher Scientific | Mm00441483_m1 Cat# 4331182 | Taqman probe |
| Sequence-based reagent | Slc2a4 (M. musculus) | ThermoFisher Scientific | Mm00436615_m1 Cat# 4331182 | Taqman probe |
| Sequence-based reagent | Slc2a5 (M. musculus) | ThermoFisher Scientific | Mm00600311_m1 Cat# 4331182 | Taqman probe |
| Sequence-based reagent | Slc2a6 (M. musculus) | ThermoFisher Scientific | Mm00554217_m1 Cat# 4331182 | Taqman probe |
| Sequence-based reagent | Slc2a7 (M. musculus) | ThermoFisher Scientific | Mm01260610_m1 Cat# 4331182 | Taqman probe |
| Sequence-based reagent | Slc2a8 (M. musculus) | ThermoFisher Scientific | Mm00444634_m1 Cat# 4331182 | Taqman probe |
| Sequence-based reagent | Slc2a9 (M. musculus) | ThermoFisher Scientific | Mm00455122_m1 Cat# 4331182 | Taqman probe |
| Sequence-based reagent | Slc2a10 (M. musculus) | ThermoFisher Scientific | Mm01249519_m1 Cat# 4331182 | Taqman probe |
| Sequence-based reagent | Slc2a12 (M. musculus) | ThermoFisher Scientific | Mm02375931_s1 Cat# 4331182 | Taqman probe |
| Sequence-based reagent | Slc2a13 (M. musculus) | ThermoFisher Scientific | Mm01306489_m1 Cat# 4331182 | Taqman probe |
| Sequence-based reagent | Slc5a2 (Sglt2) (M. musculus) | ThermoFisher Scientific | Mm00453831_m1 Cat# 4331182 | Taqman probe |
| Sequence-based reagent | Slc50a1 (Sweet) (M. musculus) | ThermoFisher Scientific | Mm00485707_m1 Cat# 4331182 | Taqman probe |
| Commercial assay or kit | CD45 microbeads | Miltenyi Biotec | 130-052-301 | CD45 magnetic cell sorting |
| Chemical compound, drug | Doxycycline diet (dox) | Kliba Nafag | 3242 diet + DOX 0.625 g kg−1 | 625 mg kg−1 |
| Chemical compound, drug | Doxycycline (dox) | Sigma-Aldrich | D9891 | 2 μg ml−1 |
| Software, algorithm | Analyze 12.0 | PerkinElmer | Analyze 12.0 | Tumor volume analysis |
| Software, algorithm | OsiriX MD | Pixmeo | RRID:SCR_013618 | Tumor volume analysis |
| Software, algorithm | QuPath | QuPath | RRID:SCR_018257 DOI: https://doi.org/10.1038/s41598-017-17204-5 |
Table 1
References of the siRNAs used for in vitro experiments.
| siRNA | Mixes of | Species | Supplier | References |
|---|---|---|---|---|
| siCTR | siCTR | Human and Mouse | Invitrogen | Cat# 4390843 |
| siSLC2A1 | siSLC2A1#1 | Human | ThermoFisher Scientific | s12926 Cat# 4390824 |
| siSLC2A1#2 | Human | ThermoFisher Scientific | s12927 Cat# 4390824 | |
| siCTR | Human and Mouse | Invitrogen | 4390843 | |
| siSLC2A3 | siSLC2A3#1 | Human | ThermoFisher Scientific | s12931 Cat# 4390824 |
| siSLC2A3#2 | Human | ThermoFisher Scientific | s12932 Cat# 4390824 | |
| siCTR | Human and Mouse | Invitrogen | Cat# 4390843 | |
| siSLC2A1 + siSLC2A3 | siSLC2A1#1 | Human | ThermoFisher Scientific | s12926 Cat# 4390824 |
| siSLC2A1#2 | Human | ThermoFisher Scientific | s12927 Cat# 4390824 | |
| siSLC2A3#1 | Human | ThermoFisher Scientific | s12931 Cat# 4390824 | |
| siSLC2A3#2 | Human | ThermoFisher Scientific | s12932 Cat# 4390824 |
Author response table 1
Detailed conclusions of the cell line authentication.
| Sample name | Organism | Conclusion |
|---|---|---|
| A549 | Human | According to our analysis of the submitted sample there is no detectable contamination with human origin. The analyzed data of the submitted sample match 100% to the DNA profile of the cell line A549 (ATCC CRM-CCL-185TM) and 100% over all 15 autosomal STRs to Microsynth’s reference DNA profile of A549 (Mic_150733). |
| Calu-6 | Human | According to our analysis of the submitted sample there is no detectable contamination with human origin. The analyzed data of the submitted sample match 100% to the DNA profile of the cell line Calu-6 (ATCC HTB-56TM) and 100% over all 15 autosomal STRs to the DNA profile of Calu-6 (Cellosaurus, RRID:CVCL_0236). |
| H460 | Human | According to our analysis of the submitted sample there is no detectable contamination with human origin. The analyzed data of the submitted sample match 100% to the DNA profile of the cell line NCI-H460 [H460] (ATCC HTB-177TM) and 100% over all 15 autosomal STRs to the DNA profile of NCI-H460 (Cellosaurus, RRID:CVCL_0459). |
| SW 1573 | Human | According to our analysis of the submitted sample there is no detectable contamination with human origin. The analyzed data of the submitted sample match 93.3% to the DNA profile of the cell line SW 1573 [SW-1573, SW1573] (ATCC CRL-2170TM) and 93.1% over all 15 autosomal STRs to the DNA profile of SW 1573 (Cellosaurus, RRID:CVCL_1720). Cell line samples matching at ≥ 80% of alleles across the eight core reference loci are said to be related. |
Author response table 2
References of the siRNAs used for in vitro experiments.
| siRNA | Mixes of | Species | Supplier | References |
|---|---|---|---|---|
| siCTR | siCTR | Human and Mouse | Invitrogen | 4390843 |
| siGLUT1 | siGLUT1#1 | Human | ThermoFisher Scientific | s12926 |
| siGLUT1#2 | Human | ThermoFisher Scientific | s12927 | |
| siCTR | Human and Mouse | Invitrogen | 4390843 | |
| siGLUT3 | siGLUT3#1 | Human | ThermoFisher Scientific | s12931 |
| siGLUT3#2 | Human | ThermoFisher Scientific | s12932 | |
| siCTR | Human and Mouse | Invitrogen | 4390843 | |
| siGLUT1 + siGLUT3 | siGLUT1#1 | Human | ThermoFisher Scientific | s12926 |
| siGLUT1#2 | Human | ThermoFisher Scientific | s12927 | |
| siGLUT3#1 | Human | ThermoFisher Scientific | s12931 | |
| siGLUT3#2 | Human | ThermoFisher Scientific | s12932 |
Additional files
Download links
A two-part list of links to download the article, or parts of the article, in various formats.
Downloads (link to download the article as PDF)
Open citations (links to open the citations from this article in various online reference manager services)
Cite this article (links to download the citations from this article in formats compatible with various reference manager tools)
Combined deletion of Glut1 and Glut3 impairs lung adenocarcinoma growth
eLife 9:e53618.
https://doi.org/10.7554/eLife.53618


