Post-acute COVID-19 associated with evidence of bystander T-cell activation and a recurring antibiotic-resistant bacterial pneumonia
- School of Cellular and Molecular Medicine, University of Bristol, United Kingdom
- North Bristol NHS Trust, United Kingdom
- Bristol Veterinary School in the Faculty of Health Sciences, United Kingdom
- Department of Infectious Disease, Imperial College London, United Kingdom
- Lung Division, Royal Brompton & Harefield NHS Foundation Trust, United Kingdom
- Institute of Microbiology and Infection, University of Birmingham, United Kingdom
Figures
Figure 1 with 1 supplement
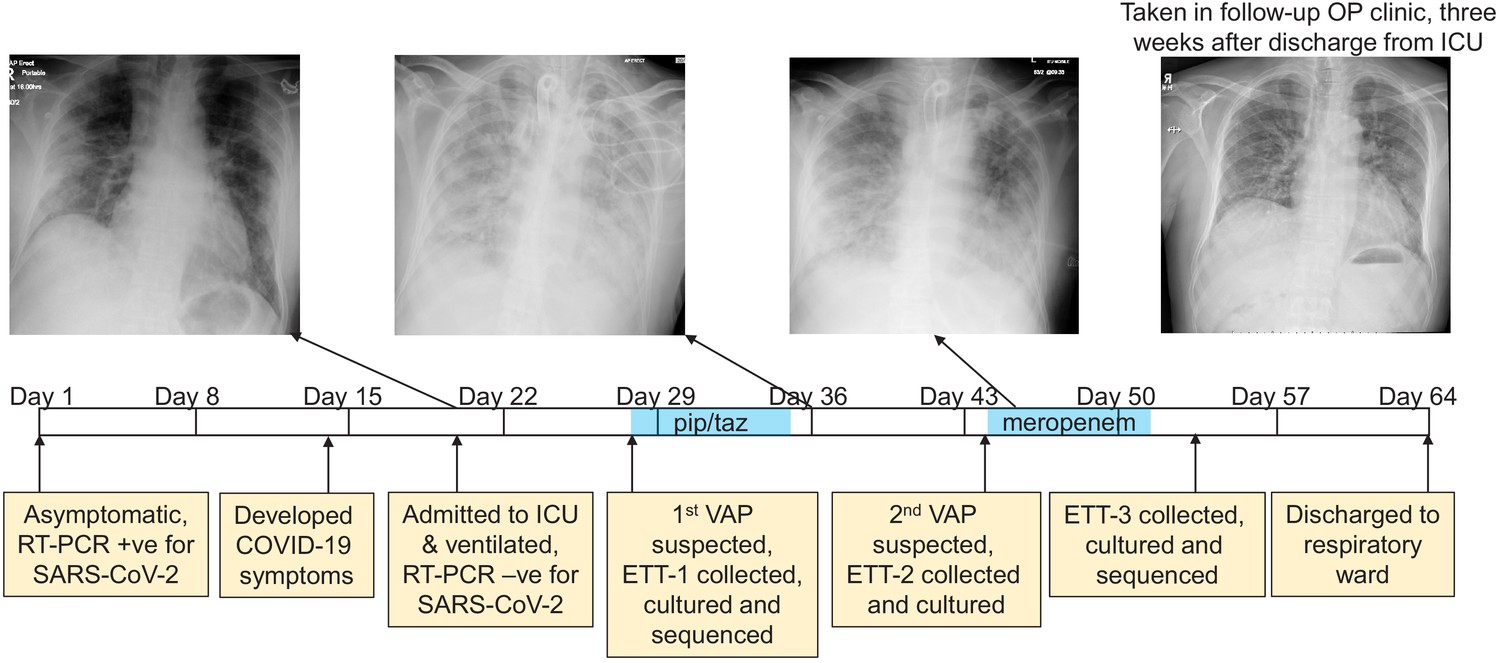
The development of a recurring ventilator-associated pneumonia (VAP) by a COVID-19 patient.
A clinical time-line is presented from the point at which the patient tested positive for SARS-CoV-2 (day 1), through to his discharge from the ICU (day 64). Noteworthy clinical features are indicated in the yellow boxes below the time-line. The three x-rays taken during the patient’s time in the ICU are presented, as is a later follow-up x-ray taken in an out-patient (OP) clinic 3 weeks after discharge. The time during which the antibiotics piperacillin and tazobactam (pip/taz) and meropenem were administered to the patient to treat the VAP are indicated in blue. The points at which endotracheal tube aspirates (ETT) were collected and the subsequent analysis of these also are indicated and described.
Figure 1—figure supplement 1
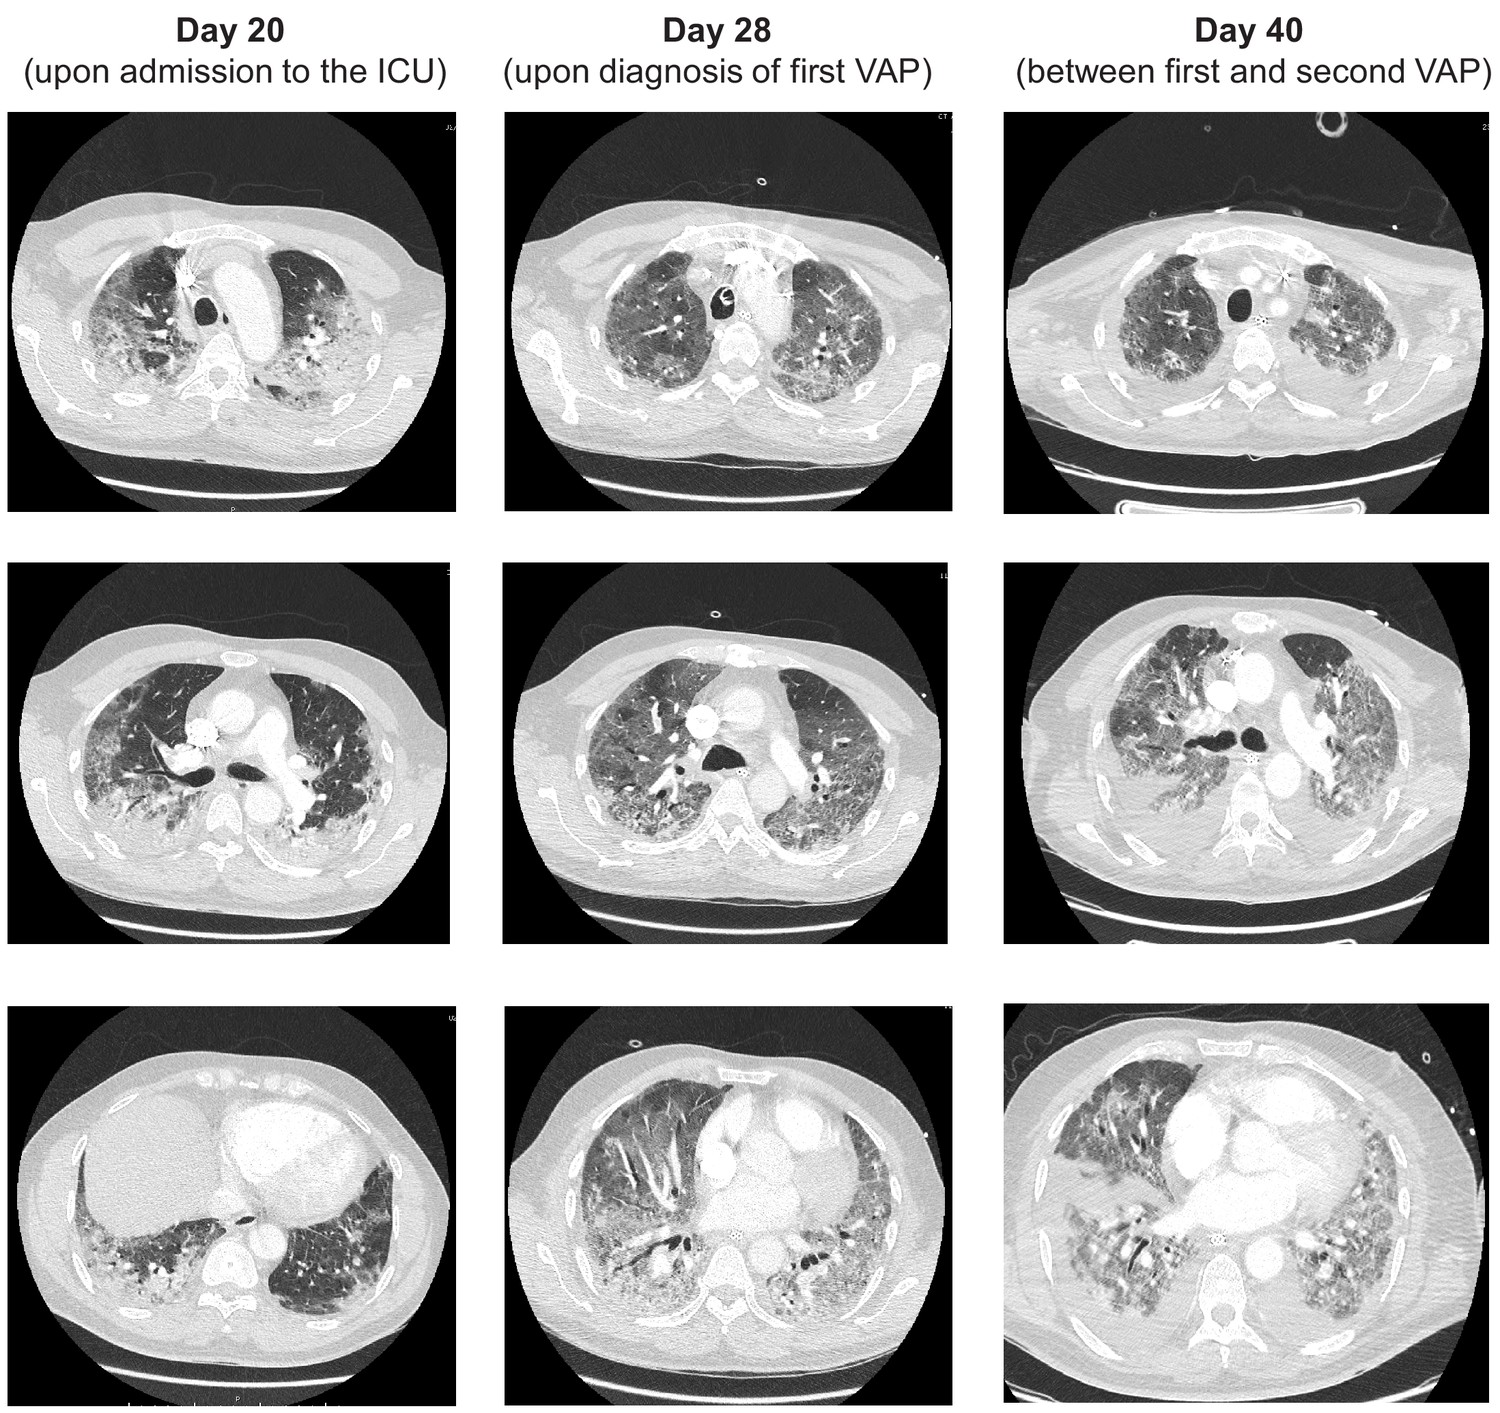
CT scans of the patient at three time points during his stay in the ICU, Days 20, 28 and 40.
Features associated with COVID-19 including ground glass opacities are evident throughout. Three separate axial slices from each time point are provided.
Figure 2

Direct metagenomic analysis of respiratory samples from a COVID-19 patient who developed a recurring VAP.
(a) The sequence data were aligned to the genome of a P. aeruginosa reference strain PA14 (inner ring). The P. aeruginosa genomes from both ETT-1 (middle ring) and ETT-3 (outer ring) had 99% identify to the PA14 reference genome and greater than 99% to each other. The position of the AMR conferring SNPs in the P. aeruginosa from ETT-3 are indicated by red arrows. (b) Assembled contigs were taxonomically classified using Kraken two with % of total contigs assigned to each species shown for ETT-1 and ETT-3. Species with only one contig (0.68% of total contigs) were grouped as ‘other’.
Figure 3 with 3 supplements
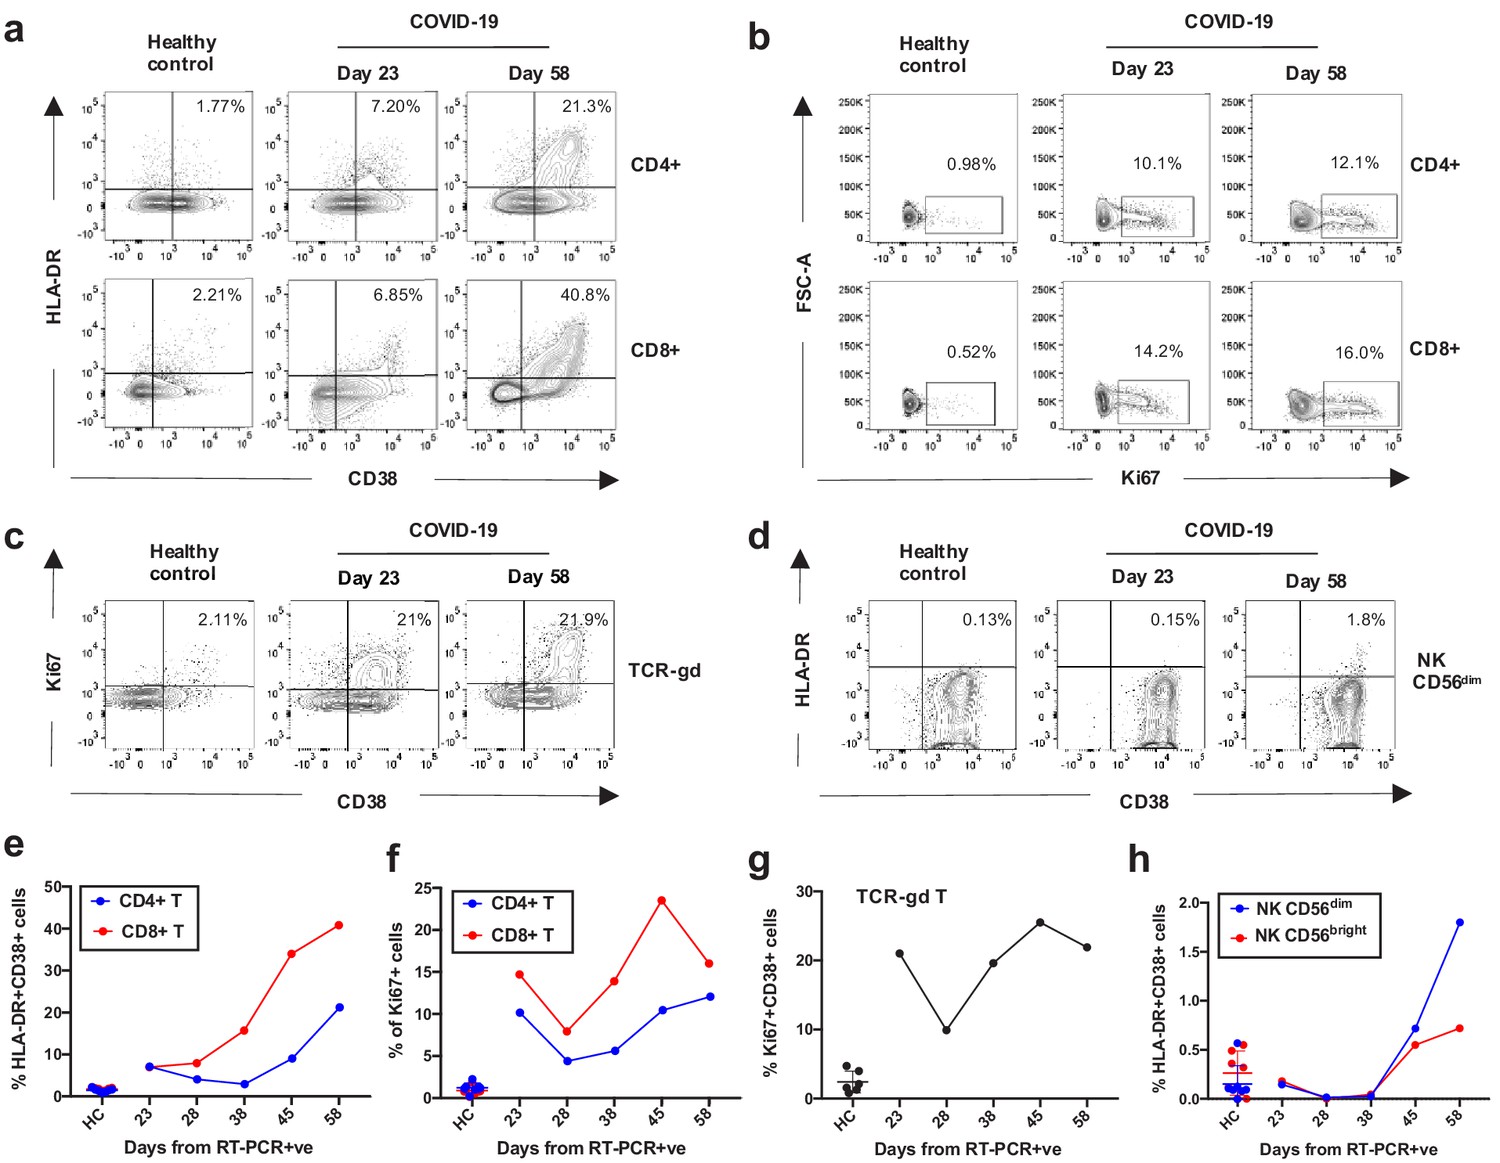
Kinetics of the adaptive and innate immune response in a COVID-19 patient during ICU treatment.
(a–d) Representative flow cytometry plots showing the expression of activation and proliferation markers on CD4+ and CD8+ T cells (top and bottom panels, respectively in a, b), TCR-γδ T cells (c) and NK cells (d: plots shown for NK CD56dim cells) in a healthy control and the COVID-19 patient (at days 23 and 58). (e-f) Immune activation and proliferation levels are summarized for healthy controls (HC, n = 7) and five longitudinal time points of the COVID-19 patient and are assessed as co-expression of HLA-DR and CD38 (e) and expression of Ki67 (f) in CD4+ and CD8+ T cells, co-expression of CD38 and Ki67 by TCR-γδ T cells (g), and co-expression of HLA-DR and CD38 in NK CD56dim cells (h). Gating strategies for each population are included in Figure 3—figure supplement 1. All data is obtained by flow cytometry and samples were acquired on a Becton Dickinson LSR Fortessa X-20.
Figure 3—figure supplement 1
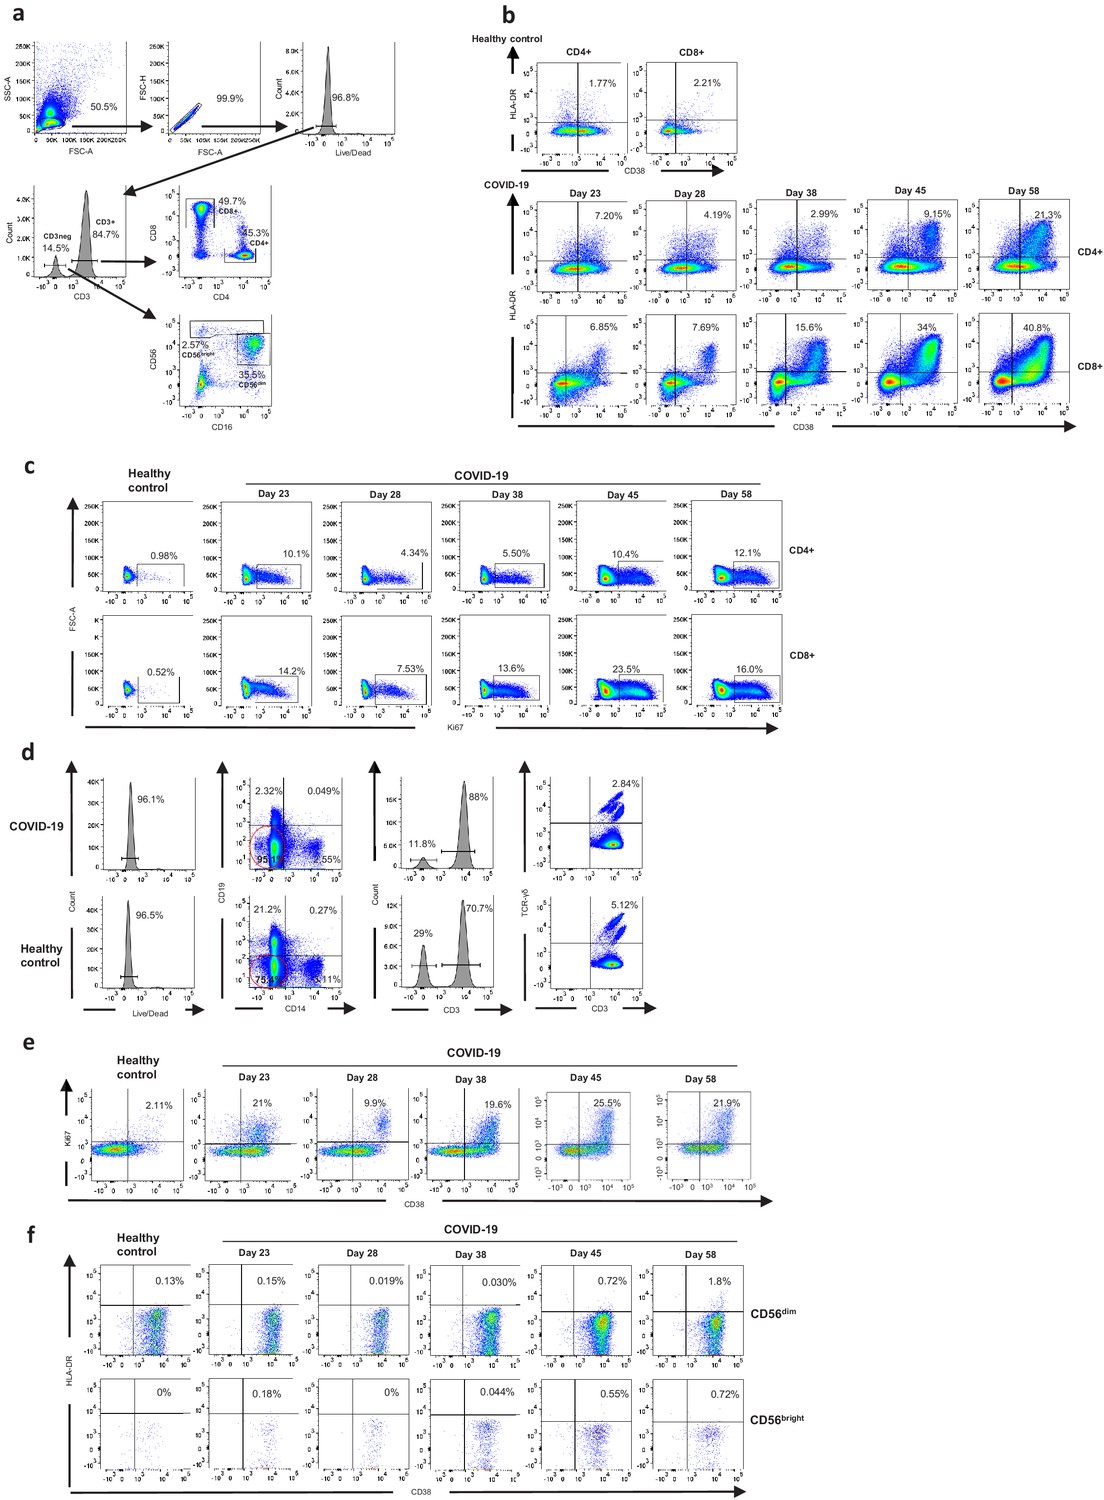
The gating strategies and flow cytometry plots are shown for each immune population.
(a) T and NK cell populations; (b–c) T cell activation and proliferation markers; (d) TCR-γδ T cells; (e) TCR-γδ activation and proliferation markers; (f) NK CD56dim and CD56bright cell activation markers.
Figure 3—figure supplement 2
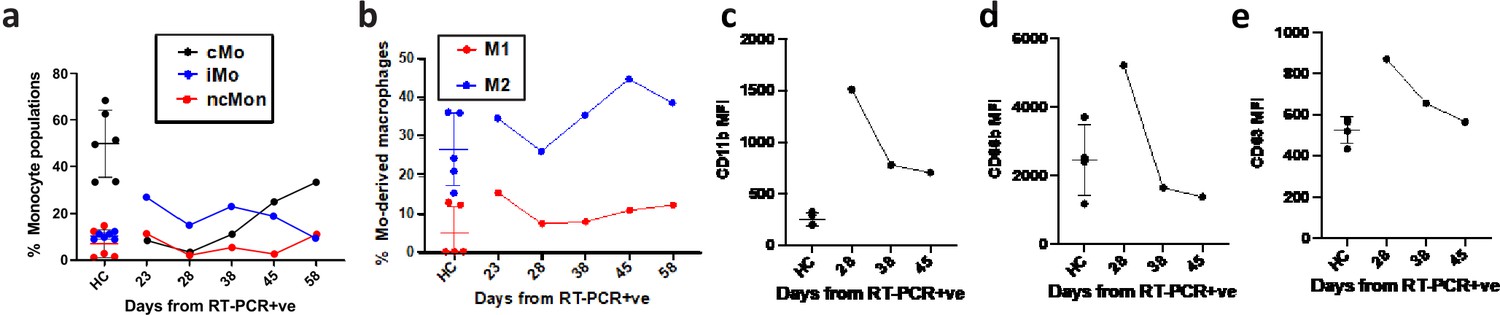
Kinetics of the innate immune response in the COVID-19 patient.
(a) Percentages of CD14+ CD16- classical monocytes (cMo), CD14+ CD16+ intermediate monocytes (iMo) and CD14- CD16+ non classical monocyes (ncMo). Percentages are calculated in live, CD3-, CD66b-, HLA-DR+ cells in the COVID-19 patient and in healthy controls (n = 6). (b) Percentages of blood monocyte-derived M1 (CD14+ CD80+ CD68+) and M2 (CD14+ CD163+ CD68+) macrophages are shown for the COVID-19 patient and healthy controls. (c–e) Neutrophil degranulation measured as MFI of CD11b (secretory vesicles), CD66b (secondary granules) and CD63 (primary granules) is shown for the patient and healthy controls (n = 4). Neutrophils were immunostained in whole blood, followed by erythrocyte lysis with ACK buffer and fixation with 4% PFA prior for analysis by flow cytometry. Blood monocytes and monocyte-derived macrophages were stained from PBMCs isolated by Ficoll gradient as described in the methods section.
Figure 3—figure supplement 3
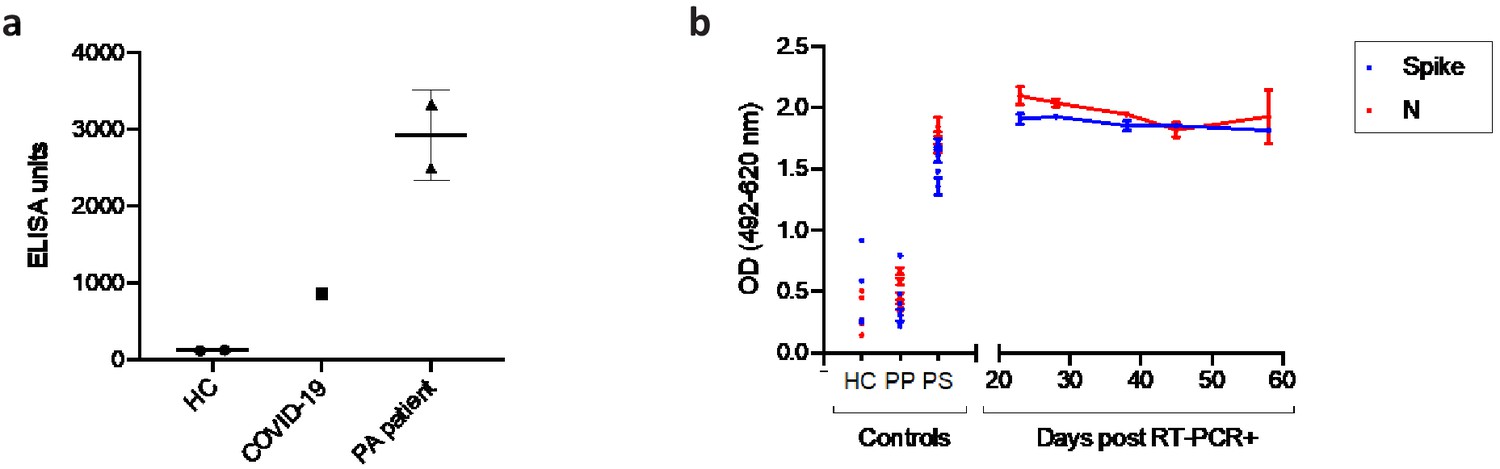
Antibody response towards Pseudomonas aeruginosa and SARS-CoV-2.
(a) Serum IgG response to Pseudomonas aeruginosa (PA) protein outer membrane porin F (OprF) was assessed in healthy controls (n = 2), in the COVID-19 patient (n = 1) and in patients with diagnosis of Cystic Fibrosis and PA infection in the lung (PA patient, n = 2). Data are presented as mean ± SD. (b) Plasma IgG responses to SARS-CoV-2 Spike and N were assessed in the COVID-19 patient at five timepoints. For reference we also show levels from serum of healthy control donors (HC; n = 5), healthy pre-pandemic control donors (PP; n = 6) and a pooled serum (PS; n = 3) control per plate (collected from 3 RT-PCR-confirmed convalescent donors). The optical density (OD) at 492 nm was corrected for background (620 nm) and for the blank values. Data are presented as mean ± SD.
Figure 4 with 1 supplement

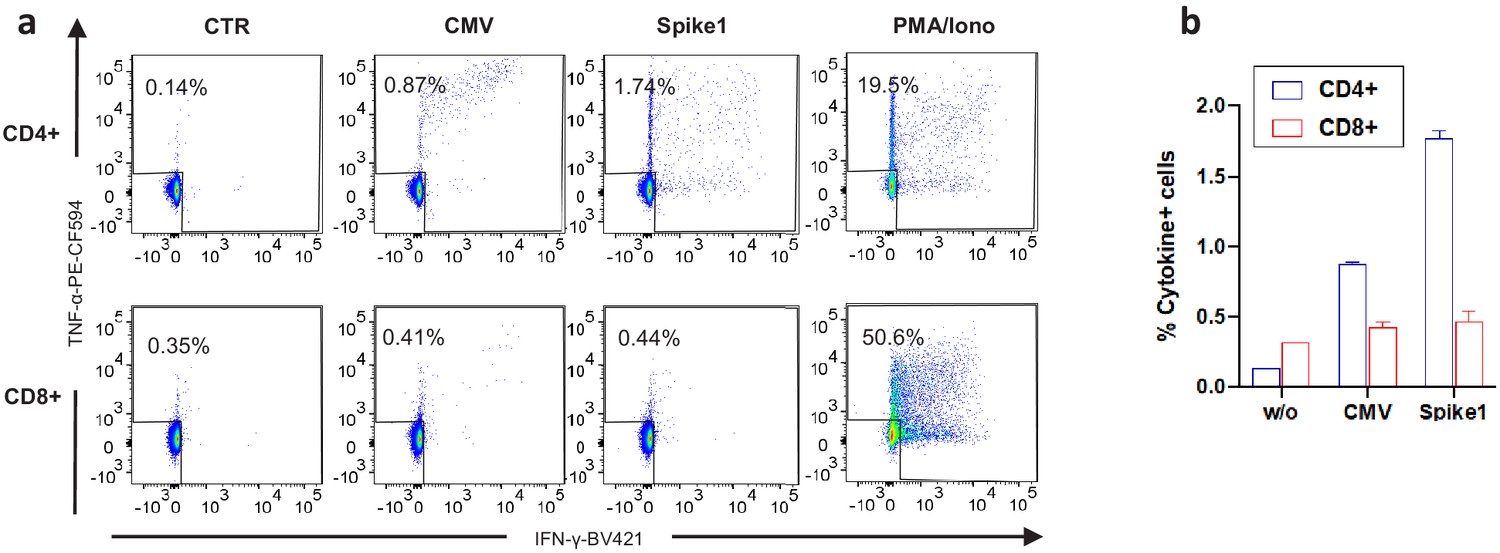
Frequency and phenotype of antigen-specific T cells.
(a) Representative flow cytometry plots showing IFN-γ and TNF-α production by CD4+ and CD8+ T cells from the COVID-19 patient (day 23) as assessed by intracellular cytokine staining after a brief stimulation of PBMCs with HCMV pp65 (CMV), SARS-CoV-2 membrane, nucleoprotein (M/N respectively), spike 1, spike 2, and Pseudomonas aeruginosa OprF (PA) peptides. PMA/ionomycin and unstimulated conditions represent positive and negative controls. (b-c) Summarized are T-cell responses shown as % of IFN-γ and/or TNF-α+ cells in CD4+ or CD8+ T cells after subtraction of the negative controls in the COVID-19 patient at three longitudinal time points and in an age-matched healthy control (spike and M/N). (d-f) Representative flow cytometry plots showing T-cell expression of activation, proliferation and memory markers in CMV-specific and spike1-specific T cells in the COVID-19 patient (day 38), as assessed after a brief stimulation of PBMCs with CMV or spike 1 peptides followed by staining with antibodies targeting the relevant markers. Plots are gated on cytokine-producing cells (TNF-α and/or IFN-γ) in CD4+ or CD8+ T cells (top and bottom panels, respectively). (g-h) T-cell activation and proliferation assessed as co-expression of HLA-DR and CD38, and expression of Ki67 are shown for CD4+ and CD8+ CMV and spike 1-specific T cells (g and h, respectively). (i-j) Percentage of CMV and spike 1-specific T cells contained within each subset identified by expression of CCR7 and CD45RA is shown for CD4+ and CD8+ T cells (i and j, respectively). Naïve: CCR7+CD45RA+; central memory (TCM): CCR7+CD45RA-; T effector memory (TEM):CCR7-CD45RA- and T effector memory RA re-expressing (TEMRA): CCR7-CD45RA+. Columns represent mean +/- SD of the experimental duplicates. All data is obtained by flow cytometry and samples were acquired on a Becton Dickinson LSR Fortessa X-20.
Figure 4—figure supplement 1
Experimental duplicates of intracellular cytokine staining data.
(a) Representative flow cytometry plots showing IFN-γ and TNF-α production by CD4+ and CD8+ T cells from the COVID-19 patient (day 38) as assessed by intracellular cytokine staining after a brief stimulation of PBMCs with or without HCMV pp65 (CMV), SARS-CoV-2 spike 1 and PMA/ionomycin as a positive control. All conditions except for PMA/ionomycin were performed in duplicate wells. (b) Graph showing the average and standard deviation values for the duplicate wells in experiment shown in a. % Cytokine positive cells refers to the % of IFN-γ and/or TNF-α production by CD4+ or CD8+ T cells following stimulation with or without the indicated peptides.
Additional files
-
Supplementary file 1
Details of the antibodies used for the flow cytometry experiments.
- https://cdn.elifesciences.org/articles/63430/elife-63430-supp1-v2.pdf
-
Transparent reporting form
- https://cdn.elifesciences.org/articles/63430/elife-63430-transrepform-v2.docx
Download links
A two-part list of links to download the article, or parts of the article, in various formats.
Downloads (link to download the article as PDF)
Open citations (links to open the citations from this article in various online reference manager services)
Cite this article (links to download the citations from this article in formats compatible with various reference manager tools)
Post-acute COVID-19 associated with evidence of bystander T-cell activation and a recurring antibiotic-resistant bacterial pneumonia
eLife 9:e63430.
https://doi.org/10.7554/eLife.63430


