Dynamic persistence of UPEC intracellular bacterial communities in a human bladder-chip model of urinary tract infection
- School of Life Sciences, Swiss Federal Institute of Technology in Lausanne (EPFL), Switzerland
Figures
Figure 1 with 3 supplements

Human Bladder-chip model of UTI recapitulates the physiology of bladder filling and voiding.
(A) Schematic of the human bladder-chip with co-culture of the 5637 human bladder epithelial cell line (epithelium, top) and primary human bladder microvascular endothelial cells (endothelial, bottom) on either side of the stretchable and porous membrane. Pooled human urine diluted in PBS and endothelial cell medium were perfused in the apical and vascular channels respectively to mimic bladder physiology. A negative pressure in the ‘vacuum’ channels (magenta) on either side of the main channel was applied to stretch the porous membrane to mimic stretching of the bladder. (B, C) Immunofluorescence staining of confluent epithelial and endothelial cell monolayers (anti-EpCAM (magenta) and anti-CK7 (yellow) for the epithelial cells and anti-PECAM-1 (green) for the endothelial cells) in an uninfected control chip. Some endothelial cells also stained positive for CK7. Cell nuclei were labeled with DAPI (azure). (D) Schematic of the reconstitution of the bladder filling and voiding cycle via stretching of the membrane with a duty cycle of 6 hr. The cycle consisted of a linear increase in strain through stretching of the membrane (filling bladder, 0–2 hr), maintenance of the membrane under stretch (filled bladder, 2–4 hr), a quick relaxation of applied strain over 2 min (voiding bladder, 4:02 hr) and maintenance without applied strain (voided bladder, 4:02 hr to 6 hr). (E) An overview of the timeline of the experimental protocol including infection, addition of neutrophils via the vascular channel, and two cycles of antibiotic treatment interspersed by two bacterial growth cycles. The consecutive bladder duty cycles are indicated.
Figure 1—figure supplement 1

Characterization of co-cultures of bladder epithelial cells and bladder endothelial cells in bladder-chip.
Immunofluorescence characterization of 5637 bladder epithelial cells in bladder-chip for Epithelial Cell Adhesion Molecule (EpCAM) (A), cytokeratin 7 (CK7) (B), and cytokeratin 8 (CK8), a marker for differentiated uroepithelial cells (F). Immunofluorescence characterization of primary human bladder microvascular endothelial cells in bladder-chip for tight junction markers such as Platelet Endothelial Cell Adhesion Molecule-1 (PECAM-1) (C) and vascular endothelial cadherin (VE-cadherin) (G). Some endothelial cells also express CK7 (D). Filamentous actin staining for epithelial (E) and endothelial (H) cells. Cell nuclei were labeled with DAPI (azure) in all panels. Scale bars, 50 μm in all panels.
Figure 1—figure supplement 2
Characterization of monocultures of 5637 bladder epithelial cells and HMVEC-Bd bladder microvascular endothelial cells.
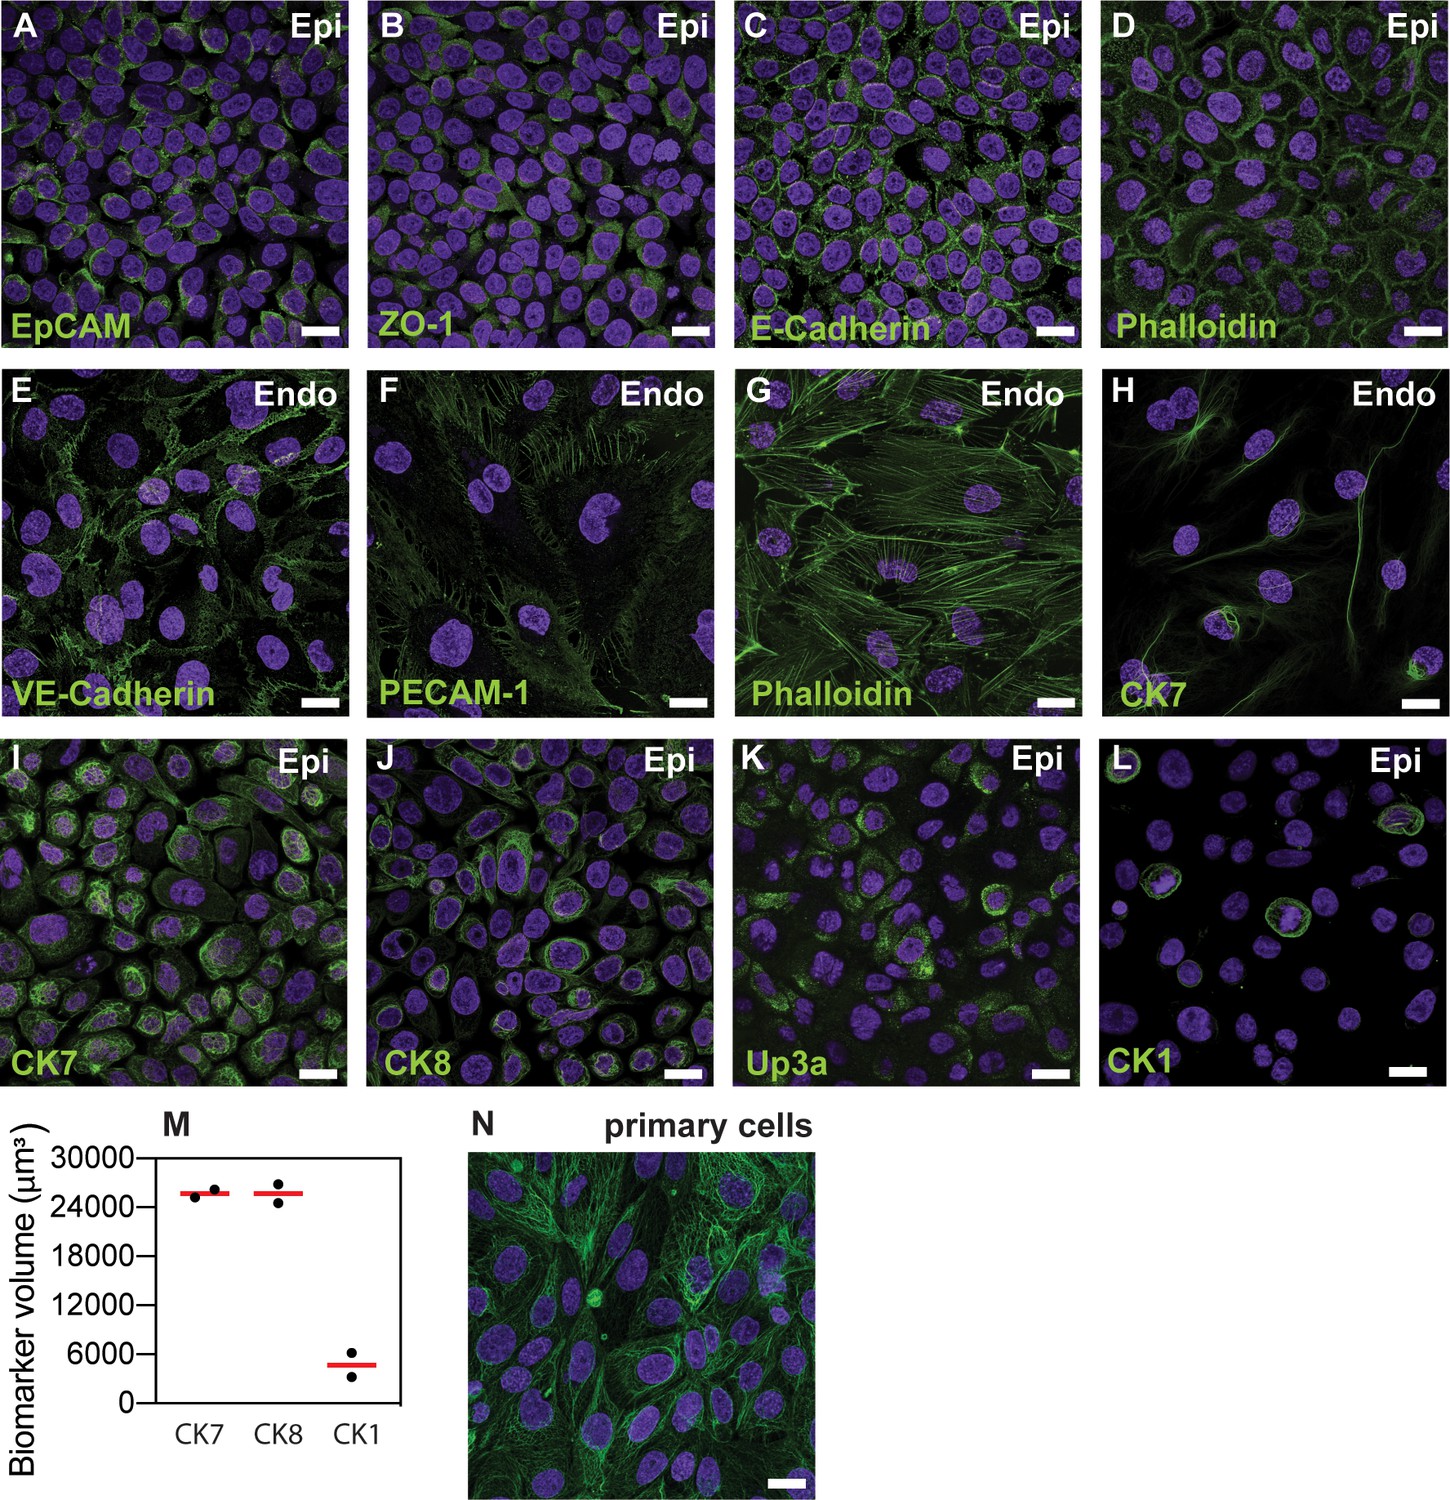
Characterization of the 5637 bladder epithelial cells for epithelial tight junction markers such as Epithelial Cell Adhesion Molecule (EpCAM) (A), Zonula Occludens-1 (ZO-1) (B), epithelial cadherins (E-cadherin) (C), and filamentous actin (Phalloidin) (D). Bladder endothelial cells express tight junction markers such as vascular, Platelet Endothelial Cell Adhesion Molecule-1 (PECAM-1) (E), endothelial cadherin (VE-cadherin) (F) and filamentous actin (Phalloidin) (G). Some endothelial cells also showed staining for CK7 (H). Characterization of the 5637 cells for the uroepithelial cell marker cytokeratin 7 (CK7) (I), for umbrella cell specific markers cytokeratin 8 (CK8) (J) and uroplakin 3a (Up3a) (K), and the basal cell marker cytokeratin 1 (CK1) (L). CK1 expression was sparse and lower than CK7 and CK8, data obtained from two fields of view in an ibidi μ-Slide eight well (M). Red lines represent the median value. Epithelial and endothelial cells were grown to ca. 75–90% confluence in ibidi 8-wells. Cell nuclei were labeled with DAPI (cyan). (N) Characterization of primary bladder epithelial cells for CK8 expression. Cell nuclei were labeled with DAPI (cyan). Scale bars, 10 μm in (A-L, N). Scale bars, 10 μm in (A-L, N).
Figure 1—figure supplement 3
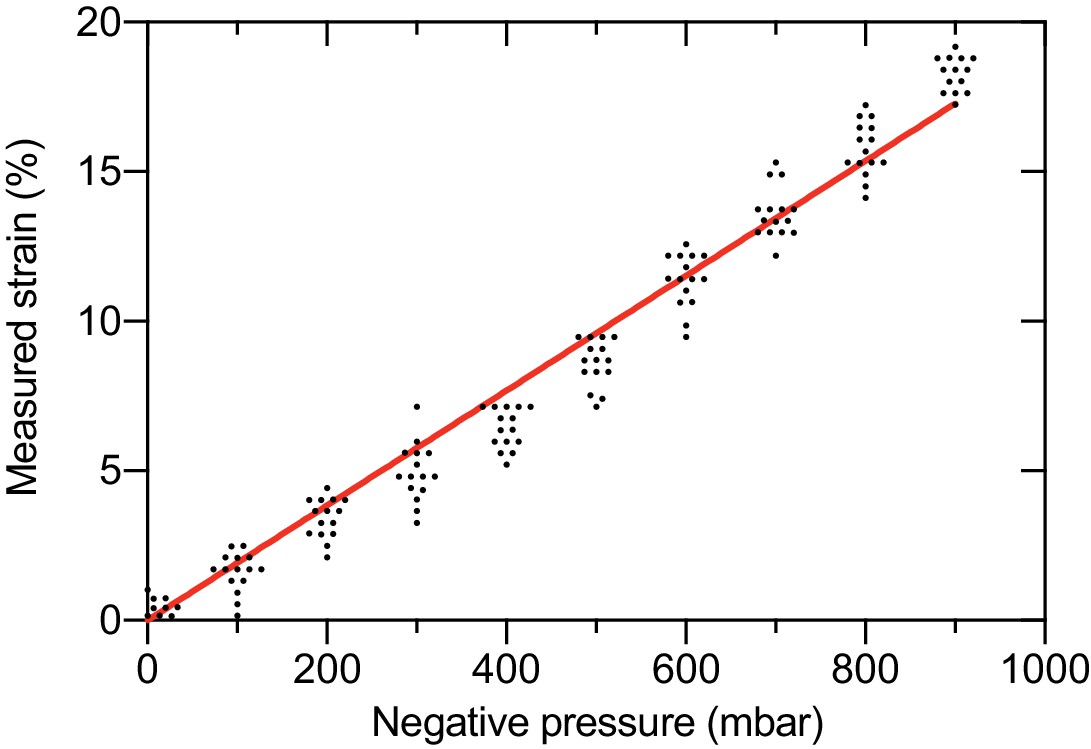
Quantification of the linear strain in the PDMS membrane as a function of applied negative pressure in the vacuum channels of the bladder-chip.
Pore-to-pore distance was measured in the PDMS membrane (n=14) on human bladder chip under different values of applied pressure and used to calculate the linear strain (). and refer to the pore-to-pore distance in the stretched () and relaxed state ().
Figure 2 with 10 supplements
Neutrophil diapedesis and NET formation on-chip.
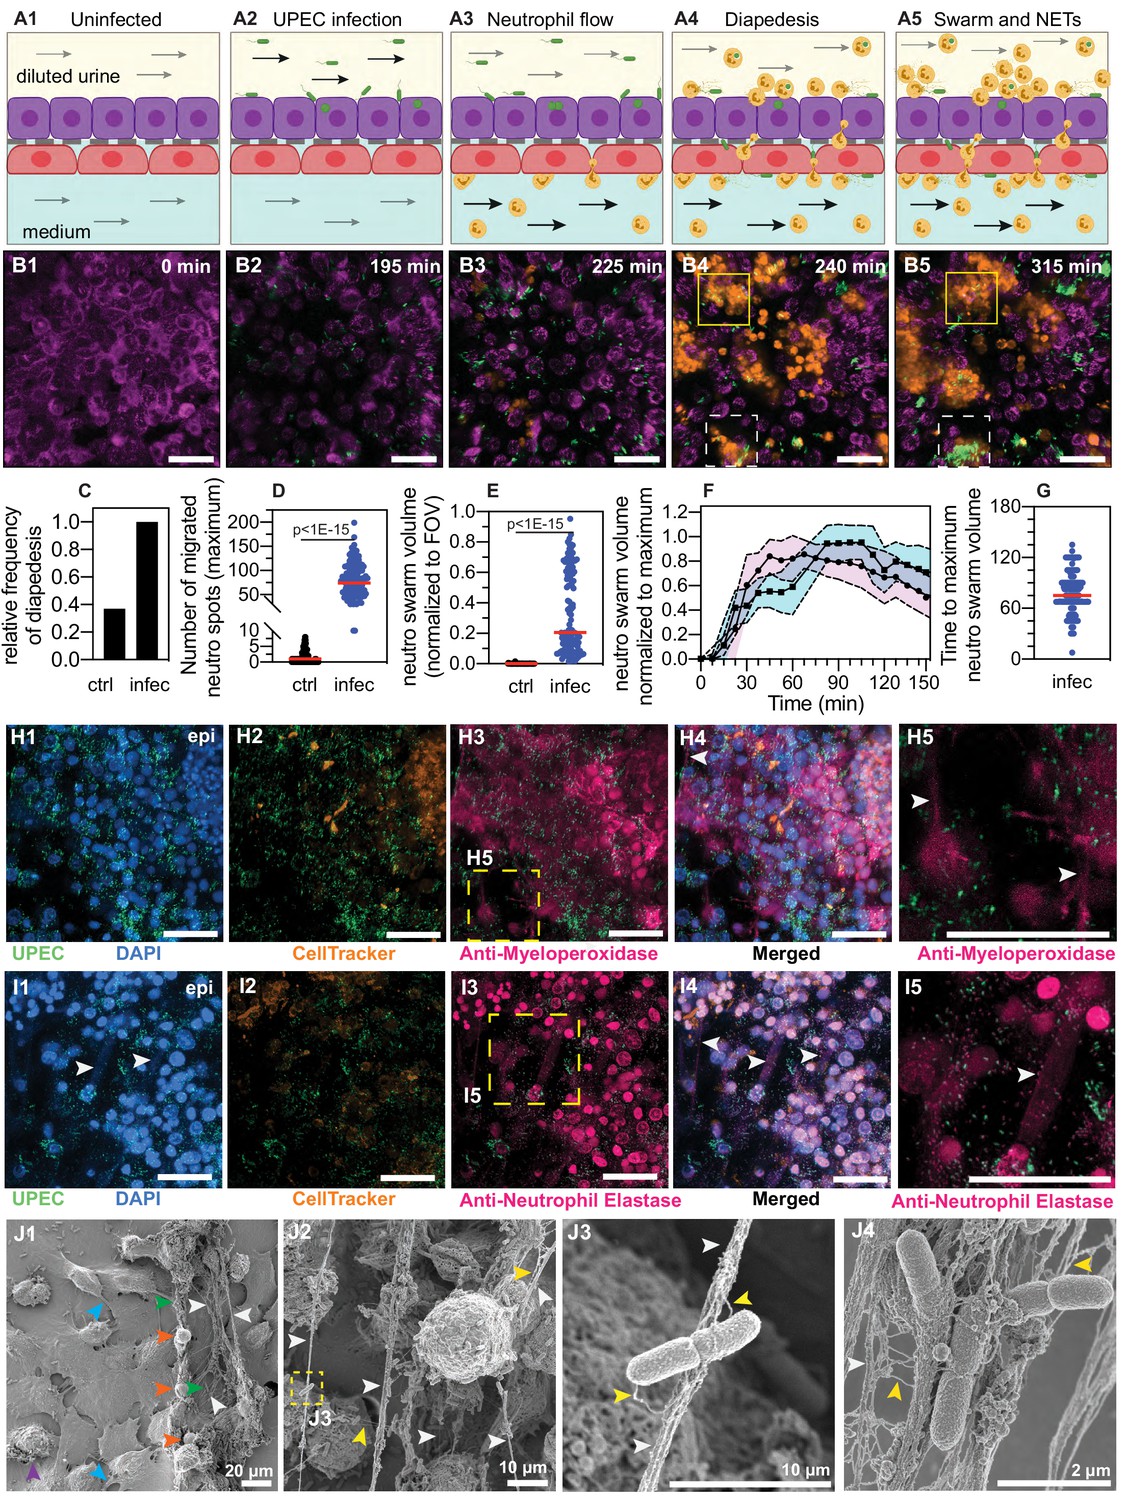
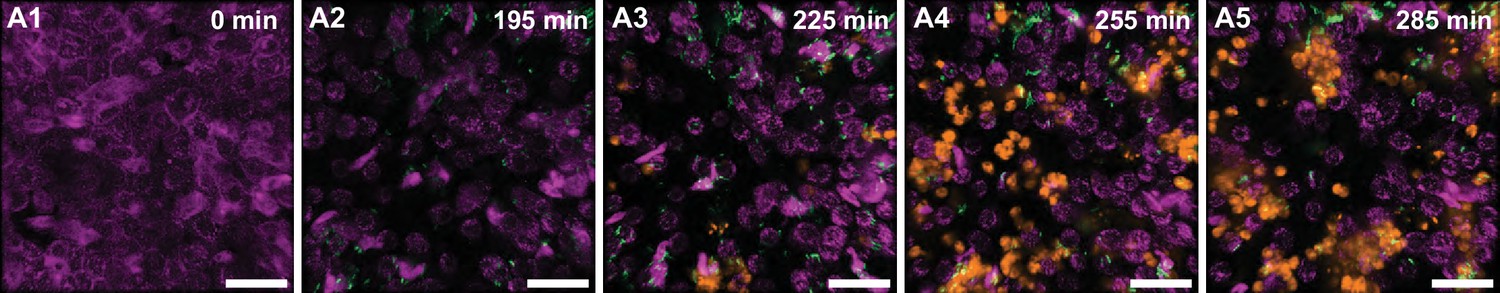
(A1–A5) Schematic of the UPEC infection, introduction of neutrophils and diapedesis of neutrophils across the epithelial-endothelial barrier to sites of infection. Flow in the epithelial and endothelial channels is indicated by arrows; the flow rate was increased upon introduction of neutrophils in the vascular channel to increase attachment. Increased flow rate in the epithelial and endothelial channel is indicated by black arrows. (B1–B5) Snapshots from time-lapse imaging highlighting each stage in the infection cycle shown in (A1–A5). Bladder epithelial cells (magenta) and neutrophils (amber) were identified with membrane (Cell Mask Orange) and cytoplasmic (Cell Tracker Deep Red) dyes, respectively. UPEC identified via constitutive expression of YFP are shown in green. Neutrophil swarms could either control bacterial growth (yellow dashed square, compare B4 vs. B5) or did not manage to restrict bacterial growth (white dashed square, compare B4 vs. B5). (C) Bar charts for relative frequency of neutrophil diapedesis (black) in n=three uninfected control bladder-chips and n=four infected bladder-chips. Data obtained from n=95 and n=116 fields of view, each of which was 206 x 206 μm2. (D) Quantification of the number of neutrophils detected on the epithelial layer, in control and infected bladder-chips. The red bar represents the median value, p<1E-15. In many instances in the uninfected control bladder-chips, no neutrophil diapedesis is detected. Data obtained from n=95 and n=130 fields of view, each of which was 206 x 206 μm2. (E) A plot of the maximum neutrophil swarm volume on the epithelial layer normalized to the total volume for n=67 and n=118 fields of view on n=three uninfected control and n=three infected bladder-chips. The red bar represents the median value. p<1E-15. (F) A plot of neutrophil swarm volume on the epithelial layer over time for n=51 and n=40 fields of view for n=two technical replicates indicated by squares and circles. For each time profile, the volume is normalized to the maximum volume attained over the timeseries and t=0 refers to the timepoint at which neutrophils are introduced into the vascular channel (G) Plot of the time to reach the maximum swarm volume in n=154 fields of view across n=four infected bladder-chips. (H1–H5, I1–I5) NET formation by neutrophils on the epithelial layer. The neutrophils are identified by a cytoplasmic dye (CellTracker Deep Red, false colored in amber) (H2, I2) and immunostaining with an anti-myeloperoxidase antibody (H3, zooms in H5) or an anti-neutrophil elastase antibody (I3, zooms in I5). Merged images in each case are shown in H4 and I4. UPEC identified via YFP expression is shown in spring green. Nuclear labelling with DAPI is shown in azure. (H5) NETs, identified via anti-myeloperoxidase staining or anti-elastase staining are indicated with white arrows in (H5) and (I5), respectively. (J1–J4) Scanning electron micrographs of the epithelial layer of an infected bladder-chip 2 hr after the introduction of neutrophils in the endothelial channel. (J1) Neutrophils (amber arrowheads) are visible above a layer of epithelial cells. Thick bundles consisting of many thinner NET structures between neutrophils are indicated by white arrowheads, and examples of individual UPEC bacteria within the NETs are indicated by green arrowheads. A heavily infected epithelial cell with UPEC visible on the epithelial cell (purple arrowhead), and appendages between epithelial cells (cyan arrowheads) are also visible. (J2) Micrographs showing thick bundles consisting of many thinner NET structures (white arrowheads) that extend between cells and trap many individual bacteria. Thinner NET fibers (yellow arrowheads) are also visible. (J3) Zooms of the regions in J2 identified by a yellow dashed square. Two bacteria held by a thick bundle composed of many thinner NET fibers are shown. (J4) Micrograph highlighting multiple bacteria trapped between NET bundles. p-Values in D and E were calculated using a Mann-Whitney test. Scale bar = 50 μm in B1–B5, H1-H5, I1-I5.
Figure 2—figure supplement 1
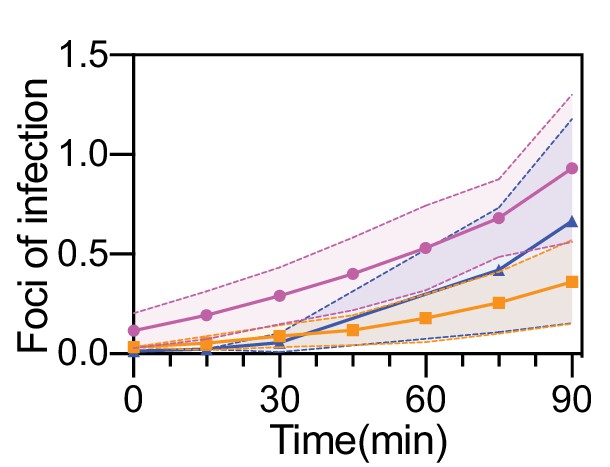
Quantification of UPEC attachment to bladder epithelial cells on-chip under flow.
Ratio of number of attached UPEC to the average number of epithelial cells in n=25 (magenta line), n=38 (orange line), and n=34 (blue line) fields of view, each 206 x 206 μm2 across on the epithelial layer of n=three infected bladder-chips. In each case, the protocol results in less than 1 focus of infection per epithelial cell at the end of the 90 min infection period. The dotted lines and the shaded regions represent the standard deviation.
Figure 2—figure supplement 2
Timeseries highlighting neutrophil diapedesis and swarm formation.
Additional images that highlight the diapedesis of neutrophils across the epithelial-endothelial barrier and the formation of neutrophil swarms. Bladder epithelial cells (magenta) and neutrophils (amber) were identified with membrane (Cell Mask Orange) and cytoplasmic (Cell Tracker Deep Red) dyes, respectively. UPEC identified via constitutive expression of YFP are shown in green. In all images, scale bar = 50 μm.
Figure 2—figure supplement 3
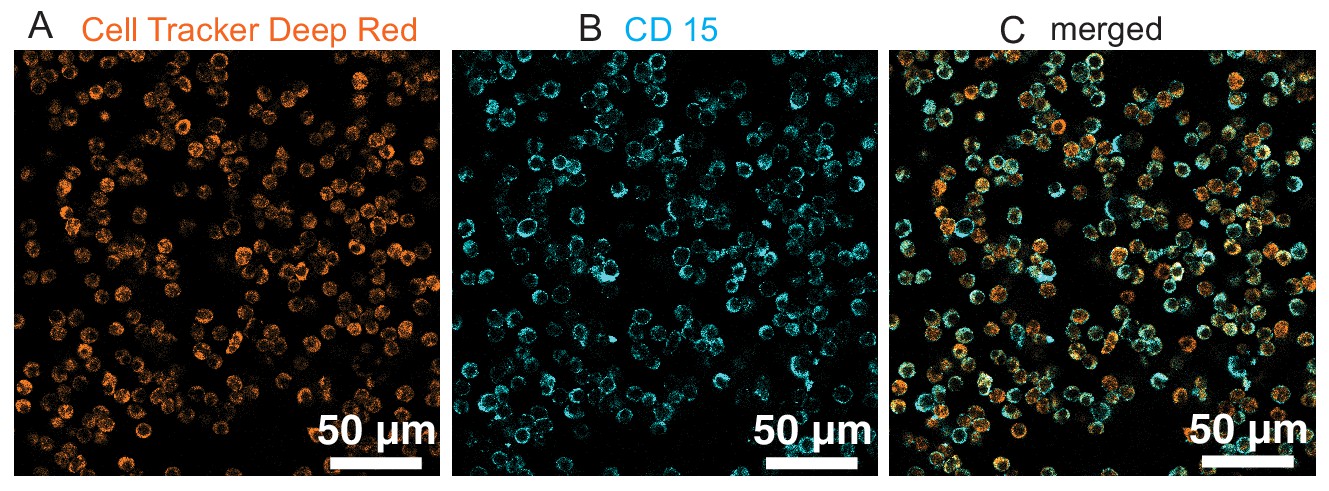
Neutrophils isolated from human blood are CD15+.
Images of neutrophils isolated via negative depletion from human blood and labelled with a cytoplasmic dye (Cell Tracker Deep Red) (A) and immunostained with an anti-CD15 antibody (B). (C) Merged image for both channels confirms that all neutrophils are CD15+.
Figure 2—figure supplement 4
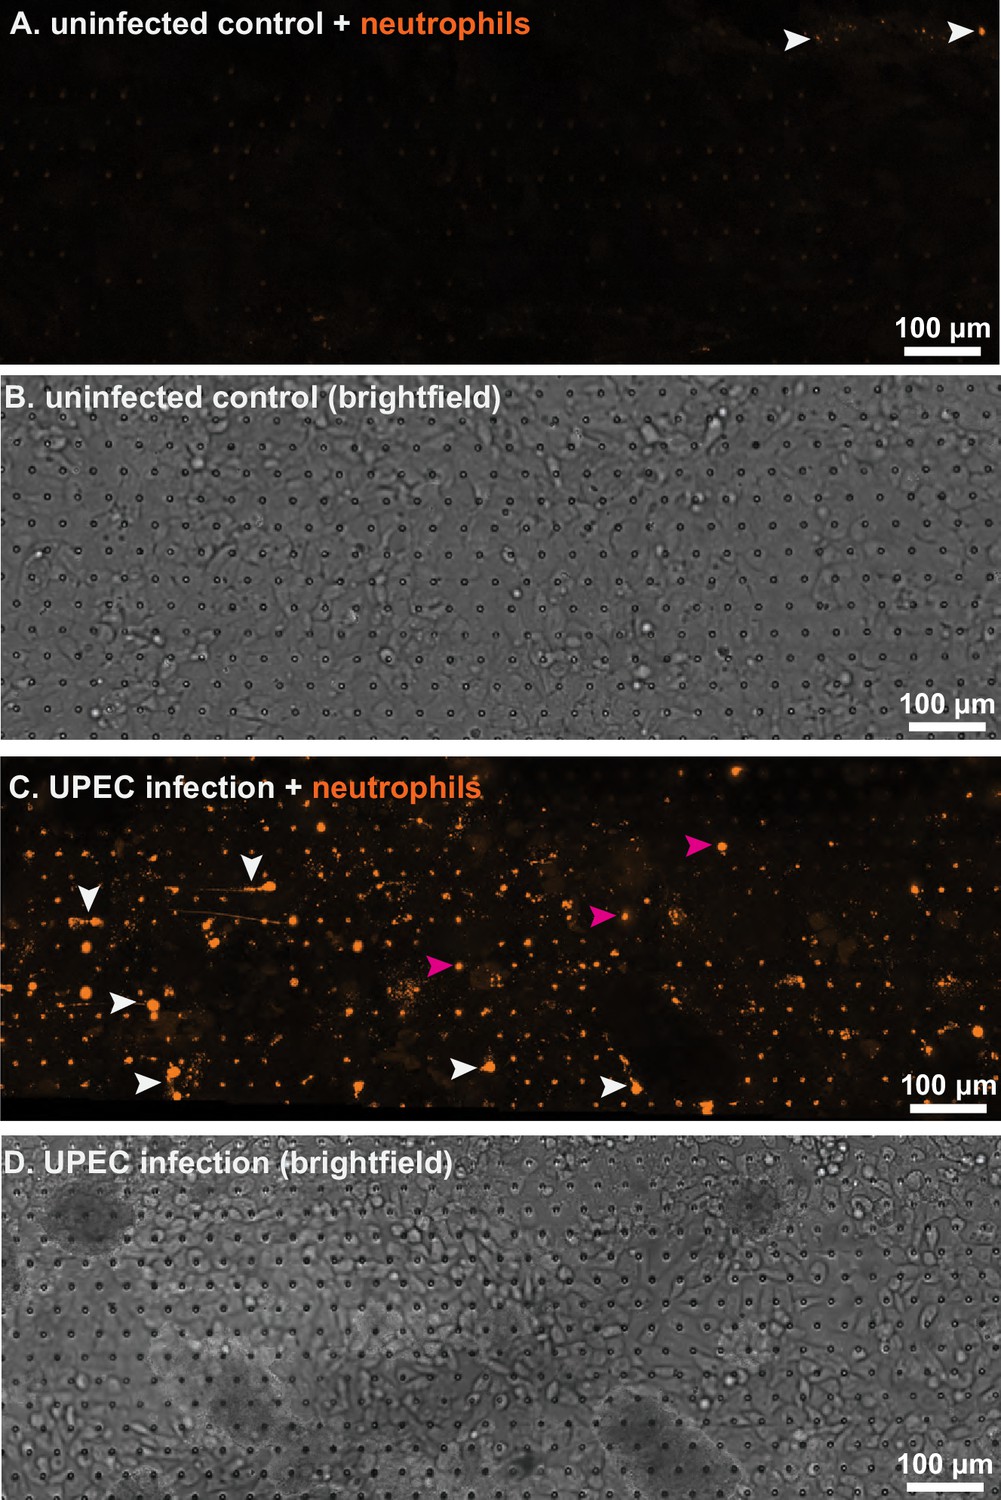
Neutrophil attachment to endothelial cells is enhanced upon bacterial infection.
Fluorescent (A) and bright-field (B) imaging of the endothelial layer of an uninfected bladder-chip. The few neutrophils (identified by CellTracker Deep Red, amber) attached to the endothelial layer are indicated by white arrowheads. Fluorescent (C) and bright-field (D) imaging of the endothelial layer of an infected bladder-chip, 1.5 hr after infection of the epithelial layer. Neutrophils attached to the endothelial layer are marked by white arrowheads and examples of diapedesis, although the PDMS pores to the epithelial layer are marked with magenta arrowheads. In all panels, neutrophils (amber) were introduced into the vascular channel of the bladder-chip under a flow rate of 3 ml/hr corresponding to a shear stress η=one dyne/cm2.
Figure 2—figure supplement 5
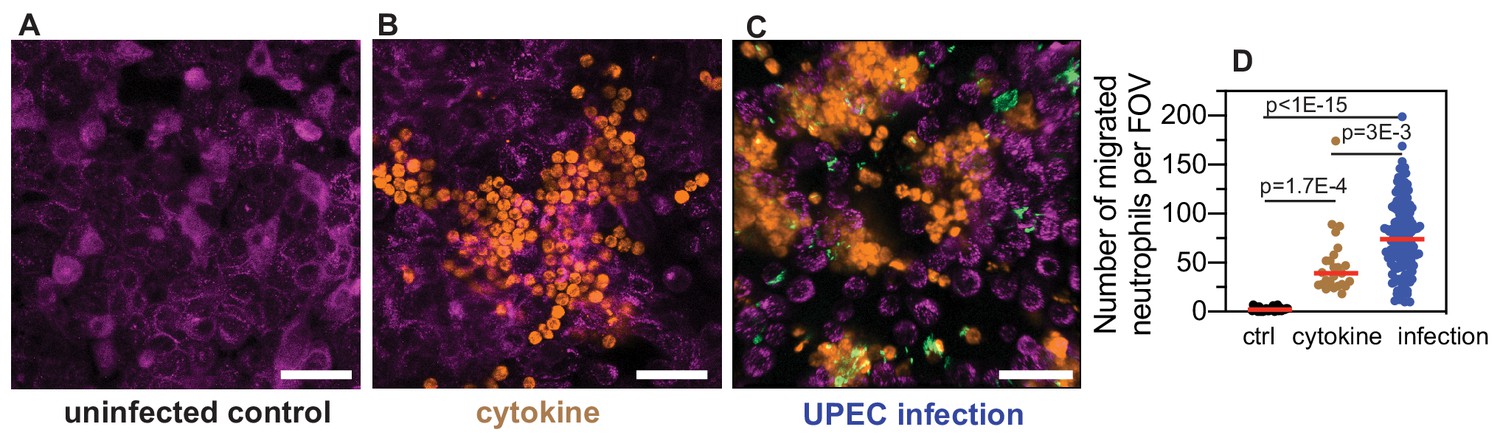
Neutrophil diapedesis is stimulated by a pro-inflammatory cytokine gradient across the epithelial-endothelial barrier.
(A) Representative images of the epithelial layer of an uninfected control bladder-chip, 2 hr after the introduction of neutrophils in the endothelial channel. No neutrophil diapedesis is observed. (B) Representative image of the epithelial layer of an uninfected control bladder-chip exposed to a cocktail of pro-inflammatory cytokines (Interleukin-1α, Interleukin-1β, Interleukin-6 and Interleukin-8, each at 100 ng/ml) added to the diluted urine on the epithelial side and maintained under flow for 2 hr. Epithelial cells (magenta, identified via CellMask Orange) and neutrophils (amber, identified via CellTracker Deep Red) are shown. (C) Representative image of the epithelial layer of an infected bladder-chip 2 hr after the introduction of neutrophils in the endothelial channel. UPEC identified via constitutive expression of YFP are shown in green. (D) Scatterplot of maximum number of neutrophils detected in 206 x 206 μm2 fields of view under control (n = 26), cytokine stimulation (n=26) and infection (n=130). p-Values were calculated using Kruskal-Wallis ANOVA Test. Red lines represent median values. Scale bars, 50 μm.
Figure 2—figure supplement 6
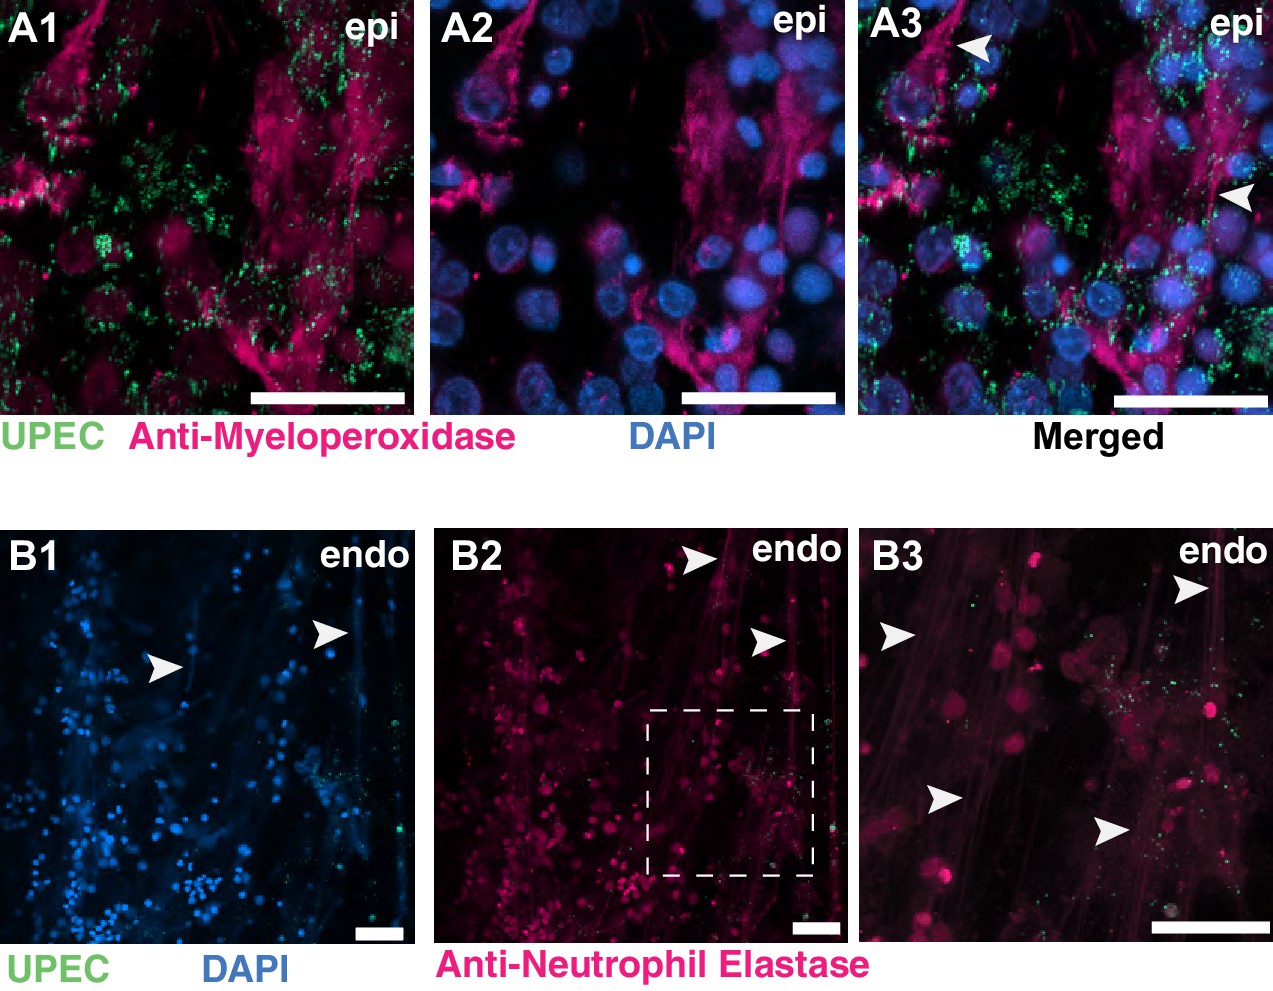
NETs formation on the epithelial and endothelial layers of an infected bladder-chip.
(A1–A3) Additional example of NETs formation by neutrophils on the epithelial layer (epi) of an infected bladder-chip. Neutrophils are identified via immunostaining with an anti-myeloperoxidase antibody (A1–A2). UPEC identified via YFP expression are shown in spring green (A1). Nuclear labeling with DAPI is shown in azure (A2). A merged image is shown in A3. (B1–B3) An example of NETs formation by neutrophils on the endothelial layer (endo) of an infected bladder-chip. UPEC identified via YFP expression are shown in spring green and nuclear labeling with DAPI is shown in azure (B1). Neutrophils are identified via immunostaining with an anti-neutrophil elastase antibody (B2). A zoomed image corresponding to the white dashed box in B2 is shown in B3. In all images, scale bar = 50 μm.
Figure 2—figure supplement 7
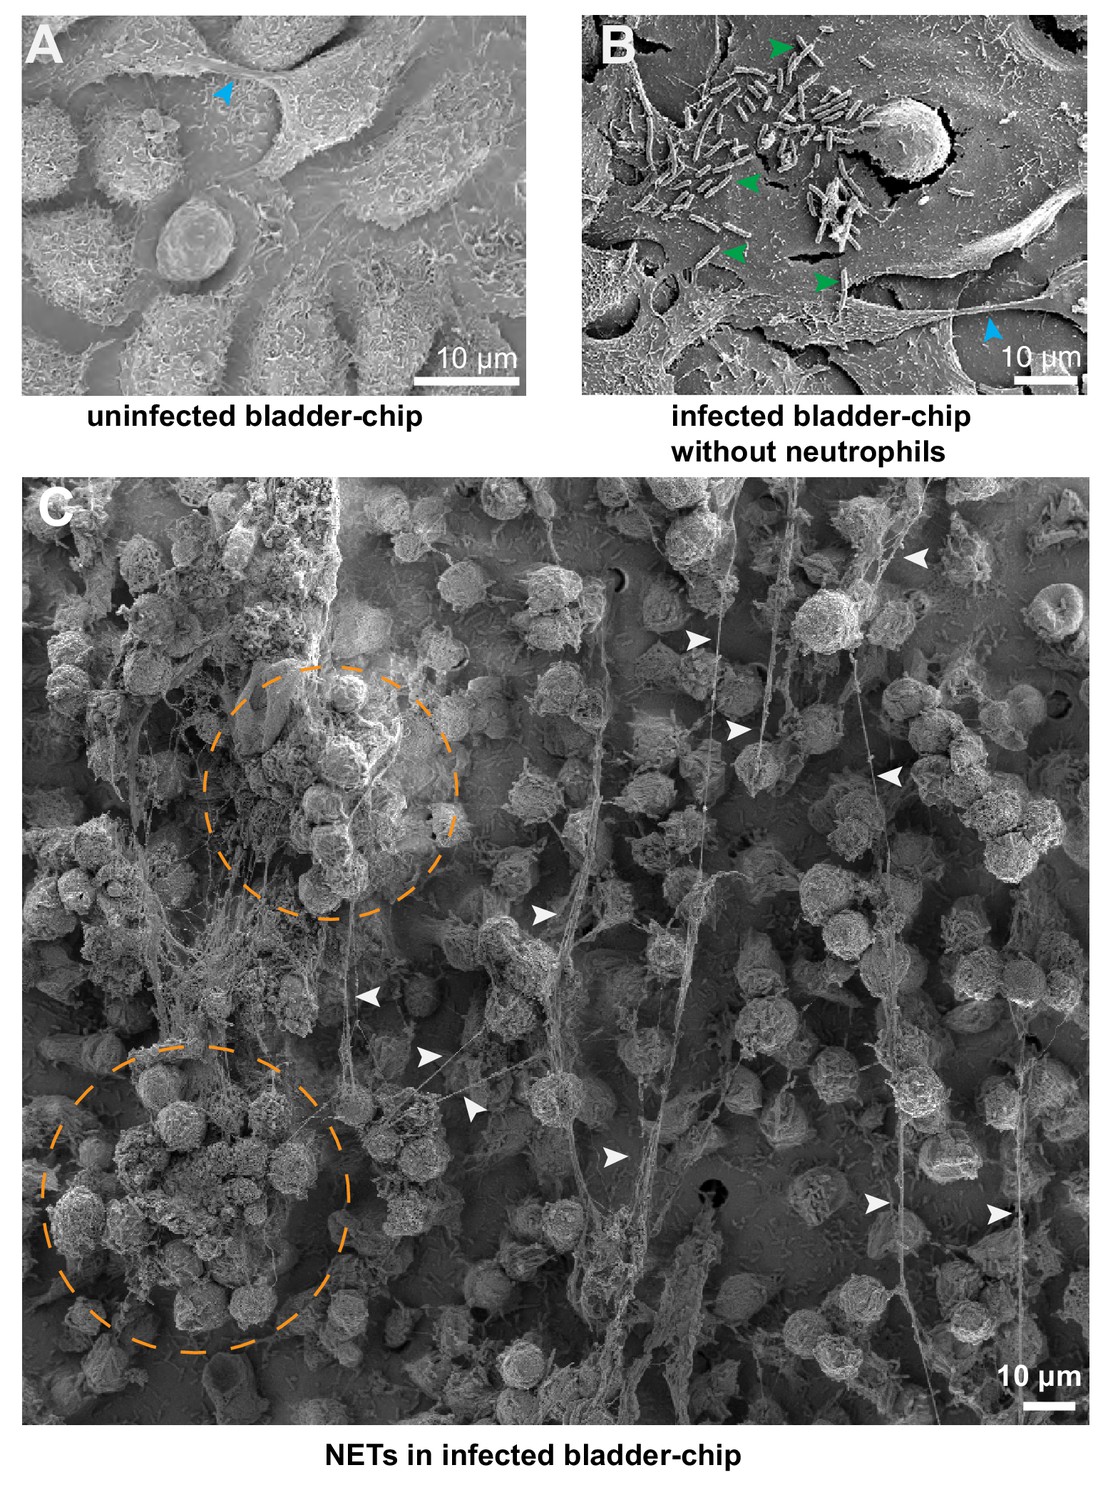
SEM characterization of uninfected and infected bladder-chips.
(A) SEM image of the confluent epithelial layer of an uninfected bladder-chip. Appendages between epithelial cells are indicated by cyan arrowheads. (B) Example from an infected bladder-chip without the addition of neutrophils. Long filaments characteristic of NET formation is not observed. Individual UPEC on the surface of the epithelial cells are indicated by green arrowheads. Appendage between epithelial cells is indicated by a cyan arrowhead (C) Additional example of formation of NETs around a large swarm of neutrophils on the epithelial layer of an infected bladder-chip. NETs are indicated by white arrowheads, and large clusters of neutrophils are indicated by dashed amber circles.
Figure 2—figure supplement 8
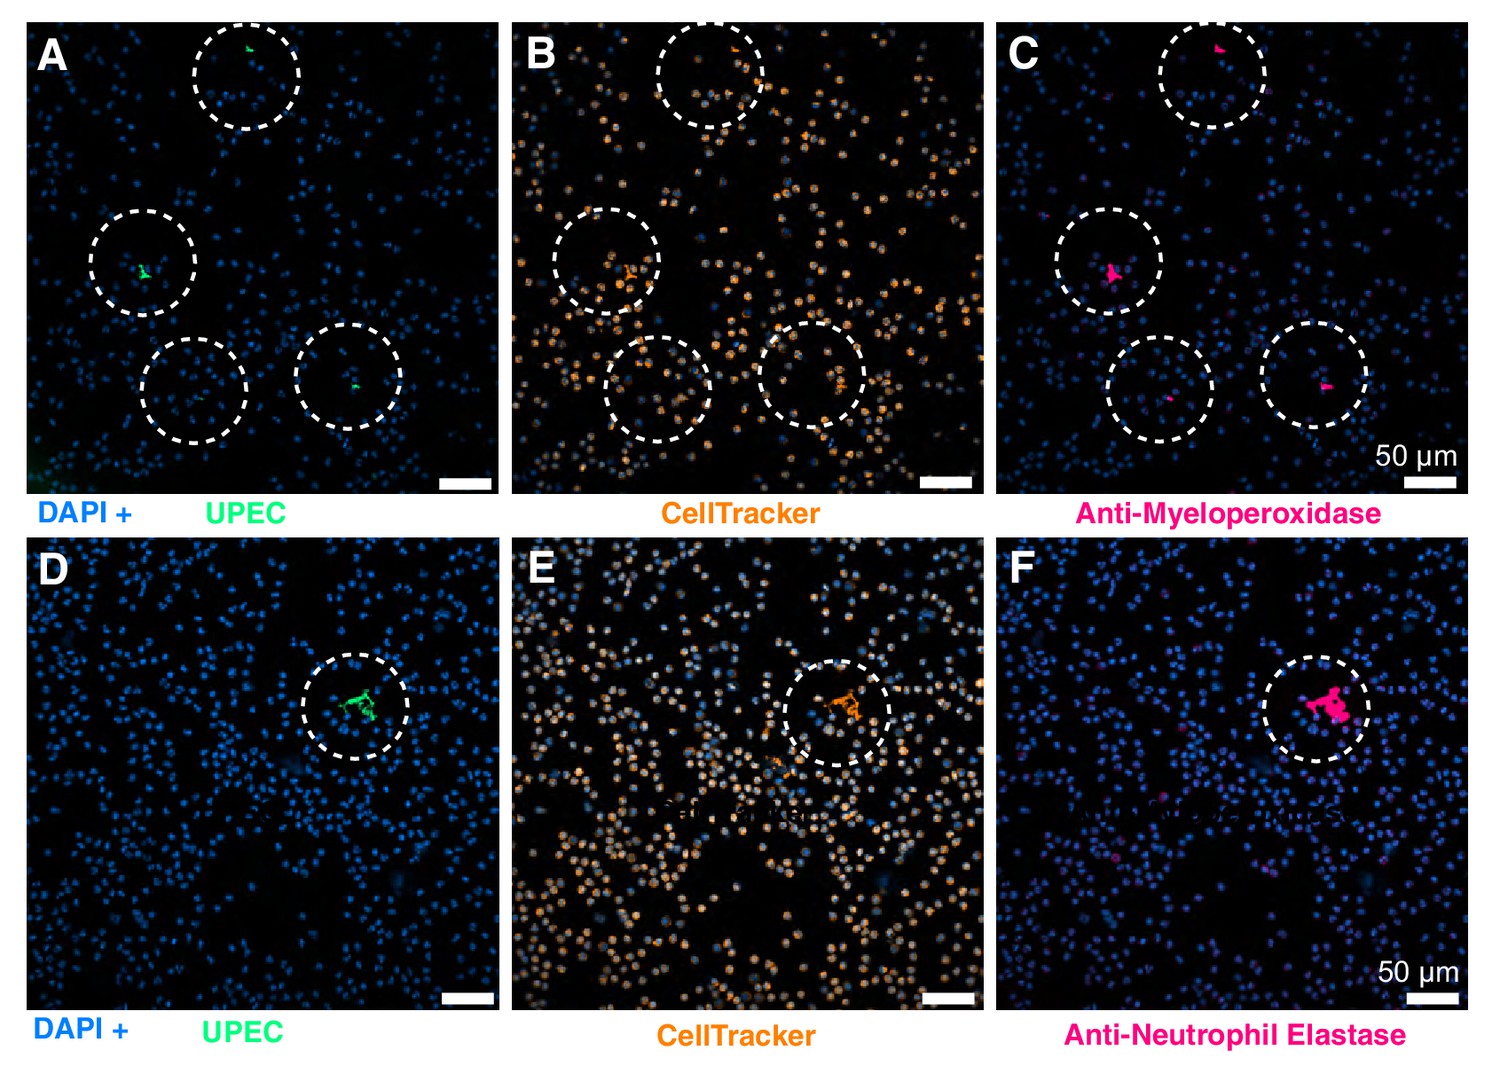
Neutrophils do not form NETs in response to shear stress in the bladder-chip.
Neutrophils infused through the vascular channel of an infected bladder-chip were collected and characterized via immunofluorescence for myeloperoxidase (A-C) and neutrophil elastase expression (D-F) to identify the formation of NETs, indicated by dotted white circles. All neutrophils are labeled by the cytoplasmic CellTracker dye (shown in amber in B, E). Both myeloperoxidase expression (marked with dotted white circles in C) and elastase expression (marked with dotted white circles in F) coincide with infected neutrophils (A, D). UPEC are identified via YFP expression and colored spring green, nuclear labeling is indicated in azure. Scale bars, 50 μm in all panels.
Figure 2—video 1
Description: Infection of bladder-chip with UPEC, diapedesis of neutrophils across the epithelial-endothelial barrier and formation of swarms (Figure 2B1–B5).
Stage 1: Prior to infection, the uninfected cells of the epithelial layer (magenta) are imaged (0–120 mins). Stage 2: UPEC (green) are introduced into the epithelial channel via flow and infection proceeds under flow for 120–210 min. Stage 3: Neutrophils (amber) are introduced into the vascular channel of the infected bladder-chip via flow (210 min onwards). Stage 4: Neutrophils undergo diapedesis within 15–30 min and are visible on the epithelial side (210–240 min). UPEC can be seen internalized by neutrophils. Stage 5: Neutrophils aggregate and form a neutrophil swarm (240 min onwards) on the epithelial side.
Figure 2—video 2
Description: Neutrophil diapedesis and swarm formation on the epithelial side of UPEC infection (Figure 2—figure supplement 2A1-A5).
Stage 1: Prior to infection, the uninfected cells of the epithelial layer (magenta) are imaged (0–120 mins). Stage 2: UPEC (green) are introduced into the epithelial channel via flow and infection proceeds under flow for 120–210 min. Stage 3: Neutrophils (amber) are introduced into the vascular channel of the infected bladder-chip via flow (210 min onwards). Stage 4: Neutrophils undergo diapedesis within 15 min and are visible on the epithelial side (210–240 min). UPEC can be seen internalized by neutrophils. Stage 5: Neutrophils aggregate and form a neutrophil swarm (240 min onwards) on the epithelial side.
Figure 3 with 7 supplements

Bladder-chip reveals dynamics of IBC growth, shedding and exfoliation.
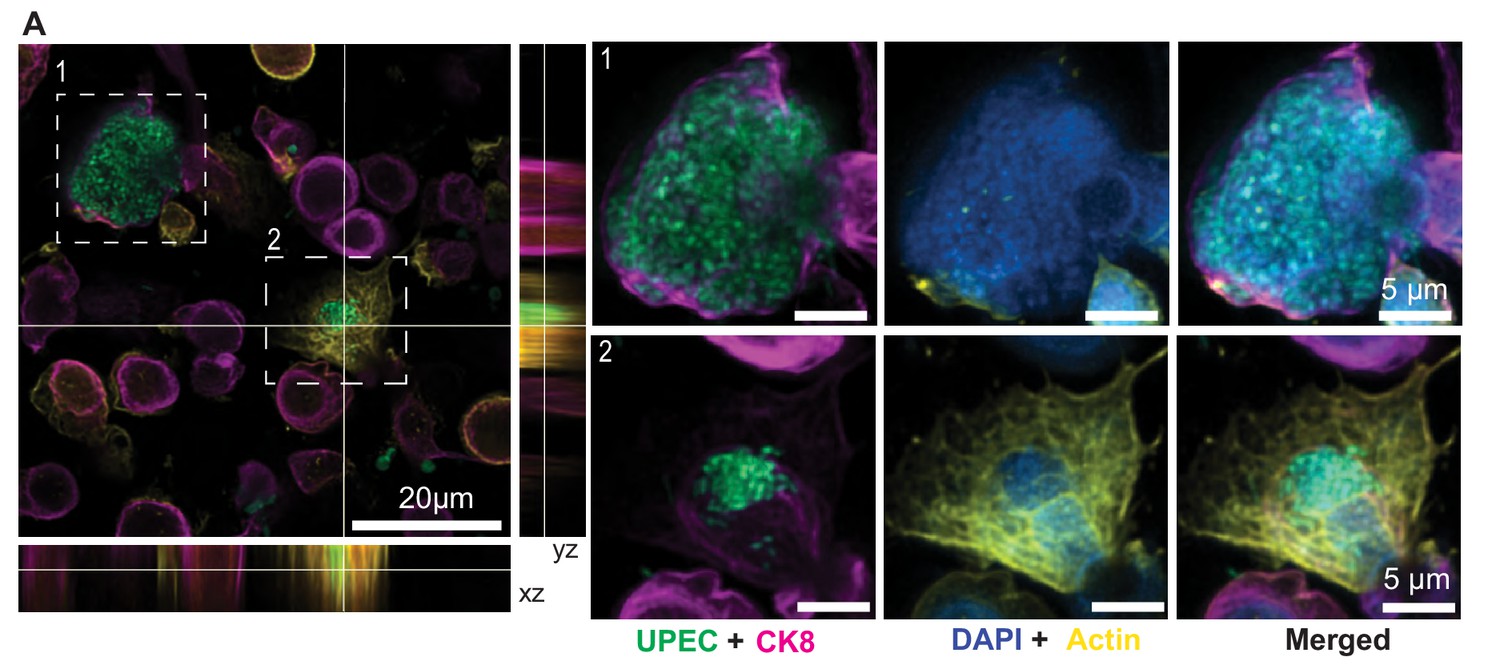
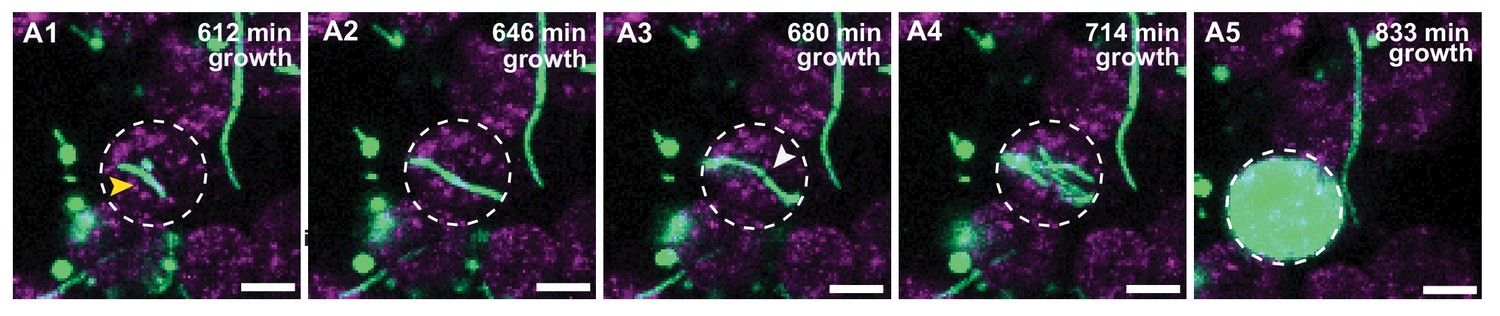
(A) Schematics of the host-pathogen interactions within IBCs between successive rounds of antibiotic treatment with outcomes including shedding of bacteria and cell exfoliation shown. Arrows indicate the flow of diluted urine in the epithelial channel. (B1–B5) Timeseries for the growth of an IBC from few bacteria (white arrowhead) after the first round of ampicillin treatment. Bacteria grow to completely fill the cell volume (B5). (C) Immunofluorescence characterization of two IBCs; the intracellular nature of growth is confirmed with staining with an anti-CK7 antibody. Correlative light (D) and transmission electron micrographs (E) show two IBCs filled with both rod-shaped and coccoid-shaped bacteria. (F) Coccoid-shaped bacteria (yellow arrowheads) and rod-shaped bacteria (magenta arrowheads) are also visible in a scanning electron micrograph of an infected epithelial cell. IBCs on infected bladder-chips shown in C–F were fixed ca. 13.5 hr after UPEC infection and 6 hr into the first growth cycle. (G1–G5) Three examples of IBC growth, labeled 1–3 with differing outcomes. Unrestricted bacterial growth is observed within all IBCs. In IBC#1 at timepoint (G4) the IBC begins to shed bacteria into the surrounding medium. The cell exfoliates in the time interval between (G4 and G5). In IBC#2, bacterial shedding is visible at (G4), and shedding continues until end of the timeseries with a reduction in bacterial volume. In contrast, growth within IBC#3 is slower and neither shedding nor exfoliation occurs within the timeseries. (H1–H5) Timeseries highlighting an example of filamentous UPEC growth within an IBC. Scale bars, 10 μm in B1–B5, G1–G5 and H1–H5.
Figure 3—figure supplement 1
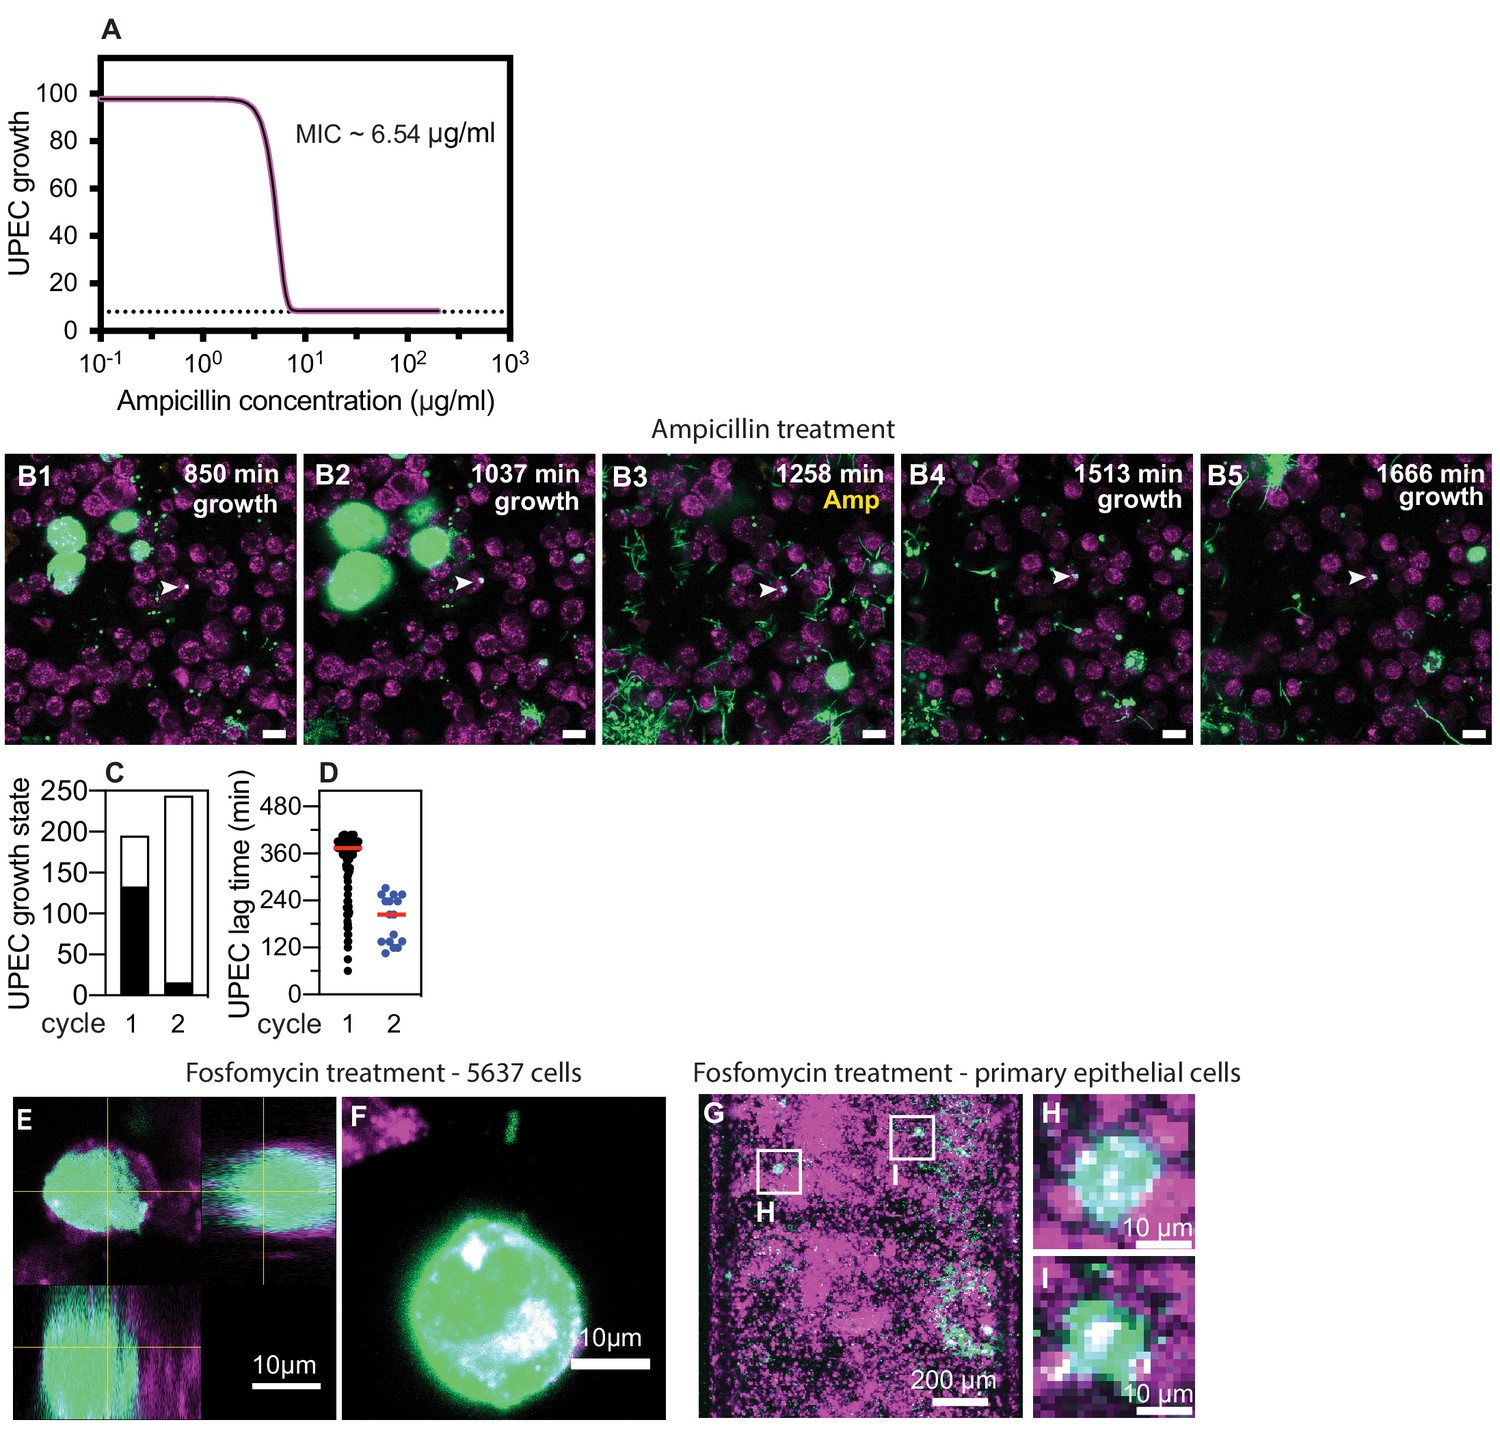
Non-growing UPEC in response to ampicillin administration in the bladder-chip.
(A) Measurement of ampicillin minimum inhibitory concentration (MIC) in endothelial cell medium for the UPEC strain used in these experiments. (B1–B5) Example of a non-growing clump of UPEC within an epithelial cell following the first growth cycle (indicated by white arrowheads in all images). The bacteria are non-growing throughout the first growth cycle (B1, B2), the second cycle of ampicillin treatment (B3) and subsequently after the removal of antibiotic (B4, B5). (C) Classification of the growth state of UPEC as growing (black) or non-growing (white) across n=108 fields of view in total from n=three infected bladder chips during the first and second growth periods. (D) Scatter plot for the distribution of lag time (measured as the time taken to resume growth after removal of antibiotic) for intracellular bacterial microcolonies during the first (n=133) and second (n=16) growth cycles. Red line represents the median value. Scale bars, 10 μm in B1–B5. (E) Orthogonal section view and (F) maximum intensity projection of an IBC formation after fosfomycin treatment of a chip reconstituted with 5637 cells. (G) Maximum intensity projection and zooms (H, I) of IBCs formed subsequent to fosfomycin treatment in primary bladder epithelial cells.
Figure 3—figure supplement 2
Immunofluorescence characterization of IBC formation.
(A) Confocal images of two IBCs within epithelial cells with different morphologies. UPEC are labeled in spring green, anti-CK8 staining is shown in magenta, F-actin labeling is shown in yellow, and nuclear labeling with DAPI is shown in azure. IBCs on the infected bladder chip were fixed ca. 13.5 hr after UPEC infection and 6 hr into the 1st growth cycle.
Figure 3—figure supplement 3
IBC formation from filamentous UPEC.
(A1–A5) Additional example of intracellular growth of filamentous UPEC that develops into an IBC. The growing filament (A1–A2) is eventually restricted by the cellular volume and bends (A3) before reductive division (marked by white arrowhead in A3) and IBC formation occurs. Scale bars, 10 μm in A1–A5.
Figure 3—video 1
Formation of intracellular bacterial community inside epithelial cell arising from few bacteria (Figure 3B1–B5).
An intracellular bacterial community is seeded inside a bladder epithelial cell (magenta, stained with Cell Mask Orange) by few UPEC (green) to form an intracellular bacterial community during the first growth cycle (578–1054 min, ca. 8 hr.). During subsequent ampicillin treatment (1071–1258 min, ca. 3 hr.), the IBC shed bacteria and eventually exfoliated from the epithelial layer.
Figure 3—video 2
IBC shedding and exfoliation (Figure 3G1–G5).
UPEC (green) divide and proliferate intracellularly in three epithelial cells (magenta, stained with Cell Mask Orange) to form IBCs. Two late-stage IBCs shed bacteria (ca. 935–969 min). One of these two IBCs subsequently exfoliated (ca. 986 min) whereas the other IBC shrank in volume due to the loss of shed bacteria. The third IBC did not shed bacteria during the first growth cycle (578–1054 min, ca. 8 hr.).
Figure 3—video 3
Filamentous bacterial growth within an IBC (Figure 3H1–H5).
Filamentous UPEC (green) grow intracellularly in an epithelial cell (magenta, stained with Cell Mask Orange) to form an IBC during the second growth cycle (1275 min onwards). Shedding of bacteria, some of which appear filamentous was subsequently observed later in the time series (ca. 1649–1768 min).
Figure 3—video 4
Filamentous bacterial growth within an IBC (Figure 3—figure supplement 3A1-A5).
Filamentous UPEC (green) grow intracellularly in an epithelial cell (magenta, stained with Cell Mask Orange) to form an IBC during the first growth cycle (578–1054 min, ca. 8 hr.). The IBC eventually exfoliates during the time series.
Figure 4 with 8 supplements
IBCs offer a semi-protective niche that delays clearance of bacteria by antibiotics.
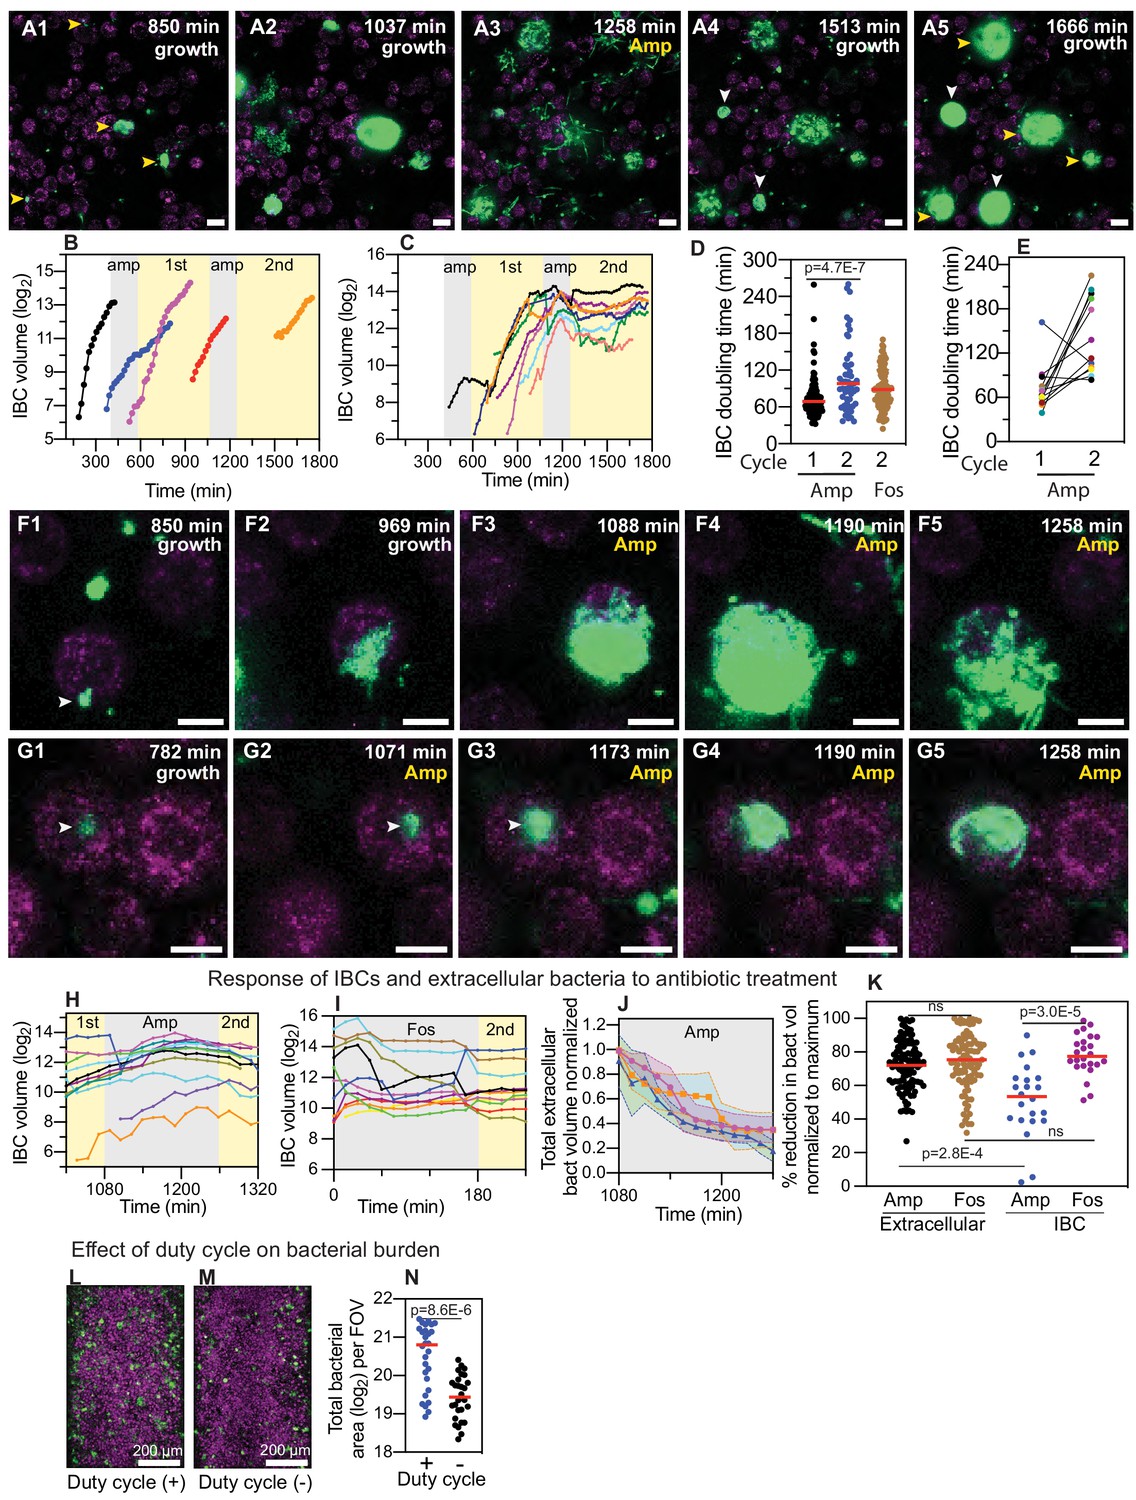
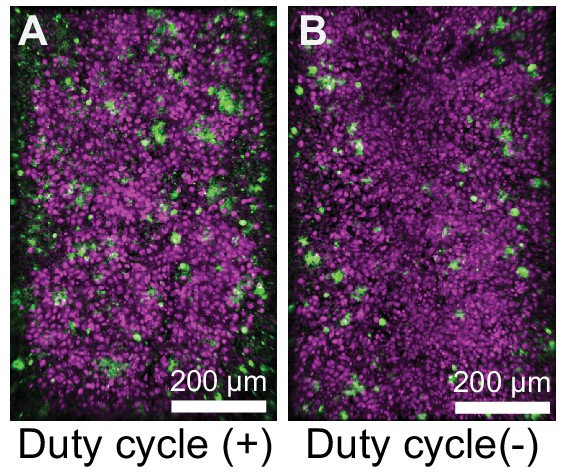
(A1–A5) Bacteria persist and grow in IBCs despite antibiotic treatment. Snapshots show the growth of four IBCs with variable growth rates (A1–A2) indicated by yellow arrowheads. Ampicillin treatment eliminates some but not all of the bacteria within each IBC (A3). Growth resumes at all sites in (A4, A5), formation of new IBCs in the second growth cycle is indicated by white arrowheads. (B) Plots of logarithm of bacterial volume within five separate IBCs demonstrates exponential bacterial growth. IBCs are seeded dynamically; growth can occur either in the first or second growth cycle, or prior to the administration of antibiotic, or in few cases continues in the presence of the antibiotic. (C) Plots of the logarithm of bacterial volume vs. time for n=8 IBCs tracked across two growth phases with an intermediate period of ampicillin treatment. In the growth phases, growth is exponential and bacterial volume continues to increase for up to ca. 120 min after administration of antibiotic before declining due to loss of bacteria. In each case, growth resumes after the antibiotic is removed. (D) Scatter plots of the doubling time of bacterial volume in IBCs as measured in the first growth cycle (n=102) and the second growth cycle (n=59) from n = 3 bladder-chips. Growth in the second cycle is significantly slower (p=4.7E-7), red line represents the median value. (E) Doubling time of bacterial volume in IBCs in the first and second growth cycle for some of the IBCs in (D) that survived the antibiotic treatment. In n=16 out of 18 instances, growth is slower in the second growth cycle. (F1–F5) High-resolution time-series that highlights bacterial growth within an IBC prior to (F1, F2) and after (F3–F5) administration of ampicillin. Some bacteria within this IBC are subsequently eliminated (F5). (G1–G5) High-resolution time-series that highlights bacterial growth within an IBC prior to (G1, G2) and after (G3–G5) administration of ampicillin. The bacterial volume within this IBC is not diminished by antibiotic treatment (G5). (H) Plots of logarithm of bacterial volume within n=11 IBCs before, during, and after the second round of ampicillin treatment. (I) Plots of logarithm of bacterial volume within n=9 IBCs before, during, and after the second round of fosfomycin treatment. (J) Plot of the volume of extracellular bacteria upon antibiotic administration from n=103 fields of view, each of which was 206 x 206 μm2 in size, from n=3 bladder-chips. The bacterial volumes are normalized to the volume immediately prior to the antibiotic administration. (K) Scatter plot of the extracellular bacterial volume (n=105) and bacterial volume within IBCs (n=22) from n = 3 bladder-chips after ampicillin treatment and extracellular bacterial volume (n=101) and bacterial volume within IBCs (n=23) from n=1 bladder-chip after fosfomycin treatment as a fraction of the maximum bacterial volume prior to antibiotic treatment. Red line represents the median value, p=2.8E-4 (extracellular amp vs IBC amp), p=3.0E-5 (IBC amp vs. IBC fosfomycin) calculated using Kruskal-Wallis ANOVA Test, ‘ns’ represents p>0.05 (L, M) Representative images from the epithelial face of the infected bladder-chips with or without duty cycle, fixed at ca. 13.5 hr after UPEC infection and 6 hr into the first growth cycle. (N) Scatter plots of the logarithm of the total bacterial area across n=14 fields of view from infected bladder-chips with (n=2) and without (n=2) the application of the duty cycle, p = 8.6E-6. p-values calculated using a Mann-Whitney test. Yellow rectangular area in B, C, H and I represent the 1st and 2nd growth cycles. Gray rectangular area in B, C, H, I and J represent the rounds of ampicillin treatment. Scale bars, 10 μm in panels A1–A5, F1–F5, and G1–G5.
Figure 4—figure supplement 1
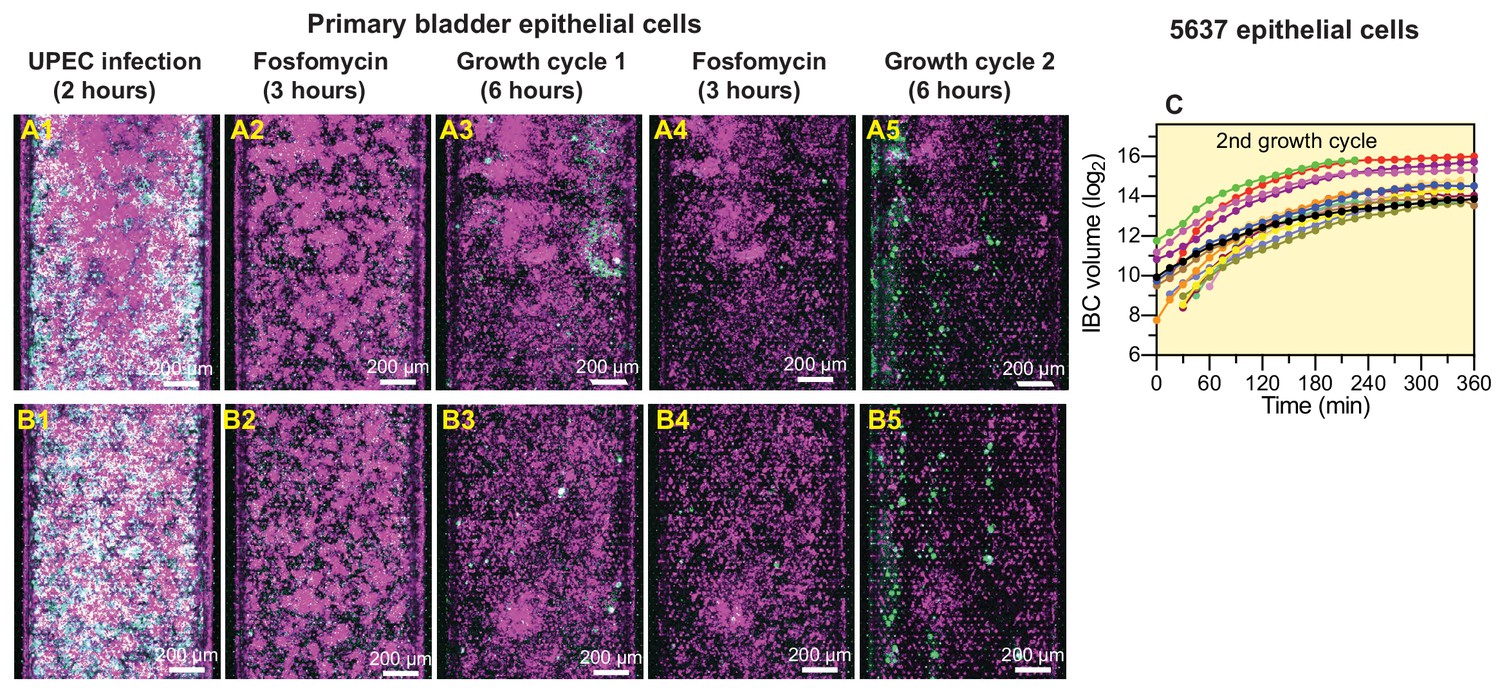
UPEC regrowth on-chip despite two consecutive periods of fosfomycin treatment.
(A, B) Examples of UPEC growth in infected bladder chips reconstituted with primary epithelial cells. Regrowth and IBC formation after two rounds of antibiotic treatment are observable in A5, B5. (C) Growth statistics for IBCs in chips reconstituted with 5637 cells after the two periods of fosfomycin treatment.
Figure 4—figure supplement 2

UPEC growth in IBCs during ampicillin treatment.
(A1–A5) Additional examples of UPEC growth during ampicillin treatment. (A1) Two IBCs (marked 1 and 2) at the start of ampicillin treatment. The IBC marked one exfoliates (A2), whereas the remaining IBC-2 continues to grow (A1–A3). Toward the end of this period, the bacteria filament (A4) before clearance due to the antibiotic is observed (A5). (B1–B5) High-resolution time-series that highlights bacterial growth within an IBC prior to (B1) and during (B2–B5) administration of ampicillin. The bacterial volume within this IBC is not diminished by antibiotic treatment (B5). Scale bars, 10 μm in all the panels.
Figure 4—figure supplement 3
UPEC infection leads to a higher bacterial burden in bladder-chips perturbed with duty cycle.
Additional examples of UPEC growth in infected bladder chips with (A) and without (B) duty cycle.
Figure 4—video 1
Bacteria within an IBC can persist and grow within an IBC despite the antibiotic treatment (Figure 4A1–A5).
Proliferation of UPEC (green) within four epithelial cells (magenta, stained with Cell Mask Orange) during the 1st growth cycle (578–1054 min, ca. 8 hr.) leads to the formation of IBCs. The bacteria within the four IBCs persist during the (~40x MIC) ampicillin treatment (1071–1258 min, ca. 3 hr.) In each case, bacterial clearance was observed during the ampicillin treatment, but all four IBCs persisted over the course of the treatment. Bacterial growth subsequently resumed within all four IBCs post ampicillin washout during the second growth cycle (1275 min onwards). Two new IBCs were formed during the second growth cycle (1275 min onwards). IBC fluxing and filamentation could be observed toward the end of time series.
Figure 4—video 2
Ampicillin-mediated bacterial clearance is delayed within an IBC (Figure 4F1–F5).
Proliferation of UPEC (green) within an epithelial cell (magenta, stained with Cell Mask Orange) during the 1st growth cycle (578–1054 min, ca. 8 hr.) to form an IBC. The bacteria within the IBC persisted during the (~40x MIC) ampicillin treatment (1071–1258 min, ca. 3 hr.). Bacterial proliferation continued during the first two hours of the ampicillin treatment (1071–1190 min, ca. 2 hr.). Bacterial killing was subsequently observed later during the ampicillin treatment (1190–1258, ca. 1 hr.). Some bacteria within the IBC persisted throughout the ampicillin treatment and resumed proliferation during the second growth cycle (1275 min onwards).
Figure 4—video 3
Ampicillin-mediated bacterial clearance is delayed within an IBC (Figure 4—figure supplement 1A1-A5).
Proliferation of UPEC (green) within two epithelial cells prior to the ampicillin treatment during the 1st growth cycle (578–1054 min, ca. 8 hr.). IBC#1 exfoliates from the epithelial layer (ca. 1105 min). Bacteria within IBC#2 continued to proliferate during the first 2 hr of the ampicillin treatment (1071–1190 min, ca. 2 hr.). Bacterial clearance was subsequently observed later during the ampicillin treatment (1190–1258, ca. 1 hr.). IBC#2 eventually exfoliated from the epithelial layer toward the end of the time series (1292 min).
Figure 4—video 4
Bacteria can continue growing within an IBC for the entire duration of ampicillin treatment (Figure 4G1–G5).
Proliferation of UPEC (green) within an epithelial cell (magenta, stained with Cell Mask Orange) during the 1st growth cycle (578–1054 min, ca. 8 hr.) to form an IBC. Bacterial growth within the intact IBC continued both during the ampicillin treatment (~40x MIC, 1071–1258 min, ca. 3 hr.) as well as after the ampicillin was washed out during the 2nd growth cycle (1275 min onwards). Eventually, the IBCs shed bacteria (1700–1751 min, ca. 1 hr) towards the end of time series.
Figure 4—video 5
Bacteria can continue growing within an IBC during the ampicillin treatment (Figure 4—figure supplement 1B1-B5).
Proliferation of UPEC (green) within an epithelial cell (magenta, stained with Cell Mask Orange) during the 1st growth cycle (578–1054 min, ca. 8 hr.) to form an IBC. Bacterial growth within the intact IBC continued both during the ampicillin treatment (~40x MIC, 1071–1258 min, ca. 3 hr) as well as after the ampicillin was washed out during the 2nd growth cycle (1275 min onwards). The late-stage IBC eventually shed bacteria and filamentous bacterial growth (1632–1717 min, ca. 1.5 hr) was also observed toward the end of time series.
Tables
Table 1
Characterization of epithelial and endothelial cell densities from a total of n=18 fields of view in both the epithelial and endothelial layers from n=two bladder-chips.
| Cell type | Cell density/104 μm2 |
|---|---|
| Epithelial | 31.7 ± 5.1 |
| Endothelial | 4.0 ± 0.6 |
Key resources table
| Reagent type (species) or resource | Designation | Source or reference | Identifiers | Additional information |
|---|---|---|---|---|
| Strain, strain background (Uropathogenic Escherichia coli) | CFT073 | PMID:2182540 | NCBI: txid199310 | originally isolated from a pyelonephritis patient and provided by Prof. H.L.T. Mobley, University of Michigan, USA |
| Recombinant DNA reagent | pZA32-YFP (plasmid) | PMID:9092630 Lutz and Bujard, 1997 | ||
| Strain, strain background (Uropathgenic Escherichia coli) | CFT073-pZA32-YFP, CFT073 | this paper | this study | |
| Cell line (Homo sapiens) | HTB-9 bladder epithelial cells | ATCC | Cat#:5637 | |
| Cell line (Homo sapiens) | HMVEC-Bd – Human Bladder Microvascular Endothelial Cells | Lonza | Cat#:7016 | |
| Biological sample (Homo sapiens) | Human primary bladder epithelial cells | Cell Biologics | Cat#:H-6215 | |
| Other | RPMI-1640 medium | ATCC | Cat#:30–2001 | |
| Other | Gibco RPMI 1640 Medium, no phenol red | Thermofisher | Cat#:11835063 | |
| Other | GibcoFetal Bovine Serum, Premium Plus | Thermofisher | Cat#: A4766801 | |
| Other | Complete Human Epithelial Cell Medium with growth factor supplement | Cell Biologics | Cat#: H6621 | |
| Other | EGM-2 MV Microvascular Endothelial Cell Growth Medium-2 BulletKit | Lonza | Cat#:CC-3202 | |
| Other | EBM-PRF Endothelial Medium Phenol-red free, 500 ml | Lonza | Cat#:CC-3129 | |
| Other | EGM-2 Endothelial SingleQuots Kit | Lonza | Cat#:CC-4176 | |
| Other | Gibco Antibiotic-Antimycotic (100X) | Thermofisher | Cat#:15240062 | |
| Other | Gibco Trypsin-EDTA (0.05%), phenol red | Thermofisher | Cat#:25300054 | |
| Drug | Chloramphenicol | Sigma-Aldrich | Cat#:C1919-25G | 34 mg/ml in ethanol (stored at −20°C) |
| Drug | Ampicillin | Sigma-Aldrich | Cat#: A9518-5G | 50 mg/ml in ddH2O (stored at −80°C) |
| Other | Pooled human female urine | Golden West Diagnostics | Cat#: OH2010-pH | |
| Other | Phosphate Buffered Saline | Thermofisher | Cat#: 10010056 | |
| Other | Gibco HEPES | Thermofisher | Cat#: F2006 | |
| Other | Invitrogen DAPI | Thermofisher | Cat#: D1306 | 5 mg/ml in DMSO |
| Other | LB (Luria broth base, Miller′s modified) | Sigma-Aldrich | Cat#: L1900-1KG | |
| Other | Organ-chips (Standard Research Kit - 24 per Pack) | Emulate | RE1000001024 | |
| Other | CellMask Orange Plasma membrane Stain | Thermofisher | Cat#: C10045 | 1 µM in cell media |
| Other | HCS CellMask Deep Red Stain | Thermofisher | Cat#: H32721 | 2 µM in PBS |
| Other | CellTracker Deep Red Dye | Thermofisher | Cat#: C34565 | 1 µM in cell media |
| Other | Elveflow OB1 Pressure Controller OB1 Base MkIII+ | Elveflow | Cat#: OB1MKIII+-MIX- | connected to 6 bar compressed air channel |
| Other | Elveflow OB1 Pressure Controller OB1 MkIII Channel-900/1000 | Elveflow | Cat#: OB1-Dual- | connected to Elveflow OB1 Pressure Controller OB1 Base MkIII+ |
| Other | Diaphragm moist gas vacuum pump | KNF Neuberger | Cat#:LABOPORT UN 820.3 FT.40P | connected to Elveflow OB1 Pressure Controller OB1 MkIII Channel-900/1000 |
| Antibody | Anti-EpCAM (rabbit polyclonal) | Abcam | Cat#: ab71916 | IF (1:100) in 1% BSA |
| Antibody | Anti-PECAM1 or Anti-CD31 (mouse monoclonal) | Abcam | Cat#: ab24590 | IF (1:100) in 1% BSA |
| Antibody | Anti-CK7 (rabbit monoclonal) | Abcam | Cat#: ab209599 | IF (1:100) in 1% BSA |
| Antibody | Anti-CK8 (rabbit monoclonal) | Abcam | Cat#: ab192468 | IF (1:100) in 1% BSA |
| Other | Alexa Fluor 555 Phalloidin | Thermofisher | Cat#: A34055 | 1 µM in PBS |
| Antibody | Anti-VE-Cadherin (rabbit polyclonal) | abcam | Cat#: ab33168 | IF (1:100) in 1% BSA |
| Antibody | Anti-Uroplakin3a (mouse monoclonal) | Santa Cruz | Cat#: sc-166808 | IF (1:100) in 1% BSA |
| Antibody | Anti-CK1 (mouse monoclonal) | Thermofisher | Cat#: MA1-06312 | IF (1:100) in 1% BSA |
| Antibody | Anti-E-Cadherin (mouse monoclonal) | Thermofisher | Cat#: MA5-14408 | IF (1:100) in 1% BSA |
| Antibody | Anti-ZO-1 (rabbit polyclonal) | abcam | Cat#: ab216880 | IF (1:100) in 1% BSA |
| Antibody | Anti-myeloperoxidase (rabbit polyclonal) | abcam | Cat#: ab9535 | IF (1:100) in 1% BSA |
| Antibody | Anti-neutrophil elastase (rabbit polyclonal) | abcam | Cat#: ab68672 | IF (1:100) in 1% BSA |
| Antibody | Anti-CD15 (mouse monoclonal) | abcam | Cat#: ab665 | IF (1:100) in 1% BSA |
| Antibody | Donkey anti-Mouse IgG (H+L) Highly Cross-Adsorbed Secondary Antibody, Alexa Fluor 647 | Thermofisher | Cat#: A-31571 | IF (2 μg/ml) |
| Antibody | Donkey anti-Rabbit IgG (H+L) Highly Cross-Adsorbed Secondary Antibody, Alexa Fluor 647 | Thermofisher | Cat#: A-31573 | IF (2 μg/ml) |
| Antibody | Goat anti-Mouse IgG (H+L) Highly Cross-Adsorbed Secondary Antibody, Alexa Fluor 488 | Thermofisher | Cat#: A-11029 | IF (2 μg/ml) |
| Antibody | Donkey anti-Rabbit IgG (H+L) Highly Cross-Adsorbed Secondary Antibody, Alexa Fluor 568 | Thermofisher | Cat#: A10042 | IF (2 μg/ml) |
| Antibody | Donkey anti-Mouse IgG (H+L) Highly Cross-Adsorbed Secondary Antibody, Alexa Fluor 568 | Thermofisher | Cat#: A10037 | IF (2 μg/ml) |
| Peptide, recombinant protein | Fibronectin from human plasma | Sigma-Aldrich | Cat#: F1056 | 500 µg/ml in ddH2O |
| Peptide, recombinant protein | Native Collagen, Bovine dermis | AteloCell | Cat#: IAC-50 | 5 mg/ml |
| Peptide, recombinant protein | Human IL-1α, research grade | Miltenyi Biotec | Cat#:130-093-894 | 1 µg/ml |
| Peptide, recombinant protein | Human IL-1β, research grade | Miltenyi Biotec | Cat#:130-093-895 | 1 µg/ml |
| Peptide, recombinant protein | Human IL-6, research grade | Miltenyi Biotec | Cat#:130-093-929 | 1 µg/ml |
| Peptide, recombinant protein | Human IL-8, research grade | Miltenyi Biotec | Cat#:130-122-354 | 1 µg/ml |
| Commercial assay or kit | MACSxpress Whole Blood Neutrophil Isolation Kit, human | Miltenyi Biotec | Cat#:130-104-434 | |
| Software, algorithm | Imaris 9.5.1 | Bitplane | ||
| Other | Gas chamber for stages with k-frame insert (160x110mm) - magnetic model with sliding lid. | okolab | Cat#: H201-K-FRAME | |
| Other | Custom holder for 24 mm x 60 mm coverslip | okolab | Cat#:1x24by60-M | |
| Other | µ-Slide 8 Well | ibidi | Cat#:80826 | |
| Other | Masterflex PharMed tubing, 0.89 mm ID, 100 ft | Cole-Palmer | Cat#:GZ-95709–26 | |
| Other | Masterflex Transfer Tubing, Tygon 0.76 mm ID | Cole-Palmer | Cat#:GZ-06419–03 | |
| Other | 1.30 x 0.75 x 10 mm metallic tubes | Unimed | Cat#:9084 / 200.010-A | |
| Other | 1.00/0.75 x 20 mm metallic tubes | Unimed | Cat#:200.010-A | |
| Other | Aladdin programmable pump | WPI | Cat#: PUMP-NE-1000 |
Additional files
Download links
A two-part list of links to download the article, or parts of the article, in various formats.
Downloads (link to download the article as PDF)
Open citations (links to open the citations from this article in various online reference manager services)
Cite this article (links to download the citations from this article in formats compatible with various reference manager tools)
Dynamic persistence of UPEC intracellular bacterial communities in a human bladder-chip model of urinary tract infection
eLife 10:e66481.
https://doi.org/10.7554/eLife.66481


