SARS-CoV-2 shedding dynamics across the respiratory tract, sex, and disease severity for adult and pediatric COVID-19
- Department of Chemical Engineering & Applied Chemistry, University of Toronto, Canada
- Temerty Faculty of Medicine, University of Toronto, Canada
- Department of Critical Care Medicine, Cumming School of Medicine, University of Calgary, Canada
- O'Brien Institute of Public Health, University of Calgary, Canada
- Libraries, University of Victoria, Canada
- Department of Viroscience, Erasmus University Medical Center, Netherlands
- Division of Epidemiology, Dalla Lana School of Public Health, University of Toronto, Canada
- Institute of Biomedical Engineering, University of Toronto, Canada
Figures
Figure 1 with 1 supplement
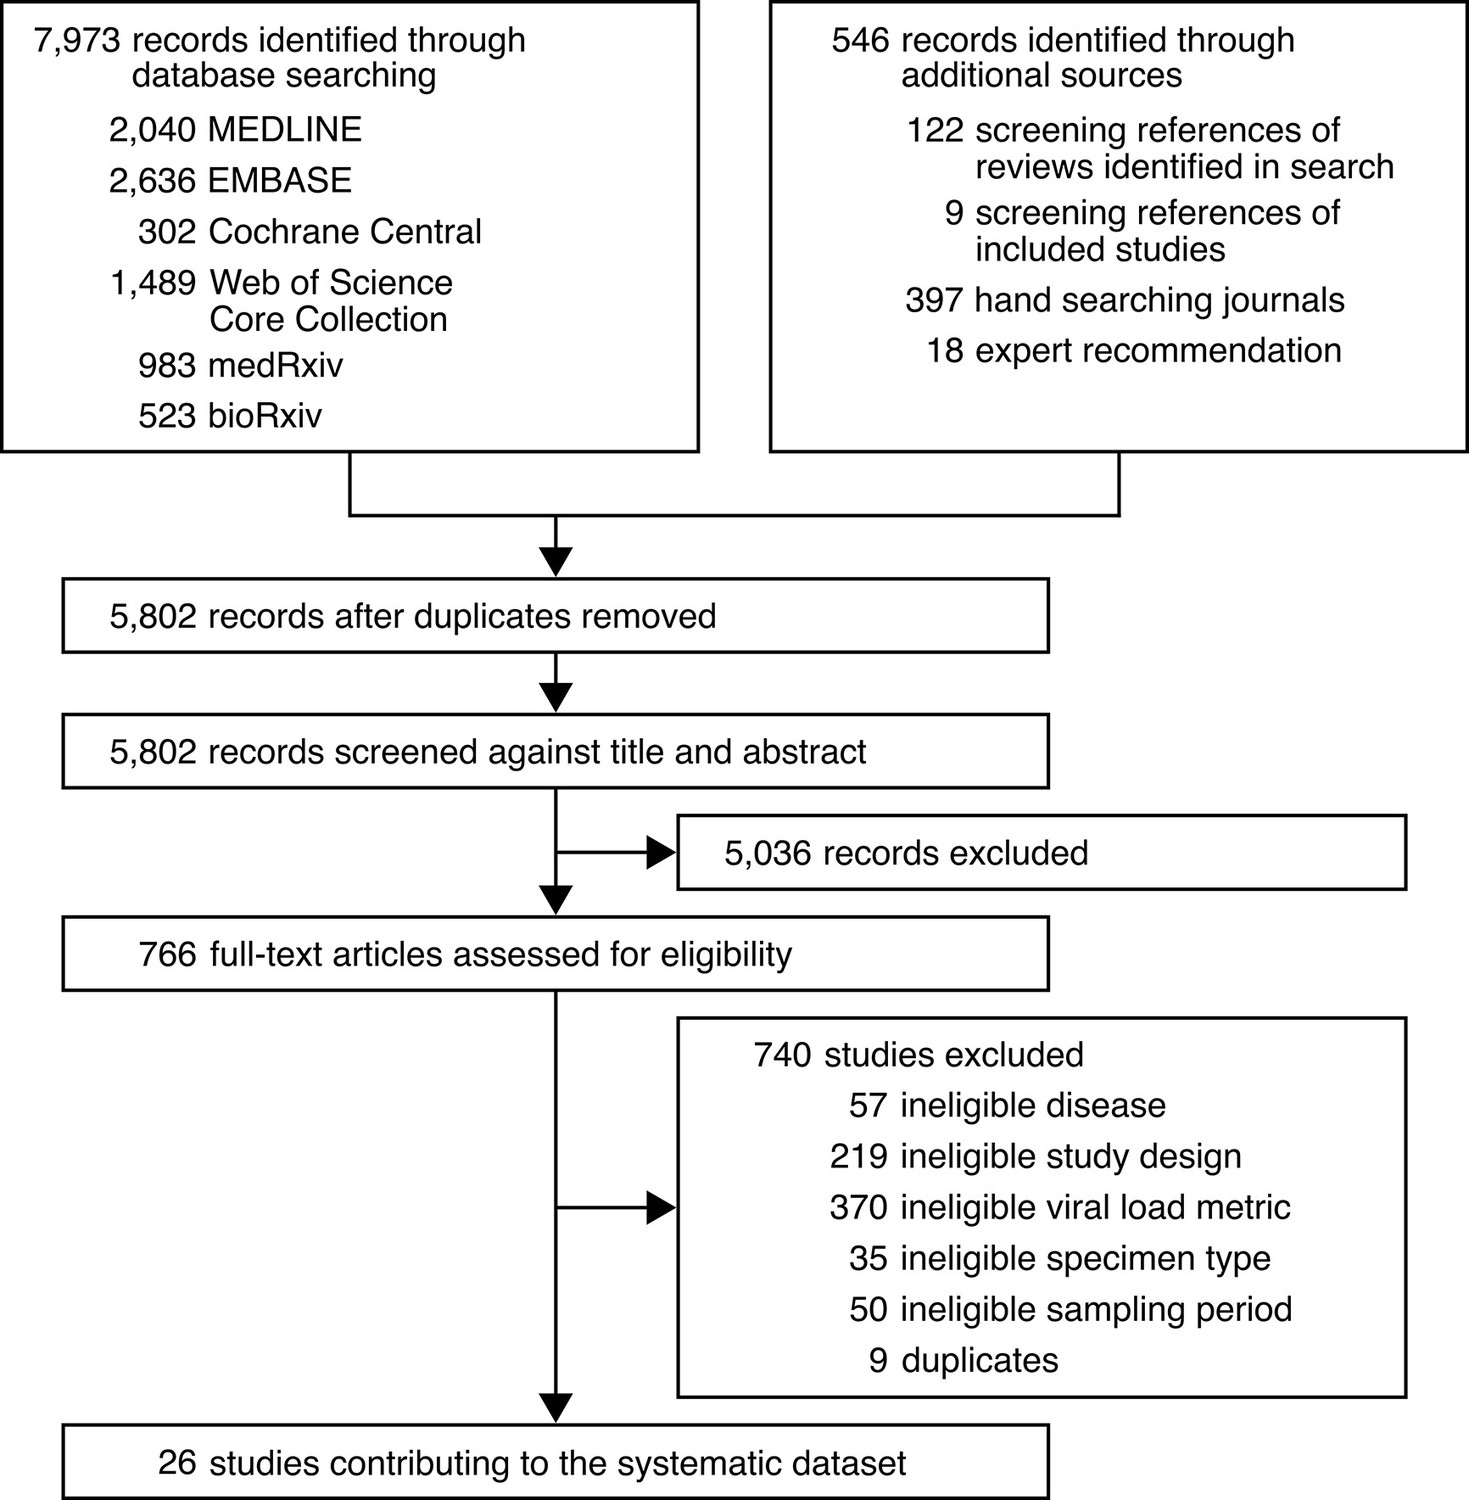
Study selection.
-
Figure 1—source data 1
Search strategy used for MEDLINE.
- https://cdn.elifesciences.org/articles/70458/elife-70458-fig1-data1-v2.docx
-
Figure 1—source data 2
Search strategy used for EMBASE.
- https://cdn.elifesciences.org/articles/70458/elife-70458-fig1-data2-v2.docx
-
Figure 1—source data 3
Search strategy used for Cochrane Central.
- https://cdn.elifesciences.org/articles/70458/elife-70458-fig1-data3-v2.docx
-
Figure 1—source data 4
Search strategy used for Web of Science Core Collection.
- https://cdn.elifesciences.org/articles/70458/elife-70458-fig1-data4-v2.docx
-
Figure 1—source data 5
Search strategy used for medRxiv and bioRxiv.
- https://cdn.elifesciences.org/articles/70458/elife-70458-fig1-data5-v2.docx
Figure 1—figure supplement 1
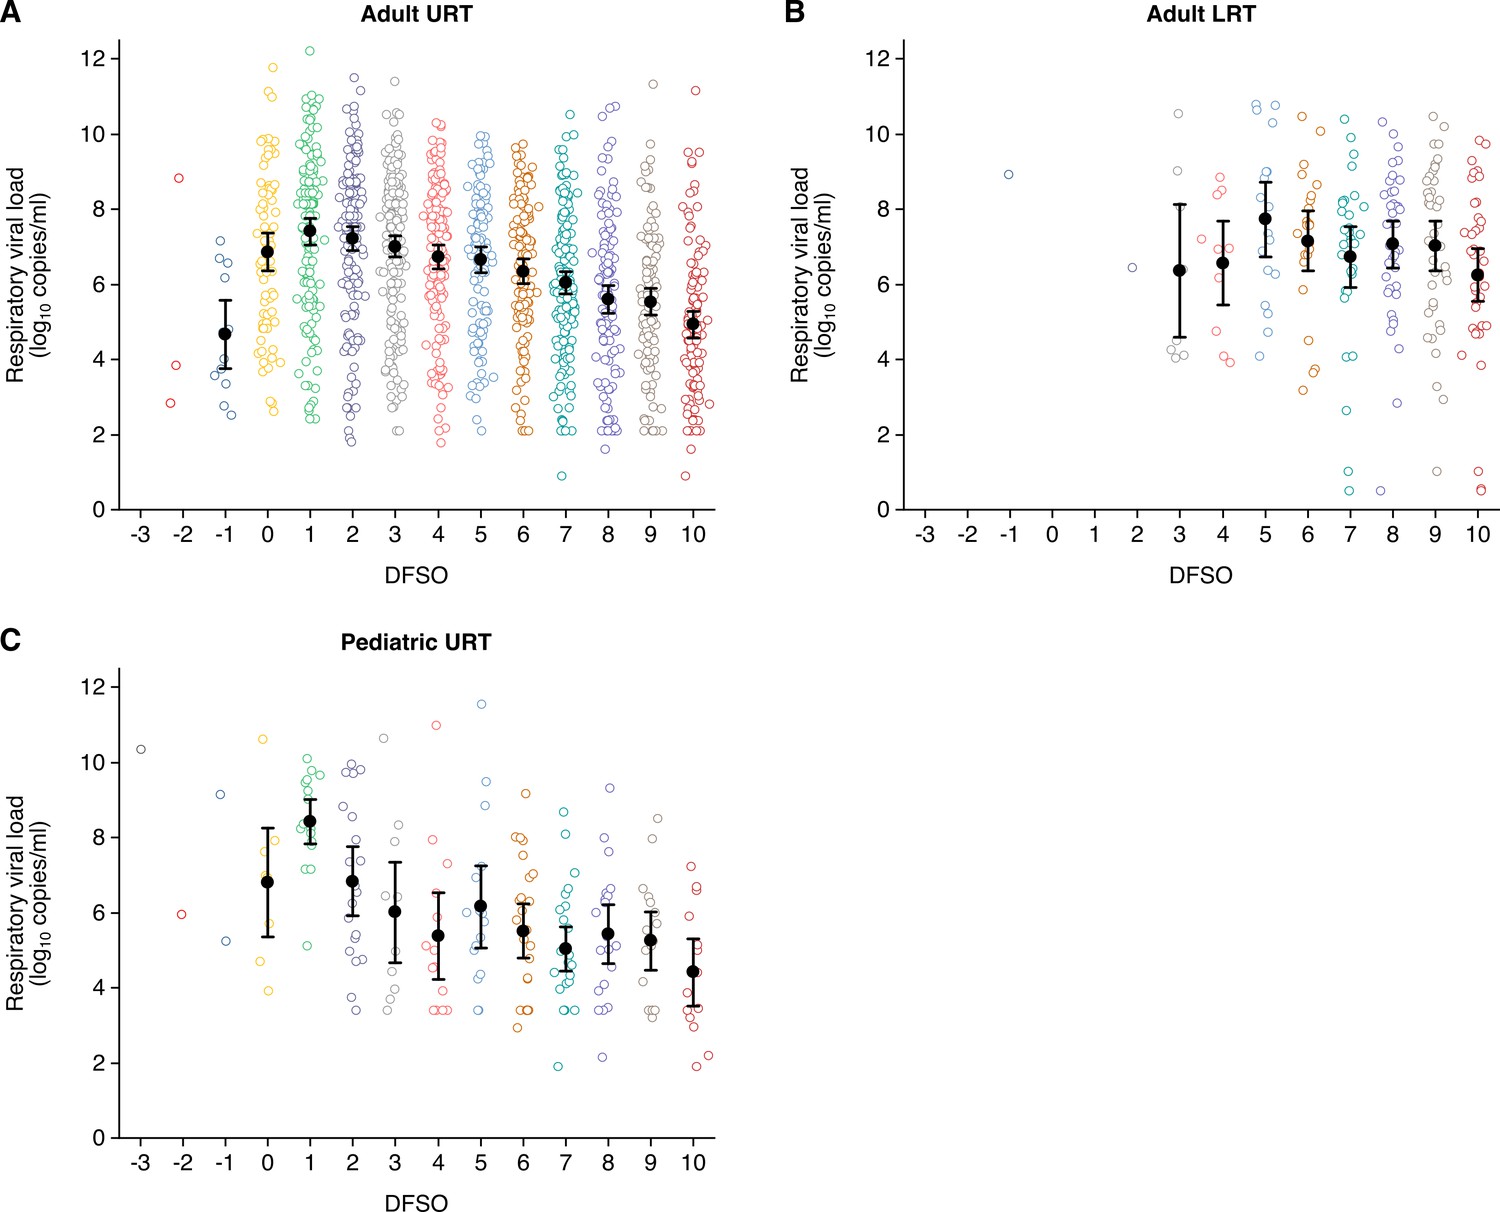
Summary of respiratory viral loads in the systematic dataset.
(A) Upper respiratory tract (URT) respiratory viral loads (rVLs) for adult coronavirus disease 2019 (COVID-19) cases (from –3 to 10 days from symptom onset [DFSO], n = 0, 3, 12, 71, 145, 159, 176, 152, 114, 123, 161, 125, 110, and 117 samples per DFSO). (B) Lower respiratory tract (LRT) rVLs for adult COVID-19 cases (from –3 to 10 DFSO, n = 0, 0, 1, 0, 0, 1, 8, 10, 18, 23, 31, 39, 40, and 40 samples per DFSO). (C) URT rVLs for pediatric COVID-19 cases (from –3 to 10 DFSO, n = 1, 1, 2, 8, 17, 20, 11, 14, 16, 25, 26, 20, 17, and 14 samples per DFSO). Data were collected within the estimated infectious period of SARS-CoV-2 (−3 to 10 DFSO). The systematic search found no quantitative specimen measurements from the LRT for pediatric COVID-19. Open circles show rVL data. Filled circles and bars depict mean estimates and 95% CIs, respectively.
Figure 2 with 2 supplements
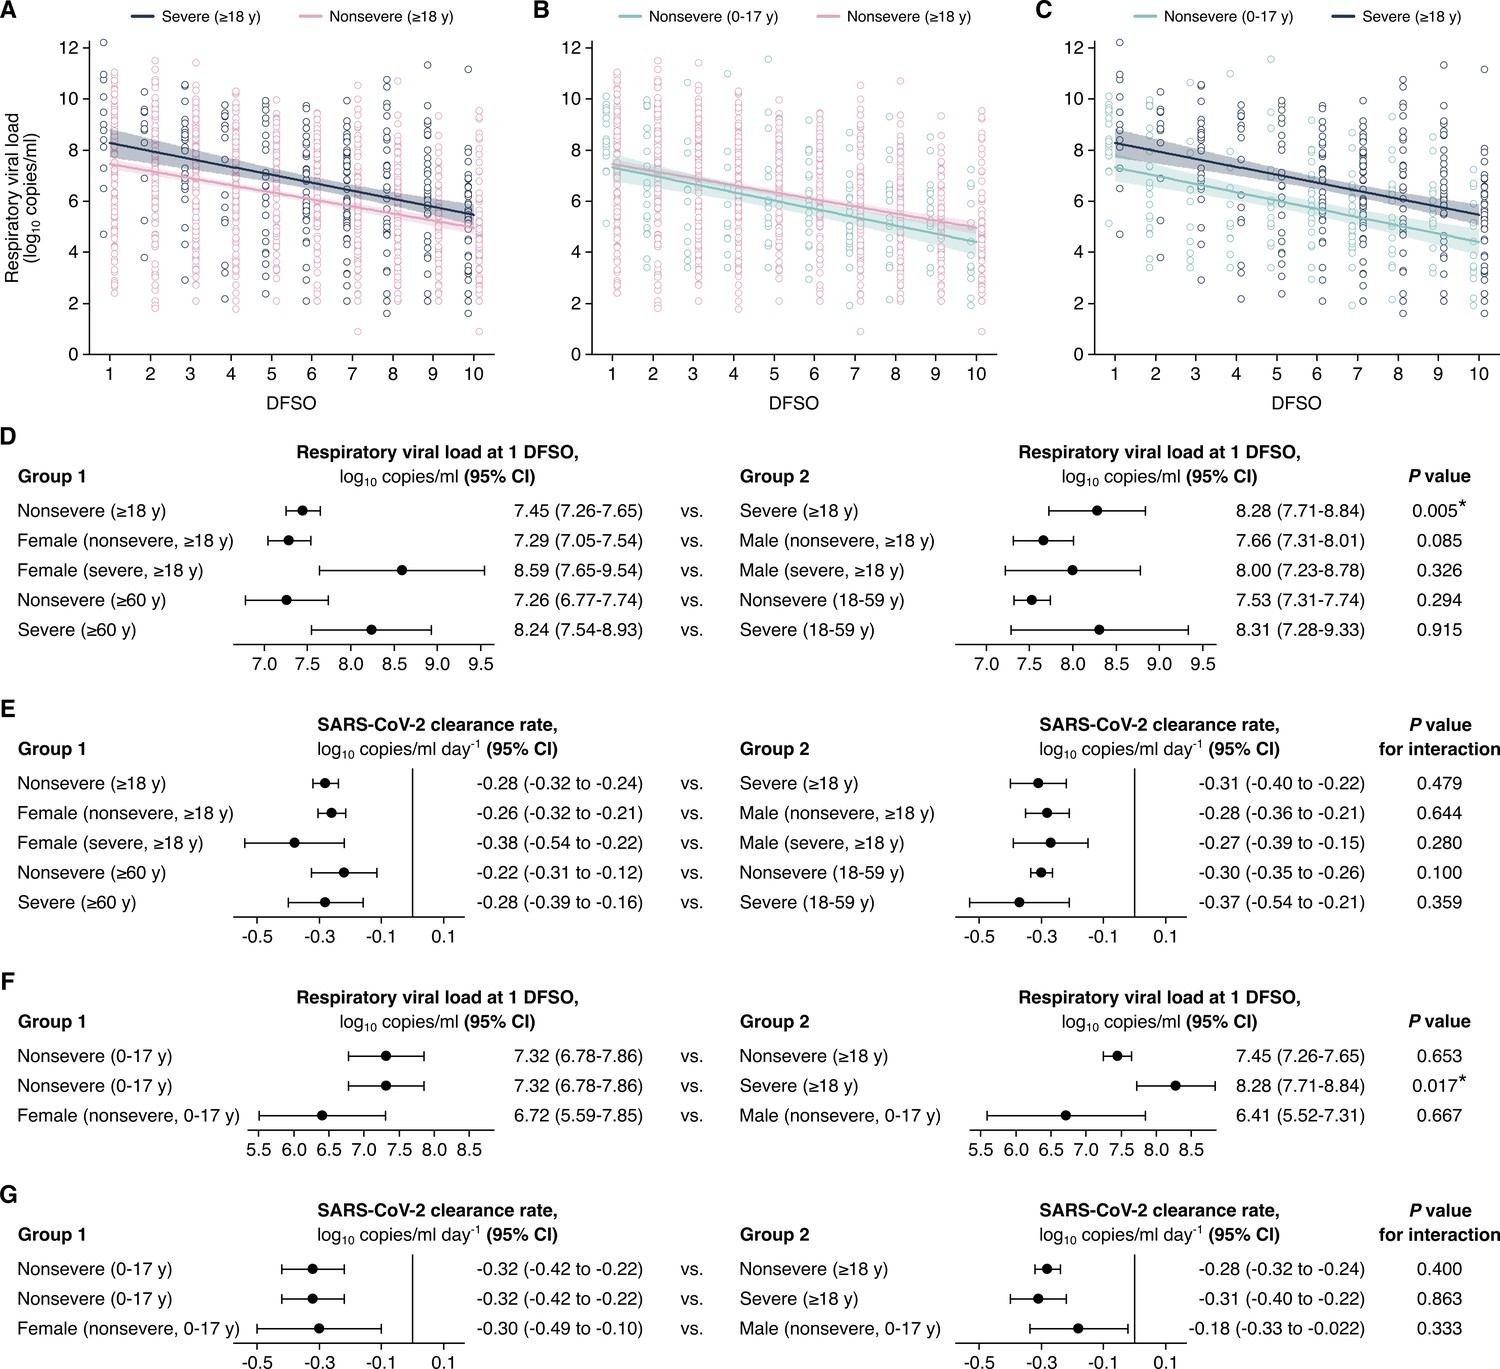
Comparison of severe acute respiratory syndrome coronavirus 2 (SARS-CoV-2) shedding in the upper respiratory tract (URT) across severity, sex, and age groups.
(A–C) URT shedding for severe and nonsevere adult (aged 18 years or older) coronavirus disease 2019 (COVID-19) (A), for nonsevere pediatric (aged 0–17 years) and nonsevere adult COVID-19 (B) and for nonsevere pediatric and severe adult COVID-19 (C). Open circles represent respiratory viral load (rVL) data and were offset from their day from symptom onset (DFSO) for visualization. Lines and bands show regressions and their 95% CIs, respectively. (D and E) Comparisons of URT shedding levels at 1 DFSO (D) and URT shedding dynamics (E) between severity, age, and sex groups for COVID-19. (F and G) Comparisons of URT shedding levels at 1 DFSO (F) and URT shedding dynamics (G) between pediatric and adult groups for COVID-19. The black line in (E) and (G) depicts 0, the threshold for no significant trend in SARS-CoV-2 clearance. Linear regression analyses with interaction determined p-values and compared shedding levels and dynamics between the two groups in each row.
Figure 2—figure supplement 1
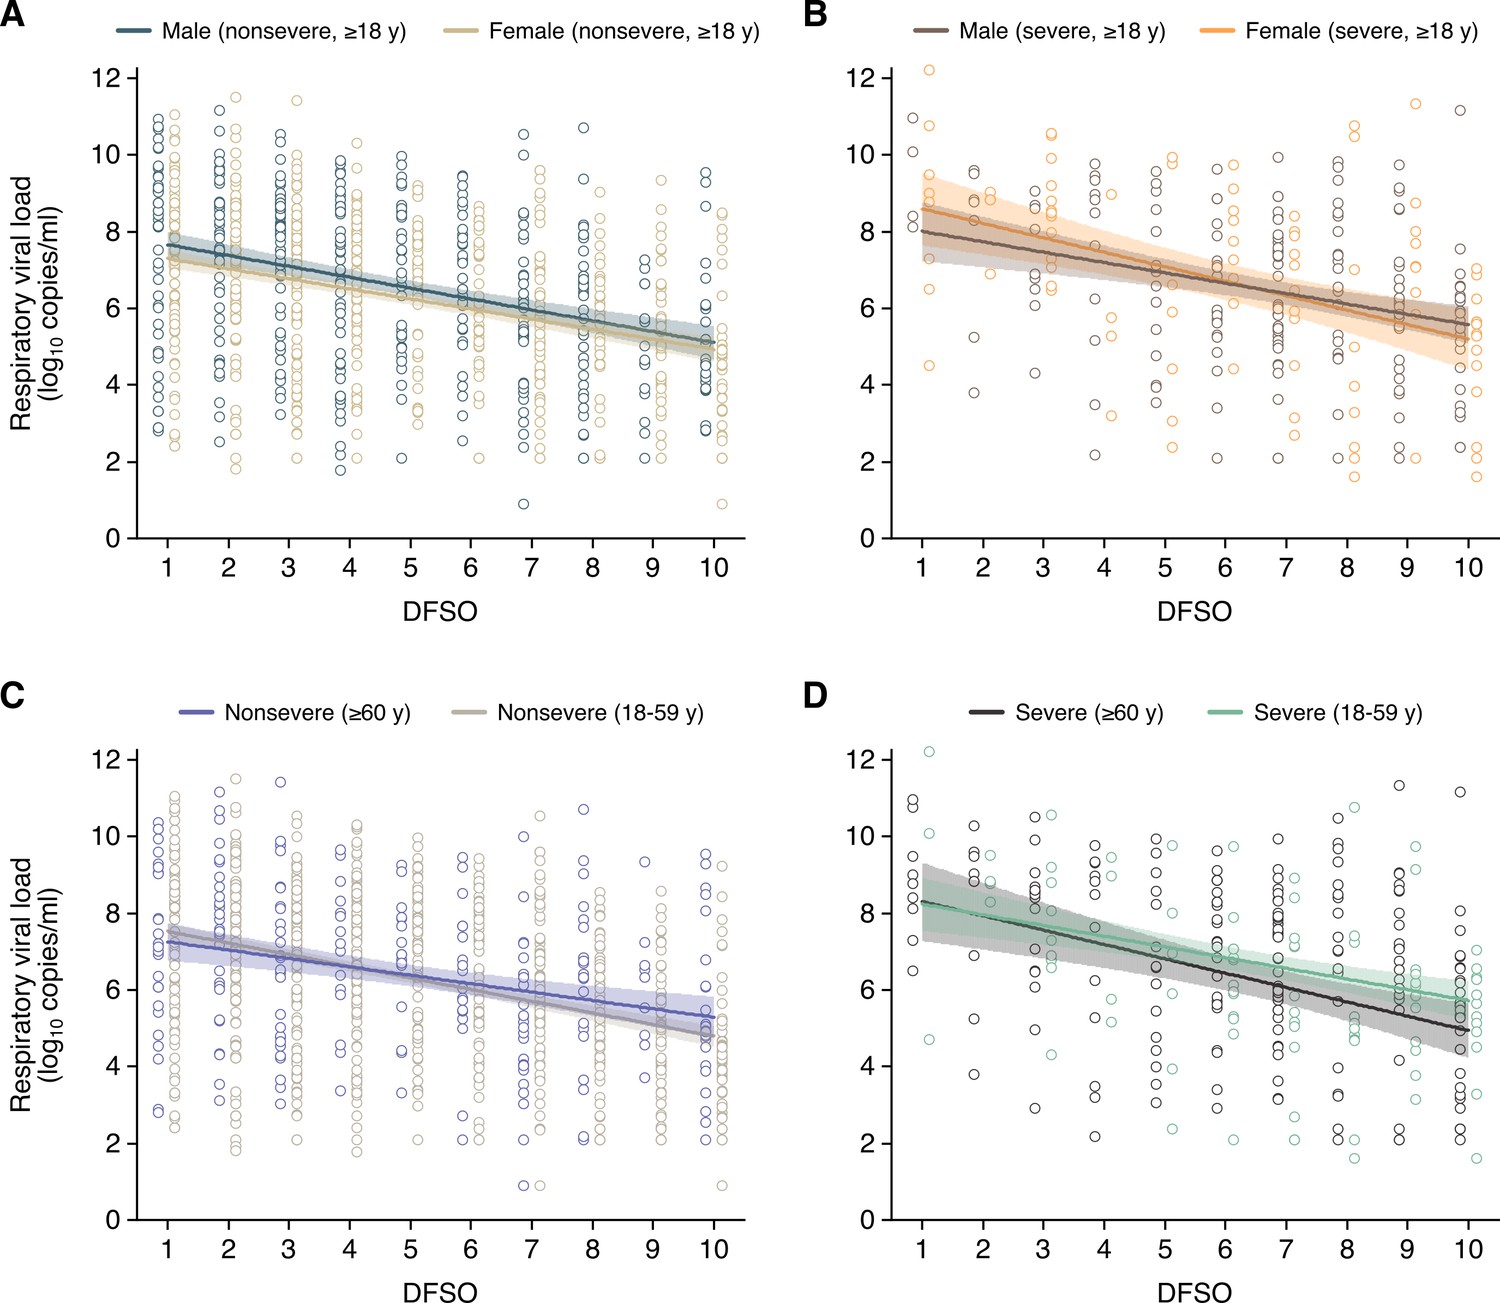
Severe acute respiratory syndrome coronavirus 2 (SARS-CoV-2) shedding in the upper respiratory tract (URT) for adult coronavirus disease 2019 (COVID-19).
(A–D) URT shedding for male and female adult (aged 18 years or older) cases with nonsevere COVID-19 (A), for male and female adult cases with severe COVID-19 (B), for older (aged 60 years or older) and younger (aged 18–59 years) adults with nonsevere COVID-19 (C) and for older and younger adults with severe COVID-19 (D). Open circles represent respiratory viral load (rVL) data and were offset from their day from symptom onset (DFSO) for visualization. Lines and bands show regressions and their 95% CIs, respectively.
Figure 2—figure supplement 2
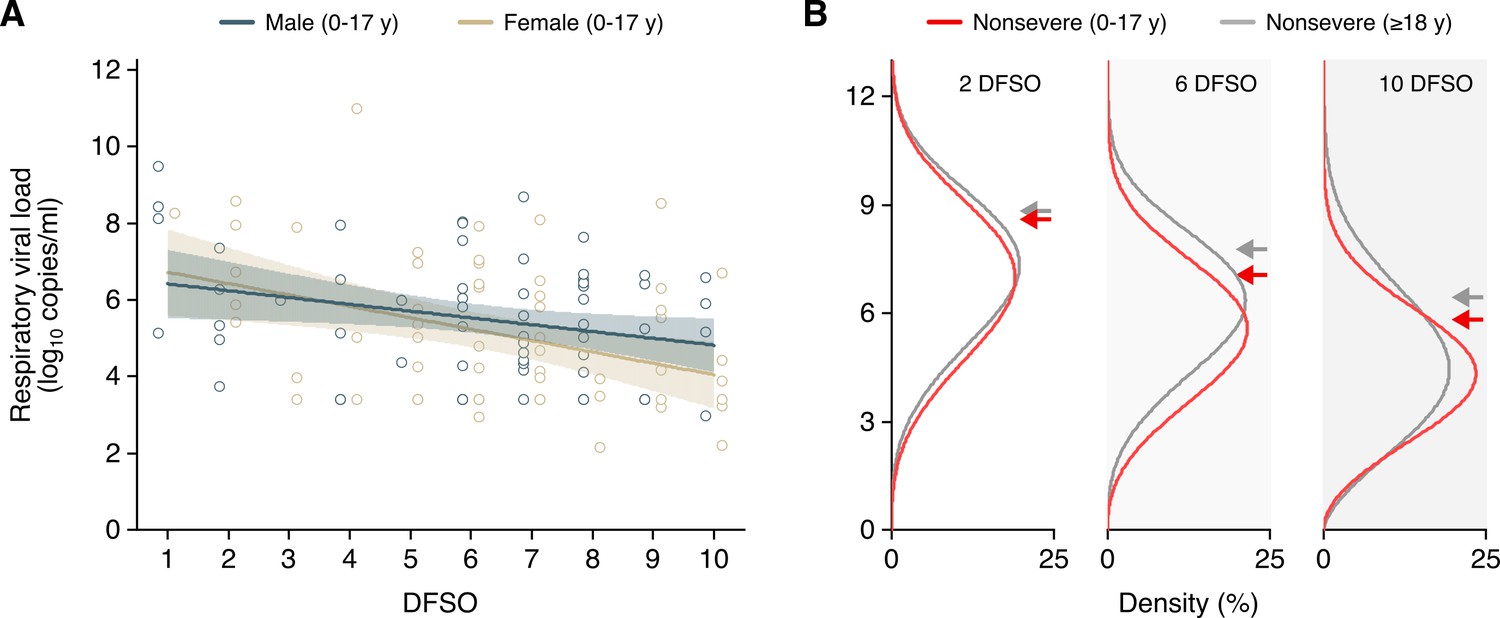
Severe acute respiratory syndrome coronavirus 2 (SARS-CoV-2) shedding in the upper respiratory tract (URT) for pediatric coronavirus disease 2019 (COVID-19).
(A) URT shedding for male and female pediatric (aged 0–17 years) cases with nonsevere COVID-19. Open circles represent respiratory viral load (rVL) data and were offset from their day from symptom onset (DFSO) for visualization. Lines and bands show regressions and their 95% CIs, respectively. (B) Estimated distributions at 2, 6, and 10 DFSO of URT shedding for adult (aged 18 years or older) and pediatric cases with nonsevere COVID-19.
Figure 3 with 1 supplement
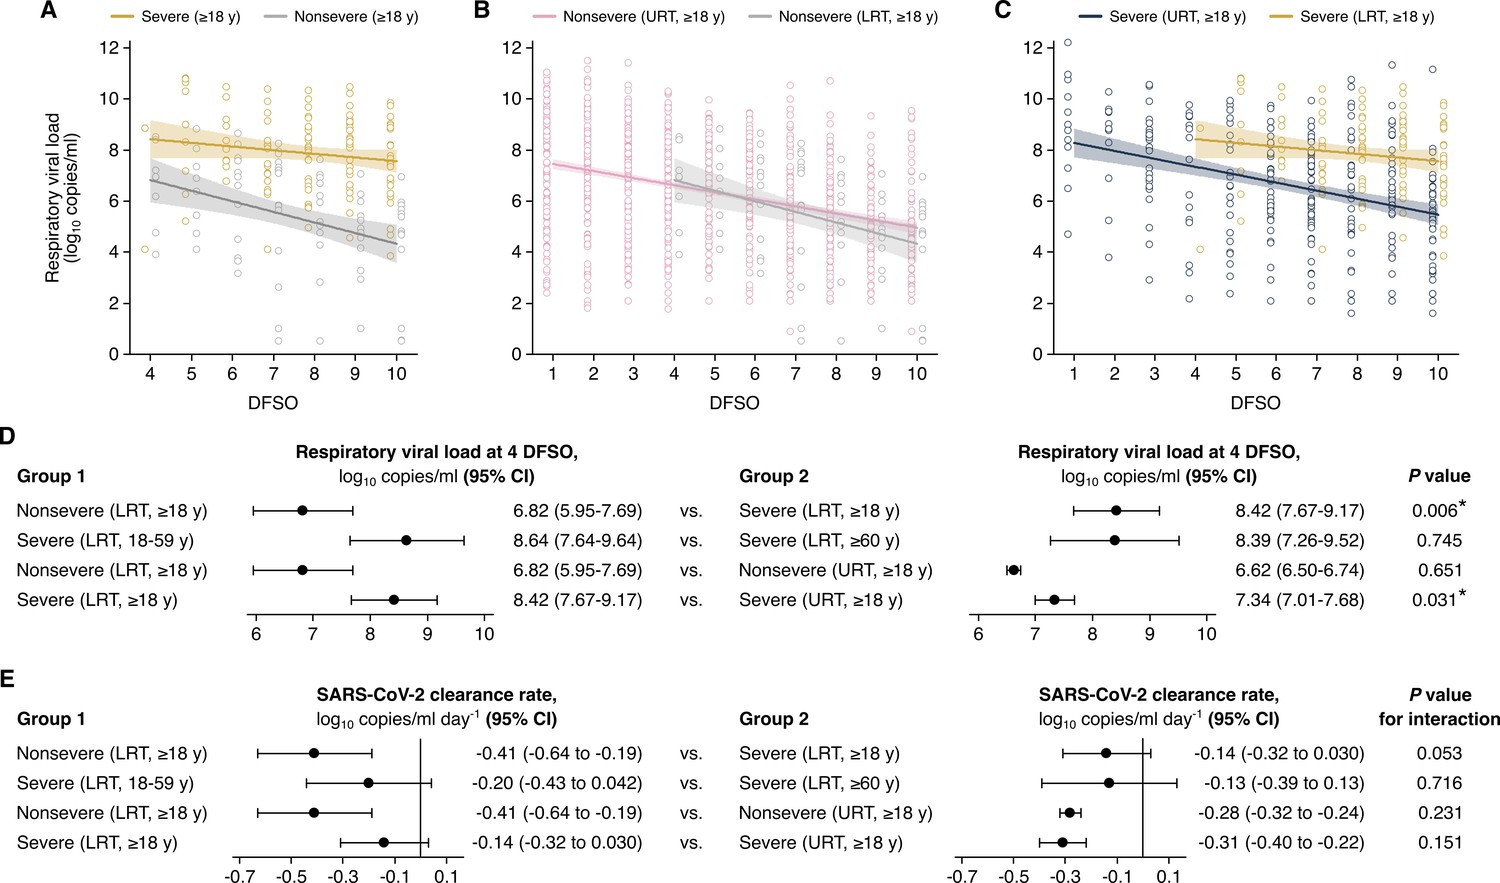
Comparison of severe acute respiratory syndrome coronavirus 2 (SARS-CoV-2) shedding in the lower respiratory tract (LRT) across severity and age groups and the upper respiratory tract (URT).
(A–C). Shedding in the LRT for severe and nonsevere adult (aged 18 years or older) COVID-19 (A), in the LRT and URT nonsevere adult COVID-19 (B) and in the LRT and URT severe adult COVID-19 (C). Open circles represent respiratory viral load (rVL) data and were offset from their day from symptom onset (DFSO) for visualization. Lines and bands show regressions and their 95% CIs, respectively. (D and E) Comparisons of shedding levels at 4 DFSO (D) and URT shedding dynamics (E) between severity and age groups in the LRT and between the LRT and URT. The black line in (E) depicts 0, the threshold for no significant trend in SARS-CoV-2 clearance. Linear regression analyses with interaction determined p-values and compared shedding levels and dynamics between the two groups in each row.
Figure 3—figure supplement 1

Severe acute respiratory syndrome coronavirus 2 (SARS-CoV-2) shedding in the lower respiratory tract (LRT) for adult coronavirus disease 2019 (COVID-19).
(A and B) LRT shedding for older (aged 60 years or older) or younger (aged 18–59 years) adult cases with severe COVID-19 (A) and male adult (aged 18 years or older) cases with severe COVID-19 (B). Open circles represent respiratory viral load (rVL) data and were offset from their day from symptom onset (DFSO) for visualization. Lines and bands show regressions and their 95% CIs, respectively.
Figure 4 with 3 supplements
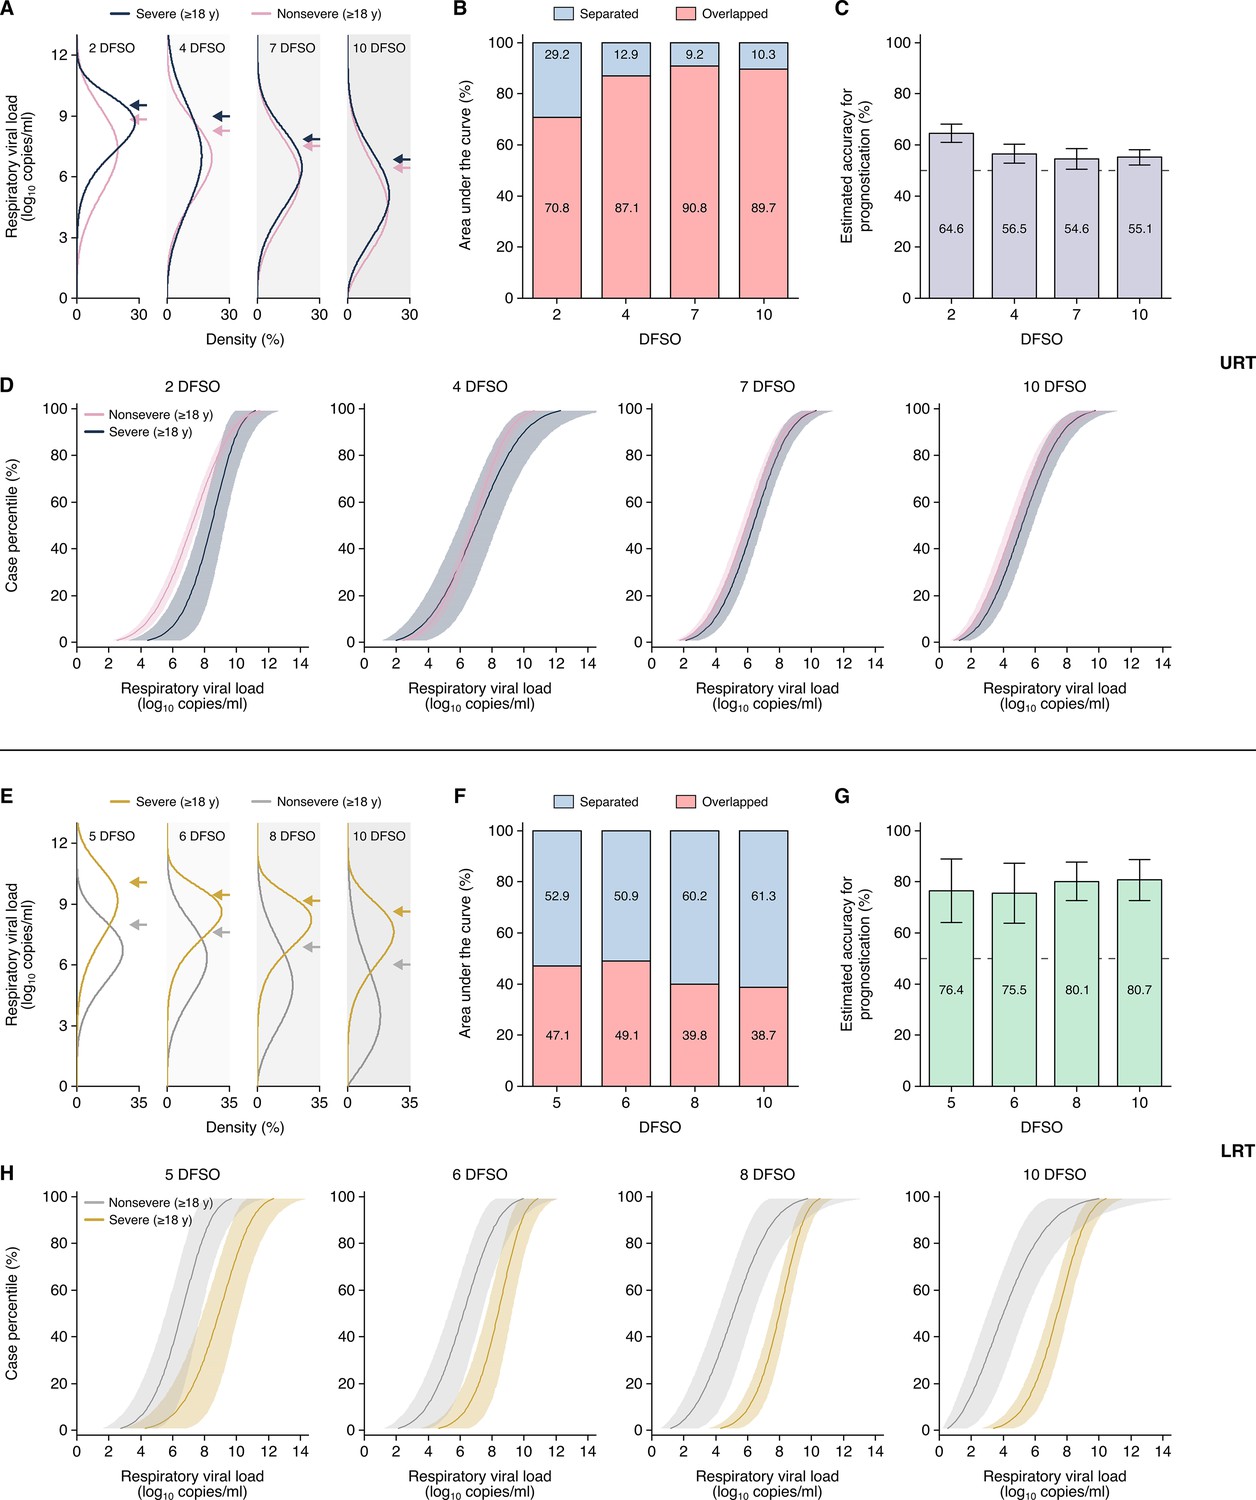
Heterogeneity in, and severity prognostication from, severe acute respiratory syndrome coronavirus 2 (SARS-CoV-2) shedding for adult coronavirus disease 2019 (COVID-19).
(A–D) Upper respiratory tract (URT) analyses. (A) Estimated distributions at 2, 4, 7, and 10 days from symptom onset (DFSO) of URT shedding for adults (aged 18 years or older) with nonsevere or severe COVID-19. (B) Overlapped or separated areas under the curve for the distributions in (A). (C) Estimated accuracy for using URT shedding of SARS-CoV-2 as a prognostic indicator for COVID-19 severity. (D) Cumulative distributions of URT shedding for adults with nonsevere or severe COVID-19 at various DFSO. (E–H) Lower respiratory tract (LRT) analyses. (E) Estimated distributions at 5, 6, 8, and 10 DFSO of LRT shedding for adults with nonsevere or severe COVID-19. (F) Overlapped or separated areas under the curve for the distributions in (E). (G) Estimated accuracy for using LRT shedding of SARS-CoV-2 as a prognostic indicator for COVID-19 severity. (H) Cumulative distributions of LRT shedding for adults with nonsevere or severe COVID-19 at various DFSO. Arrows in (A) and (E) denote the 80th case percentiles, in terms of respiratory viral load (rVL), for each group. For (D) and (H), the proportion of cases to the left of a given prognostic threshold are predicted to have nonsevere COVID-19, while those to the right of it are predicted to have severe disease. Sensitivity and specificity can then be estimated using the nonsevere and severe distributions. The dotted lines in (D) and (H) denote 50% accuracy.
Figure 4—figure supplement 1
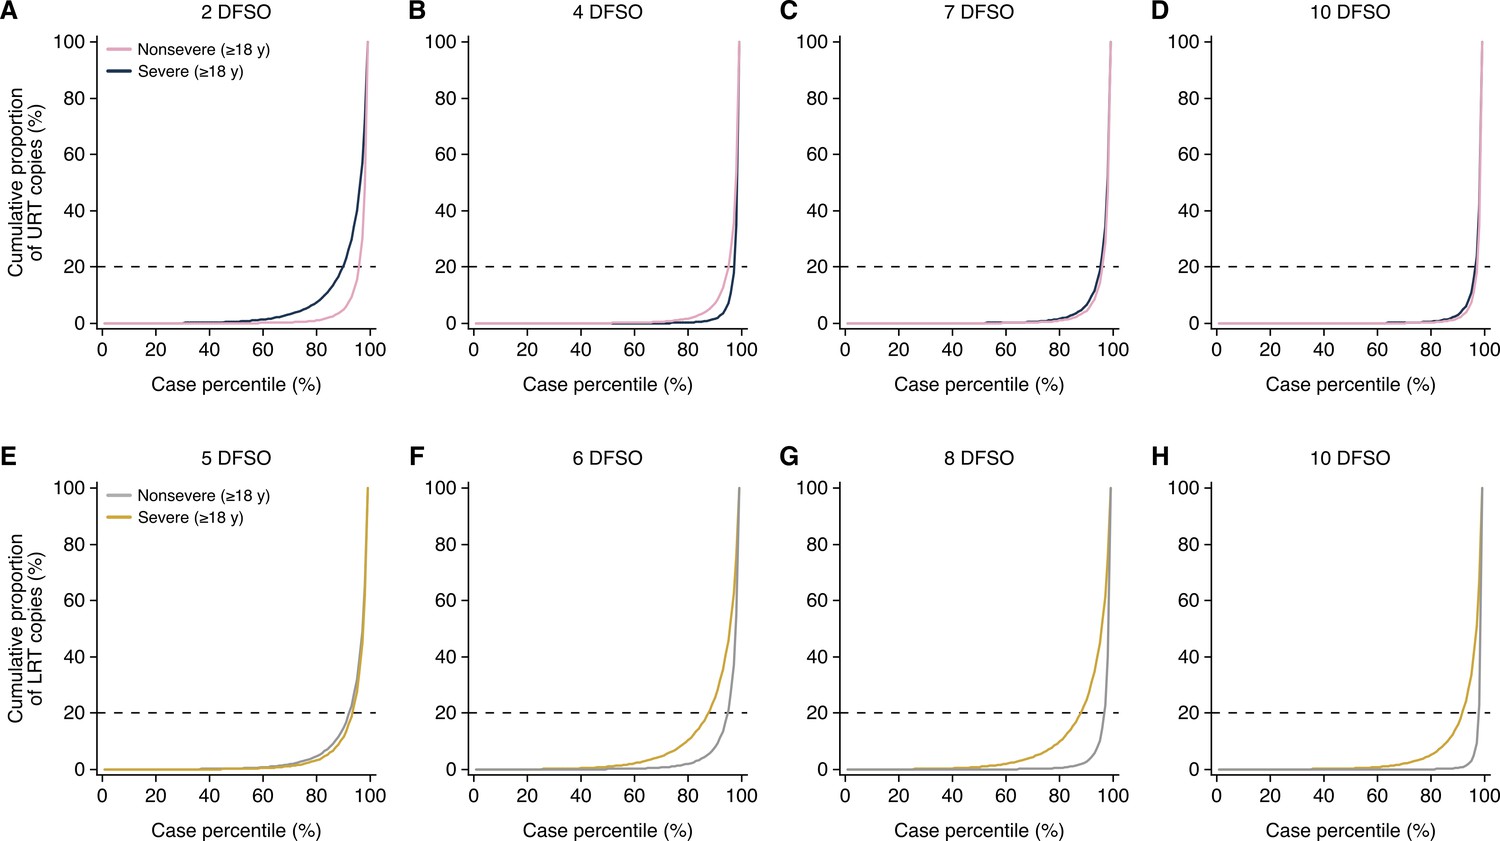
Few cases carry the majority of severe acute respiratory syndrome coronavirus 2 (SARS-CoV-2) copies in the upper respiratory tract (URT) and lower respiratory tract (LRT).
(A–D) Cumulative distribution of URT SARS-CoV-2 copies harbored in adults with nonsevere or severe COVID-19 at 2 (A), 4 (B), 7 (C), and 10 (D) days from symptom onset (DFSO). (E–H) Cumulative distribution of LRT SARS-CoV-2 copies harbored in adults with nonsevere or severe COVID-19 at 5 (A), 6 (B), 8 (C), and 10 (D) DFSO. These curves were based on the fitted Weibull distributions in copies/ml and estimate the proportion of cases that carry the total amount of SARS-CoV-2 in the URT or LRT. The dotted lines denote when the upper case percentiles harbor 80% of copies.
Figure 4—figure supplement 2
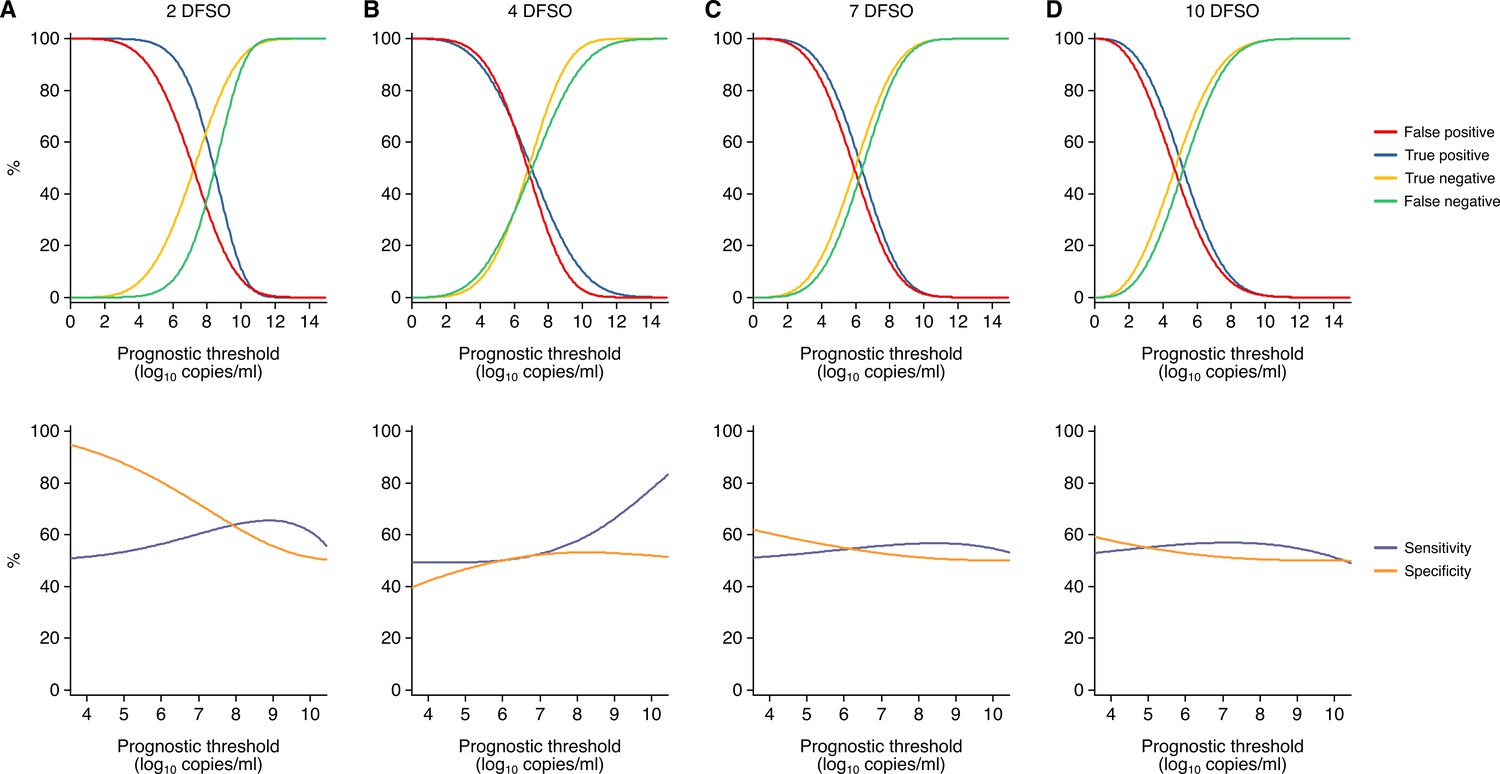
Estimated sensitivity and specificity of upper respiratory tract (URT) shedding as a prognostic indicator for severe acute respiratory syndrome coronavirus 2 (SARS-CoV-2) infection.
(A–D) Metrics for the accuracy of SARS-CoV-2 quantitation from the URT as a prognostic indicator for coronavirus disease 2019 (COVID-19) severity. Estimated true positive, true negative, false positive, and false negative (top) or sensitivity and specificity (bottom) at 2 (A), 4 (B), 7 (C), and 10 (D) days from symptom onset (DFSO) across SARS-CoV-2 respiratory viral loads as the prognostic threshold. As depicted throughout this study, these plots show respiratory viral loads (rVLs, viral RNA concentration in the respiratory tract) rather than specimen concentrations (viral RNA concentration quantitated from a respiratory specimen).
Figure 4—figure supplement 3
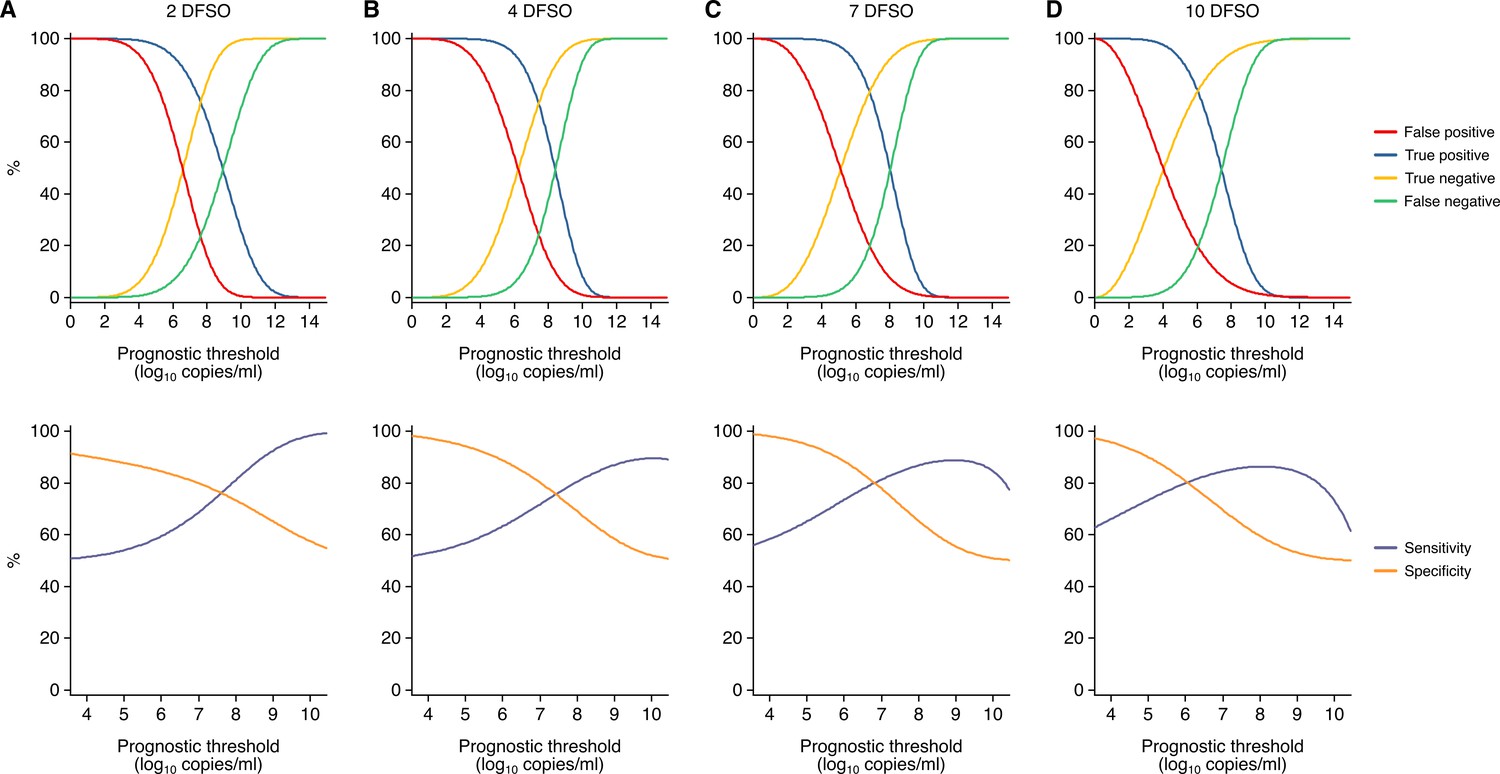
Estimated sensitivity and specificity of lower respiratory tract (LRT) shedding as a prognostic indicator for severe acute respiratory syndrome coronavirus 2 (SARS-CoV-2) infection.
(A–D) Metrics for the accuracy of SARS-CoV-2 quantitation from the LRT as a prognostic indicator for coronavirus disease 2019 (COVID-19) severity. Estimated true positive, true negative, false positive, and false negative (top) or sensitivity and specificity (bottom) at 2 (A), 4 (B), 7 (C), and 10 (D) days from symptom onset (DFSO) across SARS-CoV-2 respiratory viral loads (rVLs) as the prognostic threshold. As depicted throughout this study, these plots show rVLs (viral RNA concentration in the respiratory tract) rather than specimen concentrations (viral RNA concentration quantitated from a respiratory specimen).
Author response image 1
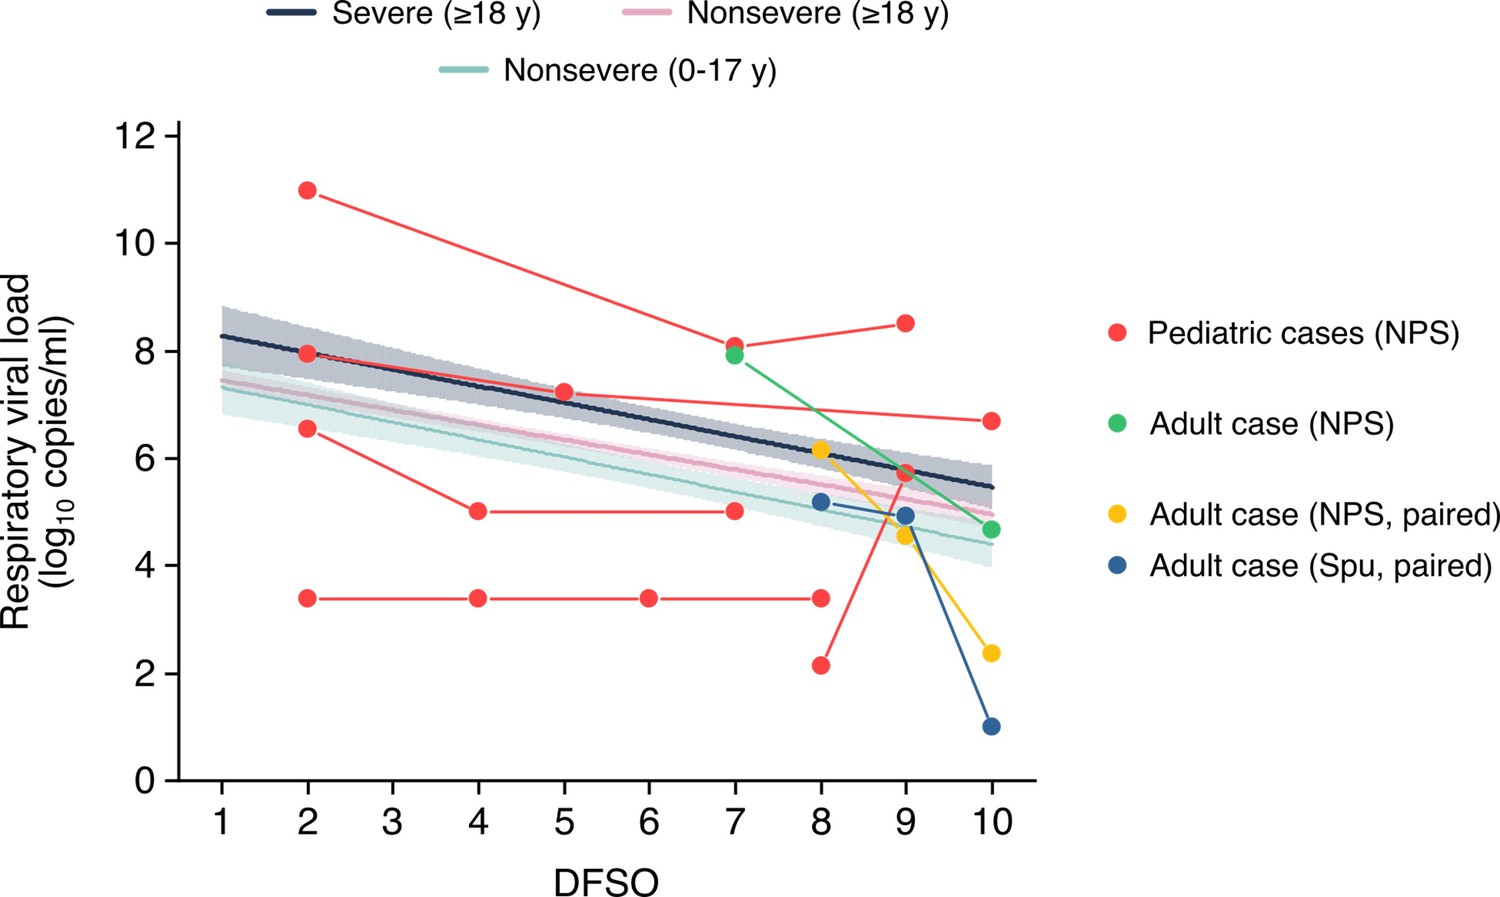
Respiratory viral loads from serially sampled asymptomatic cases.
Each set of connect dots represents a separate individual, except for one adult case which had paired NPS and Spu specimens. The data were overlaid on the regression lines for severe adult cases, nonsevere adult cases and nonsevere pediatric cases (Figure 2A-B). Data between 1-10 DFSO, as defined in the reviewer comment, is shown. The pediatric case with unchanged rVLs was below the detection limit for that study in the included DFSO. NPS, nasopharyngeal swab; Spu, sputum.
Tables
Table 1
Characteristics of adult and pediatric coronavirus disease 2019 (COVID-19) cases in the systematic dataset.
| Adult | Pediatric | |
|---|---|---|
| Cases, n | 1266 | 136 |
| URT specimens, n | 1513 | 192 |
| LRT specimens, n | 210 | 0 |
| Mean age (SD), years | 51.8 (18.0) | 8.7 (5.3) |
| Male, n (%) | 528 (44.0) | 63 (52.5) |
| Disease severity, n (%) | ||
| Asymptomatic | 2 (0.2) | 5 (3.7) |
| Mild | 710 (57.5) | 112 (83.6) |
| Moderate | 178 (14.4) | 17 (12.7) |
| Severe | 167 (13.5) | 0 (0.0) |
| Critical | 178 (14.4) | 0 (0.0) |
-
Adult cases were those aged 18 years or older, while pediatric cases were those aged younger than 18 years. Upper respiratory tract = URT. Lower respiratory tract = LRT.
Appendix 1—table 1
Characteristics of contributing studies.
| Study | Country | Case types* | No. of adult cases (nonsevere; severe) | No. of pediatric cases (nonsevere; severe) | URT specimens (ascertained†for age, sex, disease severity) | LRT specimens (ascertained†for age, sex, dis-ease severity) | Reported treatment (type)‡ | Volume of VTM reported | Specimen type (adjusted rVL)§ | Risk of bias¶ |
|---|---|---|---|---|---|---|---|---|---|---|
| Bal et al., 2020 | France | H, N, A, S | 39 (38; 1) | 0 | 47 (47; 47; 47) | 0 | N/A | No | NPS (yes) | ***** |
| Benotmane et al., 2020 | France | H, A, S | 37 (19; 18) | 0 | 47 (47; 47; 47) | 0 | Yes (azithromycin, other antibiotics, azole antifungals, lopinavir-ritonavir, hydroxychloroquine, tocilizumab, high-dose corticosteroid, mycophenolate mofetil withdrawal, mycophenolic acid withdrawal, calcineurin inhibitors withdrawal, mammalian target of rapamycin withdrawal, delayed belatacept administration) | No | NPS (yes) | ****** |
| Biguenet et al., 2021 | France | H, N, A, S | 453 (406; 47) | 0 | 453 (453; 453; 453) | 0 | Yes (antibiotics, oseltamivir, hydroxychloroquine, corticosteroids, lopinavir-ritonavir, remdesivir) | No | NPS (yes) | ******** |
| Fajnzylber et al., 2020 | USA | H, N, A, S | 25 (9; 16) | 0 | 31 (31; 31; 31) | 11 (11; 11) | Yes (remdesivir) | Yes | (NPS (yes), OPS (yes), Spu (yes)) | ******** |
| Han et al., 2020 | South Korea | H, P, S, As | 0 | 12 (12; 0) | 33 (33; 10; 33) | 0 | N/A | No | NPS (yes) | ******** |
| Hirotsu et al., 2020 | Japan | H, A, S | 3 (3; 0) | 0 | 9 (9; 9; 9) | 0 | N/A | No | NPS (yes) | **** |
| Hurst et al., 2020 | USA | C, A, P, S, Ps | 17 (17; 0) | 76 (76; 0) | 93 (93; 93; 93) | 0 | Yes (remdesivir) | No | NPS (yes) | ******** |
| Iwasaki et al., 2020 | Japan | H, A, S | 5 (4; 1) | 0 | 5 (5; 5; 5) | 0 | N/A | No | NPS (yes) | **** |
| L’Huillier et al., 2020 | Switzerland | H, P, S | 0 | 23 (23; 0) | 23 (23; 0; 23) | 0 | N/A | No | NPS (yes) | ******** |
| Lavezzo et al., 2020 | Italy | H, C, A, P, S, Ps | 40 (34; 6) | 2 (2; 0) | 6 (69; 69; 69) | 0 | N/A | Yes | NPS (yes), OPS (yes) | ******* |
| Pan et al., 2020 | China | H, A, S, Ps | 2 (2; 0) | 0 | 13 (0; 0; 13) | 12 (0; 12) | N/A | No | OPS (yes), Spu (no) | **** |
| Peng et al., 2020 | China | H, A, S | 6 (6; 0) | 0 | 6 (6; 6; 6) | 0 | Yes (arbidol, lopinavir, ritonavir, interferon alfa-2b inhalation) | No | OPS (yes) | ******** |
| Shrestha et al., 2020 | USA | N, A, S | 196 (196; 0) | 1 (1; 0) | 213 (213; 213; 213) | 0 | Yes (indicated no hydroxychloroquine or other COVID-19-related treatments were used) | No | NPS (yes) | ******* |
| Sun et al., 2020 | China | H, A, S | 6 (3; 3) | 0 | 6 (0; 0; 6) | 0 | N/A | No | NPS (yes), OPS (yes), Spu (no) | ***** |
| To et al., 2020 | China | H, A, S | 4 (2; 2) | 0 | 2 (0; 0; 2) | 2 (0; 2) | N/A | Yes | ETA (yes), POS (yes) | ********* |
| van Kampen et al., 2021 | The Netherlands | H, A, S | 171 (8; 163) | 0 | 57 (57; 57; 57) | 114 (114, 114) | Yes (lopinavir–ritonavir with or without ribavirin or interferon beta 1b) | Yes | NPS (yes), Spu (yes) | ******** |
| Vetter et al., 2020 | Switzerland | H, A, S | 5 (4; 1) | 0 | 63 (63; 63; 63) | 0 | Yes (paracetamol, alfuzosin, ibuprofen, enoxaparin, amoxicillin clarithromycin, piperacillin, tazobactam, lopinavir, ritonavir, folic acid) | Yes | NPS (yes), OPS (yes) | ********* |
| Wölfel et al., 2020 | Germany | H, A, S, As | 9 (9; 0) | 0 | 71 (71; 0; 71) | 70 (70; 0; 70) | N/A | Yes | NPS (yes), OPS (yes), Spu (no) | ******* |
| Wyllie et al. | USA | H, A, P, S | 31 (31; 0) | 2 (2; 0) | 33 (0; 0; 33) | 0 | N/A | Yes | NPS (yes) | ******* |
| Xu et al., 2020a | China | H, P, S, Ps, As | 0 | 9 (9; 0) | 39 (39; 39; 39) | 0 | Yes (α-interferon oral spray, azithromycin) | No | NPS (yes) | ******** |
| Yazdanpanah, 2021 | France | H, A, Ps, S | 125 (64; 61) | 0 | 173 (173; 173; 173) | 0 | Yes (remdesivir, hydroxychloroquine,lopinavir-ritonavir) | No | NPS (yes) | ******** |
| Yilmaz et al., 2021 | Sweden | H, A, S | 52 (37; 12) | 0 | 102 (102; 102; 102) | 0 | N/A | Yes | NPS (yes), OPS (yes) | ******* |
| Yonker et al., 2020 | USA | H, A, P, S | 3 (3; 0) | 14 (13; 1) | 14 (14; 0; 14) | 0 | N/A | No | NPS (yes) | ****** |
| Zhang et al., 2021 | China | H, A, S | 4 (3; 1) | 0 | 10 (10; 10; 10) | 0 | N/A | No | NPS (yes), OPS (yes) | ******** |
| Zheng et al., 2020 | China | H, A, S | 17 (10; 7) | 0 | 13 (13; 0; 13) | 12 (12; 0; 12) | Yes (gammaglobulin, glucocorticoids, antibiotics, antiviral combination of interferon α inhalation, lopinavir-ritonavir combination, arbidol, favipiravir, and darunavir-cobicistat) | No | POS (yes), Spu (yes) | ******* |
| Zou et al., 2020 | China | H, A, S, As | 16 (13; 3) | 0 | 88 (88; 88; 88) | 0 | N/A | No | NPS (yes), OPS (yes) | ******* |
-
*
Hospitalized cases were those admitted to a hospital. Non-admitted cases were those tested in a hospital setting but not admitted. Community cases were those tested in a community setting.
-
†
The number of specimens for which their cases were ascertained for age group (aged 0–17 years, 18–59 years, or 60 years or older), sex (male or female), or disease severity (nonsevere or severe) via data reported in the study or via data request. All specimens were ascertained for the DFSO on which they were taken.
-
‡
Responses of ‘N/A’ indicate that no details were reported on treatment for COVID-19 in the study.
-
§
Specimen measurements were converted to rVLs based on the reported, or assumed, dilution factor for specimens immersed in transport media.
-
¶
The modified Joanna Briggs Institute (JBI) critical appraisal checklist was used, with more stars indicating lower risk of bias. Studies were considered to have low risk of bias if they met the majority of the items (≥6/10 items) and met item 1. Results from each study are shown in Appendix—table 2.
-
H = hospitalized; N = non-admitted; C = community; A = adult (aged 18 years or older); P = pediatric (aged 0–17 years); S = symptomatic; Ps = presymptomatic; As = asymptomatic; rVL = respiratory viral load; endotracheal aspirate (ETA); nasopharyngeal swab (NPS); oropharyngeal swab (OPS); posterior oropharyngeal saliva (POS); and sputum (Spu).
Appendix 1—table 2
Assessment of risk of bias based on the modified Joanna Briggs Institute (JBI) critical appraisal checklist.
| Checklist items* | ||||||||||
|---|---|---|---|---|---|---|---|---|---|---|
| Study | 1 | 2 | 3 | 4 | 5 | 6 | 7 | 8 | 9 | 10 |
| Bal et al., 2020 | N | Y | U | U | N | Y | Y | N | Y | Y |
| Benotmane et al., 2020 | N | Y | Y | Y | N | Y | Y | N | Y | Y |
| Biguenet et al., 2021 | Y | Y | Y | Y | N | Y | Y | N | Y | Y |
| Fajnzylber et al., 2020 | Y | Y | Y | Y | N | Y | Y | Y | N | Y |
| Han et al., 2020 | Y | Y | Y | Y | N | Y | Y | N | Y | Y |
| Hirotsu et al., 2020 | Y | N | U | U | N | Y | Y | N | N | Y |
| Hurst et al., 2020 | Y | Y | Y | Y | N | Y | Y | N | Y | Y |
| Iwasaki et al., 2020 | Y | N | U | U | N | Y | Y | N | N | Y |
| L’Huillier et al., 2020 | Y | Y | Y | Y | N | Y | Y | N | Y | Y |
| Lavezzo et al., 2020 | Y | Y | N | Y | N | Y | Y | N | Y | Y |
| Pan et al., 2020 | Y | N | U | U | N | Y | Y | N | N | Y |
| Peng et al., 2020 | Y | Y | Y | Y | N | Y | Y | N | Y | Y |
| Shrestha et al., 2020 | N | Y | Y | Y | N | Y | Y | N | Y | Y |
| Sun et al., 2020 | N | N | Y | Y | N | Y | Y | N | N | Y |
| To et al., 2020 | Y | Y | Y | Y | N | Y | Y | Y | Y | Y |
| van Kampen et al., 2021 | Y | Y | Y | Y | N | Y | Y | N | Y | Y |
| Vetter et al., 2020 | Y | Y | Y | Y | N | Y | Y | Y | Y | Y |
| Wölfel et al. (2020) | Y | Y | N | U | N | Y | Y | Y | Y | Y |
| Wyllie et al., 2020 | Y | Y | U | Y | N | Y | Y | Y | N | Y |
| Xu et al., 2020b | Y | Y | Y | Y | N | Y | Y | N | Y | Y |
| Yazdanpanah, 2021 | Y | Y | Y | Y | N | Y | Y | N | Y | Y |
| Yilmaz et al., 2021 | Y | Y | U | U | N | Y | Y | Y | Y | Y |
| Yonker et al., 2020 | Y | Y | N | U | N | Y | Y | N | Y | Y |
| Zhang et al., 2021 | Y | Y | Y | Y | N | Y | Y | N | Y | Y |
| Zheng et al., 2020 | Y | Y | Y | Y | N | Y | Y | N | N | Y |
| Zou et al., 2020 | N | Y | Y | Y | N | Y | Y | N | Y | Y |
-
*
Descriptions of each item are included in the modified JBI critical appraisal checklist. Grey, yellow, and red represent yes (Y), unclear (U), and no (N), respectively.
Appendix 1—table 3
Summary of respiratory shedding levels and dynamics for coronavirus disease 2019 (COVID-19) groups.
| Group | n†* | rVL*† (95% CI), log10 copies/ml | SARS-CoV-2 clearance rate | ||
|---|---|---|---|---|---|
| At 1 DFSO | At 4 DFSO | Estimate (95% CI), log10 copies/ml/day | p-Value‡ | ||
| URT, ≥18 years | |||||
| Nonsevere | 1 092 | 7.45 (7.26–7.65) | 6.62 (6.50–6.74) | –0.28 (−0.32 to −0.24) | <0.001 |
| Severe | 289 | 8.28 (7.71–8.84) | 7.34 (7.01–7.68) | –0.31 (−0.40 to −0.22) | <0.001 |
| Male (nonsevere) | 382 | 7.66 (7.31–8.01) | – | –0.28 (−0.36 to −0.21) | <0.001 |
| Female (nonsevere) | 618 | 7.29 (7.05–7.54) | – | –0.26 (−0.32 to −0.21) | <0.001 |
| Male (severe) | 175 | 8.00 (7.23–8.78) | – | –0.27 (−0.39 to −0.15) | <0.001 |
| Female (severe) | 89 | 8.59 (7.65–9.54) | – | –0.38 (−0.54 to −0.22) | <0.001 |
| Nonsevere (18–59 years) | 857 | 7.53 (7.31–7.74) | – | –0.30 (−0.35 to −0.26) | <0.001 |
| Nonsevere ( ≥ 60 years) | 212 | 7.26 (6.77–7.74) | – | –0.22 (−0.31 to −0.12) | <0.001 |
| Severe (18–59 years) | 89 | 8.31 (7.28–9.33) | – | –0.37 (−0.54 to −0.21) | <0.001 |
| Severe ( ≥ 60 years) | 192 | 8.24 (7.54–8.93) | – | –0.28 (−0.39 to −0.16) | <0.001 |
| LRT, ≥ 18 years§ | |||||
| Nonsevere | 80 | – | 6.82 (5.95–7.69) | –0.41 (−0.64 to −0.19) | <0.001 |
| Severe | 121 | – | 8.42 (7.67–9.17) | –0.14 (−0.32 to 0.030) | 0.105¶ |
| Male (severe) | 94 | – | 7.84 (7.03–8.65) | 0.001 (−0.16 to 0.19) | 0.988¶ |
| Severe (18–59 years) | 55 | – | 8.64 (7.64–9.64) | –0.20 (−0.43 to 0.042) | 0.105¶ |
| Severe ( ≥ 60 years) | 65 | – | 8.39 (7.26–9.52) | –0.13 (−0.39 to 0.13) | 0.316¶ |
| URT, 0–17 years | |||||
| Overall | 180 | 7.32 (6.78–7.86) | – | –0.32 (−0.42 to −0.22) | <0.001 |
| Male | 64 | 6.41 (5.52–7.31) | – | –0.18 (−0.33 to −0.022) | 0.026 |
| Female | 58 | 6.72 (5.59–7.85) | – | –0.30 (−0.49 to −0.10) | 0.004 |
-
*
Respiratory viral loads (rVLs) were based on the regression estimate at 1 day from symptom onset (DFSO) for upper respiratory tract (URT) shedding or 4 DFSO for lower respiratory tract (LRT) shedding. Estimates at 4 DFSO were included for the nonsevere and severe URT (≥18 years) groups, as they were compared with their LRT counterparts.
-
†
n represents the number of rVL samples per group (from 1 to 10 DFSO for URT shedding or 4 to 10 DFSO for LRT shedding).
-
‡
p-Value for the clearance rate was based on the regression parameter (t-test).
-
§
There was lower sample numbers in the nonsevere groups and female (LRT, severe, ≥18 years) group, and we did not include these analyses.
-
¶
Non-significance (p > 0.05).
Appendix 1—table 4
Summary of statistical comparisons on severe acute respiratory syndrome coronavirus 2 (SARS-CoV-2) shedding, across the respiratory tract, coronavirus disease 2019 (COVID-19) severity, sex, and age groups.
| p-Value* | |||
|---|---|---|---|
| Group 1 | Group 2 | Main effect† | Interaction‡ |
| URT, ≥18 years | |||
| Nonsevere | Severe | 0.005* | 0.479 |
| Female (nonsevere) | Male (nonsevere) | 0.085 | 0.644 |
| Female (severe) | Male (severe) | 0.326 | 0.280 |
| Nonsevere (18–59 years) | Nonsevere ( ≥ 60 years) | 0.294 | 0.100 |
| Severe (18–59 years) | Severe ( ≥ 60 years) | 0.915 | 0.359 |
| LRT, ≥18 years§ | |||
| Nonsevere | Severe | 0.006* | 0.053 |
| Severe (18–59 years) | Severe ( ≥ 60 years) | 0.745 | 0.716 |
| URT vs. LRT, ≥18 years | |||
| Nonsevere (URT, ≥18 years) | Nonsevere (LRT, ≥18 years) | 0.651 | 0.231 |
| Severe (URT, ≥18 years) | Severe (LRT, ≥18 years) | 0.031* | 0.151 |
| URT, 0–17 years | |||
| Nonsevere (0–17 years) | Nonsevere (≥18 years) | 0.653 | 0.400 |
| Nonsevere (0–17 years) | Severe ( ≥ 18 years) | 0.017* | 0.863 |
| Female (nonsevere) | Male (nonsevere) | 0.667 | 0.333 |
-
*
p < 0.05.
-
†
p-Value for the main effect in linear regression analysis compares the mean respiratory viral loads (rVLs) at 1 day from symptom onset (DFSO) for the upper respiratory tract (URT) or, for any analyses including the lower respiratory tract (LRT), at 4 DFSO.
-
‡
p-Value for interaction in linear regression analysis describes the difference in respiratory shedding dynamics along the time course of disease.
-
§
There were small sample sizes in the nonsevere group and female (LRT, severe, ≥18 years) group, and these analyses were not included.
Additional files
Download links
A two-part list of links to download the article, or parts of the article, in various formats.
Downloads (link to download the article as PDF)
Open citations (links to open the citations from this article in various online reference manager services)
Cite this article (links to download the citations from this article in formats compatible with various reference manager tools)
SARS-CoV-2 shedding dynamics across the respiratory tract, sex, and disease severity for adult and pediatric COVID-19
eLife 10:e70458.
https://doi.org/10.7554/eLife.70458


