Transcriptomic atlas of midbrain dopamine neurons uncovers differential vulnerability in a Parkinsonism lesion model
- Department of Cell and Molecular Biology, Karolinska Institutet, Sweden
- Department of Neurology, Karolinska University Hospital, Sweden
- Department of Clinical Neuroscience, Karolinska Institutet, Sweden
Figures
Figure 1 with 3 supplements
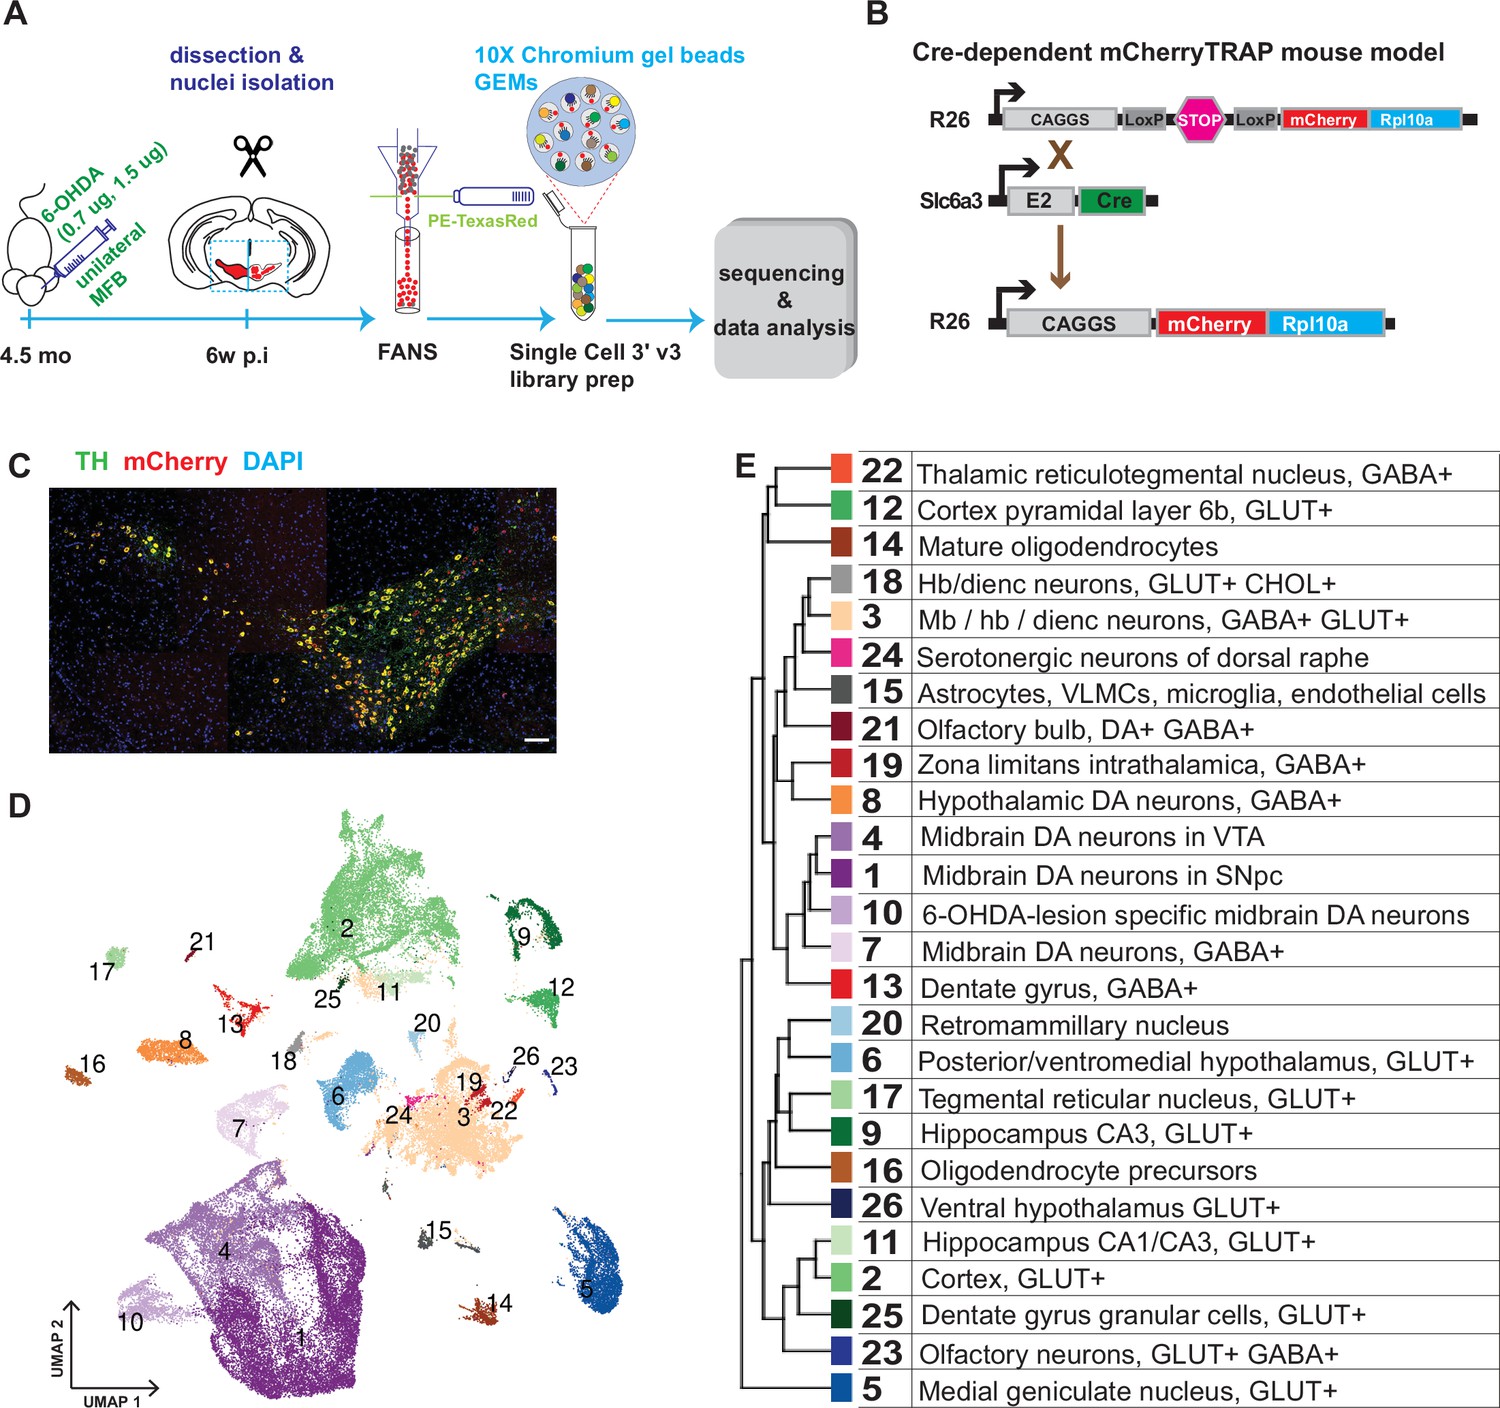
Generation of a snRNAseq dataset from the mouse midbrain.
(A) Schematic design of the study, unilateral injection of low doses of 6-OHDA (0.7, 1.5 µg/µl) in the medial forebrain bundle (MFB), followed by dissection, nuclei isolation and enrichment via FANS, before library preparation, sequencing, and data analysis. (B) Transgenic, Cre-dependent mCherryTRAP mouse model. Slc6a3Cre and TrapCfl lines were intercrossed to generate Slc6a3Cre/+; TrapCfl/fl mice. (C) Immunohistochemical staining of the mouse ventral midbrain coronal section, showing the overlap of TH and mCherry. Scale bar = 100 μm. (D) UMAP projection of the all-nuclei dataset, with cluster color-coding. (E) Hierarchical dendrogram of the identified clusters and their descriptions with the same color-coding.
Figure 1—figure supplement 1
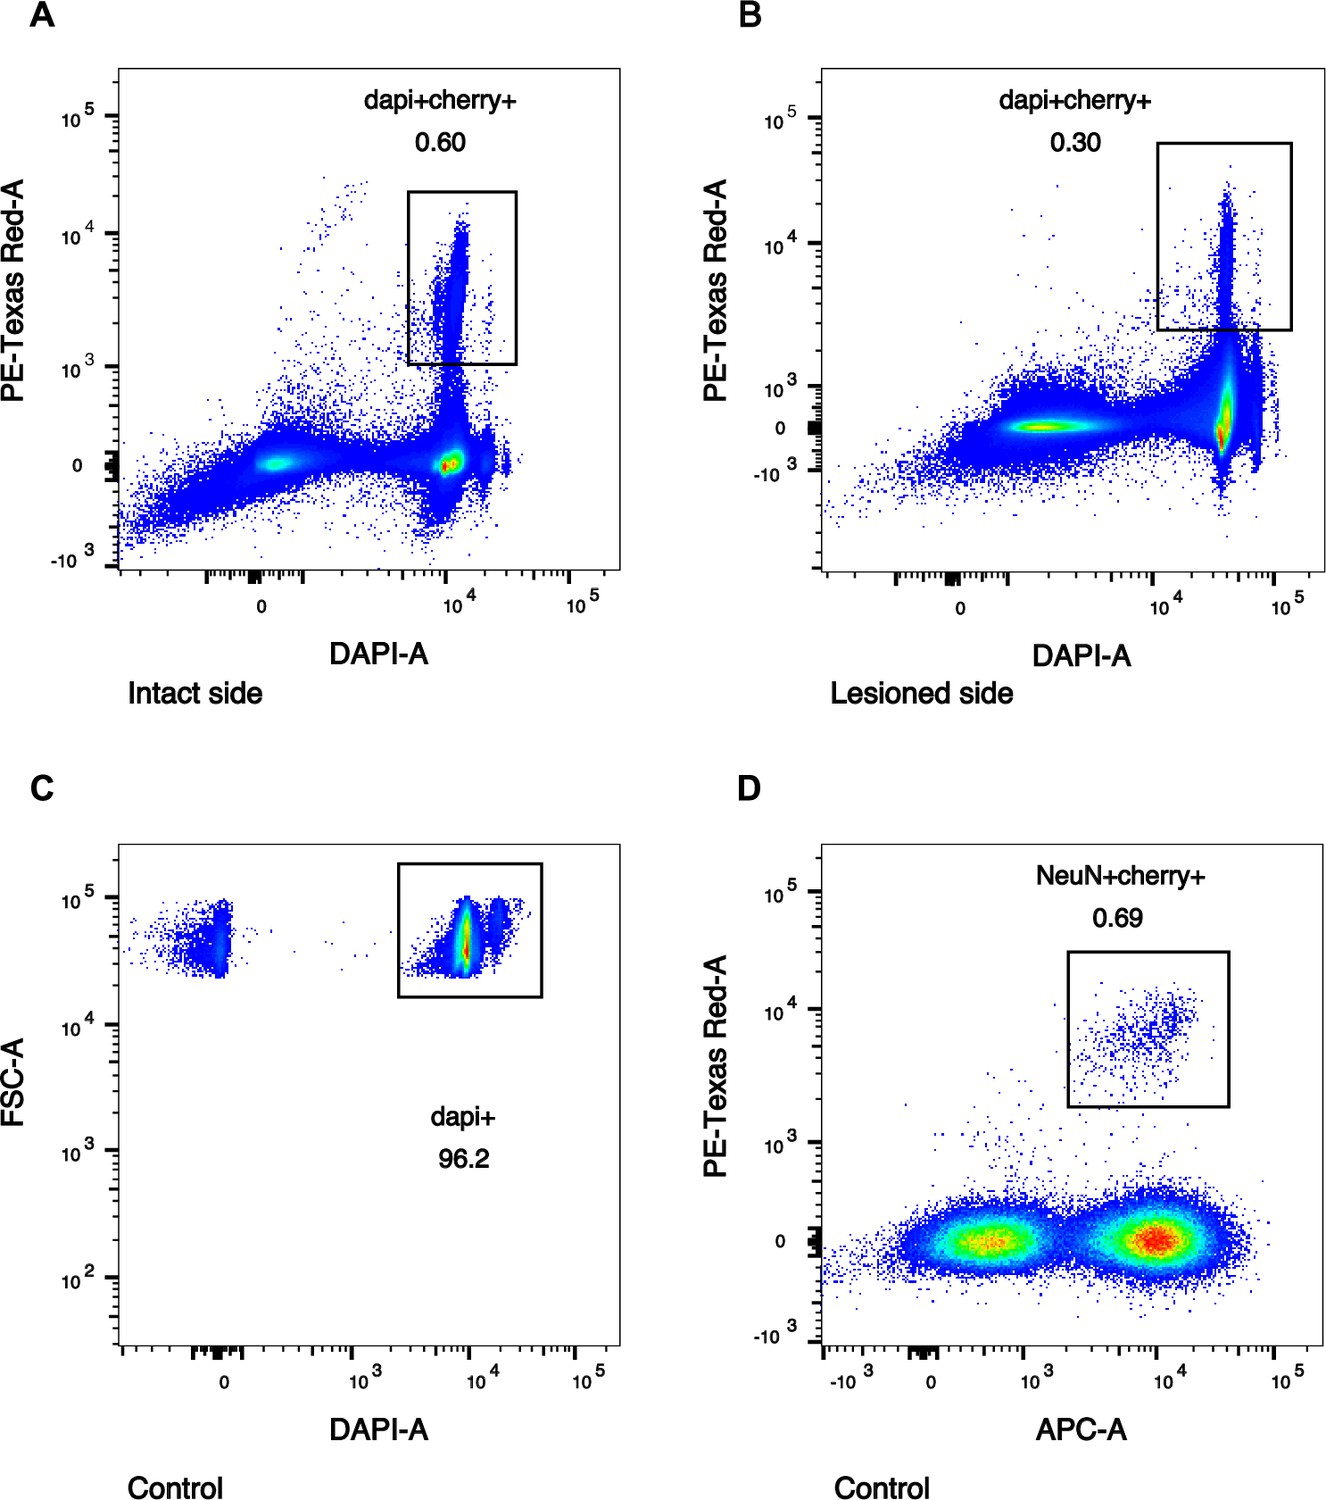
FANS plots for intact, lesioned, and untreated nuclei sorting.
Representative FACS plots, enriching for midbrain dopaminergic nuclei. PE-Texas Red-A (y-axis) represents mCherry channel. (A, B) The DAPI+Cherry+ gates were set to select for all mCherry+ nuclei in intact (A) and lesioned (B) samples. (C, D) Control samples’ gates were first set to select for all DAPI+ nuclei (C), followed by gating for NeuN+Cherry+ nuclei (D). APC-A (x-axis) represents NeuN antibody channel.
Figure 1—figure supplement 2
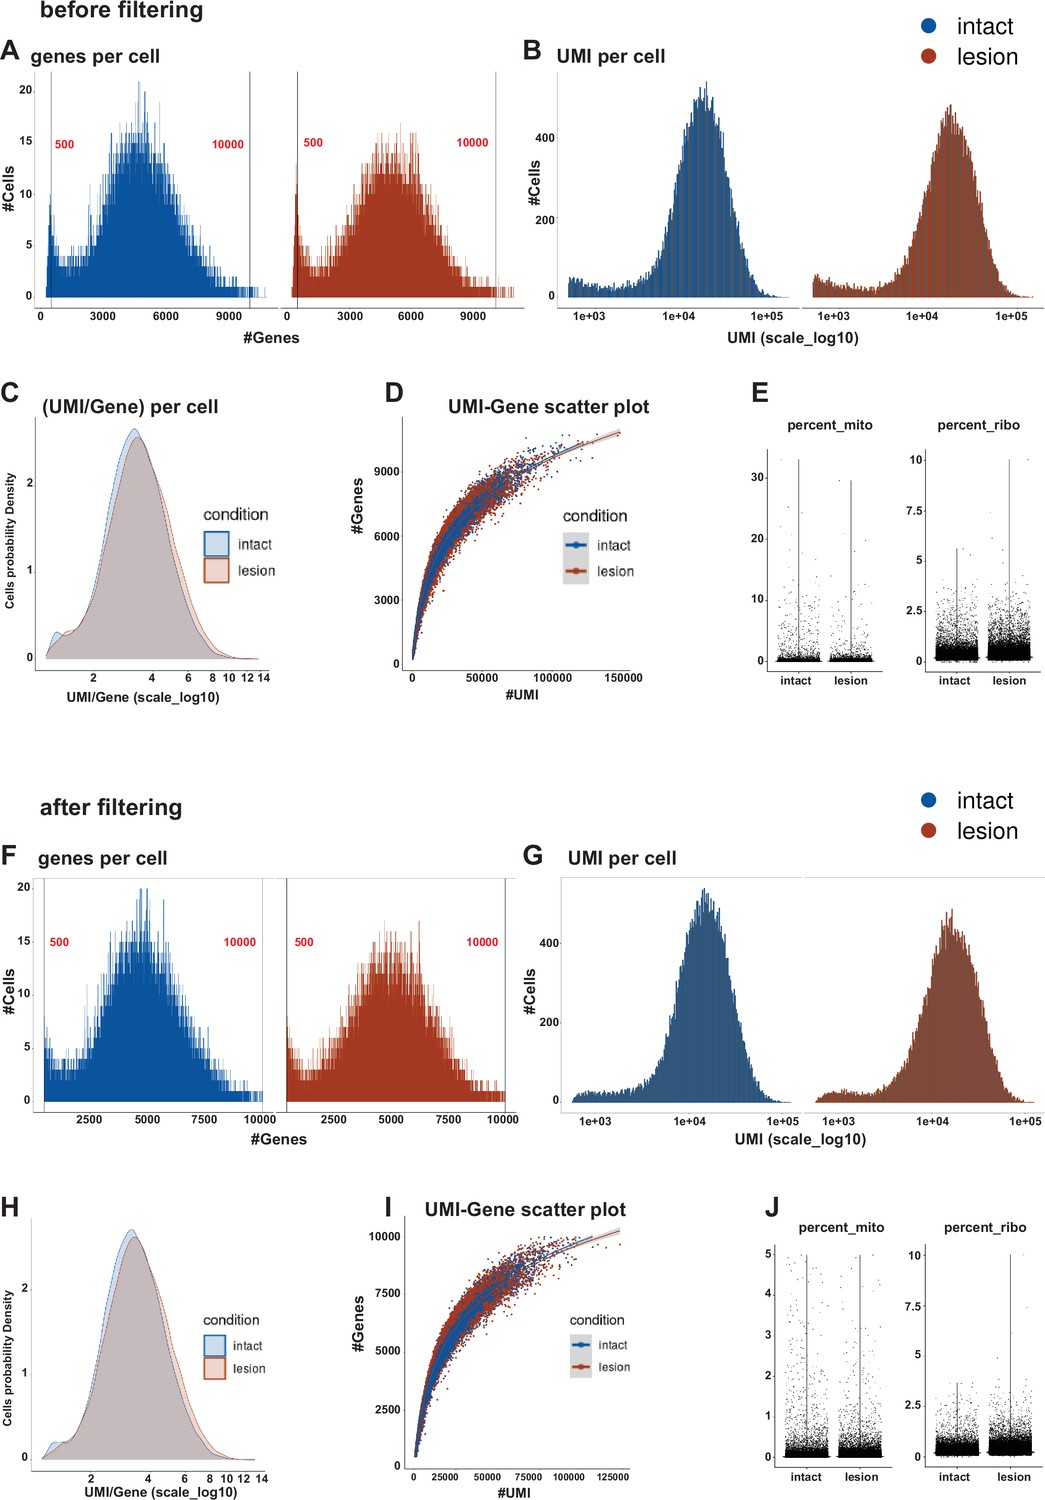
Quality control of snRNAseq data.
Metrics and indexes of data quality control before QC filtering (A–E). Distribution of genes (A) and UMIs (B) in libraries per condition. Cells’ probability density plot for UMI/gene per condition (C). Correlation of UMIs to Genes, shown as a scatter plot for conditions (D). Percentages of mitochondrial and ribosomal transcripts (UMI) per condition (E). (F–J) The same metrics and indexes after QC filtering.
Figure 1—figure supplement 3
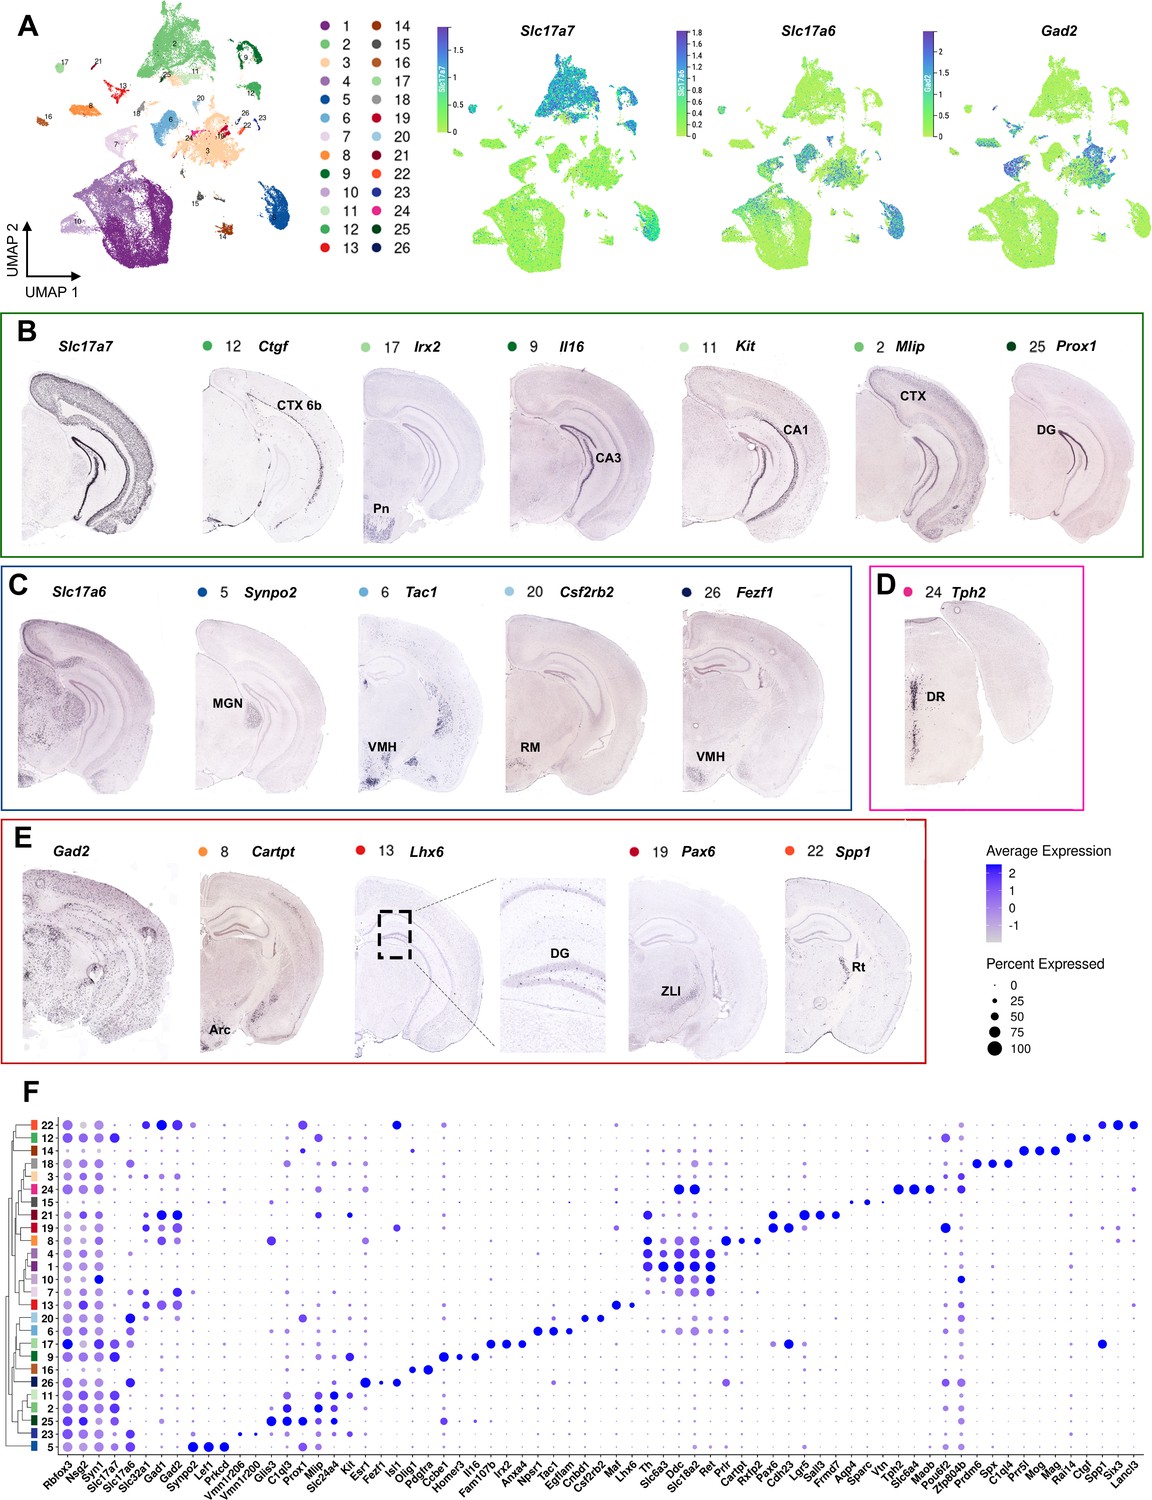
Spatial mapping of main non-mDA-clusters.
(A) A UMAP projection of all the cells with color-coding key. UMAP projections of Slc17a7 (Vglut1, green clusters), Slc17a6 (Vglut2, blue clusters), and Gad2 (red and orange clusters) show the distribution of glutamatergic and GABAergic neuronal subtypes in various clusters. Cluster 3 contained a heterogenous mix of various midbrain and hypothalamic neurons expressing both glutamatergic, histaminergic and GABAergic markers. (B) Slc17a7-expressing neuronal populations with example enriched genes, with cluster numbers and color-coding indicated. The Slc17a7+neurons were mainly found in cortex (CTX) and hippocampus, as well as in the pontine nuclei (Pn). The largest Slc17a7+cluster (2) contained mixed cortical neurons. (C) Slc17a6+clusters were found in mostly in the midbrain and hypothalamus, for example in the medial geniculate nucleus (MGN), ventromedial hypothalamus (VMH), and retromammillary nucleus (RM). (D) Serotonergic neurons expressing Tph2 in dorsal raphe (DR). (E) GABAergic clusters expressing Gad2 were found dentate gyrus (DG), zona limitans intrathalamica (ZLI) and reticular nucleus (Rt). Cluster 8 co-expressed several DA genes, matching hypothalamic DA neurons. (F) A dotplot representation of the enriched genes in non-mDA clusters.
Figure 2 with 1 supplement
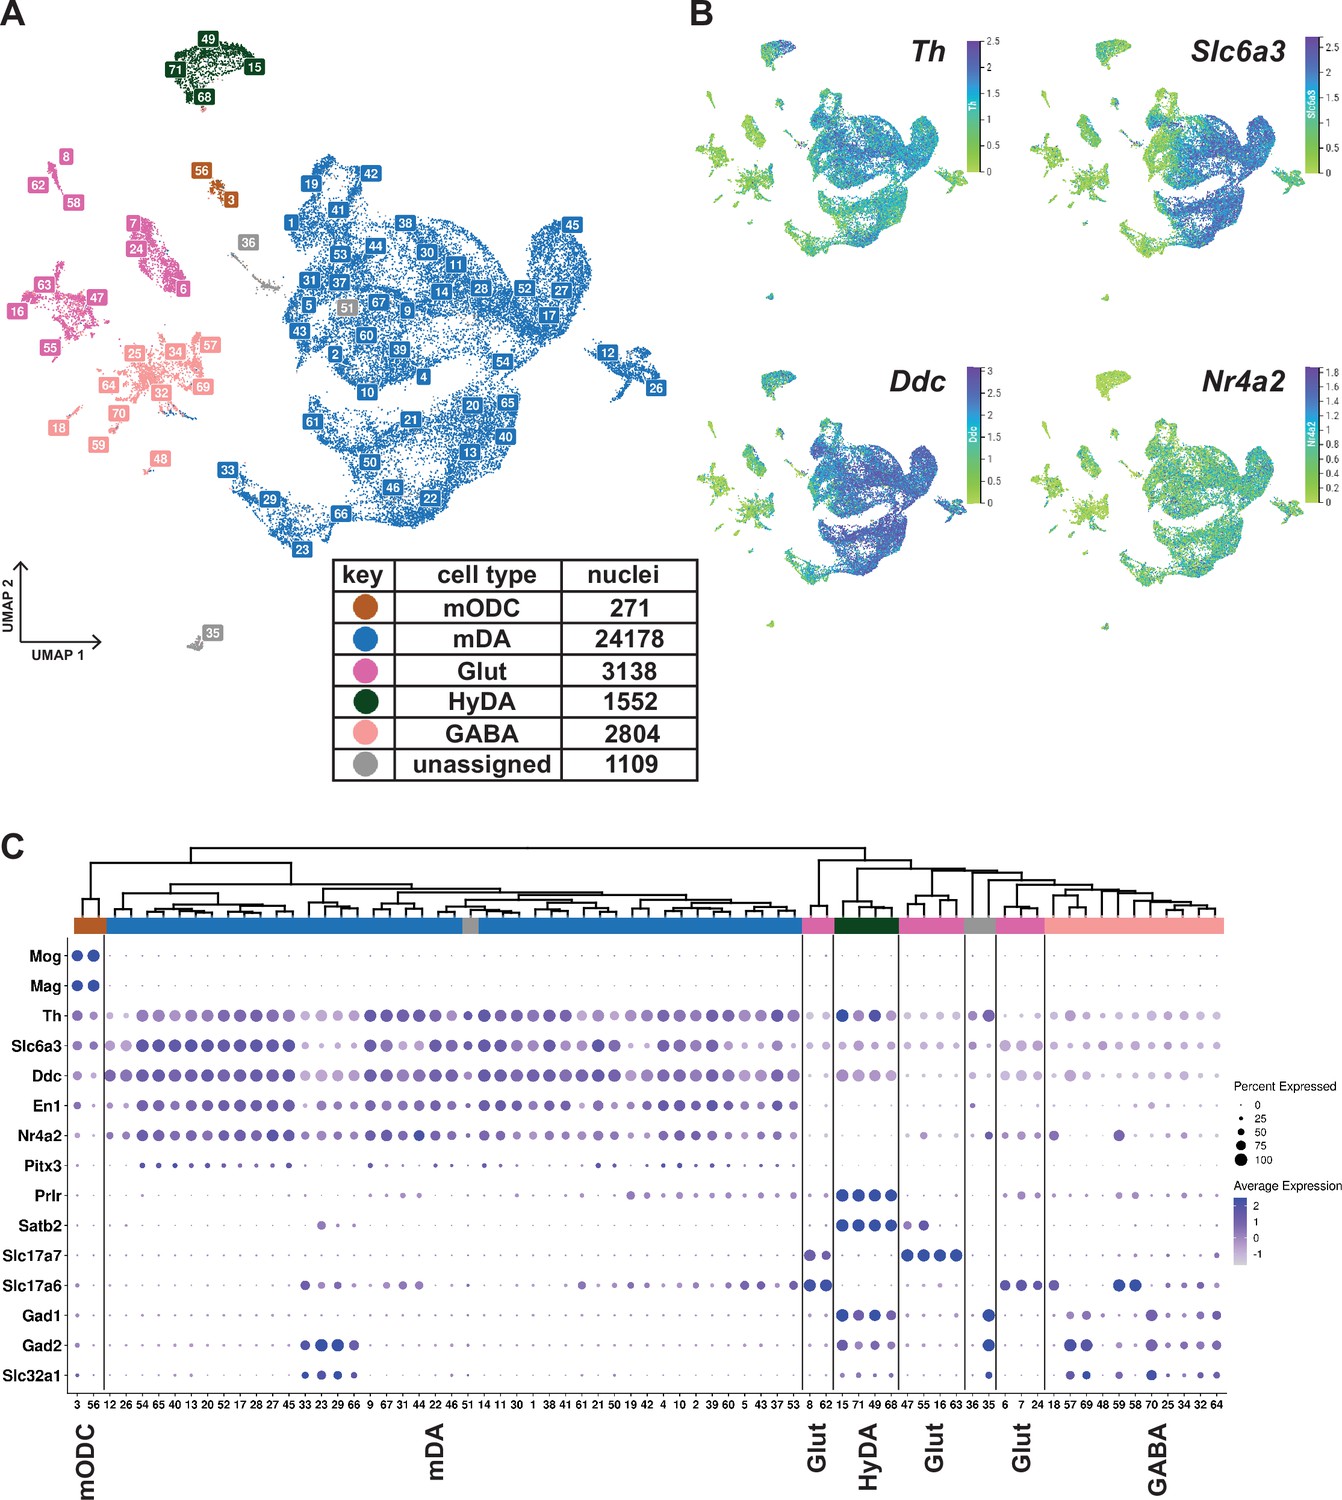
Midbrain DA dataset, cell types and composition.
(A) UMAP projection of the dopaminergic dataset, with numerical labels of the 71 clusters and color-coded for the major cell types. (B) Typical dopaminergic markers plotted in UMAP separately, with the top 1 percentile of the normalized gene expression range clipped for better visualization. (C) Hierarchical dendrogram of clusters from the dopaminergic nuclei dataset, with the cell-type enriched markers as a dotplot and cell-type color-coding. mODC = mature oligodendrocyte, HyDA = hypothalamic dopaminergic.
Figure 2—figure supplement 1
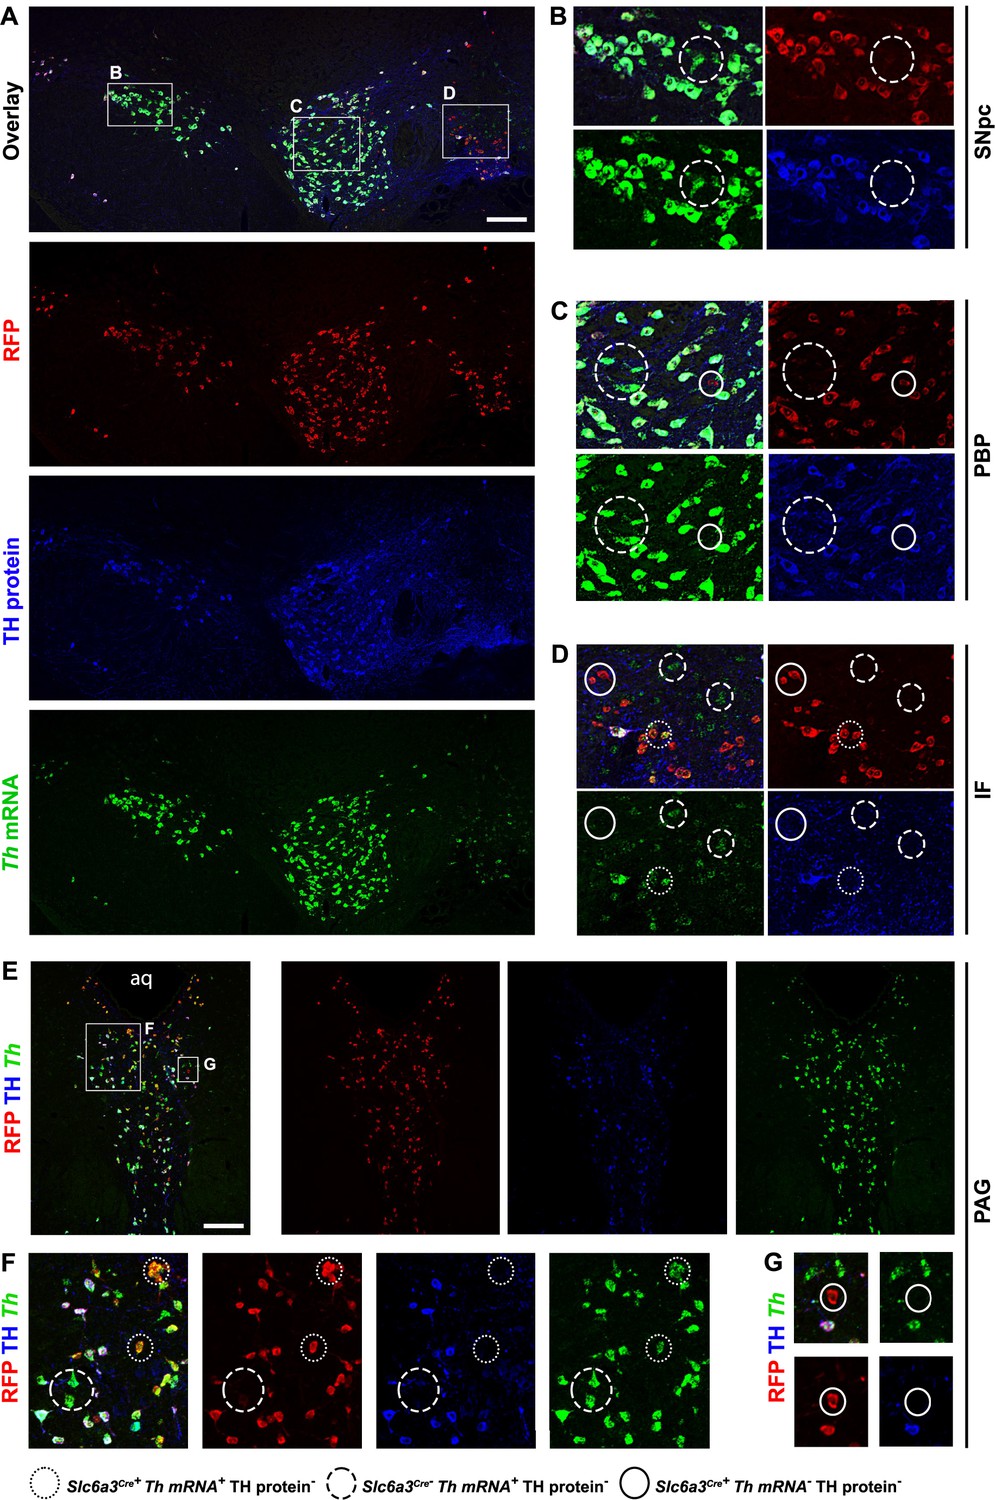
Distribution of Th mRNA and protein in different mDA populations.
(A–G) In situ hybridization and immunohistochemistry for Th mRNA and protein across the midbrain in 2 months old Slc6a3Cre/+; R26TrapC/+ mice. In most of the RFP+ cells both Th mRNA and protein can be detected. We detected some cells which were labelled with Dat-Cre and expressed mRNA but lacked TH protein (dotted circles), and some which expressed only Th mRNA but lacked both RFP and TH protein (dashed circles). These cells were not concentrated in any particular mDA neuron nuclei but were found scattered across VTA and SNpc. We also detected very rare cells in the medial regions of VTA and PAG which were labelled with Dat-Cre but lacked both Th mRNA and protein (solid circles). Aq, aqueduct; SNpc, Substantia Nigra pars compacta; PBP, Parabrachial Pigmented Nucleus; IF, Interfascicular Nucleus; PAG; Periaqueductal Grey. Scale bars = 100 μm.
Figure 3 with 1 supplement
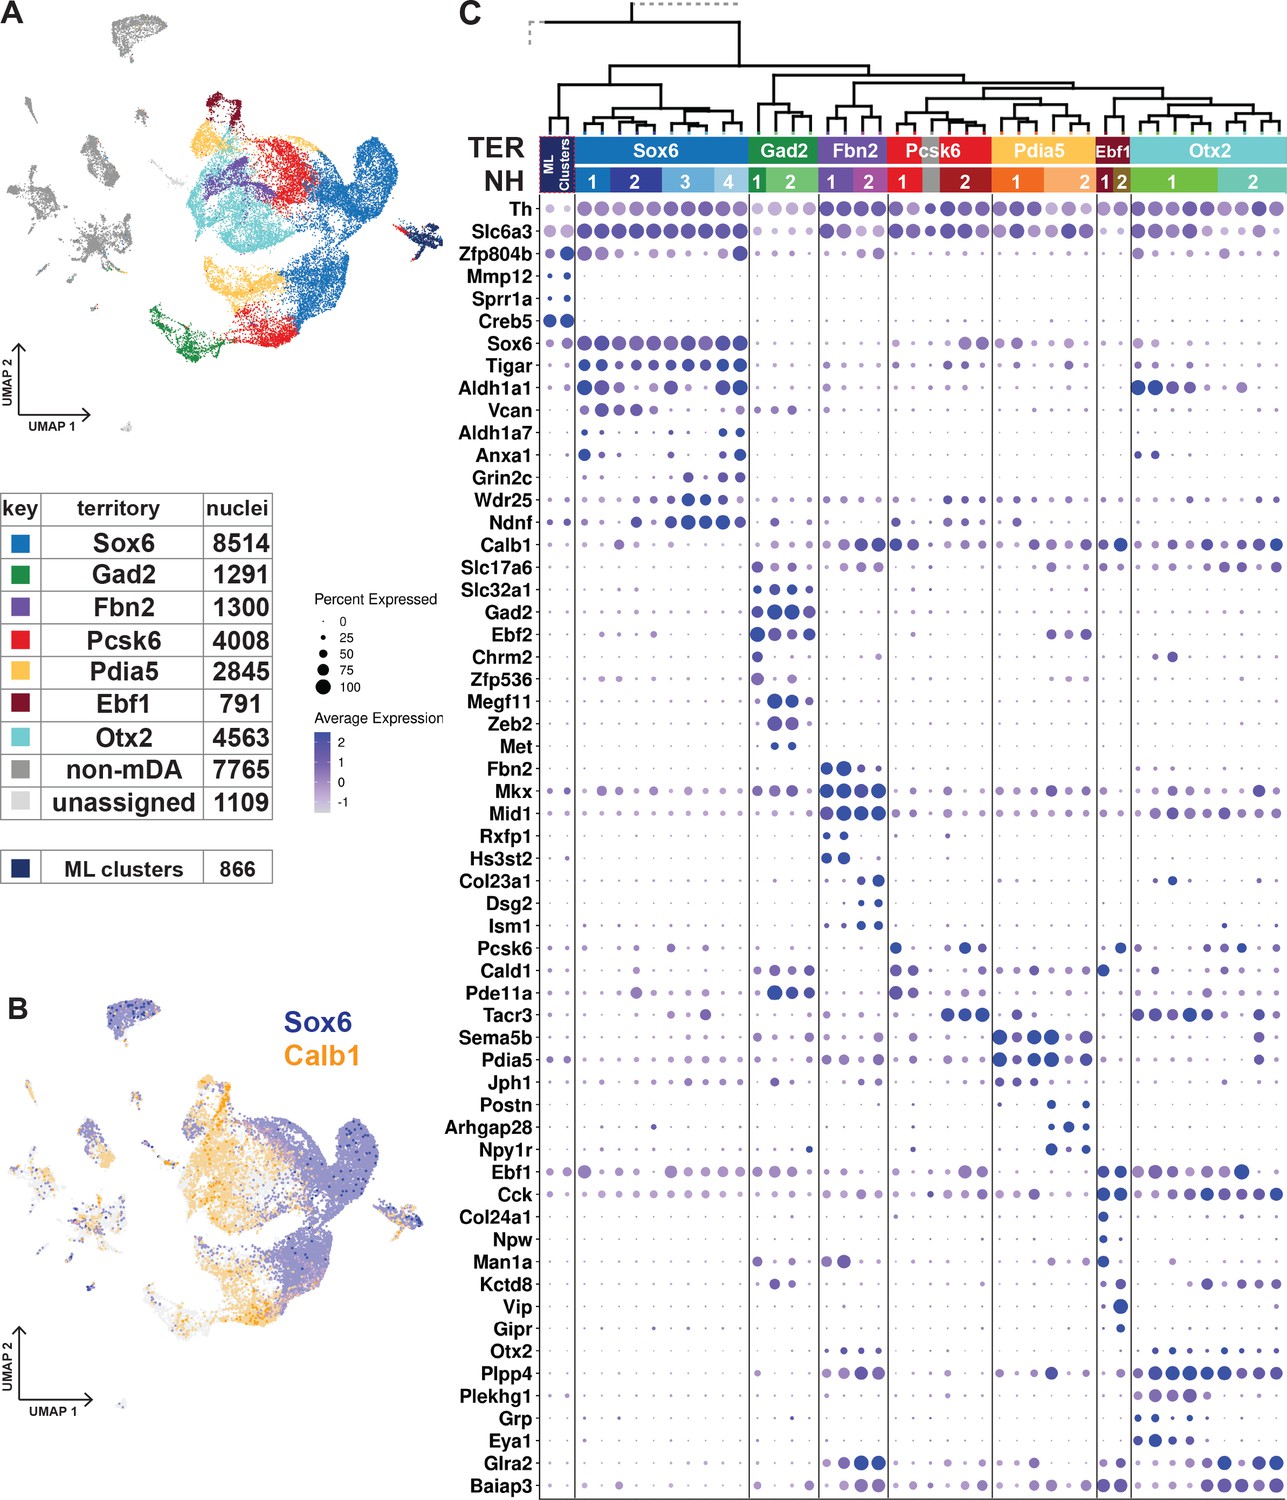
Dopaminergic territories and neighborhoods.
(A) UMAP projection of the dopaminergic dataset with territory color-coding and size. (B) Co-expression of Sox6 and Calb1 plotted in UMAP, roughly delineating SNc and VTA respectively. (C) Hierarchical dendrograms with labels and color-coded territories and their respective neighborhoods. Dotplot shows territory (TER) and neighborhood (NH) specific markers.
Figure 3—figure supplement 1

Territory and neighborhood markers of mDA dataset.
(A) UMAP projection of the dopaminergic dataset with neighborhood color-coding. (B) Hierarchical dendrograms with labels and color-coded territories and their respective neighborhoods, as well as ML-clusters. Dotplot shows additional territory (TER) and neighborhood (NH) specific markers.
Figure 4 with 3 supplements
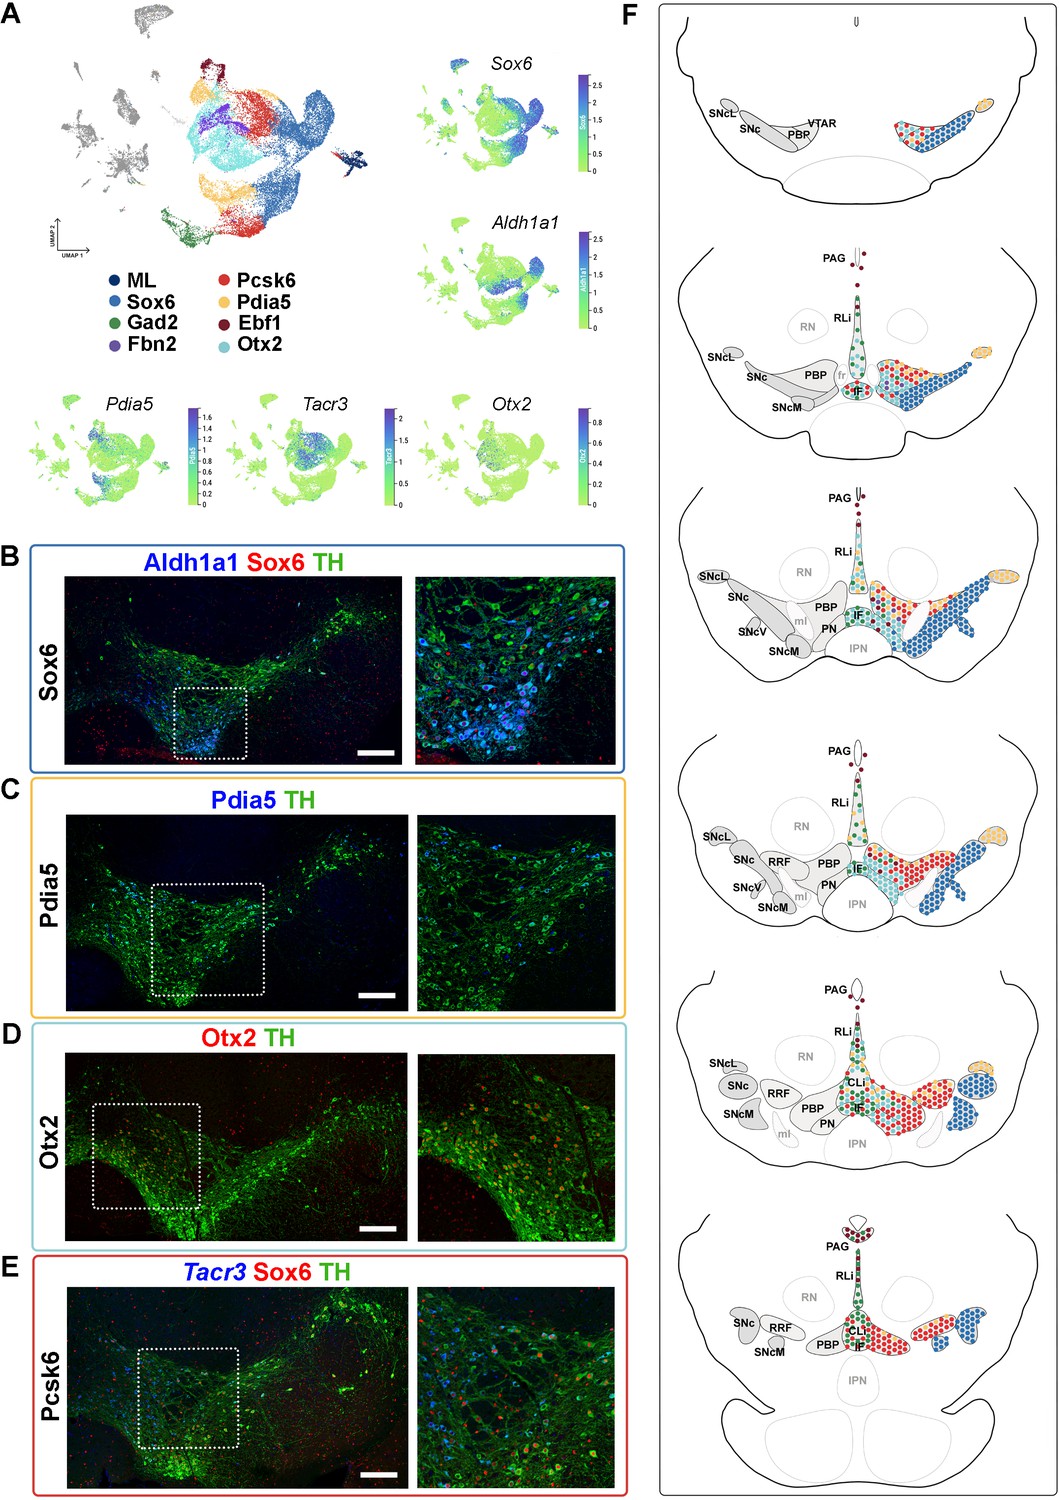
Mapping of mDA territories in the adult mouse midbrain.
(A) A color-coded UMAP projection of the seven mDA territories and of the mostly-lesion (ML) clusters, with individual enriched genes plotted on smaller UMAPs. (B–D) Immunohistochemical staining with antibodies indicated in the ventral midbrain. (E) Fluorescent RNA in situ hybridization with Tacr3 probe combined with immunohistochemistry. Insets are shown as higher magnification on the right. (F) Schematic presentation of the localization of the seven mDA territories across the midbrain, with the most anterior section uppermost. SNc, Substantia Nigra pars compacta, SNcL, Substantia Nigra lateral, SNcV, Substantia Nigra ventral, SNcM, Substantia Nigra medial, VTAR, Ventral Tegmental Area rostral part, PBP, parabrachial pigmented nucleus, PN, paranigral nucleus, PIF, parainterfascicular nucleus, PAG, periaqueductal grey, RRF, retrorubral field, RLi, rostral linear nucleus, CLi, caudal linear nucleus of the raphe, IF, interfascicular nucleus, RN, red nucleus, IPN, interpeduncular nucleus, PN, pontine nucleus, fr, fasciculus retroflexus, ml, medial lemniscus. Scale bars = 200 μm.
Figure 4—figure supplement 1
Neighborhoods of Sox6 territory.
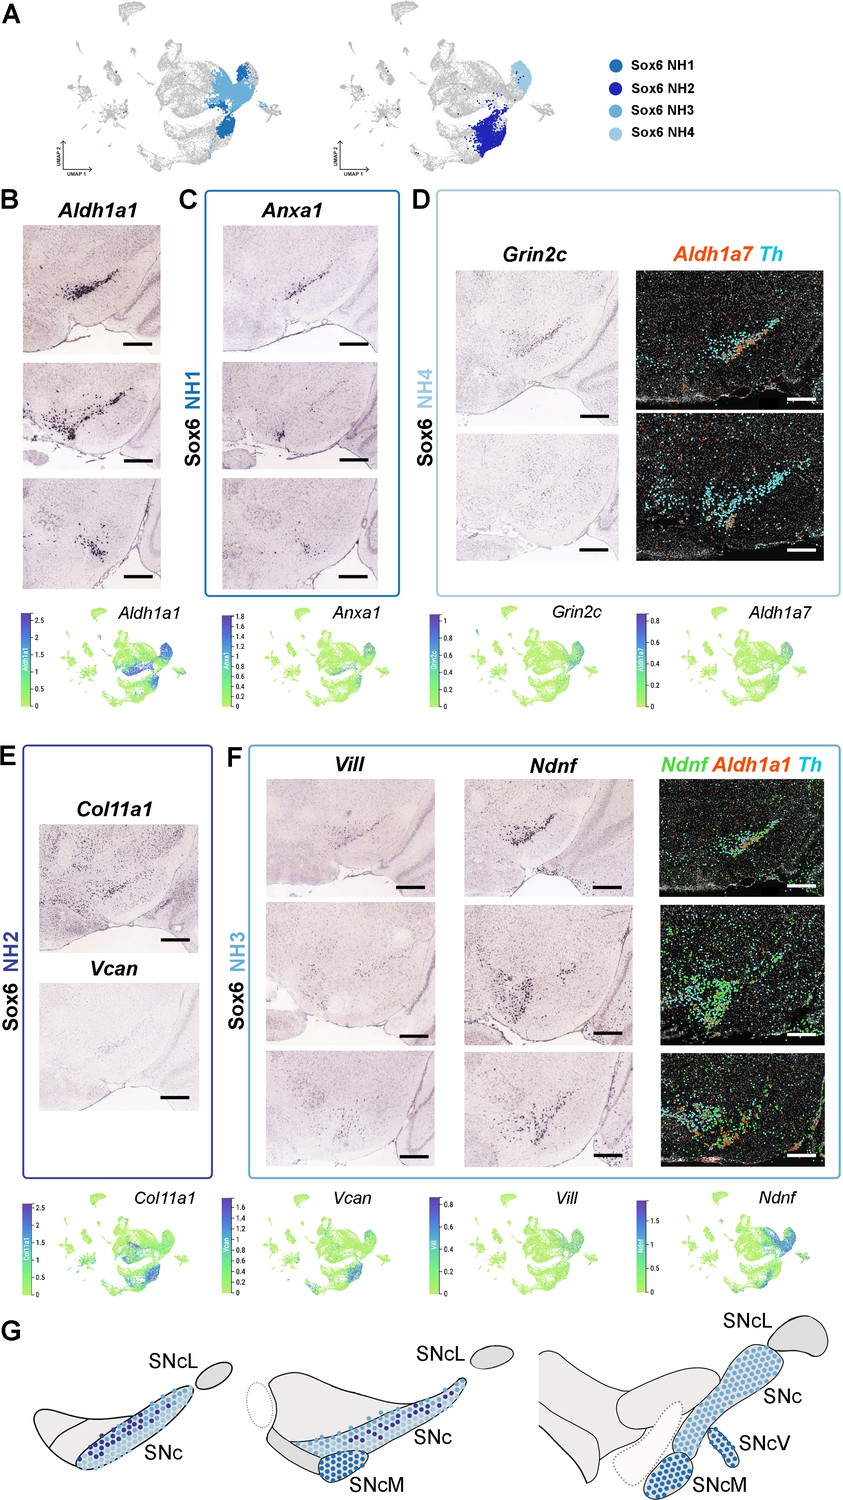
(A) Color-coded UMAP projections highlighting the four Sox6 neighborhoods. (B–F) Chromogenic in situ hybridization images from Allen Mouse Brain Atlas with the probes indicated, in situ sequencing for Aldh1a1, Th, and Ndnf in D and F. (G) Schematic model of the localization of Sox6 NH1-NH4, following the color code in A, with the most anterior section on the left. Scale bars = 500 µm.
Figure 4—figure supplement 2
Neighborhoods of Ebf1, Pdia5 and Otx2 territories.
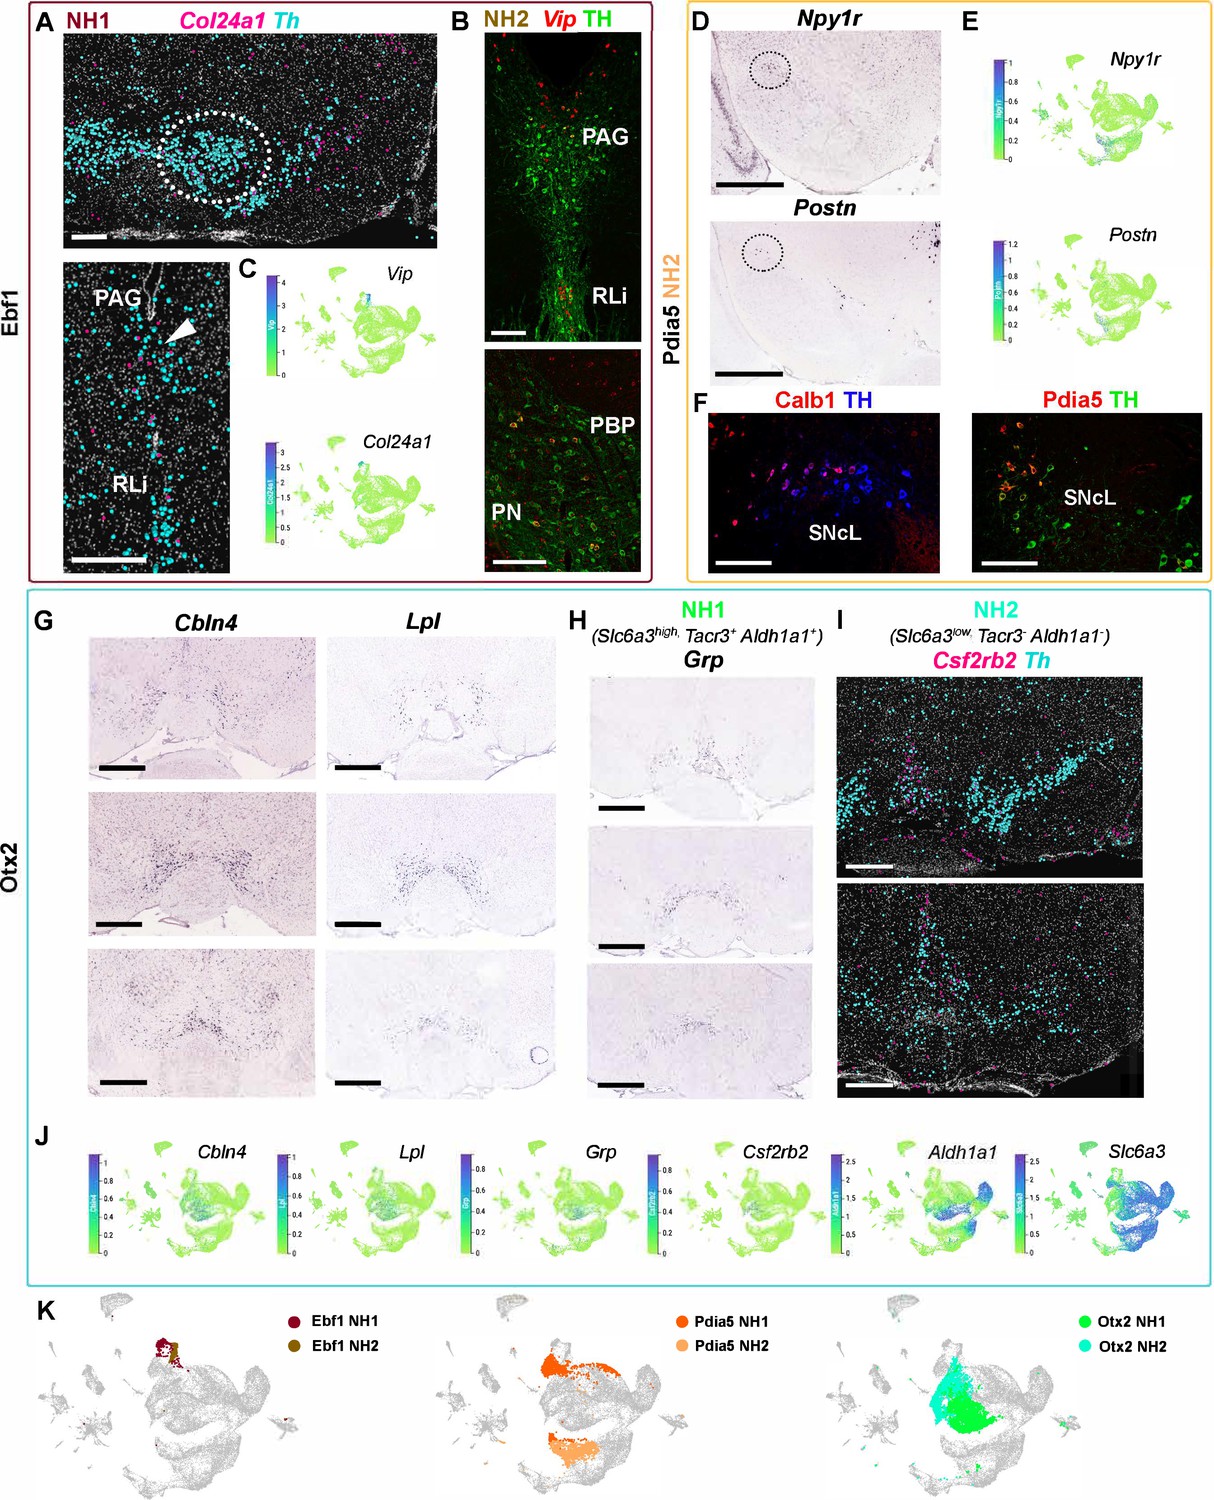
(A–C) Neighborhoods of Ebf1 territory. Col24a1 was detected by in situ sequencing, dotted circle indicating area in PBP were Col24a1+ cells most enriched. Vip detected by fluorescent RNA in situ hybridization combined with TH immunohistochemistry. (D–F) Neighborhood 2 of Pdia5 territory showing enriched marker gene expression in the lateral SN. Images in (D) from Allen Mouse Brain Atlas. (F) Closeup images of SNcL with immunohistochemical staining with antibodies indicated, lateral side toward left. (G) Allen Mouse Brain Atlas images for Otx2 territory markers Cbln4 and Lpl, with the most anterior section upmost. (H) Allen Brain Atlas images of Otx2_NH1 marker Grp, most anterior section upmost. (I) In situ sequencing of Otx2_NH2 marker Csf2rb2, with more anterior section on top. (K) Color-coded UMAP projections of Ebf1, Pdia5 and Otx2 territories highlighting the neighborhoods. Scale bars are 200 µm in A, 100 µm in B and F, and 500 µm in D, G-I.
Figure 4—figure supplement 3

Neighborhoods of Gad2, Fbn2, and Pcsk6 territories.
(A–C) Neighborhoods of Gad2 territory. (A) Gad2 RNA in situ hybridization in Pitx3EGFP/+ tissue to detect Thlow Gad2 neurons. Arrowheads point to some of the co-expressing cells. (C) In situ sequencing with Ebf2 to detect NH1 and Met to detect NH2, with the most anterior section upmost. (D–G) Neighborhoods of Fbn2 territory. (D, F) In situ sequencing of Fbn2, Rxfp1, and Dsg2. (G) Allen Brain Atlas images of Rxfp1, Col23a1, modified by adding lines and text to indicate boundaries of different VTA populations. Arrowheads point to areas where expression was detected. (H–I) Neighborhoods of Pcsk6 territory. Allen Brain Atlas Images of Pcsk6, Ano2, and Cpne2. In situ sequencing of Ccdc192, with arrowhead pointing to areas where expression was seen. (B, E, H) Color-coded UMAP projections with neighborhoods highlighted, accompanied by UMAPs showing marker gene expression. Scalebars are 100 µm in A and 500 µm in B, D-G, I.
Figure 5 with 1 supplement
Normalized cell loss across territories and neighborhoods in mDA dataset.
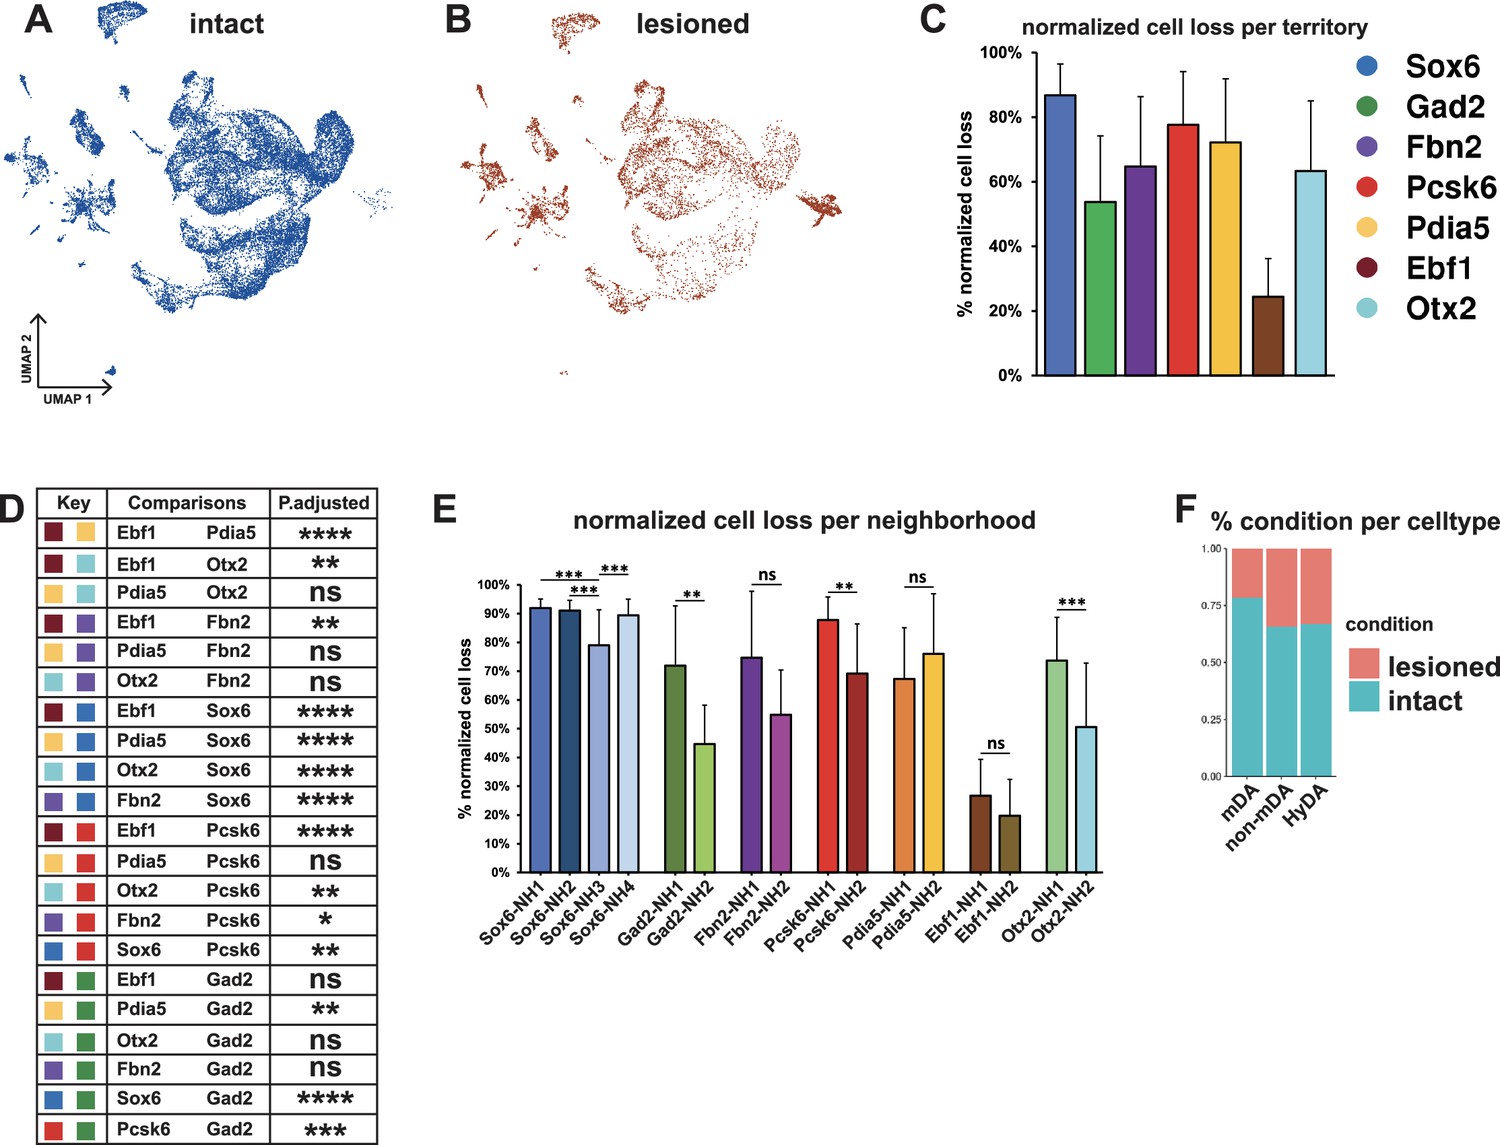
(A, B) UMAP projection of the dopaminergic dataset nuclei from the intact (un-lesioned) and the lesioned hemisphere, respectively. (C) Calculated normalized cell loss for territories, visualized as percentages. (D) Pairwise comparison of normalized cell loss across territories. (E) Calculated normalized cell loss for neighborhoods, visualized as percentages. Comparisons were made between neighborhoods within each territory. See methods for the statistical tests used. (F) Percentages of nuclei in each major cell type from either intact or lesioned samples. Sample size per condition (n) = 6, ns = not significant, * p≤0.05, **p≤0.01, *** p≤0.001, **** p≤0.0001. For the Conover-Iman test; p-value = P(T ≥ |t|), and null hypothesis (H0) was rejected at p ≤ α/2, which is 0.025. Error bars show standard deviation (SD).
Figure 5—figure supplement 1

Validation of unilateral 6-OHDA-induced lesion.
(A) DAT-binding autoradiography of striatal tissue. See Materials and methods for details. (B) Quantification of the autoradiographs in A, with both doses of 6-OHDA being significantly different from the intact (un-lesioned) side. One way ANOVA, with * showing p<0.05. Samples sizes are n=8 for intact and n=4 for either lesioned dose. Error bars show the standard error of the mean (SEM). (C) Mosaic plot showing the residuals of Pearson’s Chi square test of independence, with the two conditions as the categorical variables. The plot shows deviations of the observed values from the expected values under the null hypothesis if the categorical variables were independent. However, the test shows that the categorical variables are significantly associated (p-value <2.2e-16). The negative residuals denote that the observed values are smaller than expected, while the positive residuals denote that the observed values are larger than the expected. The width and height of the mosaics signify the number of nuclei per animal and per condition, respectively. (D) Control for non-specific DAT binding with dopamine reuptake inhibitor, nomifensine. (E) An example of a 6-OHDA lesioned midbrain, coronal section stained with antibodies against TH and RFP. Scale bar = 1 mm.
Figure 6 with 3 supplements
Vulnerability and resilience modules in territories, neighborhoods, and the ML clusters.
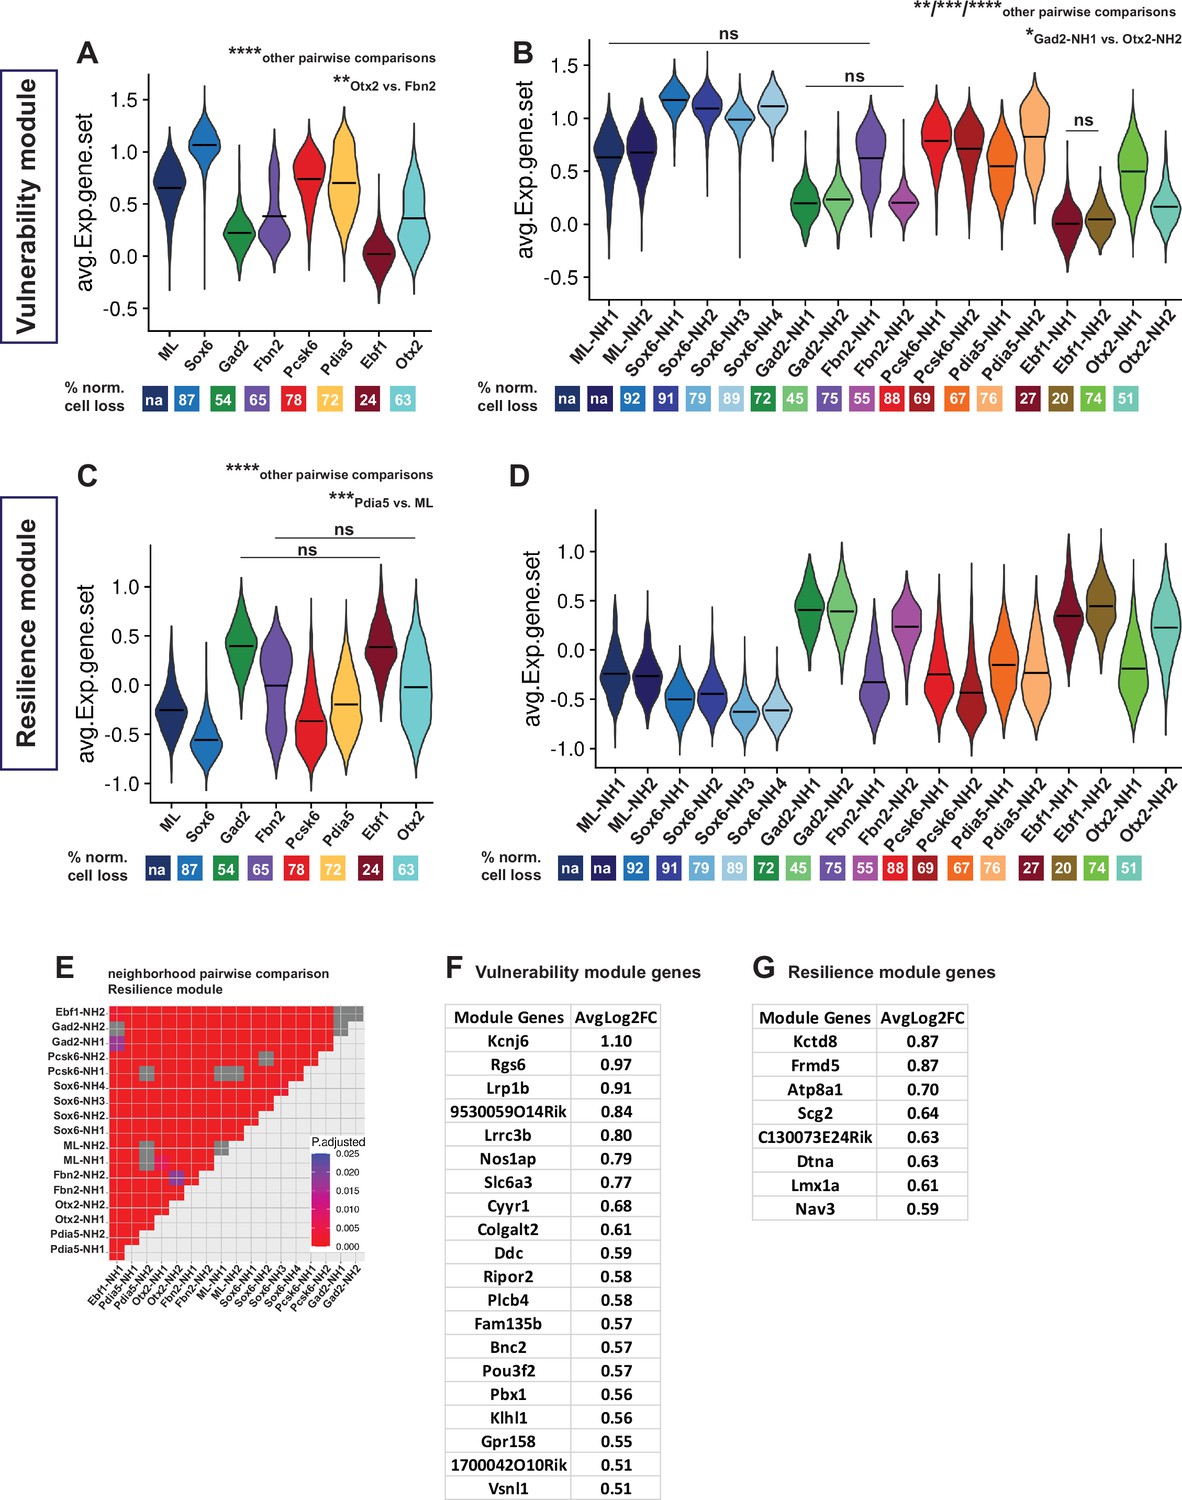
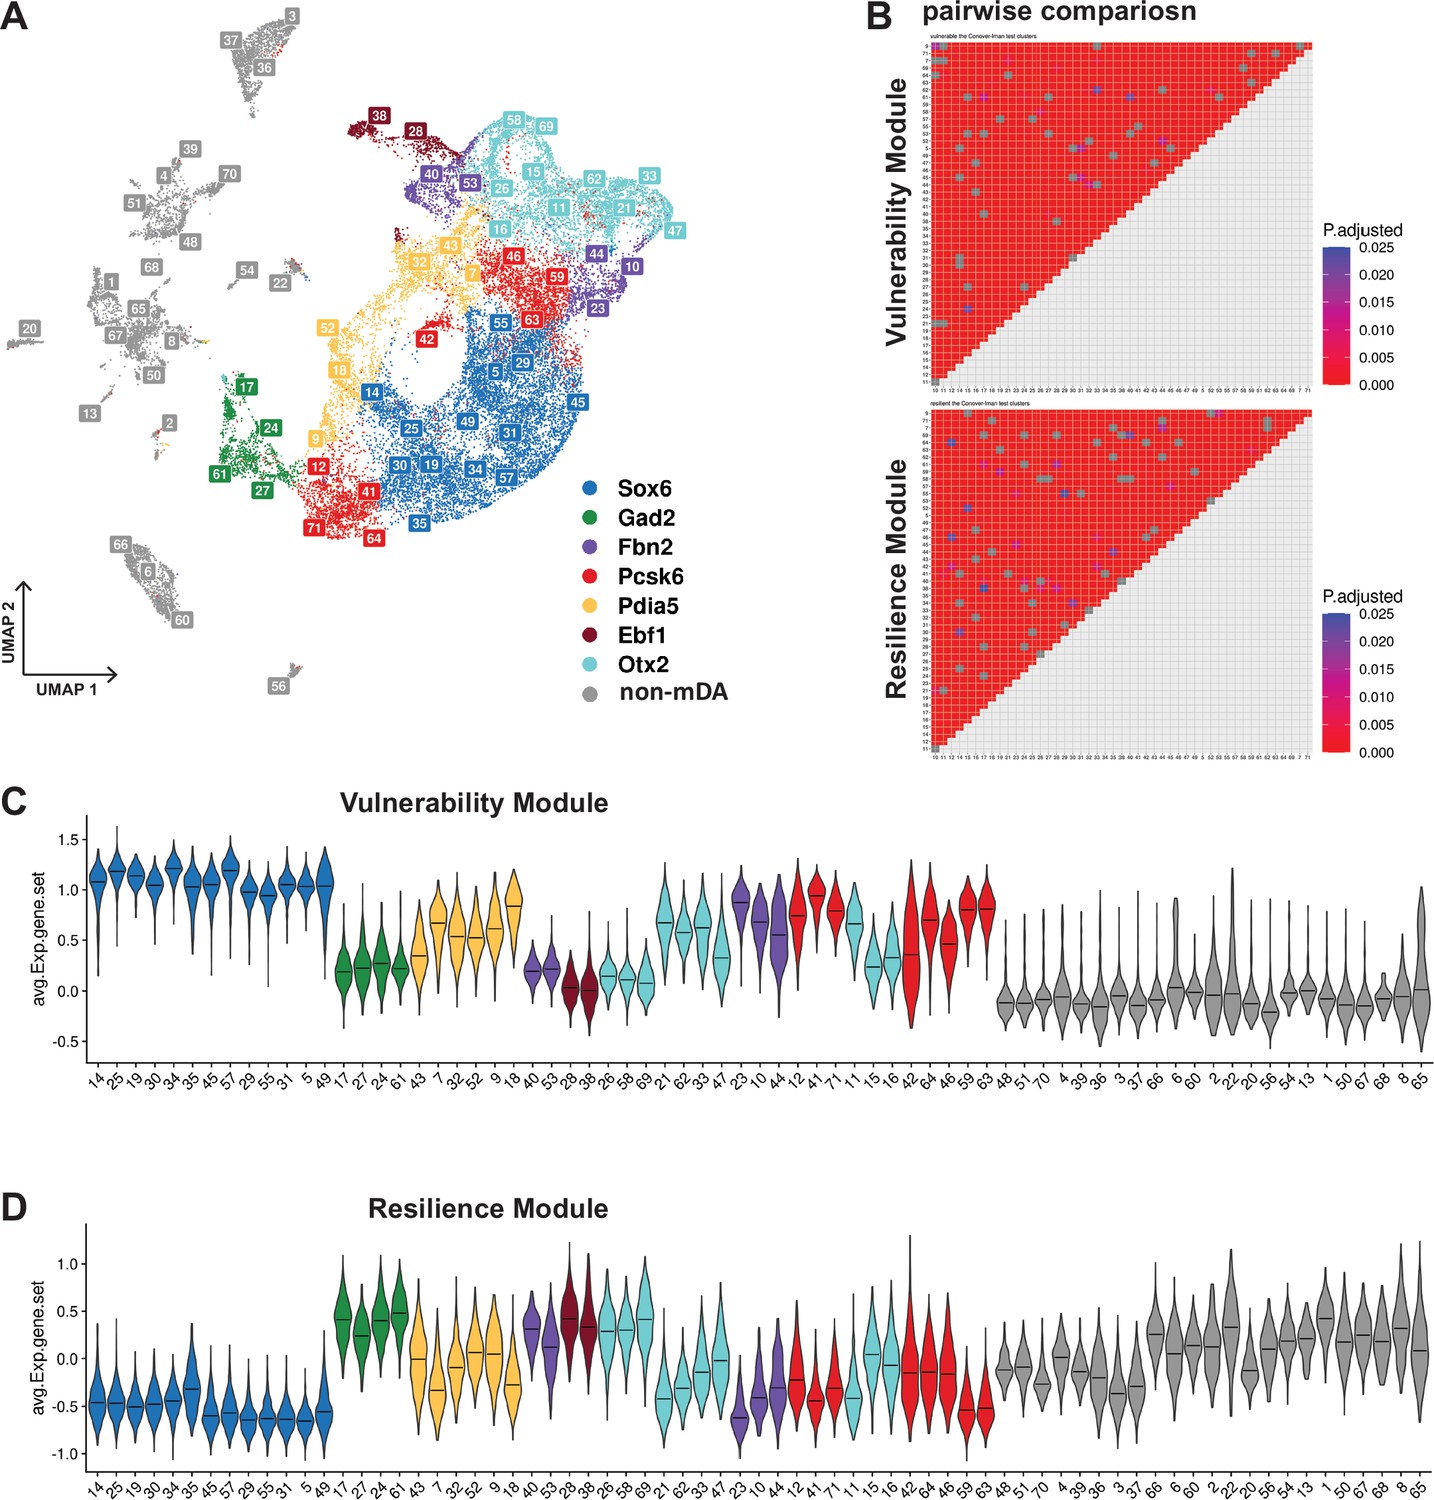
(A, B) Violin plots of the vulnerability module across territories and neighborhoods, with percentage of normalized cell loss shown at the bottom per territory and neighborhood, respectively. (C, D) Violin plots of the resilience module across territories and neighborhoods, with percentage of normalized cell loss shown at the bottom per territory and neighborhood, respectively. Pairwise comparisons of vulnerability module scores across territories and neighborhoods, respectively. (E) Pairwise comparisons of resilience module scores across neighborhoods. (F) Vulnerability module gene list, ranked by average Log2FC. (G) Resilience module gene list, ranked by average Log2FC. Summary statistics center lines are mean values. na = not applicable. ns = not significant. Sample size per condition (n) = 6. See Materials and methods for the statistical tests used.
Figure 6—figure supplement 1
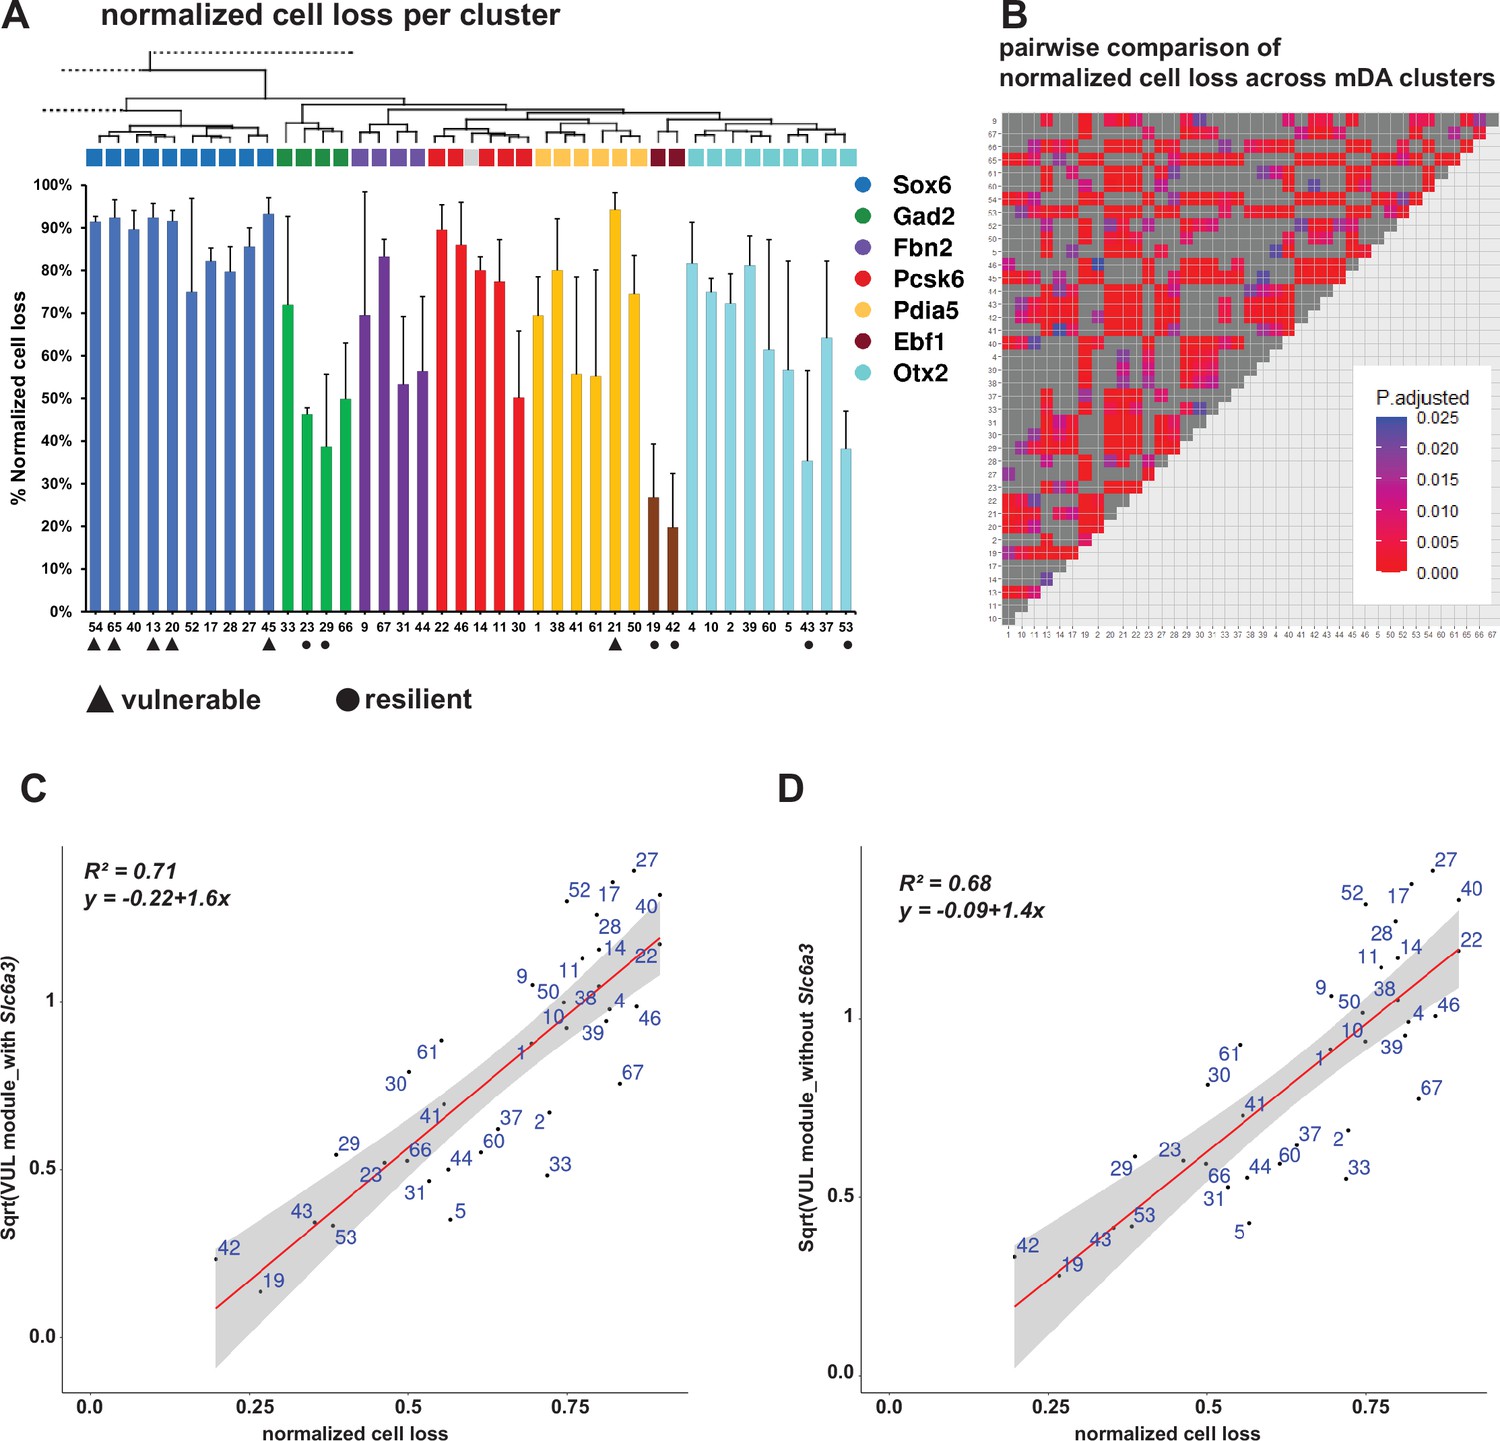
Normalized cell loss per cluster and its correlation with the vulnerability module.
(A) Calculated normalized cell loss for dopaminergic-only clusters from the 6 territories shown, visualized as percentages, and color-coded by territory. Section of the hierarchical dendrogram of the same clusters. The vulnerable (black triangle) and resilient (black circle) clusters are marked. See Materials and methods for details. Error bars show standard deviation, SD. (B) Heatmap of adjusted p values for the pairwise comparisons of cell loss among the same clusters in A. For the Conover-Iman test; p-value = P(T ≥ |t|), and null hypothesis (H0) was rejected at p ≤ α/2, which is 0.025. (C, D) Linear regression models, fitted for the normalized cell loss in the specified clusters versus the square root of the vulnerability module scores calculated with and without Slc6a3, respectively. The grey bands represent the 95% confidence interval limits. p-value = 3.89e-10 for C, and p-value = 1.73e-09 for D.
Figure 6—figure supplement 2
Vulnerability module scores per cluster for integrated Th+/Slc6a3+dataset.
(A) UMAP projection of integrated dataset with territory color-coding, and labels of the clusters. (B) Heatmaps of adjusted p values for pairwise comparisons of vulnerability and resilience module scores among the dopaminergic-only clusters, excluding the non-mDA clusters. See Materials and methods for the statistical tests used. (C, D) Violin plots of vulnerability and resilience module scores for all clusters in the integrated dataset.
Figure 6—figure supplement 3

Co-expression network analysis of lesioned nuclei from mDA neuron territories.
(A) Transcriptomically similar nuclei were aggregated into over 4800 Metacells, and their aggregated expression profiles are visualized in two dimensions with UMAP, grouped by their respective territories. Non-mDA clusters are colored gray. (B) Dendrogram visualization of the hierarchical clustering of genes into co-expression modules based on the topological overlap matrix (TOM). (C) Dotplot of scaled module eigengene (ME) for the 9 calculated modules across mDA territories, with their corresponding abundance per territory. (D) The co-expression network of the 9 modules, based on the gene expression of mDA territories from the lesioned side. Genes are shown as nodes, co-expression relationships between genes are shown as edges. The point size is scaled based on the kME values. Intramodular edges are the same color as their corresponding modules, while intermodular edges are colored gray. The strength of the co-expression links between genes is used to scale the opacity of the edges in the network. Network edges are downsampled to 65% for better visualization. The top 20 hub genes and other 5 randomly selected genes per module were used. (E) Correlation between each module pair based on their MEs. Modules 2 and 3 are negatively correlated while modules 2 and 8 are positively correlated as highlighted by dashed boxes. (F) Boxplot showing average kME values per module. The black line in the box indicates the median while the lower and upper hinges correspond to the first and third quartiles (the 25th and 75th percentiles). The upper / lower whiskers extend from the hinge to the largest / smallest values no further than 1.5 * IQR from the hinge. IQR = the inter-quartile range. (G) GO terms plots for the co-expression modules 2 and 3, showing the top 20 terms ranked by p-values. The enrichment analysis was performed on the top 100 genes per module, ranked by kME, using the GO_Biological_Process_2021 database.
Figure 7 with 2 supplements
Transcriptional kinship and enriched markers of ML clusters.
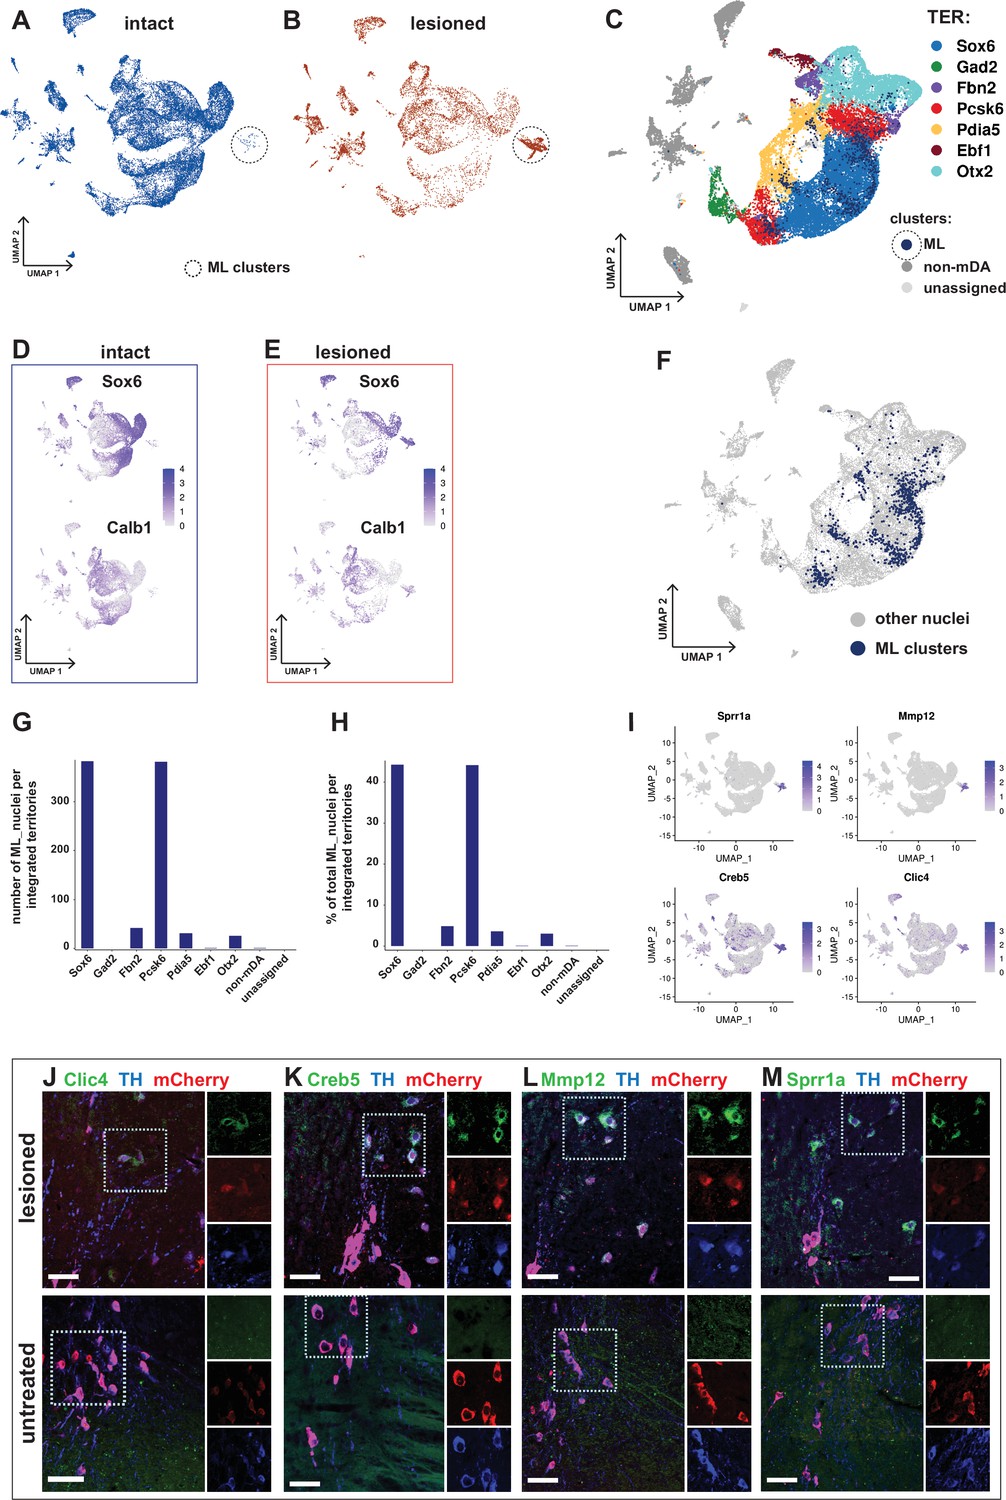
(A) UMAP projection of the dopaminergic dataset nuclei from the intact (non-lesioned) hemisphere. (B) UMAP projection of the dopaminergic dataset nuclei from the lesioned hemisphere. ML clusters are marked with dashed circles in A and B. (C) UMAP projection of the integrated dopaminergic nuclei dataset, color-coded for the territory IDs of the merged dataset. (D, E) Sox6 and Calb1 expression plotted in intact and lesioned nuclei, respectively. (F) Same UMAP projection as in C, with ML clusters nuclei highlighted. (G, H) Bar graphs showing the numbers and percentages of ML clusters nuclei per territory of the integrated dataset, respectively. More than 80% of ML nuclei cluster in Sox6 and Pcsk6 territories of the integrated data. (I) Mostly lesioned (ML) clusters enriched markers plotted in UMAP. (J–M) ML-enriched markers in I, detected by fluorescent RNA in situ hybridization, combined with TH and mCherry immunohistochemistry in lesioned versus untreated tissue. Scale bar = 50 µm.
Figure 7—figure supplement 1
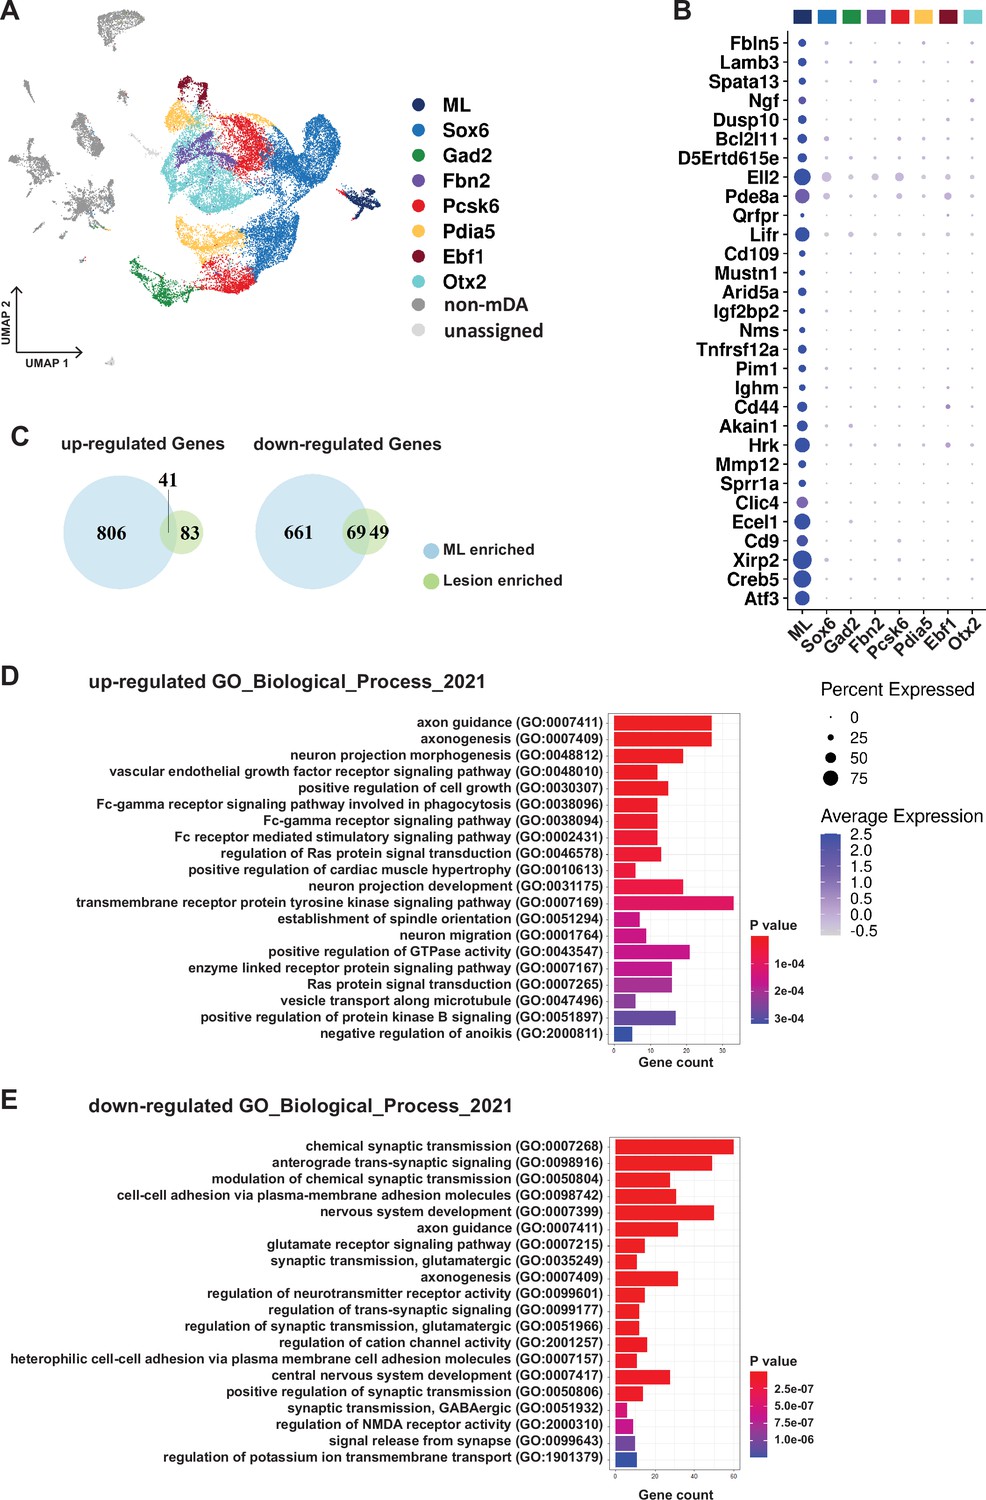
ML-clusters enriched genes and GO analysis of ML-specific enriched genes.
(A) UMAP projection of the dopaminergic dataset with territory color-coding. (B) Dotplot with enriched markers for ML clusters, ranked by adjusted p values. (C) Venn diagrams with differentially expressed genes in all lesioned nuclei when compared to all intact nuclei, and in ML clusters when compared to all other territories, as well as the common genes between the two sets. (D, E) Top 20 enriched GO terms, ranked by p value, using genes upregulated and downregulated only in the ML clusters when compared to all other territories (blue sector in C), with GO_Biological_Process_2021 as the gene-set library.
Figure 7—figure supplement 2
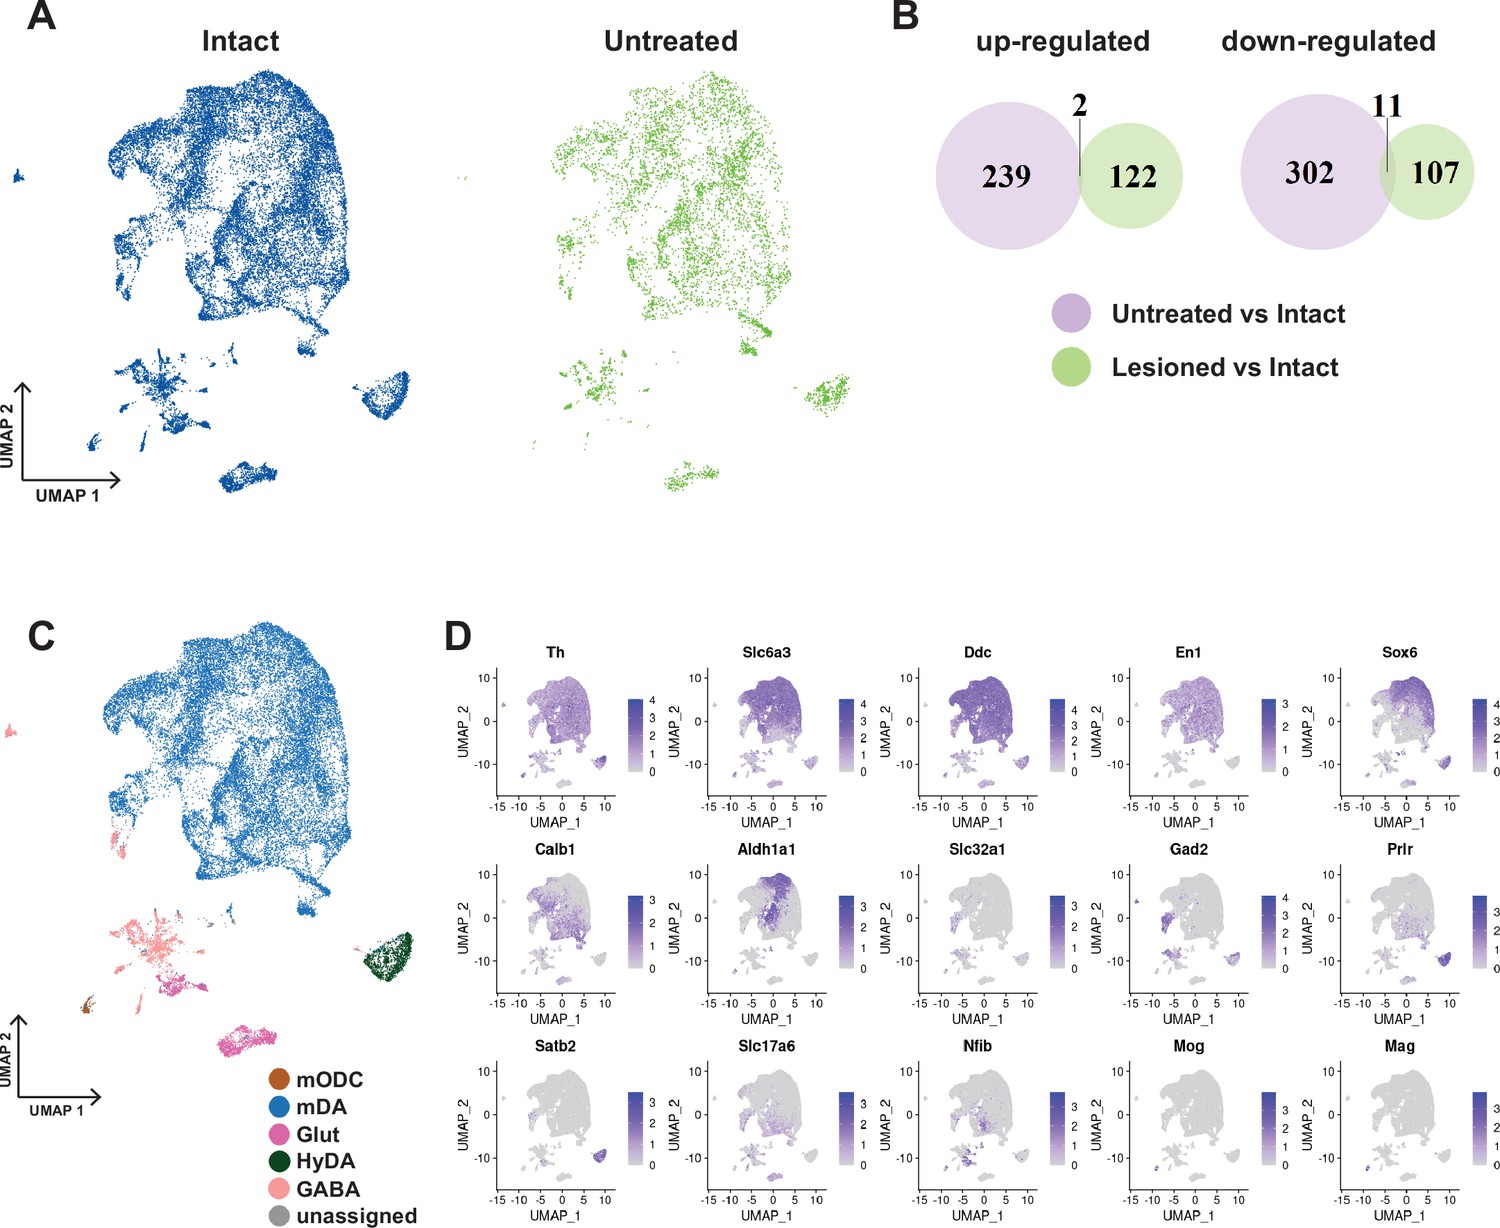
UMAP, Comparative DE analysis and canonical cell type markers in intact-untreated dataset.
(A) UMAP projections of the merged intact +untreated nuclei dataset, split by the group, intact vs untreated. (B) Venn diagrams showing differentially expressed genes between untreated vs intact nuclei and between lesioned vs intact nuclei as well as the overlap of the two sets of genes. (C) UMAP projection of this dataset (intact +untreated), color-coded for the major cell types. (D) Markers plotted in UMAP for different cell types in C.
Figure 8 with 1 supplement
Integration of human and mouse datasets.
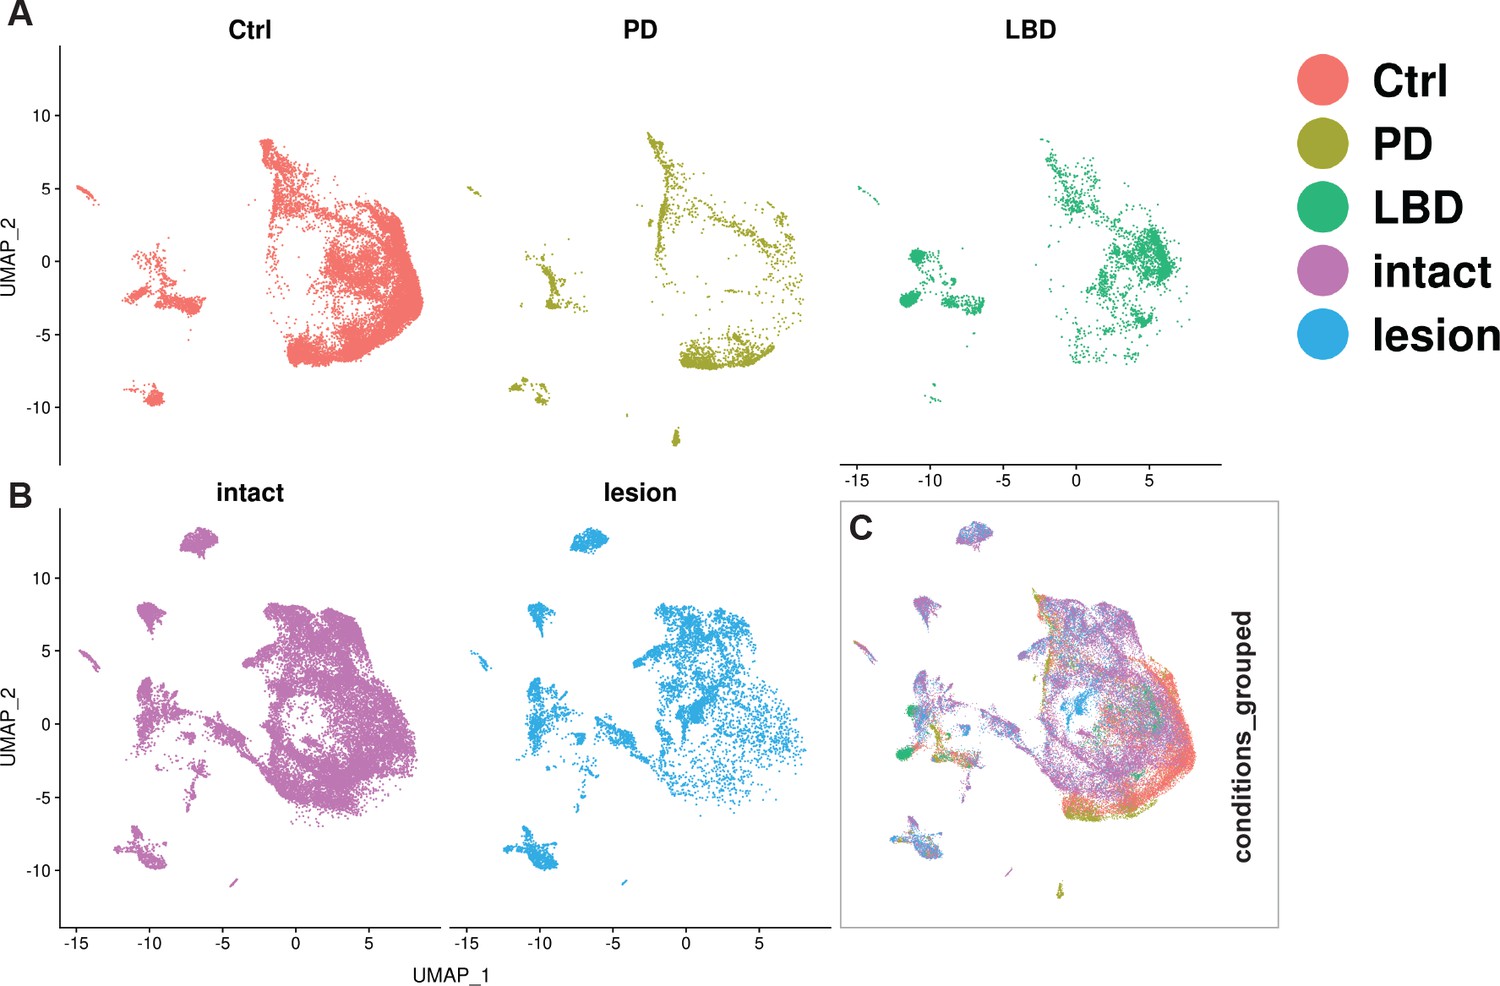
(A, B) UMAP projections of the integrated dopaminergic human (control +diseased) and mouse (intact +lesioned) nuclei, split per condition. This integrated dataset includes 25,003 human nuclei and 33,052 mouse nuclei. (C) UMAP projections of the human and mouse nuclei grouped by condition. Dataset was generated using the Seurat canonical correlation analysis (CCA). Ctrl = control neurotypical, PD = Parkinson’s disease, LBD = Lewy body dementia, intact = non-lesioned.
Figure 8—figure supplement 1
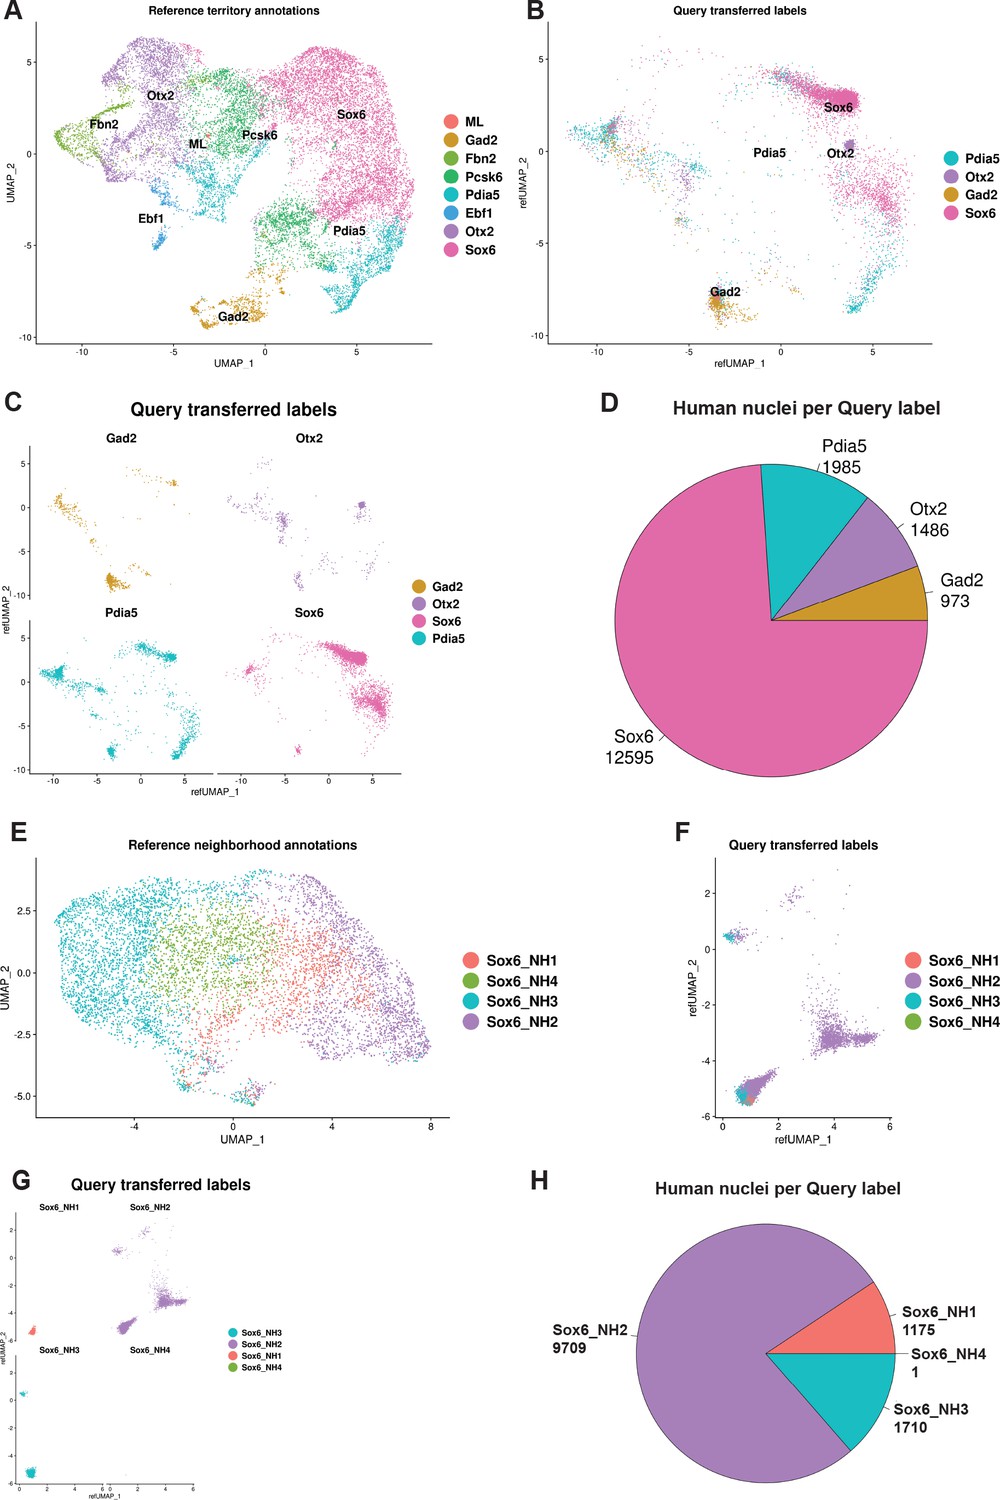
Integrated mouse-human mDA dataset.
(A, B) Mapped and annotated human dopaminergic control nuclei (B) by using mouse intact nuclei from mDA territories (A) used as reference UMAP. (C) Human nuclei in B, split by the transferred labels. (D) Numbers of mapped and annotated human nuclei in C, per transferred labels. (E, F) Mapped and annotated human dopaminergic control nuclei which were already labeled as Sox6 in C, by using mouse intact nuclei from only Sox6 territory used as reference UMAP. (G) Human nuclei in F, split by the transferred labels. (H) Numbers of mapped and annotated human nuclei in G, per transferred labels.
Additional files
-
Supplementary file 1
Sample information for the “all-nuclei” and well as the “intact-untreated” datasets in this study.
Cluster markers for the “all-nuclei” dataset.
- https://cdn.elifesciences.org/articles/89482/elife-89482-supp1-v1.xlsx
-
Supplementary file 2
Cluster markers for the dopaminergic “mDA” dataset.
- https://cdn.elifesciences.org/articles/89482/elife-89482-supp2-v1.xlsx
-
Supplementary file 3
The list of primary and secondary antibodies used in this study as well as the ML-clusters specific ISH probes Clic4, Creb5, Mmp12 and Sprr1a.
The list of Allen Mouse Brain Atlas experiments of which images were used in this study.
- https://cdn.elifesciences.org/articles/89482/elife-89482-supp3-v1.xlsx
-
Supplementary file 4
Lists of padlock probes for in situ RNA sequencing (ISS) and fluorescently labeled detection oligos used in this study.
- https://cdn.elifesciences.org/articles/89482/elife-89482-supp4-v1.xlsx
-
Supplementary file 5
Calculated normalized cell loss (see methods) and statistical comparisons of normalized cell loss across clusters, neighborhoods, and territories.
- https://cdn.elifesciences.org/articles/89482/elife-89482-supp5-v1.xlsx
-
Supplementary file 6
Identification of vulnerability and resilience modules’ genes.
Statistical comparisons of both vulnerability and resilience module scores across clusters, neighborhoods and territories.
- https://cdn.elifesciences.org/articles/89482/elife-89482-supp6-v1.xlsx
-
Supplementary file 7
Territory membership and annotations of clusters in integrated mDA dataset (mergedTERs_integCLUSTERs).
Statistical comparisons of both vulnerability and resilience module scores across integrated mDA clusters.
- https://cdn.elifesciences.org/articles/89482/elife-89482-supp7-v1.xlsx
-
Supplementary file 8
Differential gene expression analyses between (1) lesioned vs. intact, (2) ML vs. rest of the population, and (3) untreated vs. intact.
- https://cdn.elifesciences.org/articles/89482/elife-89482-supp8-v1.xlsx
-
Supplementary file 9
Gene set enrichment analysis for nine WGCNA co-expression modules (LmDAmod 1-9).
- https://cdn.elifesciences.org/articles/89482/elife-89482-supp9-v1.xlsx
-
Supplementary file 10
Gene set enrichment analysis of the genes uniquely dysregulated in ML clusters.
- https://cdn.elifesciences.org/articles/89482/elife-89482-supp10-v1.xlsx
-
MDAR checklist
- https://cdn.elifesciences.org/articles/89482/elife-89482-mdarchecklist1-v1.pdf
Download links
A two-part list of links to download the article, or parts of the article, in various formats.
Downloads (link to download the article as PDF)
Open citations (links to open the citations from this article in various online reference manager services)
Cite this article (links to download the citations from this article in formats compatible with various reference manager tools)
Transcriptomic atlas of midbrain dopamine neurons uncovers differential vulnerability in a Parkinsonism lesion model
eLife 12:RP89482.
https://doi.org/10.7554/eLife.89482.3


