Influenza-virus membrane fusion by cooperative fold-back of stochastically induced hemagglutinin intermediates
- Harvard Medical School, United States
- University of Colorado, Boulder, United States
- Howard Hughes Medical Institute, Harvard Medical School, United States
Figures
Figure 1 with 1 supplement
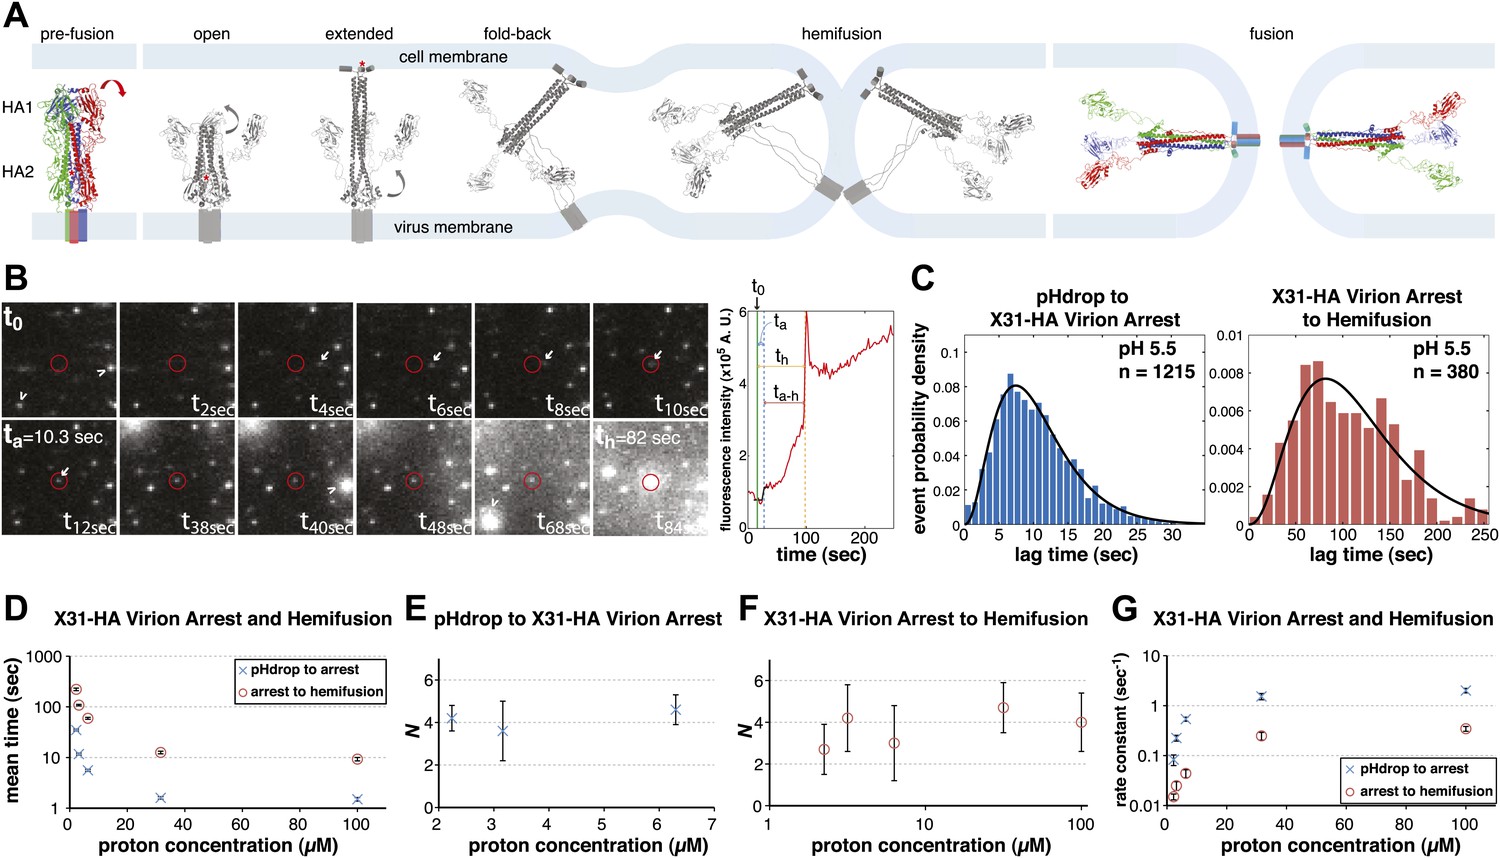
Single-virion analysis of fusion-promoting conformational change in influenza virus HA.
(A) Hydrophobic fusion peptide (red asterisk) is initially inserted into a pocket near the trimer threefold axis. HA assumes an ‘open' conformation upon proton binding allowing fusion-peptide release and membrane insertion. The fold-back of the extended intermediate causes hemifusion. The known pre-fusion and post-fusion HA structures are colored, and the inferred structural transitions are showed in gray. (B) Left: Tile view from pH drop (t0) of a virion initially displaying directed motion (white arrow) followed by arrest (ta) then hemifusion (th). Red circle marks the final virion location. Arrowheads mark two virions that were arrested at pH drop and hemifused at or just before t40 s and t68 s respectively. Right: Fluorescence trace of the virion circled in (A) (red line), line fitting the timing of virion arrest at its target location (black line) and parameters t0 (green vertical line), ta (blue horizontal line) and th (orange horizontal line) and arrest to hemifusion, ta–h (dark orange horizontal line). (C) tlag(pHdrop–arrest) for all virions for which arrest values could be derived (left) and tlag(arrest–hemifusion) for all virions for which both arrest and hemifusion values could be derived (right) with gamma-distribution fit (black line). Data are pooled from three independent experiments. (D) Mean tlag(pHdrop–arrest) and tlag(arrest–hemifusion). Error bars represent the standard error of the mean. (E) and (F) N derived from fitting tlag(pHdrop-arrest) (E) and tlag(arrest–hemifusion) (F) with gamma probability density. (G) Rate constants derived from fitting tlag(arrest–hemifusion) and tlag(pHdrop–arrest) with gamma probability density and keeping N fixed (N = 3) for both processes. (B–G) X31-HA virions have X31 HA in otherwise Udorn genetic background. Data shown are from representative experiments performed on the same day (n = 50 to 150) unless indicated that multiple experiments were pooled. Error bars represent 95% confidence interval for gamma fit-derived values unless otherwise indicated. Please refer to Figure 1—figure supplement 1 for all histogram and gamma-distribution fit data plotted in (D–G).
Figure 1—figure supplement 1
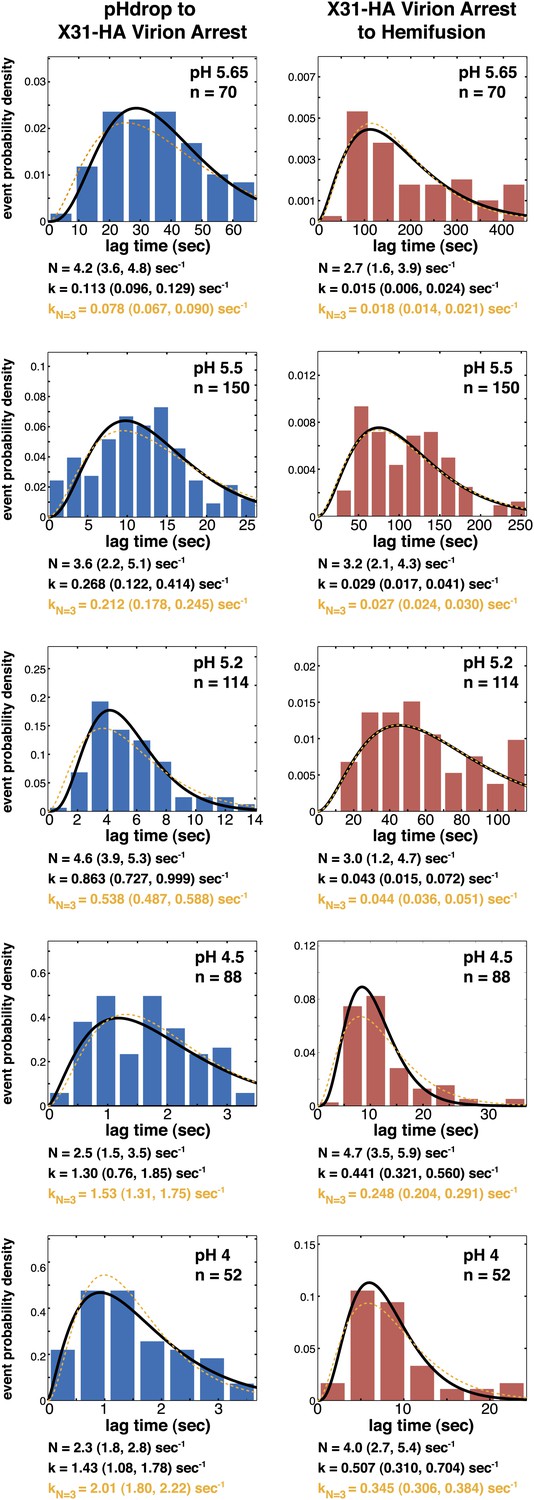
Histograms of tlag(pHdrop–arrest) (left) and tlag(arrest–hemifusion) (right) for X31-HA virions.
Data are fitted with gamma-probability density where both N and k were fitted (black line) or N was fixed (N = 3) (orange line). Fit-derived values are indicated below each histogram in corresponding black and orange font colors. Parentheses indicate 95% confidence interval for each fit-derived value.
Figure 2
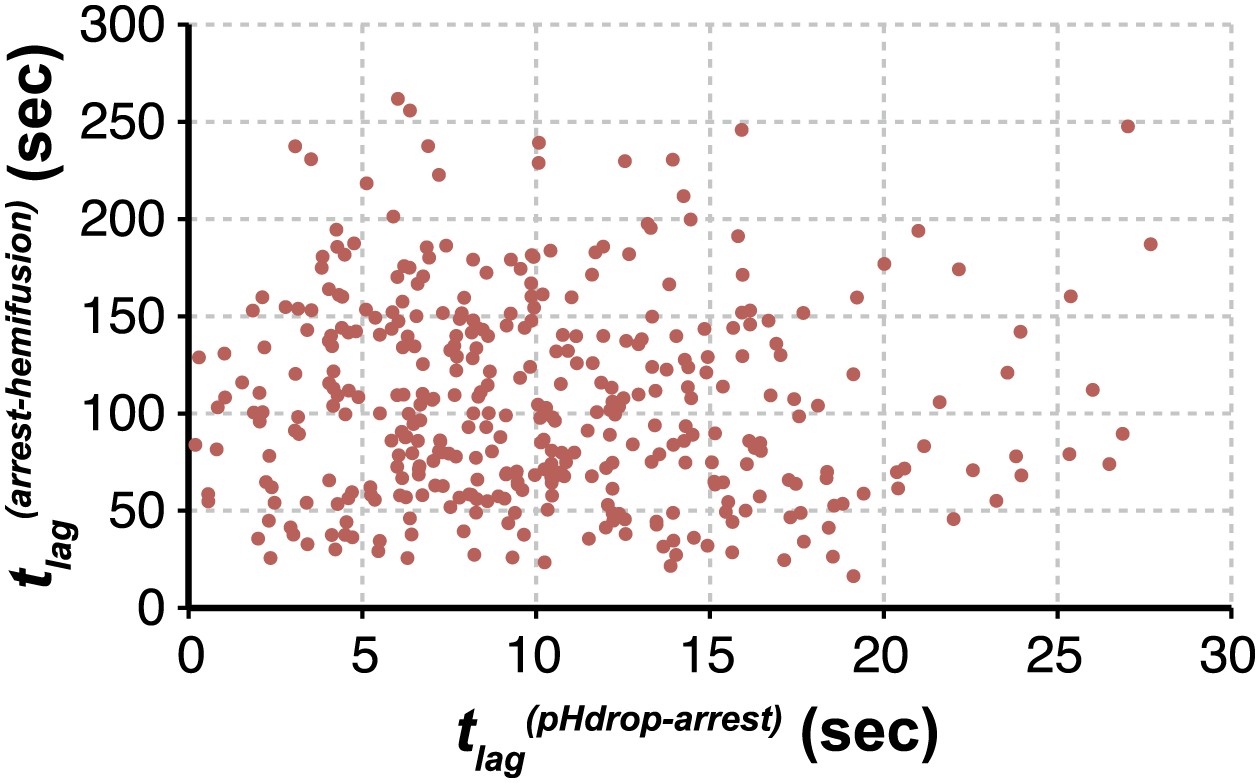
Virion arrest and hemifusion lag times are uncorrelated.
tlag(arrest–hemifusion) vs tlag(pHdrop–arrest) for X31-HA virions at pH 5.5 (n = 380). Data are pooled from three independent experiments also shown in Figure 1C, Table 1 and Figure 4A,B (X31–HA).
Figure 3 with 1 supplement
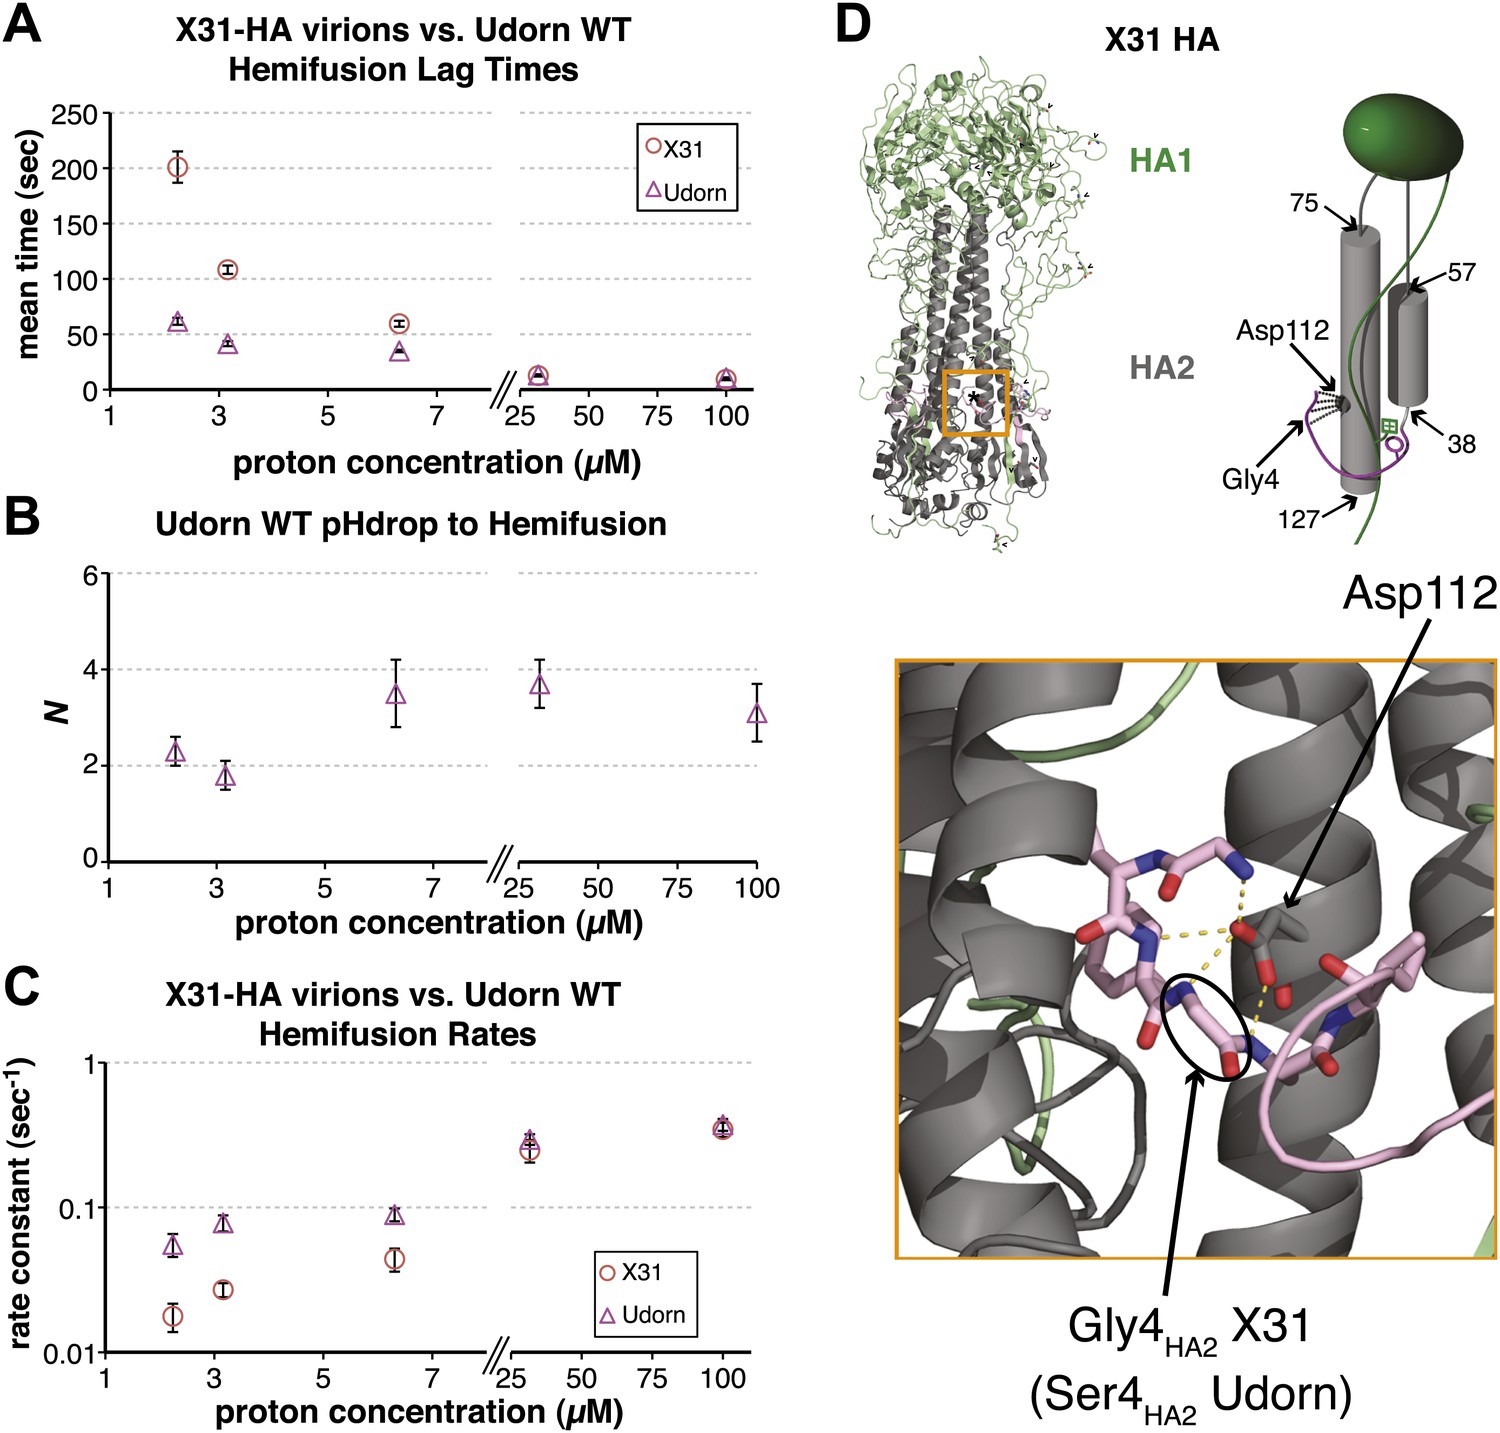
Udorn virions have accelerated hemifusion kinetics.
(A) Mean tlag(pHdrop–hemifusion) for Udorn and mean tlag(arrest–hemifusion) for X31-HA virions. Error bars represent the standard error of the mean. (B) N derived from fitting tlag(pHdrop–hemifusion) with gamma probability density. (C) Rate constants derived from fitting tlag(pHdrop-arrest) for Udorn and tlag(arrest–hemifusion) for X31-HA virions with gamma probability density and keeping each N fixed (N = 3). (B–C) Error bars represent 95% confidence interval for gamma fit-derived values. (A–C) Data shown are from representative experiments performed on the same day (n = 50 to 350). Please refer to Figure 3—figure supplement 1 for all histogram and gamma-distribution fit data plotted in (A–C). (D) Top left: Ribbon representation of X31-HA trimer (Weis et al., 1990) showing positions of all residues that differ in Udorn-HA (arrowhead) including Gly4HA2 (asterisk). Top right: Cartoon of an HA monomer emphasizing Asp112HA2-fusion peptide hydrogen bond network and showing positions of residues along the HA2 chain. Bottom: Close-up of the Asp112HA2-fusion peptide network (region marked with an orange square on top left).
Figure 3—figure supplement 1
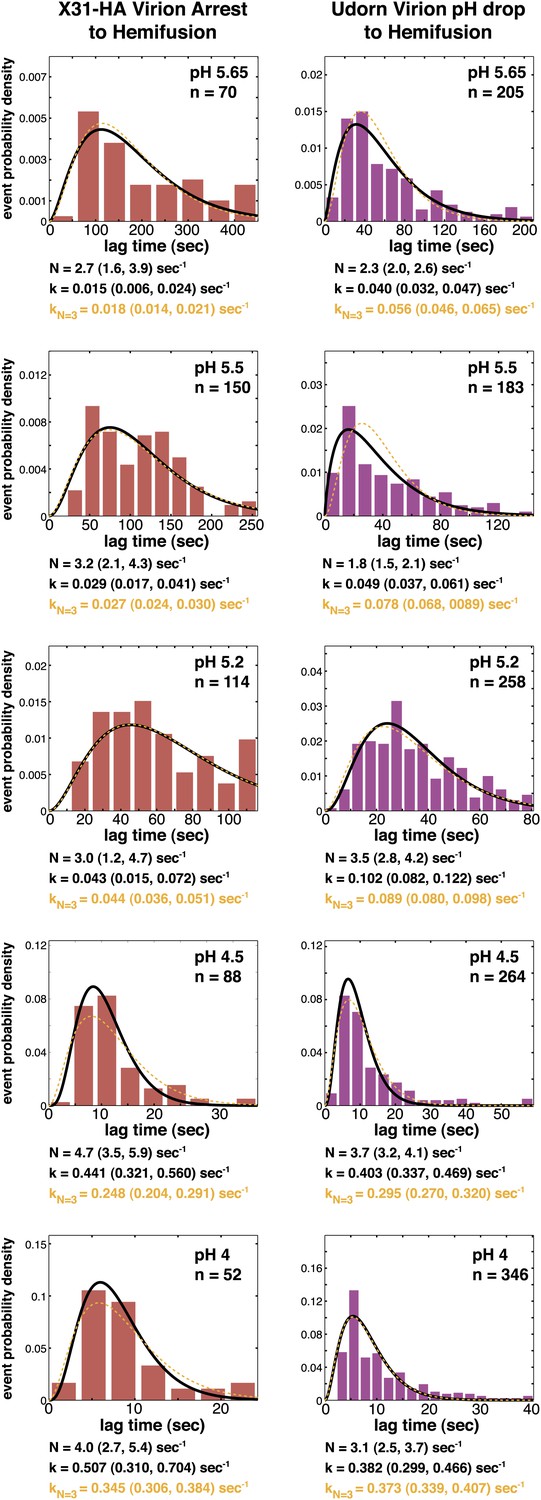
Histograms of tlag(arrest–hemifusion) for X31-HA virions (left) and of tlag(pHdrop–hemifusion) for Udorn WT virions (right).
Data are fitted with gamma-probability density where both N and k were fitted (black line) or N was fixed (N = 3) (orange line). Fit-derived values are indicated below each histogram in corresponding black and orange font colors. Parentheses indicate 95% confidence interval for each fit-derived value.
Figure 4 with 1 supplement

Fusion-peptide release from its pre-fusion pocket is a rate-limiting fusion-inducing molecular rearrangement in the physiologically relevant pH regime.
(A) pH 5.5, mean tlag(arrest–hemifusion) for X31-HA WT, and mean tlag(pHdrop–hemifusion) for Udorn WT, , and . (B) N derived from gamma-probability-density fits of the data analyzed also in (A). (C) Histogram of tlag(arrest–hemifusion) distribution for virions at pH 5.5 with the gamma-probability-density fit (black line). (D) pH 4.5, mean tlag(pHdrop–hemifusion) for indicated virions. (E) N derived from gamma-probability-density fits of the data analyzed also in (D). (A–E) Data shown are from pooled independent experiments (3, for Udorn and X31-HA WT virions, and 2, for Udorn and X31-HA mutant virions; n = 150 to 900). Error bars represent the standard error of the mean (A and D) or the 95% confidence interval for gamma fit-derived values (B and E). Please refer to Figure 4—figure supplement 1 for all histogram and gamma-distribution fit data plotted in (A, B, D and E).
Figure 4—figure supplement 1
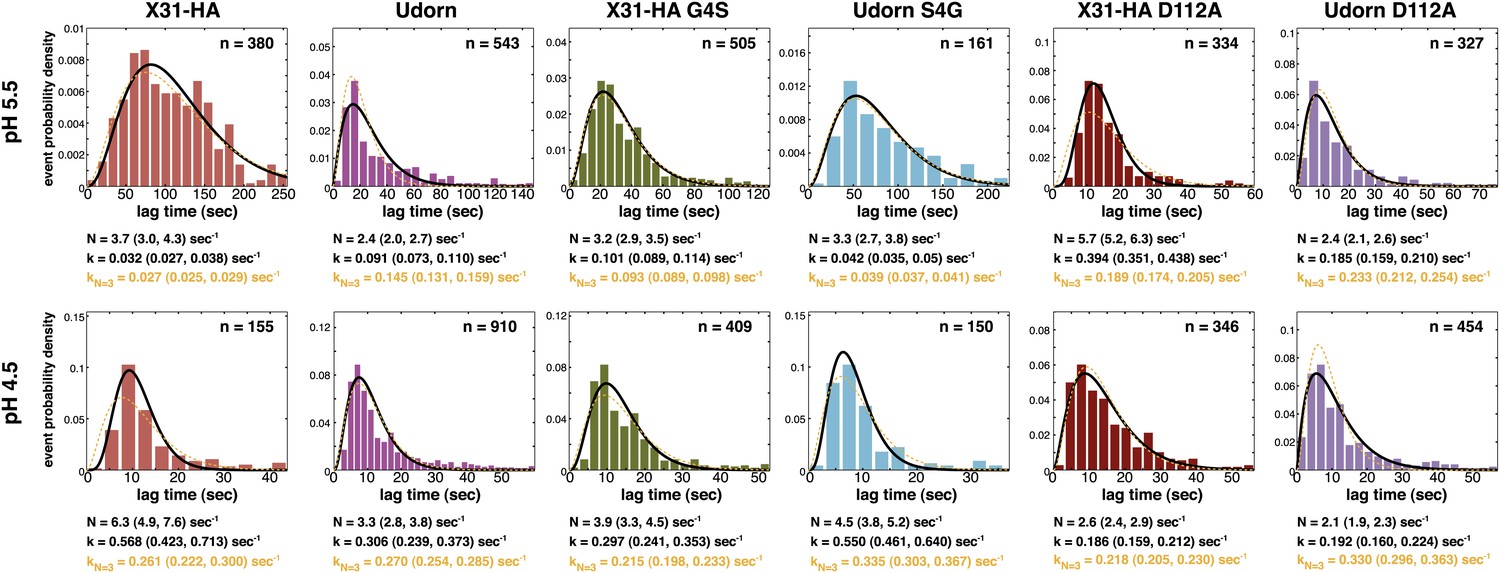
Histograms of tlag(arrest–hemifusion) distributions for X31-HA WT, virions and of tlag(pHdrop–hemifusion) for Udorn WT, , and at pH 5.5 (top).
Histograms of tlag(pHdrop–hemifusion) for all virions at pH 4.5 (bottom). Data are fitted with gamma-probability density where both N and k were fitted (black line) or N was fixed (N = 3) (orange line). Fit-derived values are indicated below each histogram in corresponding black and orange font colors. Parentheses indicate 95% confidence interval for each fit-derived value.
Figure 5
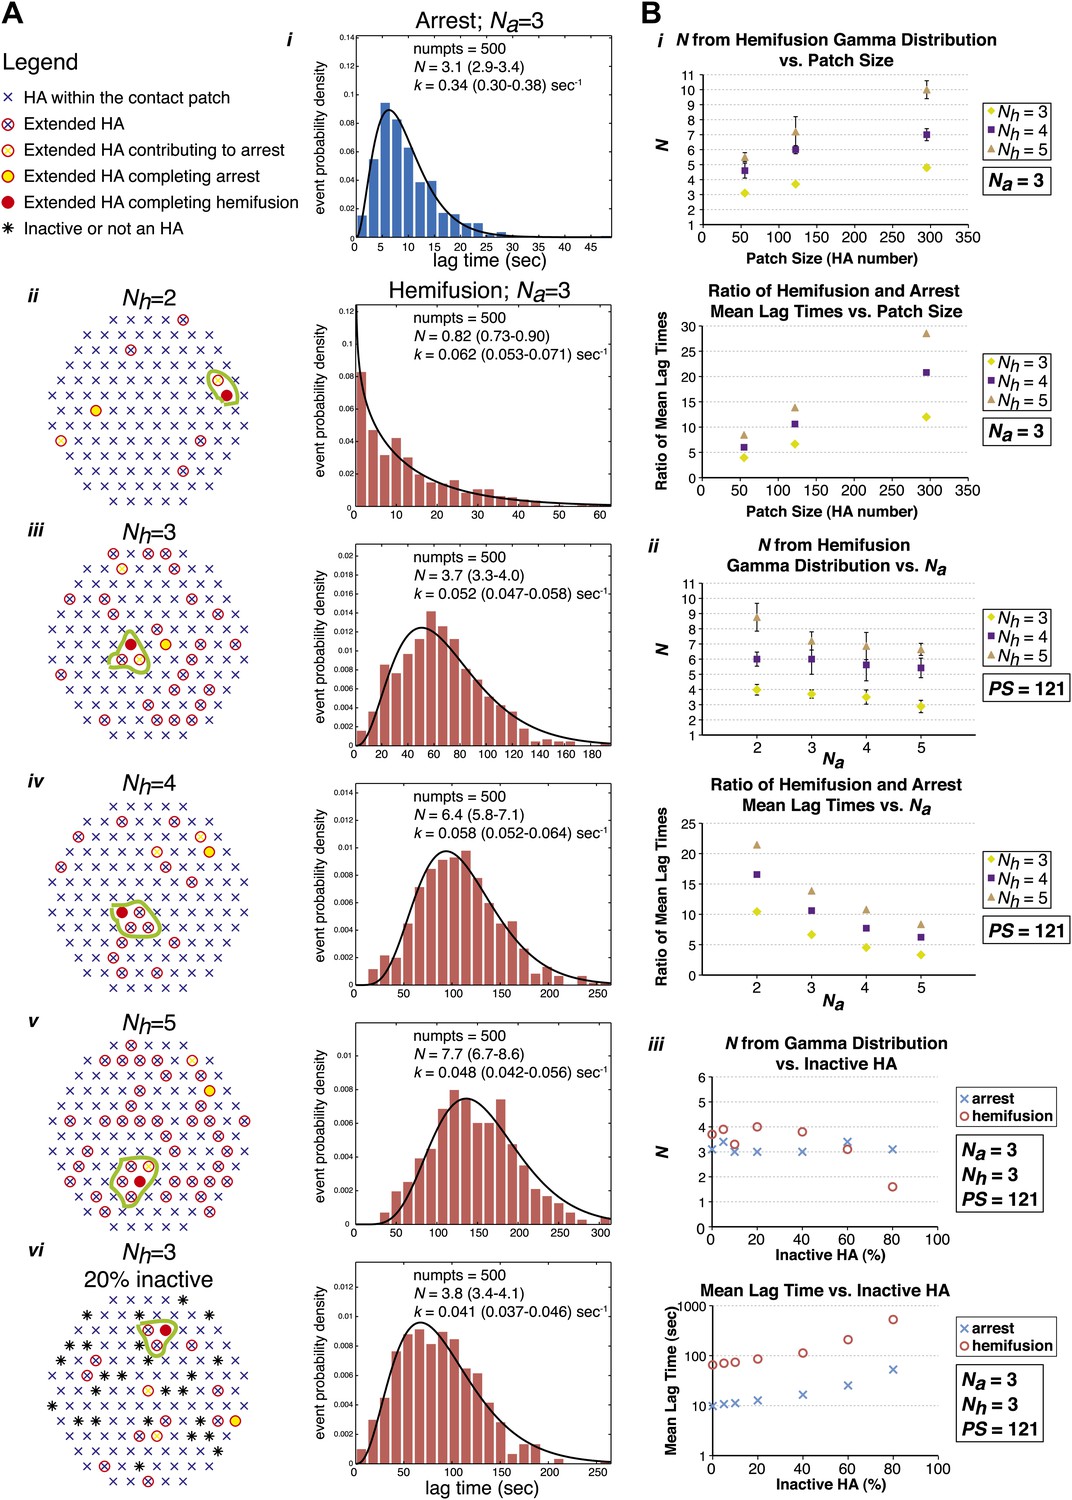
Computer simulation of the proposed model for HA-mediated membrane fusion.
(A) Left: A contact patch containing 121 HA trimers and examples of individual virions and their contact-area HAs that have extended and inserted their fusion peptides into the target membrane by the time of hemifusion, for simulated Nh values of 2–5 and assuming either a contact patch consisting solely of active HAs (ii–v) or containing 20% inactive HAs randomly distributed throughout the contact area (vi). The neighboring HA clusters inducing hemifusion in each case are circled in green. Right: Na = 3 and patch size = 121 containing either 0% or 20% inactive HAs as indicated in the corresponding diagrams; simulation-derived tlag(pHdrop–arrest) distributions (i) and tlag(arrest–hemifusion) distributions for Nh = 2–5 (ii–vi) along with gamma-distribution fits (black curves) and fit-derived values for N and k. Parentheses indicate 95% confidence interval for each fit-derived value. We collected data for 500 virions in each example. (B) (i) Na = 3; effect of patch size (PS) and Nh either on gamma-fit-derived values for N from hemifusion lag-time distributions (top) or on ratios of hemifusion and virion arrest mean lag times (bottom). (ii) Patch size = 121; effect of Na and Nh either on gamma-fit-derived values for N from hemifusion lag-time distributions (top) or on ratios of hemifusion and virion arrest mean lag times (bottom). (iii) Na = 3, Nh = 3, patch size = 121; gamma-fit-derived N values (top) and mean lag times (bottom) for arrest and hemifusion at a range of inactive HA concentrations. Data shown are averages, and error bars, when included, represent standard deviation for five independent simulations each performed for 500 virions. For MATLAB script and accompanying functions please refer to Source code 1.
Figure 6
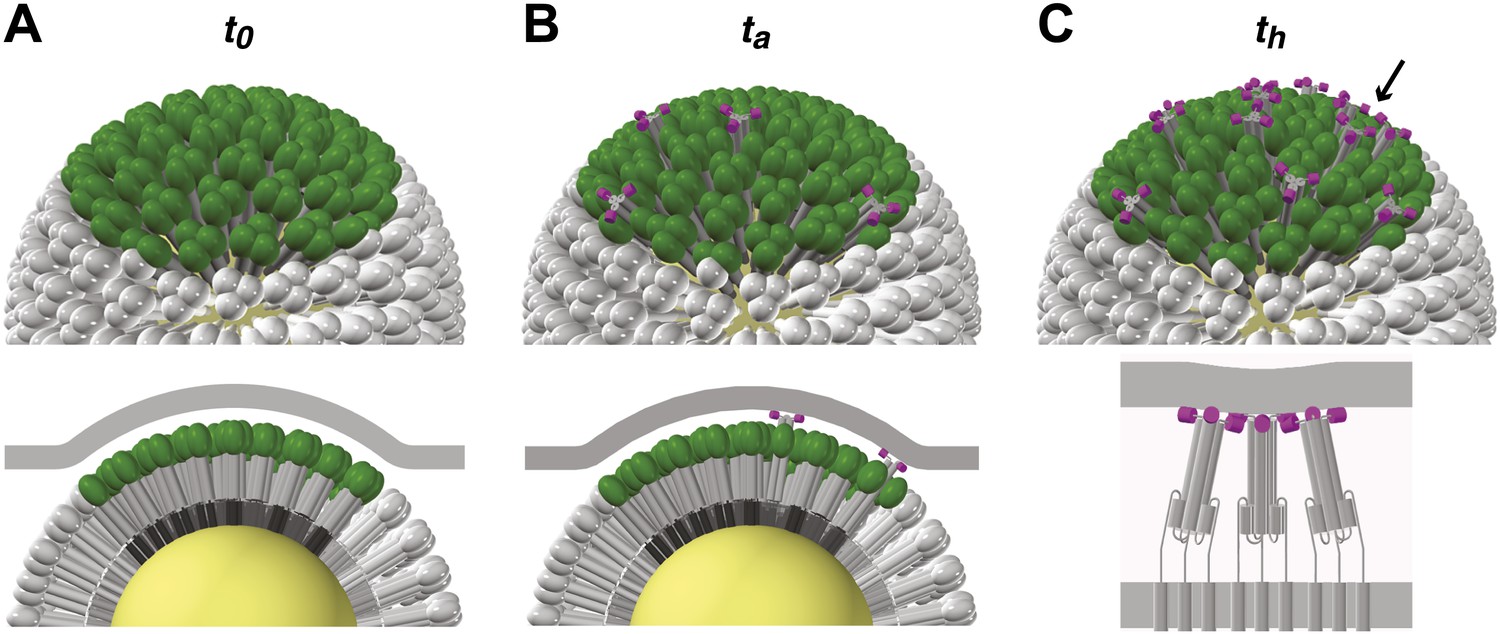
Stages of HA-mediated membrane fusion.
Virion dimensions in the diagram are based on a spherical particle, 55 nm in membrane-to-membrane diameter (Calder et al., 2010). There are approximately 50 trimers in the contact area between the virus and the target cell, shown in green (HA1) and gray (HA2); the trimers outside of the contact area are shown in white. The contact area illustrated represents a lower limit, and the contact area for the somewhat elongated particles in our current experiments can likely accommodate up to approximately 120 HA trimers (see ‘Results' and ‘Materials and methods'). For clarity we present a virion surface containing only HA, but the conclusions we draw are independent of specific HA arrangement and potential irregularities in this region of contact (see Figure 5). We have also not included the target membrane in the perspective views (top), nor have we depicted the sialic-acid receptors in the cross-section views (bottom). The t0, ta and th labels are included to correlate the molecular transitions depicted in the model with the events defined in Figure 1B. (A) Virion engages a target membrane by HA-receptor interactions but can still move freely relative to the target-membrane area of contact. (B) Fusion peptides of several independent HA trimers have inserted into the target-membrane surface, immobilizing the virion on the target-cell surface. (C) Engagement of fusion peptides from three neighboring HA trimers allows subsequent rearrangements leading to hemifusion. HA1s are left out for clarity from the bottom panel, which shows three neighboring trimers about to fold back.
Videos
Video 1
X31-HA WT virion hemifusion at pH 5.5 from t0 to t230 s at 20× the actual rate.
Video 2
Virion arrest is an irreversible intermediate of fusion. X31-HA WT virions were imaged. pH was dropped from 7.4 to 5.65 then brought back up to 7.4. Buffer flow was kept constant except when it was stopped to allow for the source buffer exchange back to neutral (between approximately t45 s and t95 s).
Video 3
Virion arrest is an irreversible intermediate of fusion. A different field of view of the same experimental lane used in Video 2 after the events imaged in Video 2. pH was dropped to pH 5.65. There is a marked reduction in the mobile fraction in Video 3 relative to early times shown in Video 2. Furthermore, prearrested virions proceeded to hemifusion despite the intermediate reneutralization step. The videos are shown at 20× the actual rate.
Video 4
Udorn WT virion hemifusion at pH 5.5 from t0 to t90 s at 20× the actual rate.
Video 5
virion hemifusion at pH 5.5 from t0 to t90 s at 20× the actual rate.
Video 6
virion hemifusion at pH 5.5 from t0 to t180 s at 20× the actual rate.
Video 7
virion hemifusion at pH 5.5 from t0 to t40 s at 20× the actual rate.
Video 8
virion hemifusion at pH 5.5 from t0 to t35 s at 20× the actual rate.
Video 9
X31-HA WT virions were imaged under constant, pH-7.4 buffer flow, starting at ∼3 min post virus attachment. The video is shown at 10× the actual rate.
Video 10
A different field of view of the same experimental lane used in Video 9. X31-HA WT virions were imaged starting at ∼7 min post virus attachment under constant buffer flow and pH was dropped to 5.5. pH drop can be observed at just under 2 s into the video as a drop in background fluorescence, concomitant with which virions accelerate. The video is shown at 10× the actual rate.
Tables
Table 1
Arrest and hemifusion statistics for X31-HA WT and arrest statistics for virions
| Virion arrest to hemifusion* | pH drop to virion arrest† | ||
| pH 5.5 | |||
| X31-HA WT‡ | X31-HA WT‡ | § | |
| Number of virions | 380 | 1215 | 401 |
| Mean lag time (s)# | 105.1 ± 2.7 | 10.3 ± 0.2 | 9 ± 0.4 |
| N¶ | 3.7 ± 0.6 | 3.4 ± 0.2 | 3.4 ± 0.3 |
| Rate constant (s−1) ¶ | 0.032 ± 0.006 | 0.33 ± 0.02 | 0.37 ± 0.03 |
| Mobile at pH drop** | 81% | 76% | |
| Mobile that hemifused** | 75% | 65% | |
| Static that hemifused** | 82% | 81% | |
| pH 4.5 | |||
| Number of virions | 155 | 392 | 385 |
| Mean lag time (s) # | 13.3 ± 0.6 | 1.4 ± 0.004 | 1.4 ± 0.004 |
| Mobile at pH drop** | 46% | 38% | |
-
*
tlag(arrest–hemifusion) for all virions for which both arrest and hemifusion values could be derived.
-
†
tlag(pHdrop–arrest) for all mobile virions for which arrest values could be derived.
-
‡
X31-HA WT data are pooled from three independent experiments.
-
§
data are pooled from two independent experiments.
-
#
Errors represent the standard error of the mean.
-
¶
-
**
Percentages are derived from entire data sets.
Additional files
-
Source code 1
Simulation script, s_arrest_hemifusion_simulation.m, and accompanying functions, generate_patch.m, s_randomdist.m, isaN2tuplet.m, findFlippedNeighbors.m, for MATLAB version R2012a.
- https://doi.org/10.7554/eLife.00333.023
Download links
A two-part list of links to download the article, or parts of the article, in various formats.
Downloads (link to download the article as PDF)
Open citations (links to open the citations from this article in various online reference manager services)
Cite this article (links to download the citations from this article in formats compatible with various reference manager tools)
Influenza-virus membrane fusion by cooperative fold-back of stochastically induced hemagglutinin intermediates
eLife 2:e00333.
https://doi.org/10.7554/eLife.00333


