The starvation hormone, fibroblast growth factor-21, extends lifespan in mice
- University of Texas Southwestern Medical Center, United States
- Howard Hughes Medical Institute, University of Texas Southwestern Medical Center, United States
- Howard Hughes Medical Institute, Salk Institute for Biological Studies, United States
Figures
Figure 1
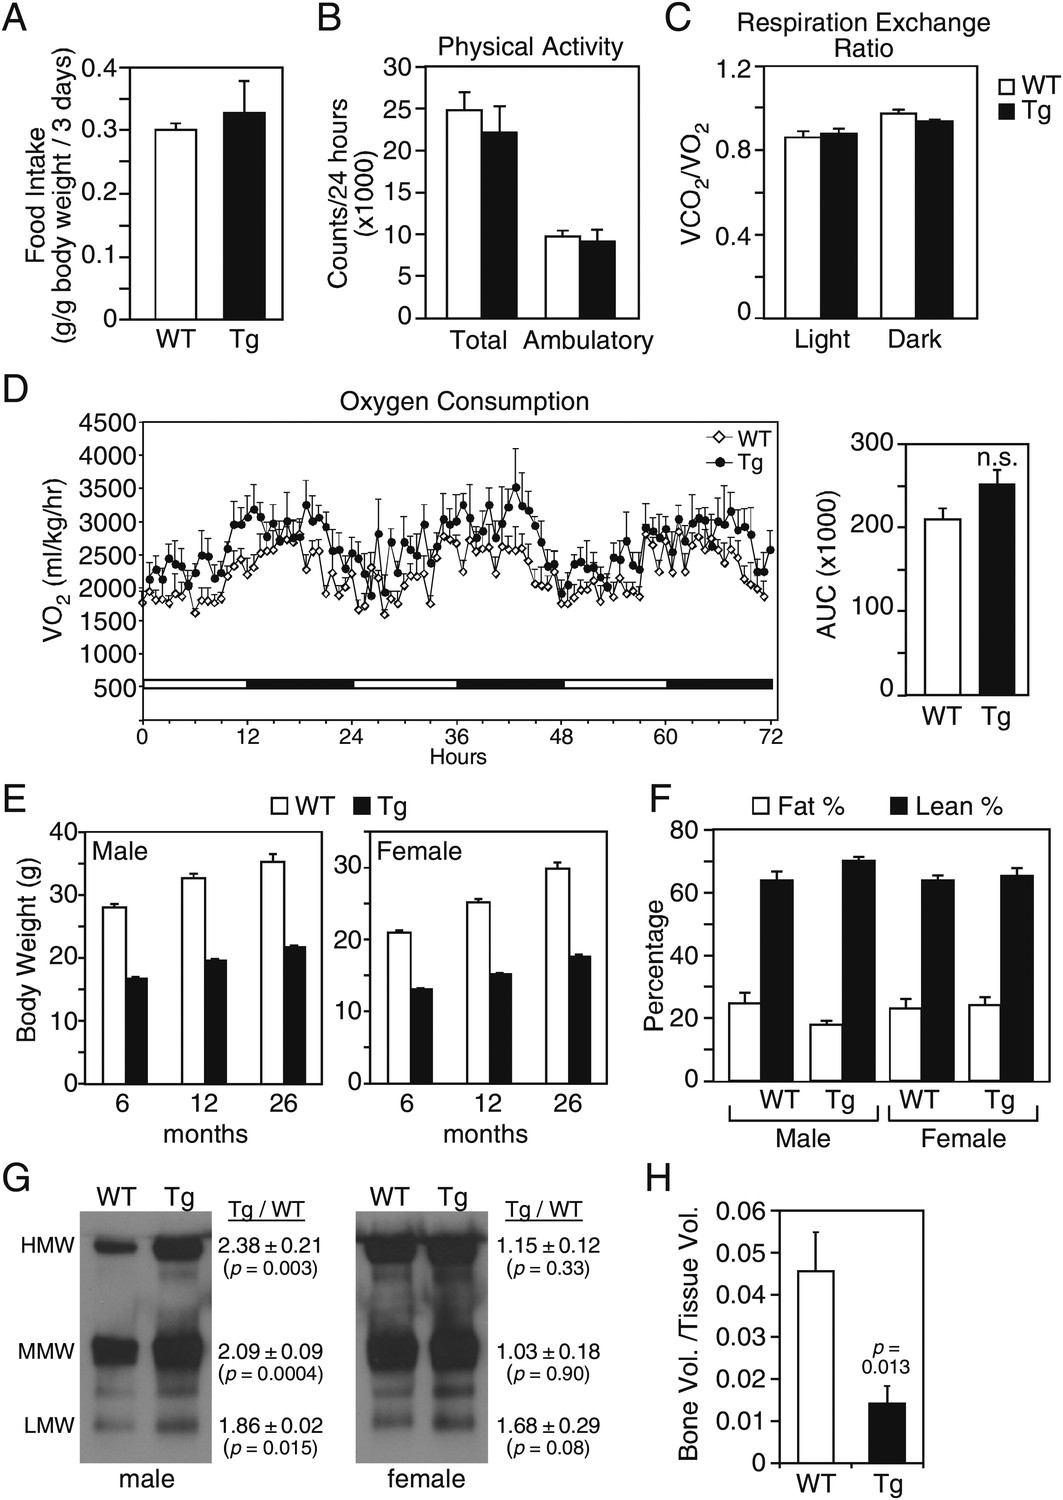
Metabolic parameters in aging wild-type and FGF21-transgenic mice.
(A) Food intake, (B) physical activity, including total horizontal and ambulatory activity, (C) respiratory exchange ratio (VCO2/VO2) and (D) oxygen consumption (VO2) data for 30-month-old male wild-type (WT) and FGF21-transgenic (Tg) mice (n=6/group) housed singly in metabolic cages. For (D), the area under the curve (AUC) data are shown in the right panel. (E) Body weights of male and female mice measured at 6, 12 and 26 months. Measurements were done on all surviving mice in the cohorts (n=27–54/group). (F) Fat and lean mass percentages were measured in 26-month-old mice (n=5–6/group). (G) Adiponectin oligomer forms, including high molecular weight (HMW), medium molecular weight (MMW) and low molecular weight (LMW) forms, were measured in plasma from 26- to 27-month-old male and female WT and FGF21-Tg mice. Representative western blots using plasma from single animals are shown together with the ratios of the different adiponectin forms in FGF21-Tg and WT plasma (n=4/group). (H) Quantification of trabecular bone volume by μCT analysis using tibiae from 33- to 35-month-old male WT and FGF21-Tg mice (n=4–5/group). All data are presented as the mean ± SEM.
Figure 2
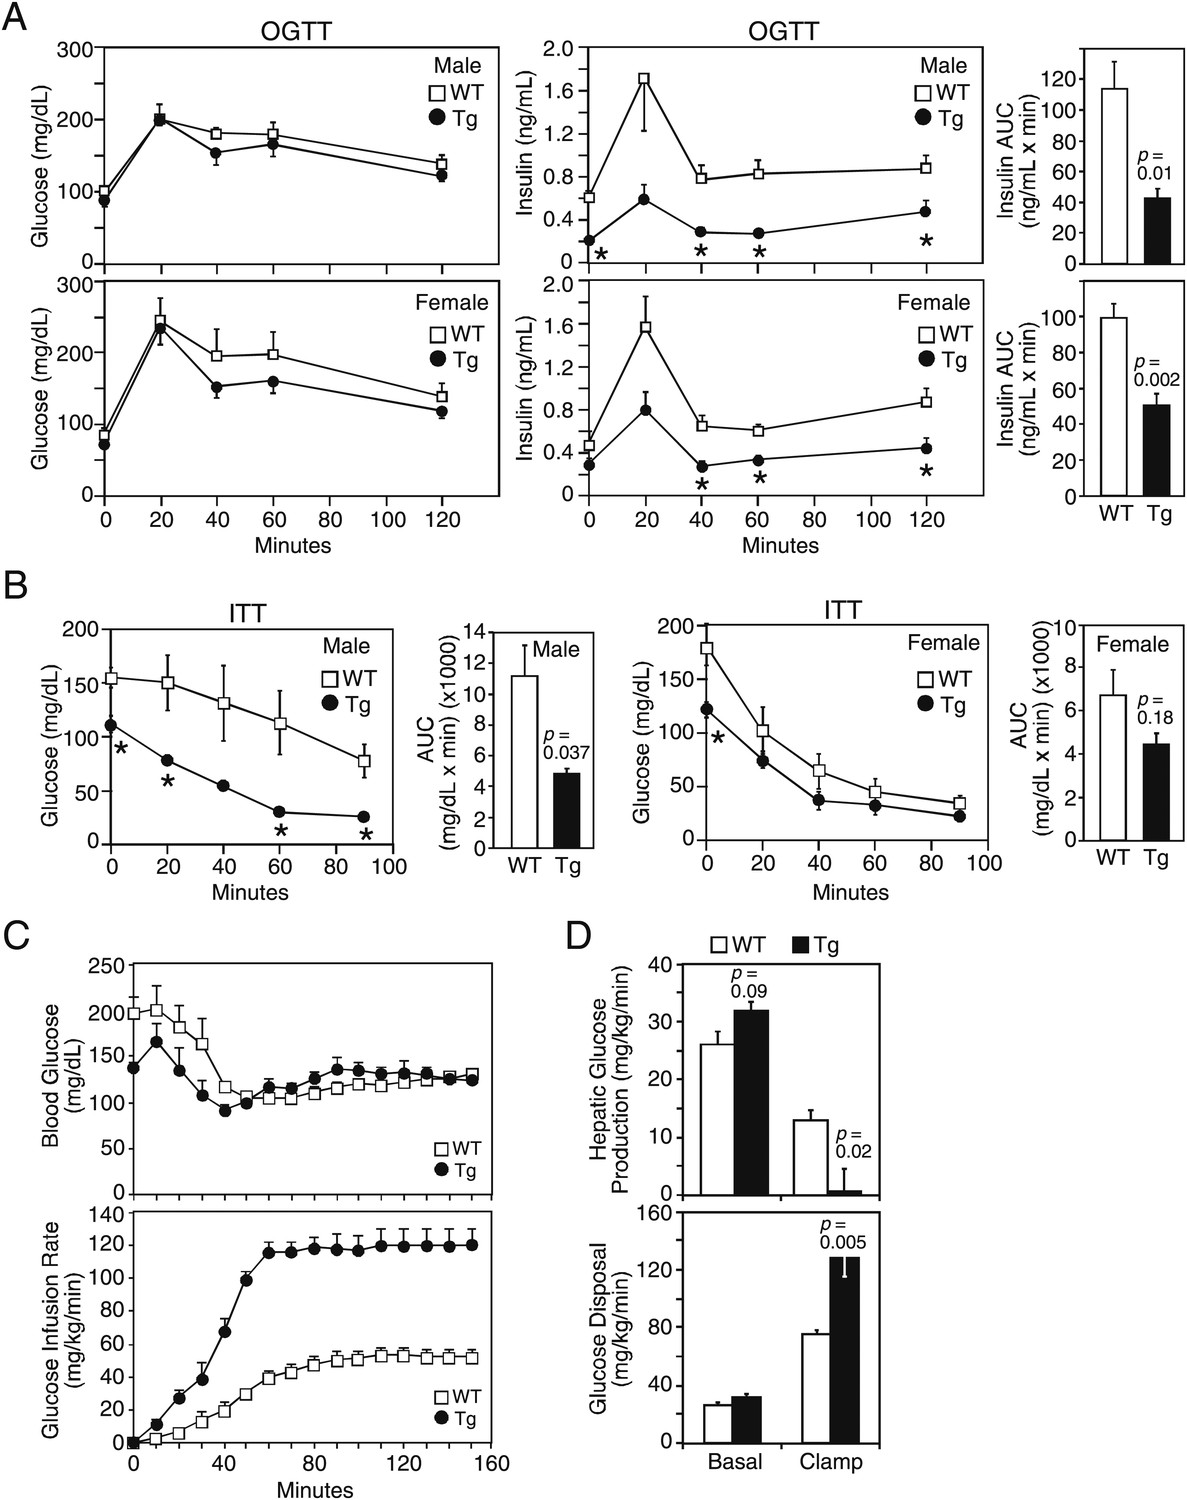
FGF21-transgenic mice have increased insulin sensitivity.
26–27-month-old wild-type (WT) and FGF21-transgenic (Tg) male and female mice (n=5/group) were subjected to (A) oral glucose tolerance tests or (B) insulin tolerance tests. Plasma glucose and insulin levels were measured as indicated. Quantification of the area under the curve (AUC) is shown in the panels to the right. (C, D) Hyperinsulinemic-euglycemic clamp studies were performed on 6- to 8-month-old male WT and FGF21-Tg mice (n=6/group). Insulin was infused at 2 mU/kg/min and (C) blood glucose (upper panel) was clamped at 120 mg/dL during the steady-state period (t=110–150 min) using a variable glucose infusion rate (lower panel). The glucose infusion rate in FGF21-Tg mice is statistically different (p<0.05) from WT mice at all points after t=0 min. (D) Rates of hepatic glucose production (upper panel) and whole-body glucose disposal (lower panel) in WT (n=6) and FGF21-Tg (n=3) mice during the basal and steady-state periods of the clamp.
Figure 3
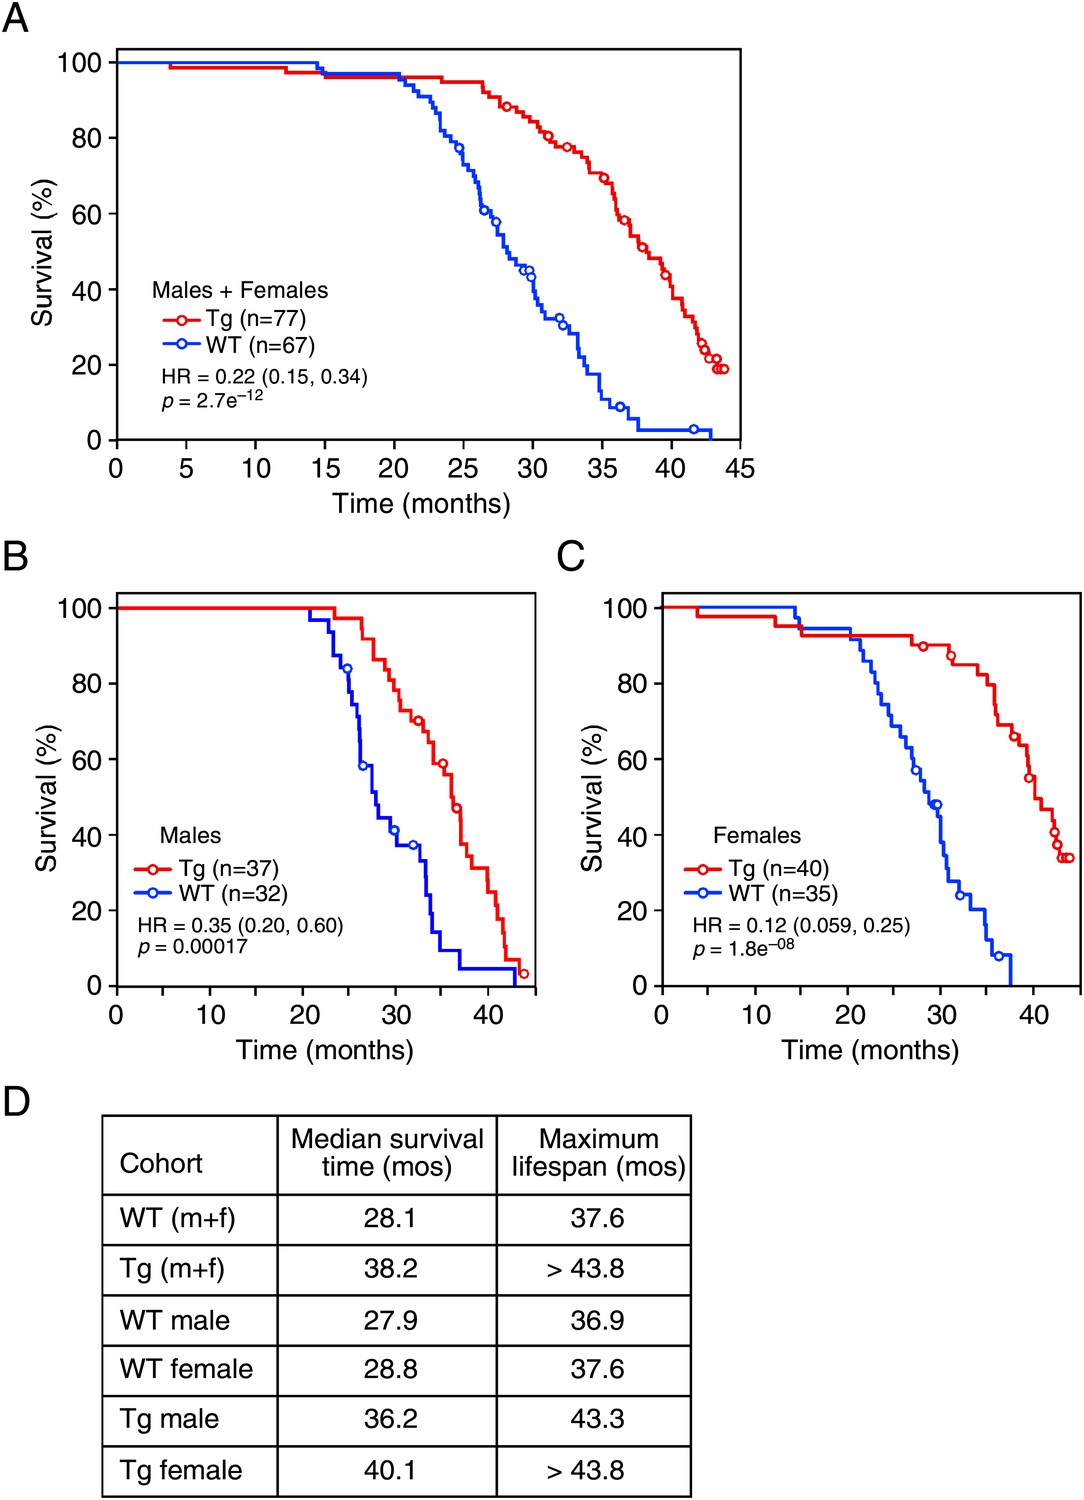
FGF21 extends lifespan.
(A–C) Kaplan–Meyer survival curves for wild-type (WT) and FGF21-transgenic (Tg) mice are shown. (A) Combined male and female data; (B) male data; (C) female data. (D) Median survival time (at 50th percentile) and maximum lifespan (at 95th percentile) for each cohort. Hazard ratios (HR) and 95% confidence intervals are shown for Tg vs WT mice.
Figure 4
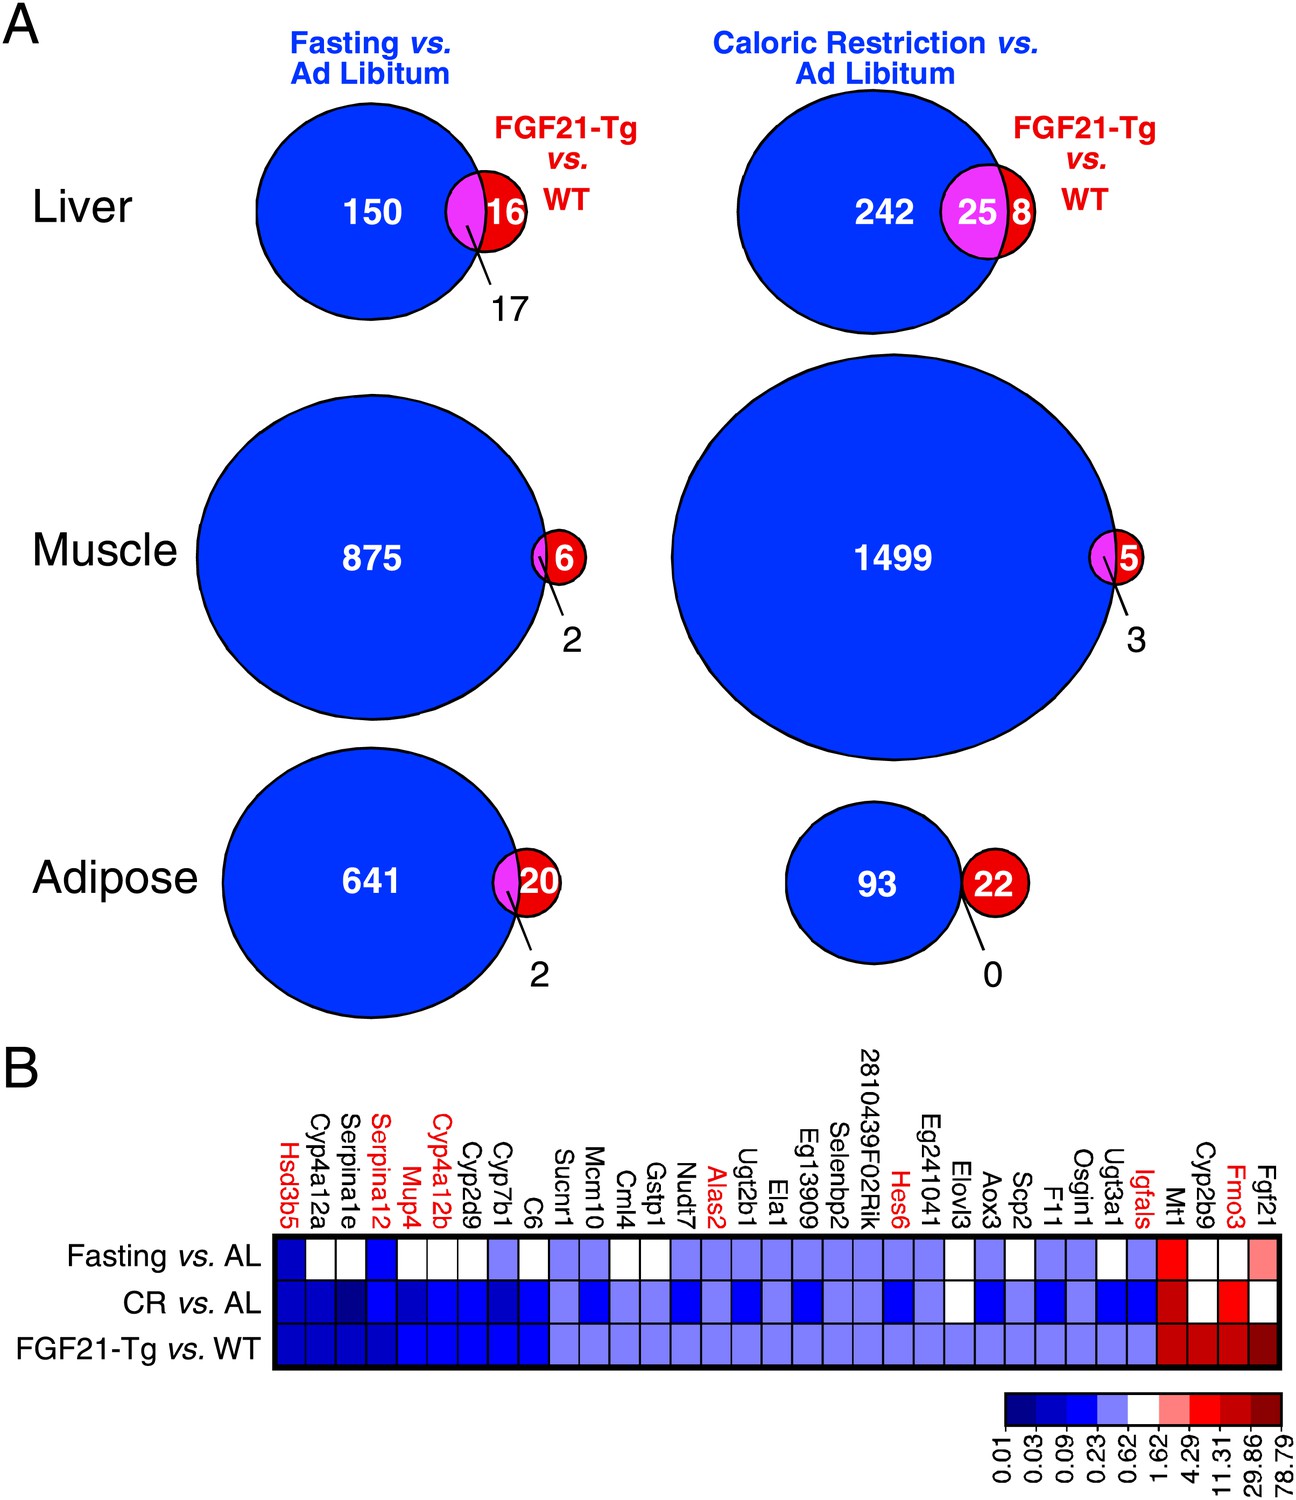
Genes regulated by FGF21 and caloric restriction overlap in liver.
(A) Venn diagrams showing overlap of genes significantly regulated in liver, muscle and adipose tissue of FGF21-transgenic (Tg) vs wild-type (WT) mice (FDR<0.10, >twofold regulation) compared to the same gene expression analysis in calorically restricted (CR) vs ad libitum (AL) or fasted vs AL mice. (B) Heat map of genes significantly regulated in liver of FGF21-Tg vs WT (FDR<0.10, >twofold regulation) compared to expression of the same liver gene set regulated by fasting or CR. Microarray analysis was performed using liver, epididymal white adipose tissue and gastrocnemius muscle from wild-type and FGF21-Tg male mice and male C57BL/6J mice subjected to 60% caloric restriction for 2 weeks or a 24 hr fast. All mice used in these studies were 3 months old at the end of the study.
Figure 5
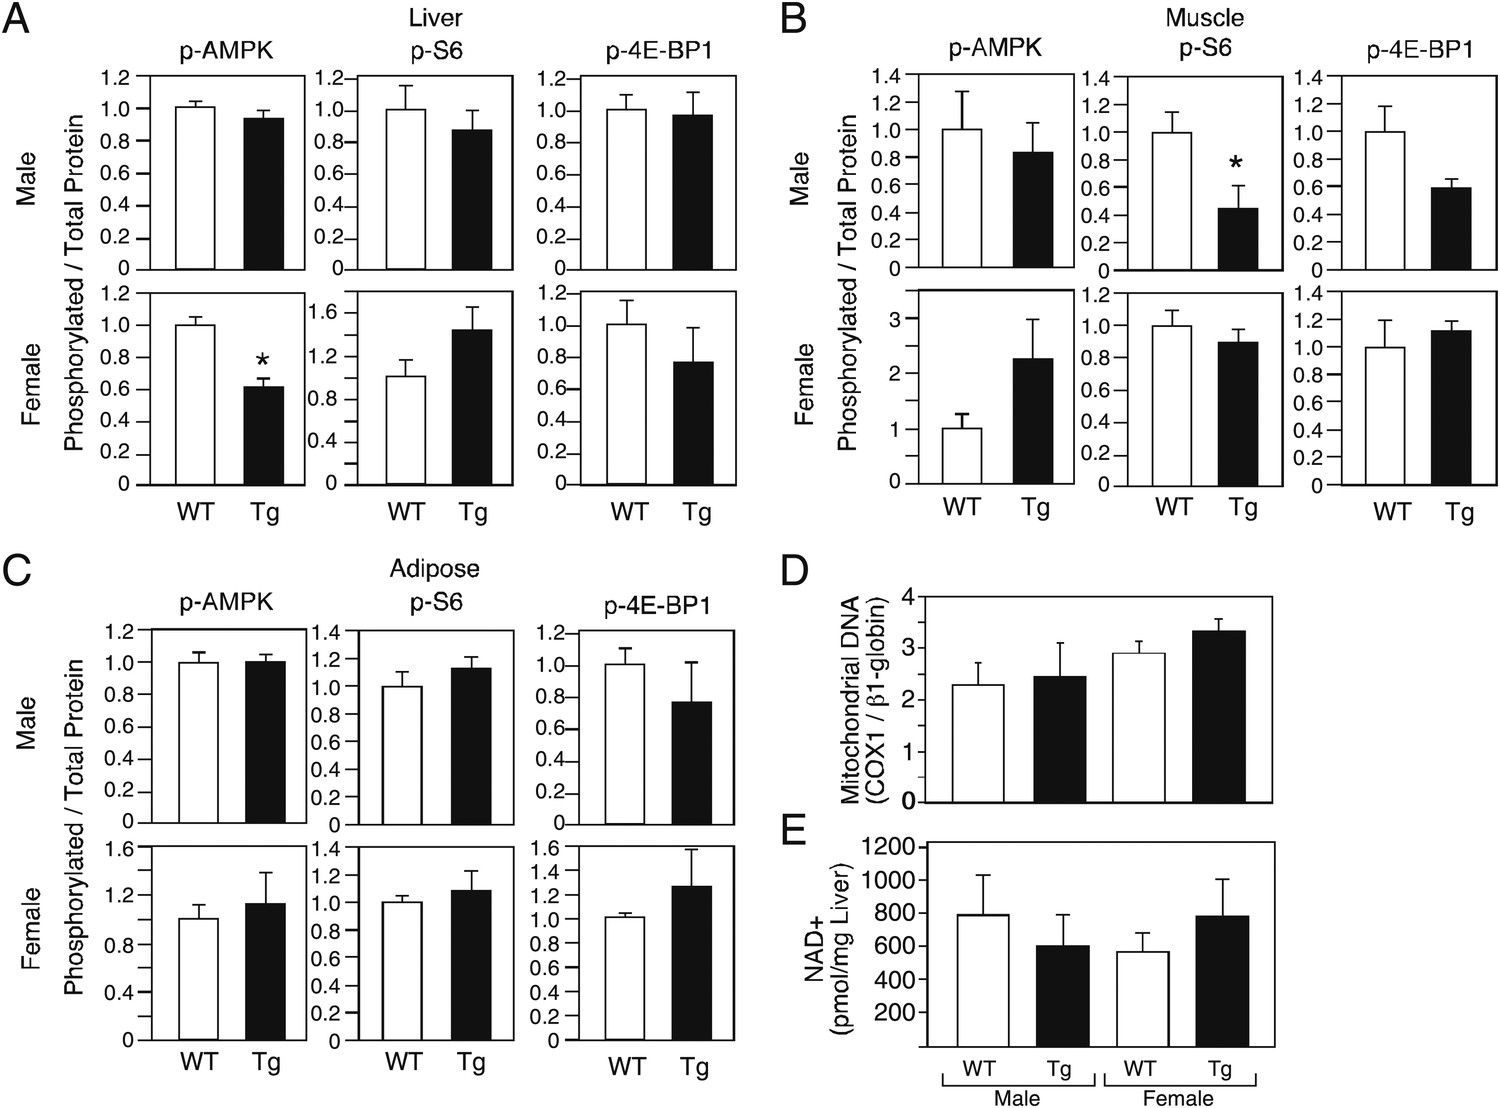
Evaluation of markers of AMP kinase, mTOR and sirtuin pathway activity in FGF21-Tg mice.
Phosphorylated levels of AMP kinase, S6, and 4E-BP1 in (A) liver, (B) gastrocnemius muscle, and (C) epididymal white adipose tissue; (D) mitochondrial DNA content and (E) NAD+ concentrations in liver of 26_28-month-old male and female wild-type (WT) and FGF21-transgenic (Tg) mice (n=4/group except for female adipose tissue, where n=2/group; all data are presented as the mean ± SEM; *p<0.05).
Tables
Table 1
Plasma and hepatic parameters
| Male | Female | |||||
| WT | Tg | p | WT | Tg | p | |
| Plasma | ||||||
| IGF-1* (ng/mL) | 381.52±42.31 | 250.1±13.76 | 0.03 | 427.94±56.35 | 171.84±11.71 | 0.009 |
| Insulin* (ng/mL) | 0.90±0.13 | 0.45±0.09 | 0.04 | 0.63±0.12 | 0.34±0.04 | 0.08 |
| Glucose* (mg/dL) | 155±9.21 | 111.6±8.03 | 0.008 | 181.75±19.77 | 121.4±7.50 | 0.048 |
| Ketone bodies* (μM) | 118.38±30.51 | 221.02±38.10 | 0.07 | 140.61±17.46 | 294.56±48.10 | 0.03 |
| Adiponectin (μg/mL) | 9.43±1.65 | 23.42±2.65 | 0.006 | 24.13±2.82 | 31.71±7.97 | 0.42 |
| Leptin (ng/mL) | 3.20±1.02 | 4.14±1.09 | 0.55 | 4.80±1.82 | 7.46±2.89 | 0.47 |
| Triglycerides (mg/dL) | 75.14±9.23 | 51.82±8.63 | 0.11 | 50.28±10.31 | 21.79±6.23 | 0.06 |
| Cholesterol (mg/dL) | 83.20±10.18 | 81.45±2.32 | 0.88 | 79.82±9.44 | 70.56±13.58 | 0.60 |
| Liver | ||||||
| Triglycerides (mg/g) | 11.62±2.23 | 6.67±0.75 | 0.11 | 22.42±3.75 | 10.33±0.68 | 0.04 |
| Cholesterol (mg/g) | 4.29±0.50 | 4.07±0.20 | 0.71 | 4.52±0.22 | 4.54±0.13 | 0.94 |
-
Measurements were made using 26–27-month-old mice (n=4–5 mice/group).
-
*
4 hr fasting data.
Download links
A two-part list of links to download the article, or parts of the article, in various formats.
Downloads (link to download the article as PDF)
Open citations (links to open the citations from this article in various online reference manager services)
Cite this article (links to download the citations from this article in formats compatible with various reference manager tools)
The starvation hormone, fibroblast growth factor-21, extends lifespan in mice
eLife 1:e00065.
https://doi.org/10.7554/eLife.00065


