Complete dissection of transcription elongation reveals slow translocation of RNA polymerase II in a linear ratchet mechanism
- University of California, Berkeley, United States
- Howard Hughes Medical Institute, University of California, Berkeley, United States
- Center for Cancer Research–National Cancer Institute, United States
- Lawrence Berkeley National Laboratory, United States
Figures
Figure 1 with 1 supplement

Nucleotide addition cycle and off-pathway pausing of transcription elongation.
The nucleotide addition phase and the pausing phase are colored in green and blue, respectively. At the beginning of a nucleotide addition cycle, the transcription elongation complex (TEC) with a transcript length of n thermally fluctuates between the pre-translocated state (TECn,0) and the post-translocated state (TECn,1) with a forward rate constant k1 and a reverse rate constant k−1. After translocation, the incoming NTP binds to the active site with a binding rate constant k2 and a dissociation rate constant k−2. NTP binding is followed by NTP sequestration, bond formation, and PPi release, which are collectively described by a single catalysis rate constant k3 in our study. Upon the release of the PPi, TEC is reset to the pre-translocated state (TECn+1,0) and ready for the next nucleotide addition cycle. From the pre-translocated state, the polymerase can also enter the off-pathway pausing phase by backtracking. The pausing kinetics are determined by the backward stepping rate constants kbn and forward stepping rate constants kfn. The inset shows cartoon configurations of the TEC in a pre-translocated and a post-translocated state.
Figure 1—figure supplement 1
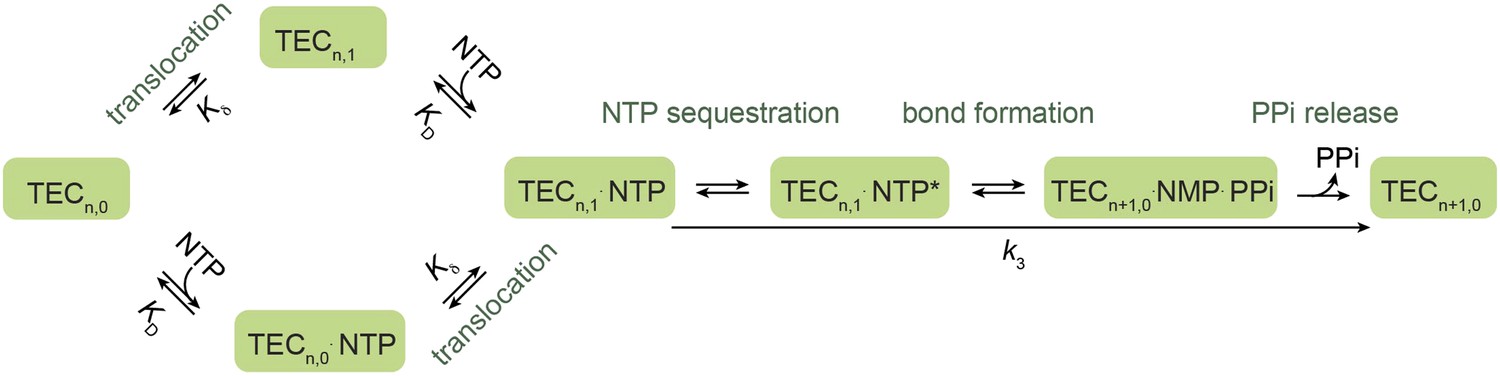
A branched Brownian ratchet model for the nucleotide addition cycle.
This kinetic model, proposed by Larson et al. (Larson et al., 2012), allows NTP to bind to the TEC both before and after translocation, postulating a secondary nucleotide binding site for NTP binding to the pre-translocated TEC (TECn,0). Additionally, the model assumes rapid forward and reverse translocation of the polymerase and hence describes the translocation step simply with an equilibrium constant Kδ.
Figure 2 with 5 supplements
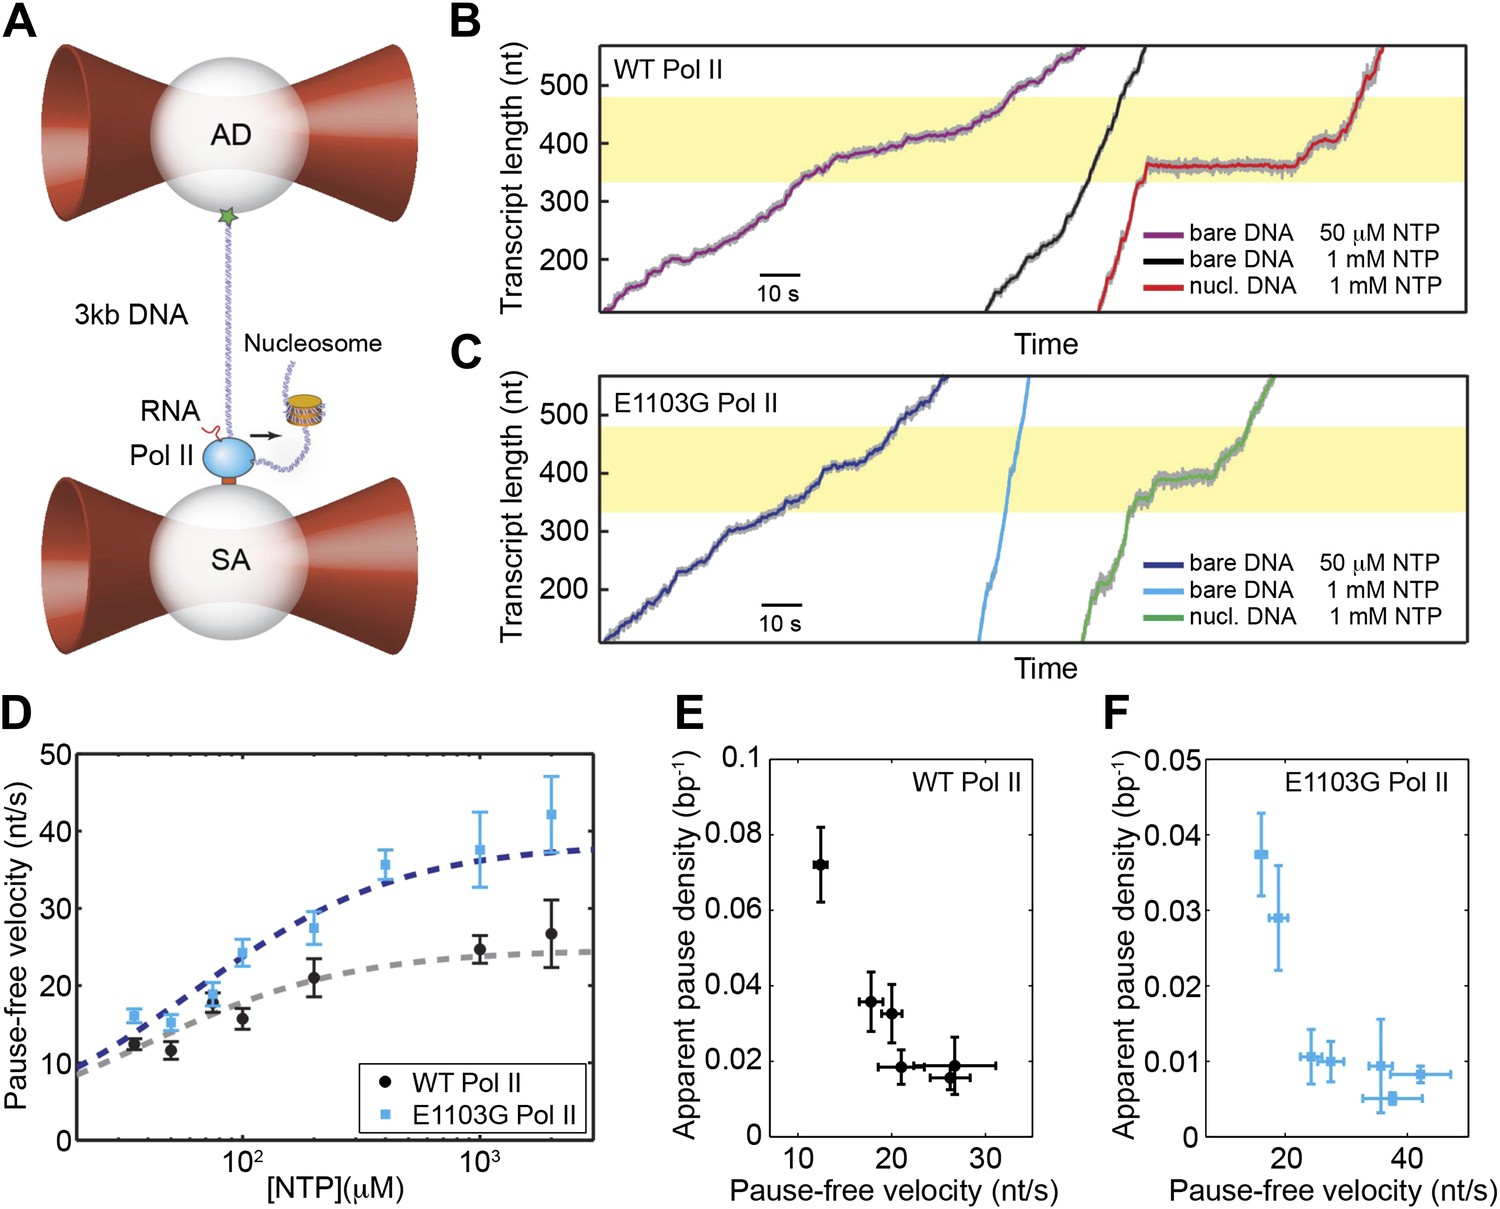
Single-molecule transcription assay.
(A) Experimental setup for the single-molecule transcription assay. Each of the two optical traps holds a 2.1-μm polystyrene bead. Biotinylated Pol II is attached to the streptavidin (SA) bead. The upstream DNA is attached to the antibody (AD) bead via the digoxigenin–antidigoxigenin linkage. The black arrow indicates the direction of transcription. A nucleosome can be loaded on the downstream DNA as shown. (B) Example transcription trajectories of the wild-type Pol II at 50 μM NTP on bare DNA, 1 mM NTP on bare DNA, and 1 mM NTP in the presence of a nucleosome. The nucleosome positioning sequence (NPS) is represented by the yellow shaded region. (C) Example transcription trajectories of the E1103G mutant Pol II under various conditions. (D) Pause-free velocities of the wild-type (black) and mutant Pol II (blue) at various NTP concentrations. Dashed lines are fits to the Michaelis–Menten equation (Equation 3; R2 = 0.80 for the wild-type; R2 = 0.85 for mutant). (E) The apparent pause densities (ρpause) of the wild-type Pol II at different NTP concentrations are plotted against the corresponding pause-free velocities (v). (F) ρpause–v relationship for the mutant enzyme. Error bars represent standard error of the mean (SEM).
Figure 2—figure supplement 1
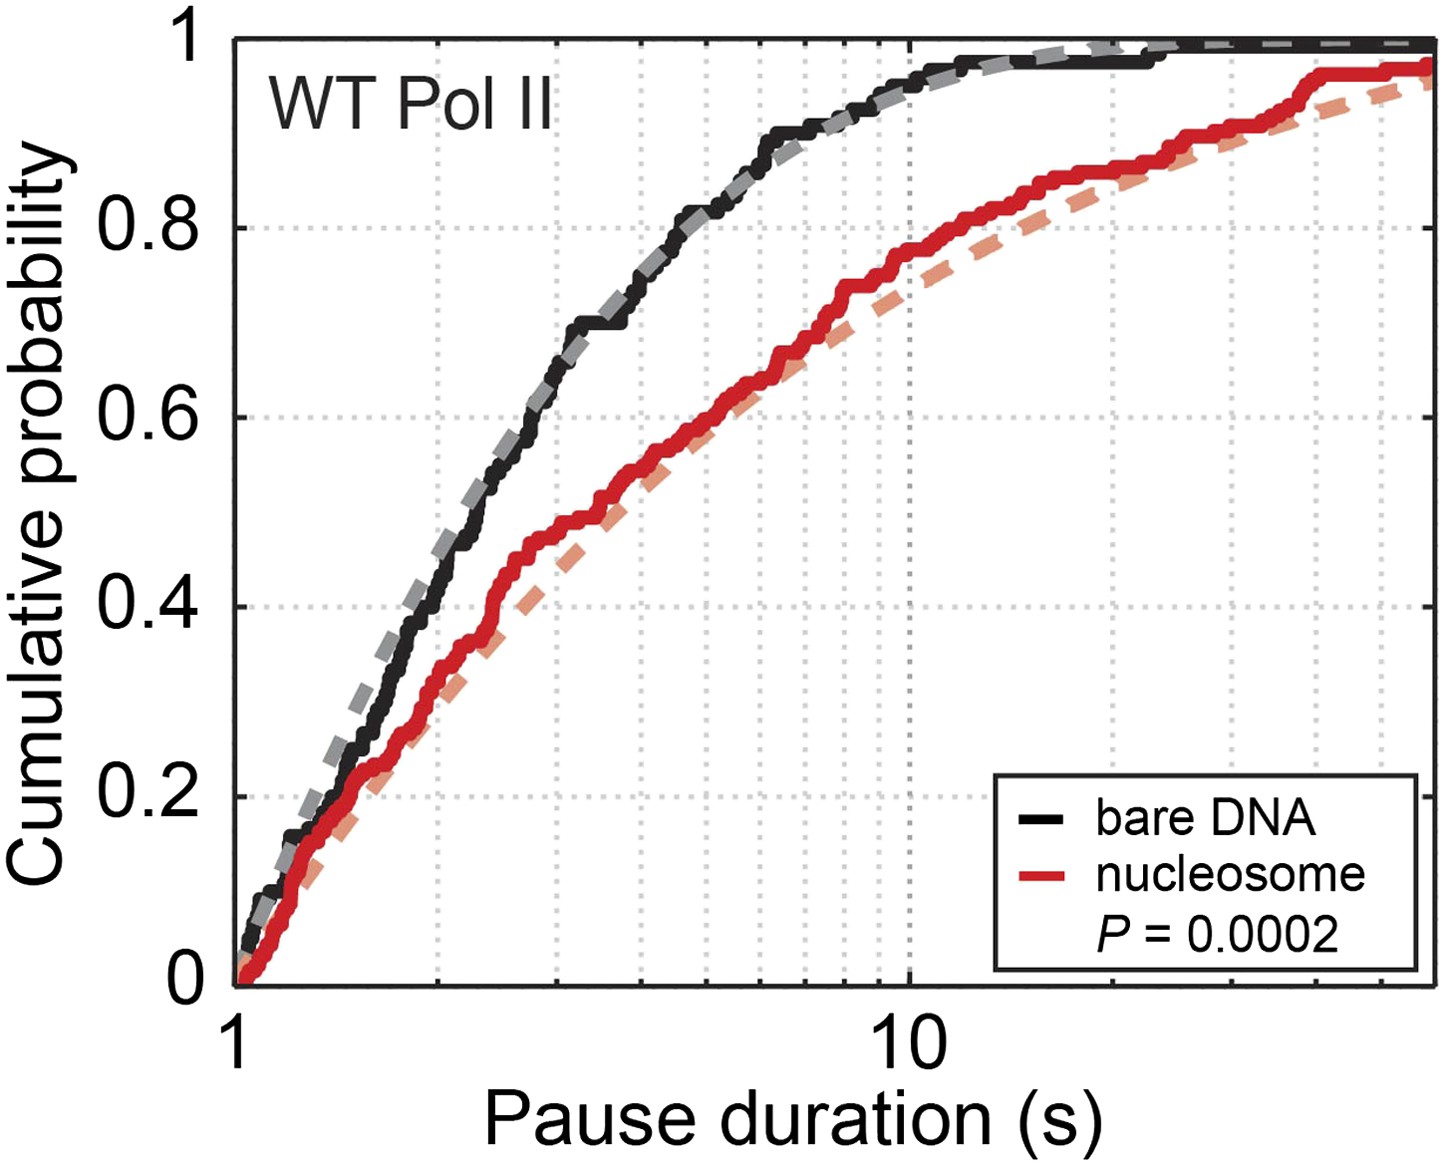
Cumulative distribution of the pause durations for the wild-type Pol II on bare DNA (black solid line) and nucleosomal DNA (red solid line).
Dashed lines are theoretical fits of the experimental data to the one-dimensional diffusion model for backtracking (Equation 8).
Figure 2—figure supplement 2

A gel-based time-coursed transcription assay of the wild-type Pol II on bare and nucleosomal DNA.
The transcription reactions were carried out in 40 mM KCl and quenched with EDTA after 1, 2, 5, and 20 min incubation with 1 mM NTPs.
Figure 2—figure supplement 3
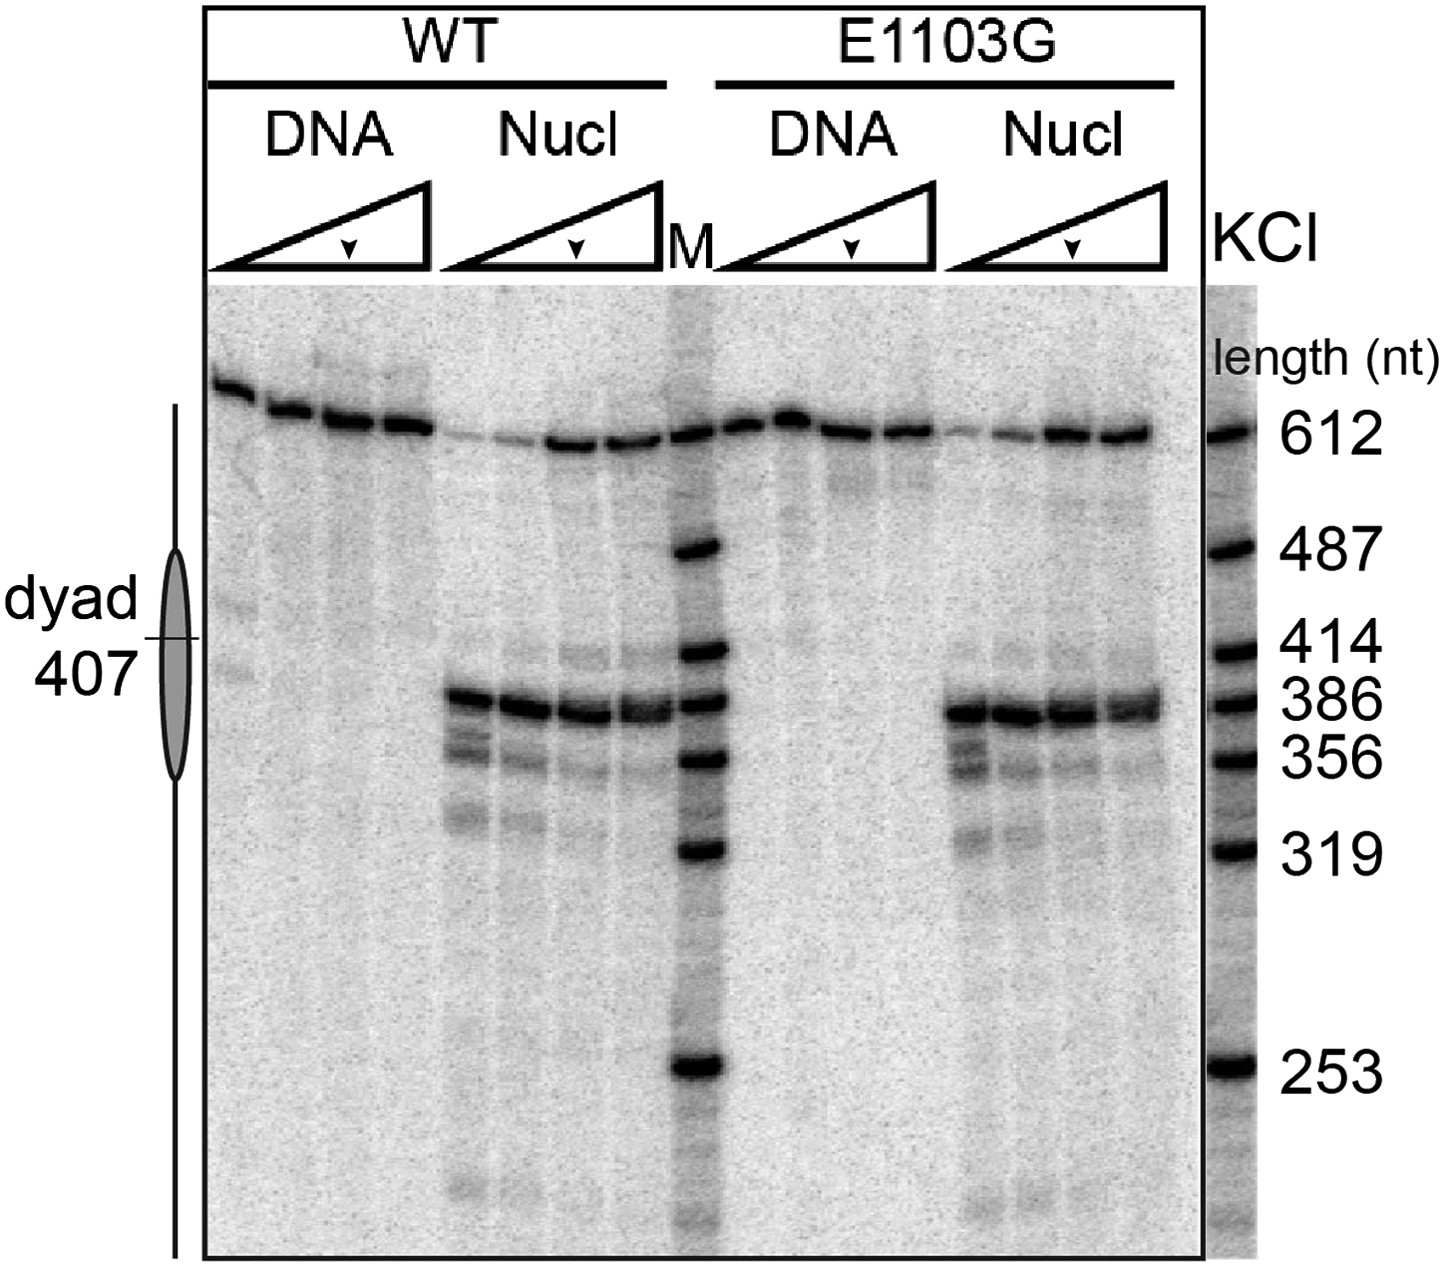
A gel-based transcription assay of the wild-type Pol II and the E1103G mutant Pol II in various KCl concentrations.
The experiment was carried out in 40, 150, 300, 450 mM of KCl. The transcription reactions were quenched with EDTA after 10 min incubation with 1 mM NTPs. The run-off length is 612 nt. The nucleosomal dyad is located at nucleotide position 407. The arrows indicate the salt condition used in the single-molecule experiments (300 mM KCl).
Figure 2—figure supplement 4
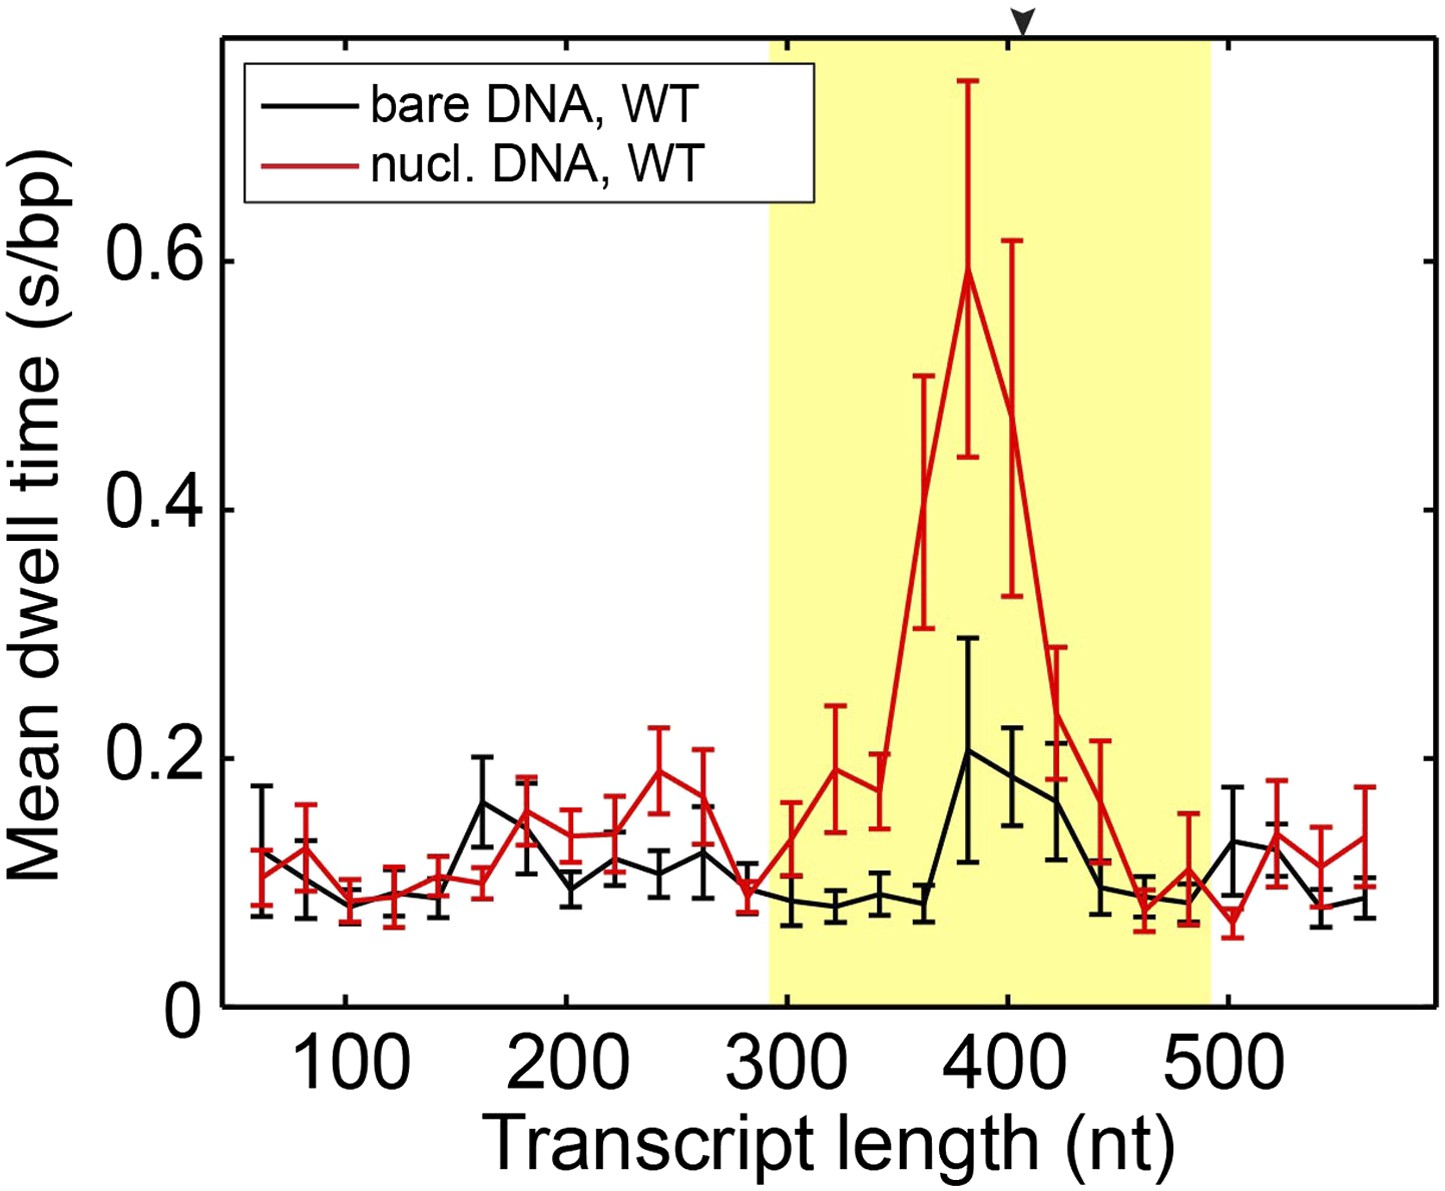
Mean dwell times of the wild-type Pol II at different nucleotide positions.
The experiments were conducted at 1 mM NTP concentration. The yellow shade indicates the extended NPS region (−115 bp to +85 bp relative to the dyad). The arrow on the top axis marks the position of the dyad. The same DNA sequence was used in the bulk and single-molecule assays. Both assays show the most predominant pausing about 20 bp before the dyad, consistent with previous results (Bondarenko et al., 2006).
Figure 2—figure supplement 5
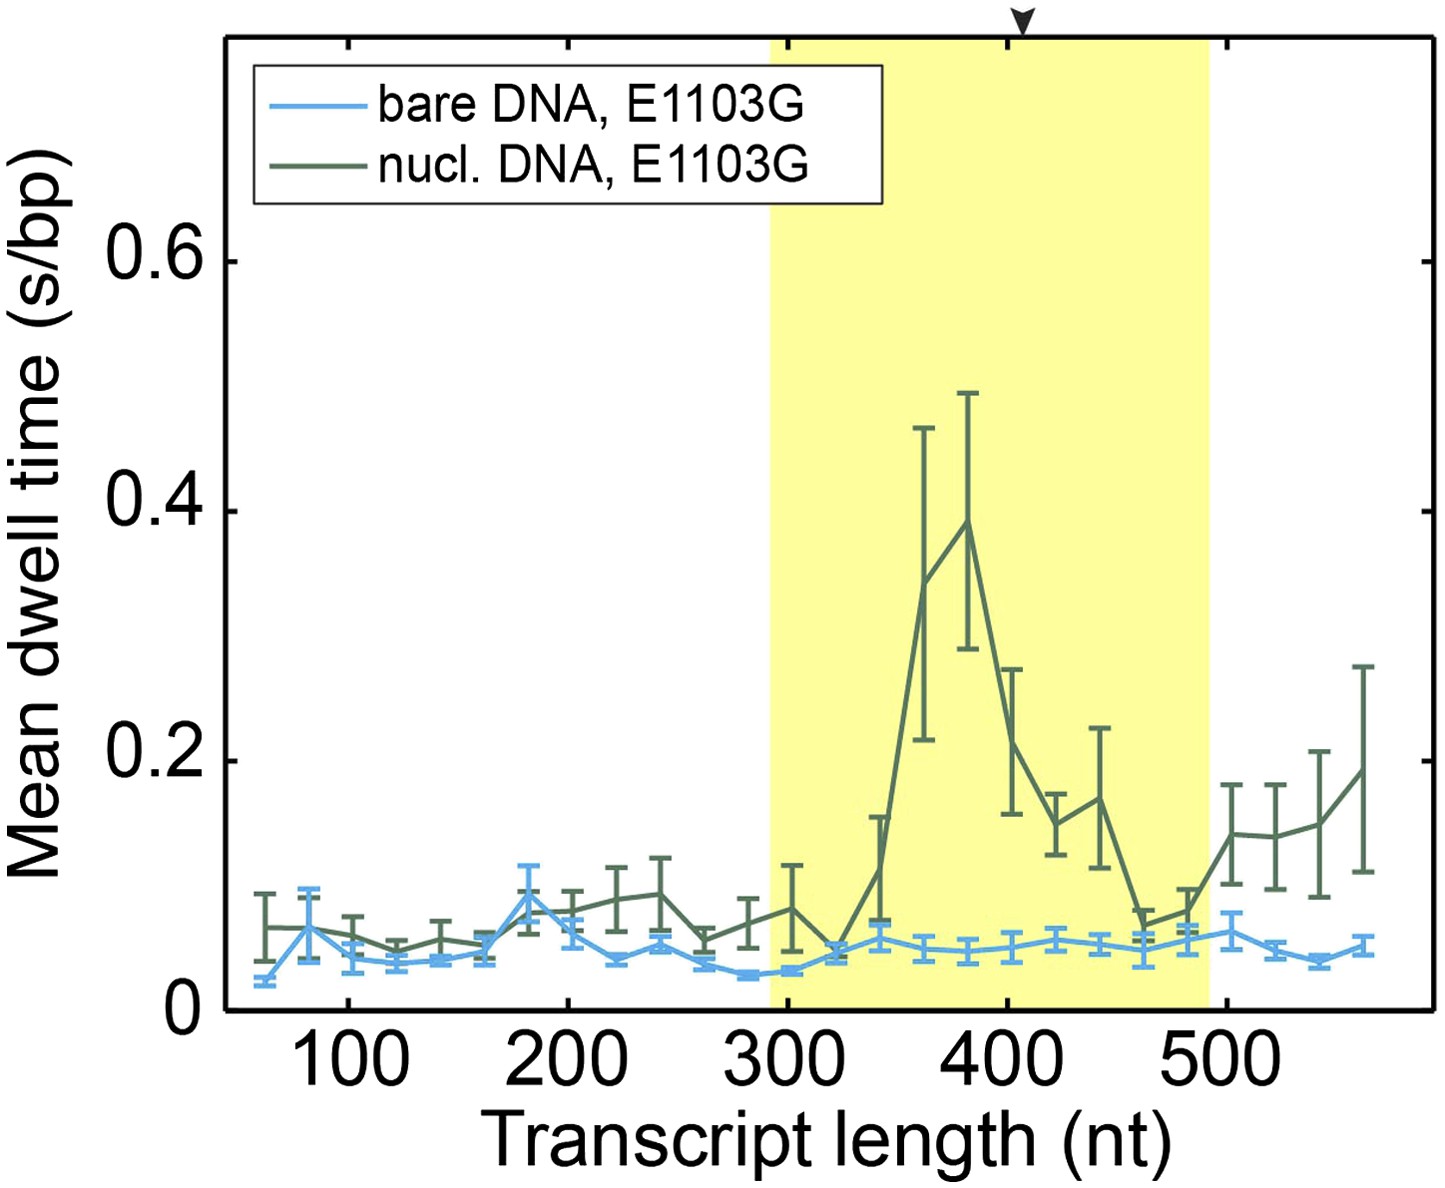
Mean dwell times of the mutant Pol II at different nucleotide positions.
https://doi.org/10.7554/eLife.00971.010
Figure 3
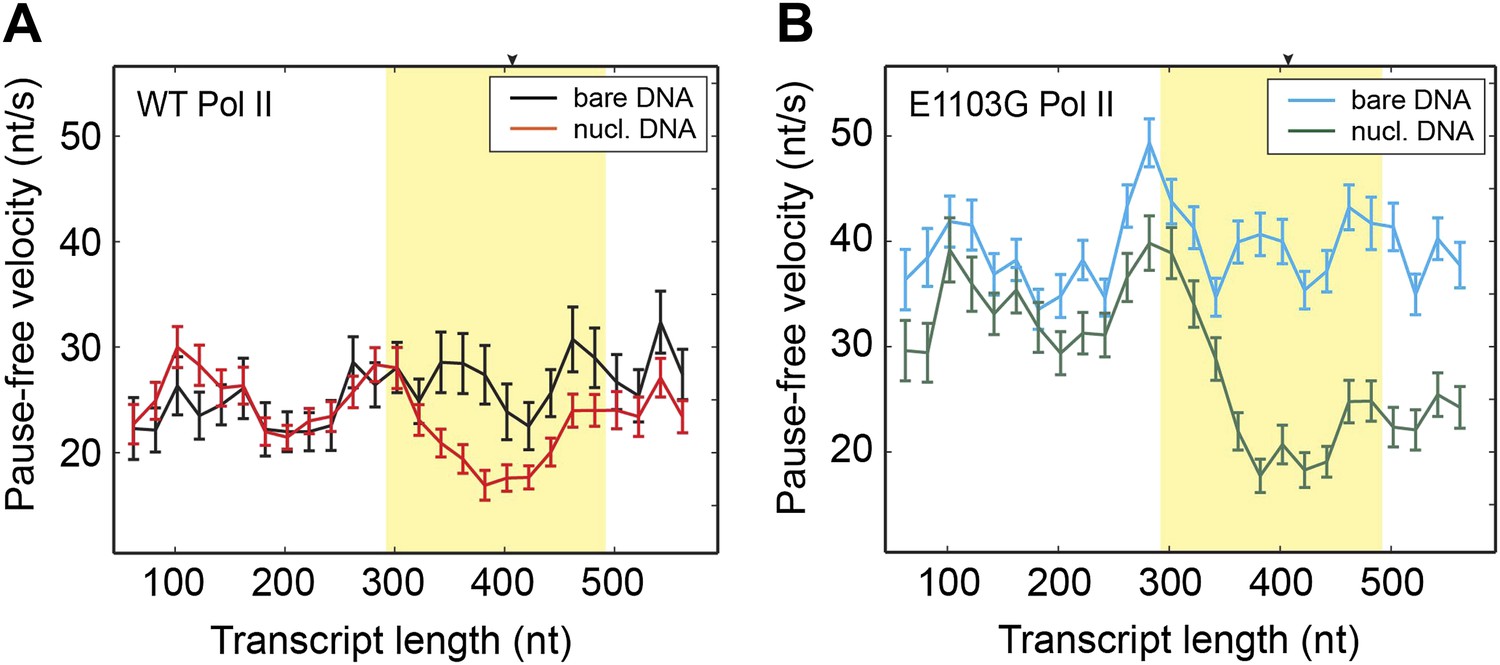
Comparison of pause-free velocities on bare DNA and nucleosomal DNA.
(A) Pause-free velocities of the wild-type Pol II on bare DNA (black) and nucleosomal DNA (red) are plotted as a function of the transcript length. The nucleosomal dyad position corresponds to a transcript length of 407 nt. The extended NPS region (−115 nt to +85 nt relative to the nucleosomal dyad) is highlighted in yellow. The arrow on the top axis marks the position of the dyad. (B) Pause-free velocities of the E1103G mutant Pol II on bare DNA (blue) and nucleosomal DNA (green) are plotted as a function of the transcript length. These experiments were conducted at 1 mM NTP. Note that after the polymerase exits the nucleosome, the velocity does not return to the same level of that on bare DNA. This observation could be rationalized if the nucleosome rolls along the DNA and remains ahead of the transcribing polymerase in a fraction of the traces. Error bars are SEM.
Figure 4 with 2 supplements
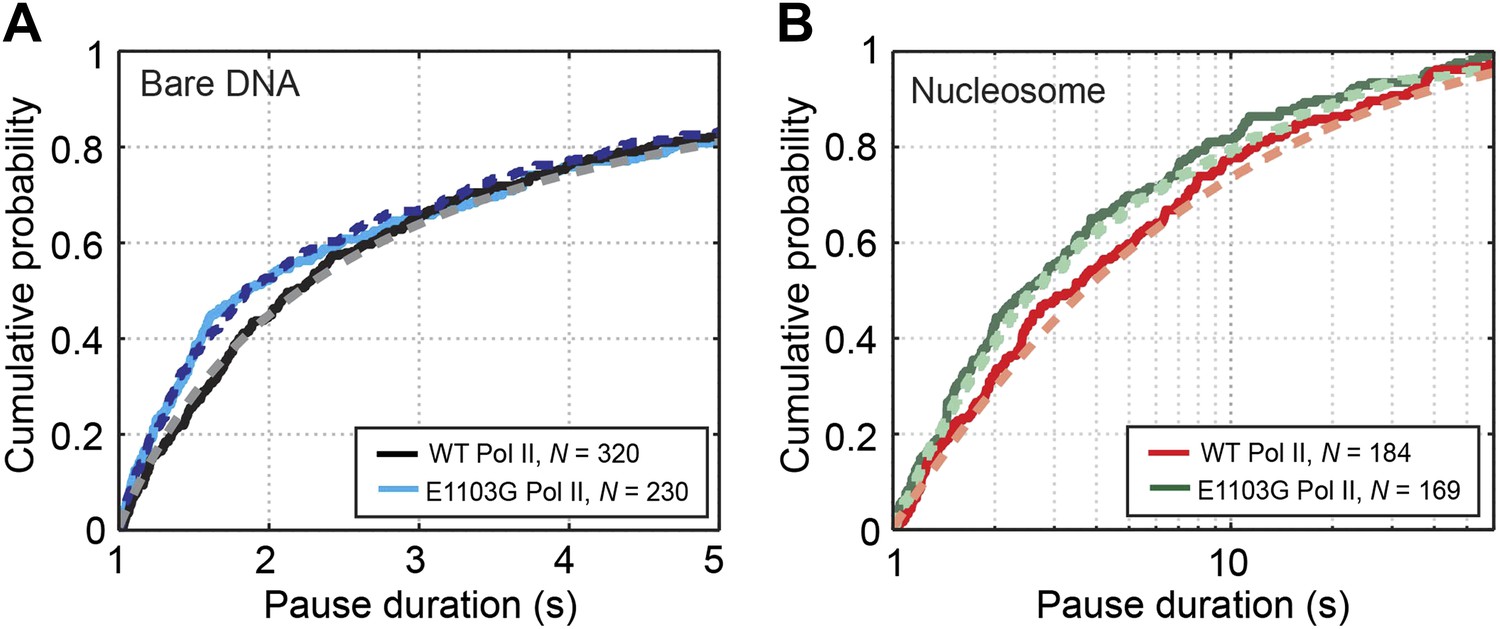
Pause durations on bare DNA and nucleosomal DNA.
(A) Cumulative distributions of the pause durations on bare DNA for the wild-type Pol II (black solid line) and the mutant enzyme (blue solid line). The wild-type curve is fit to the one-dimensional random walk model for backtracked pausing (gray dashed line). The blue dashed line represents the simulated pause duration distribution for the mutant enzyme, using a kf1 value of 4 s−1. (B) Cumulative distributions of the pause durations in the nucleosome region for the wild-type enzyme (red solid line) and the mutant enzyme (green solid line). The wild-type curve is fit to the one-dimensional diffusion model for backtracked pausing, using a γu value of 0.6 (red dashed line). The green dashed line is the simulated pause duration distribution for nucleosomal DNA transcription by the mutant enzyme, using a kf1 value of 4 s−1.
Figure 4—figure supplement 1
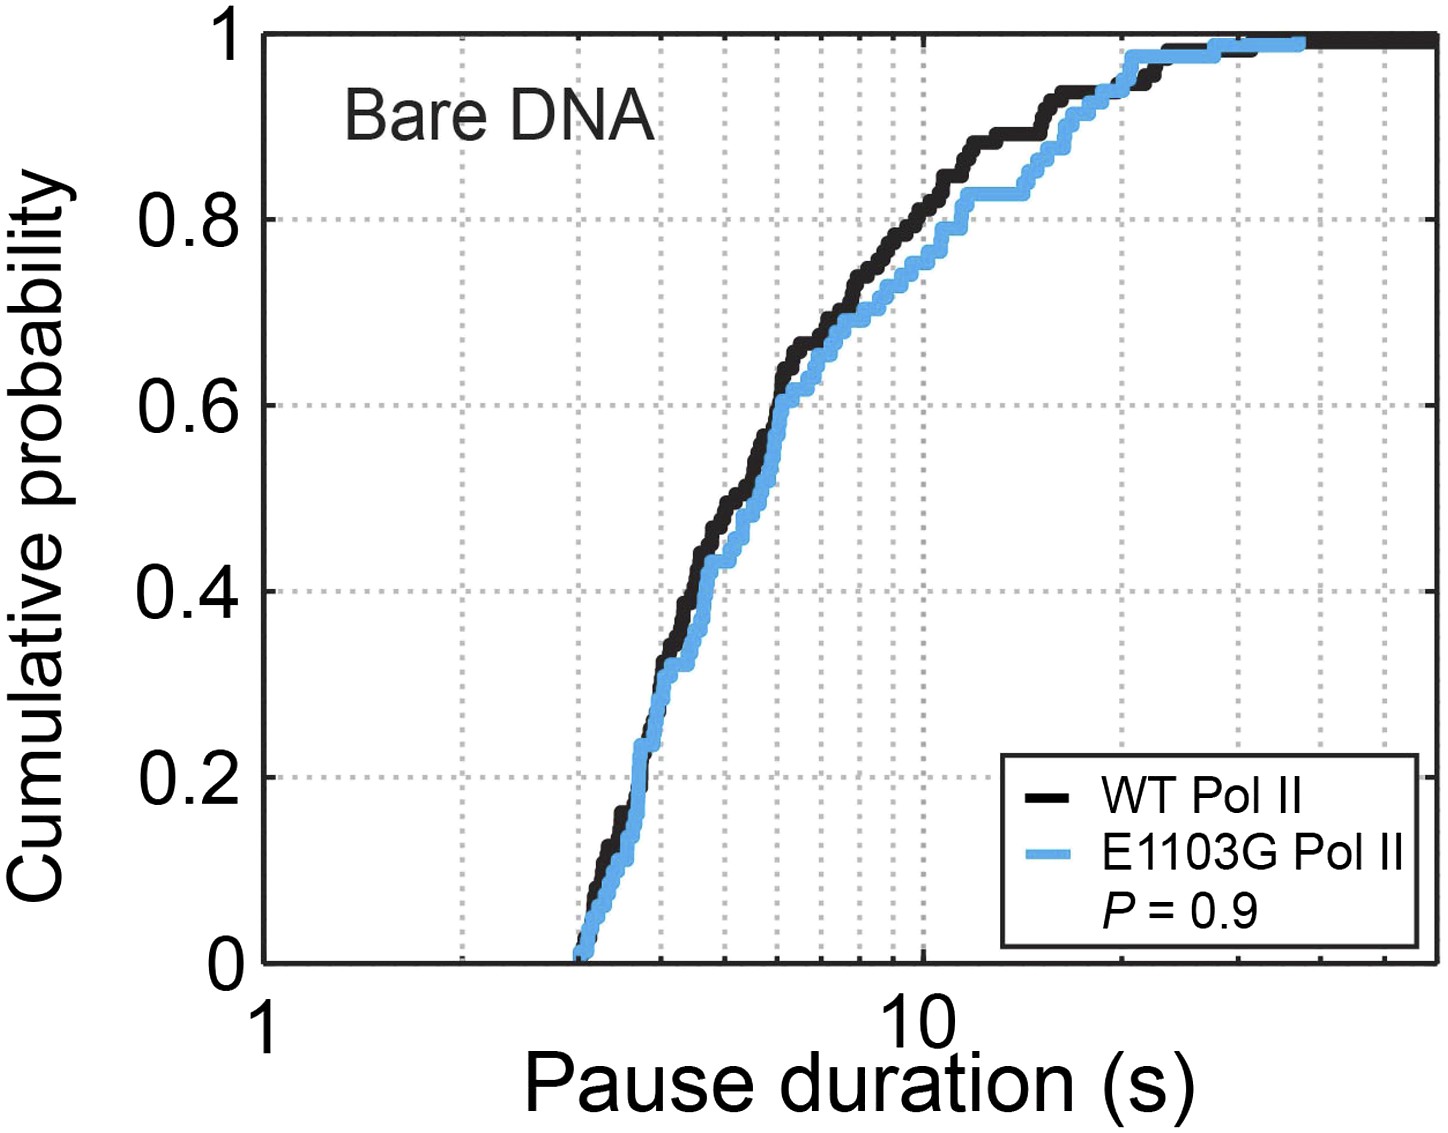
Cumulative pause duration distributions of pauses longer than 3 s.
The curves for the wild-type and the E1103G mutant Pol II are statistically indistinguishable (P = 0.9, Kolmogorov-Smirnov test).
Figure 4—figure supplement 2
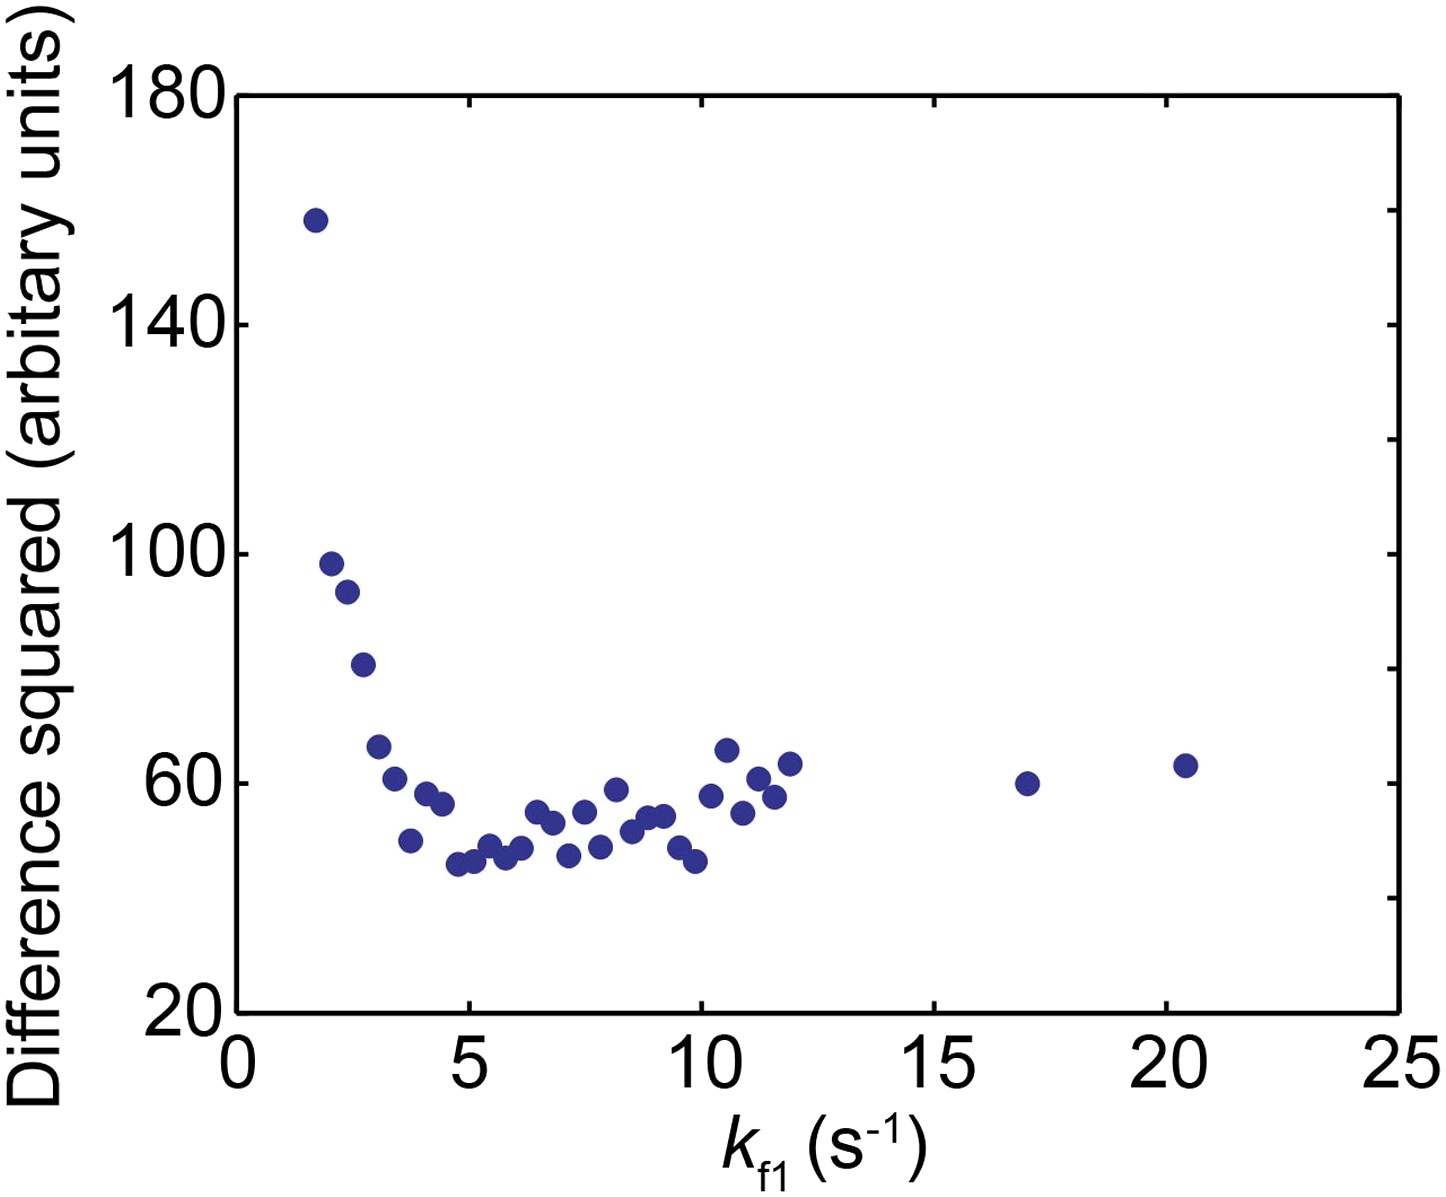
Comparison between the experimentally obtained distribution of pause durations and the simulated distribution for the nucleosomal DNA transcription by the mutant Pol II.
The square of the difference between the experimental and simulated data is plotted as a function of kf1 used in the simulation.
Figure 5 with 1 supplement

Relationship between pause density and NTP concentration.
(A) The total pause density for the wild-type Pol II (black circles) is plotted against the NTP concentration. The gray dashed line is the fit to Equation 13 (R2 = 0.93). (B) ρpause–[NTP] relationship (blue squares) for the mutant Pol II is fit to Equation 13 (blue dashed line, R2 = 0.89).
Figure 5—figure supplement 1
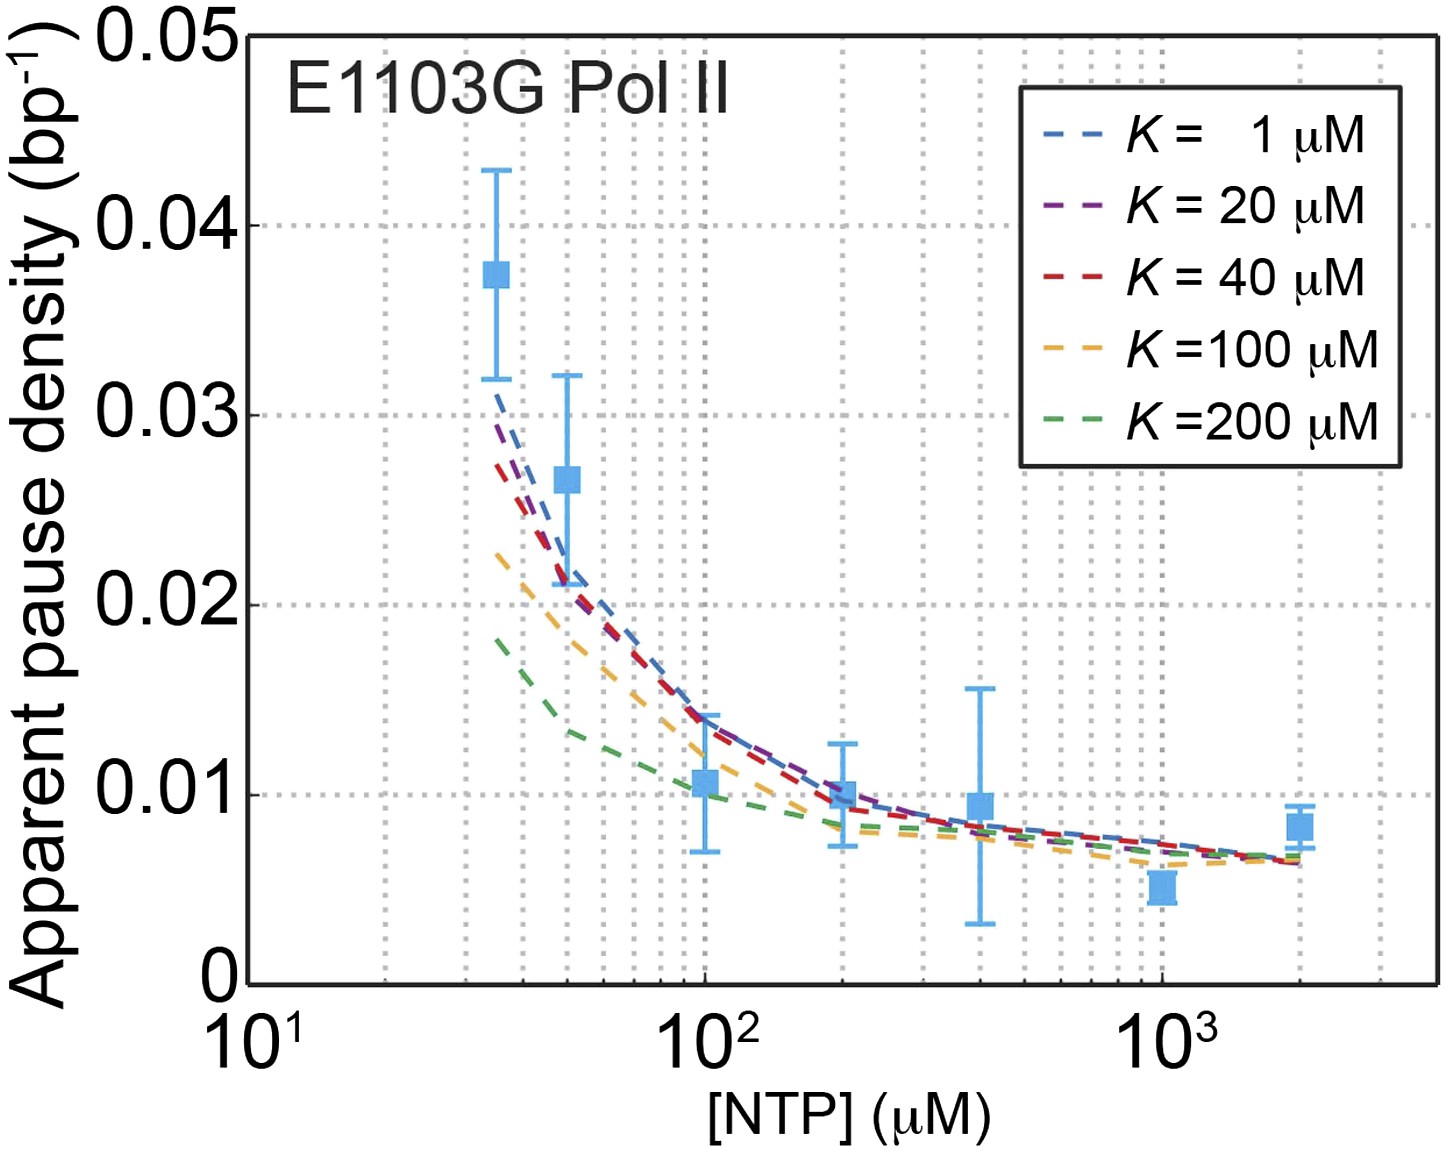
Constraining the value of K for the mutant Pol II.
The apparent pause densities obtained experimentally for the E1103G Pol II are plotted against the NTP concentration (blue squares). Simulated pause densities using a K value of 1, 20, 40, 100, and 200 μM are shown in blue, purple, red, orange, and green dashed lines, respectively. The simulated curve starts to deviate from the experimental data once K exceeds 100 μM.
Figure 6
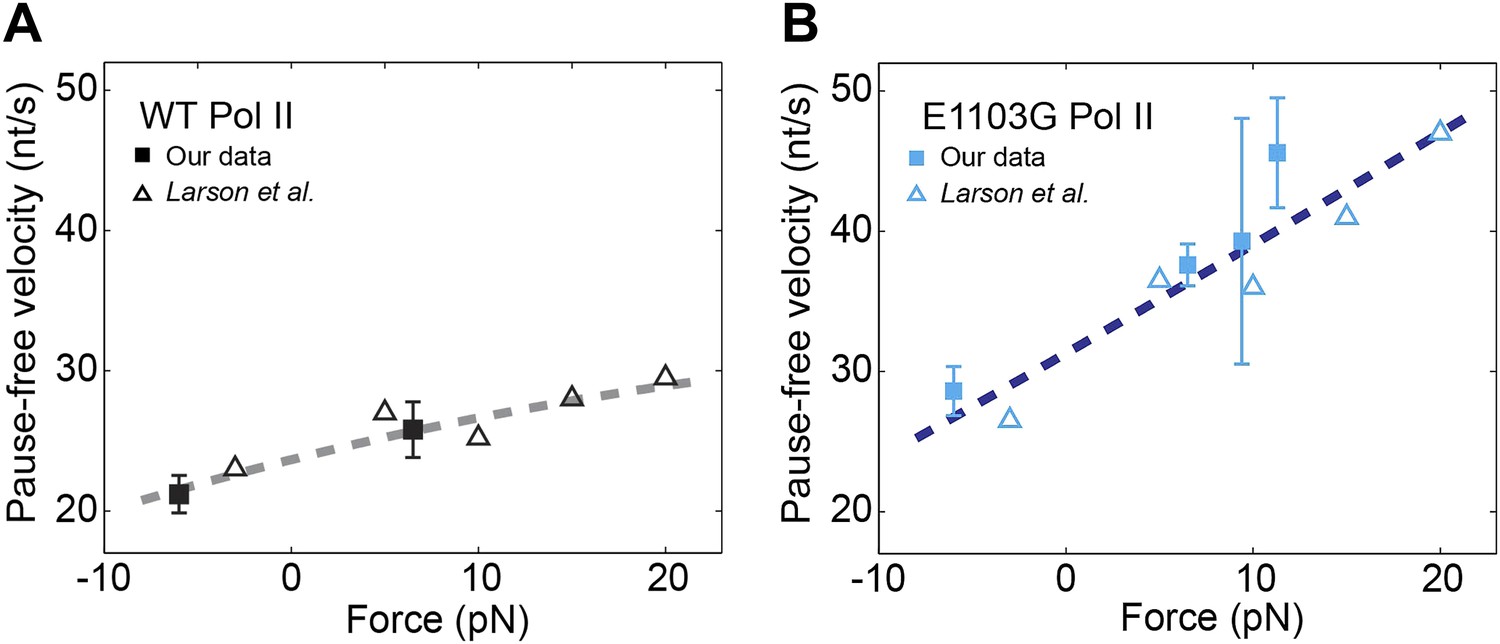
Relationship between transcription velocity and applied force.
(A) The pause-free velocity of the wild-type Pol II is plotted against the applied force. Experimental data in the present study are shown in solid squares (error bars indicate SEM). Open triangles represent data from a previously published single-molecule study (Larson et al., 2012). The combined data are fit to the force-velocity relationship predicted by a linear Brownian ratchet model (dashed line), yielding a characteristic distance to the transition state δ = 0.46 ± 0.09 bp (error is SEM, R2 = 0.88). Positive and negative force values indicate assisting and opposing forces, respectively. (B) The force-velocity relationship for the mutant Pol II. δ = 0.24 ± 0.05 bp for the mutant (R2 = 0.85).
Figure 7 with 1 supplement
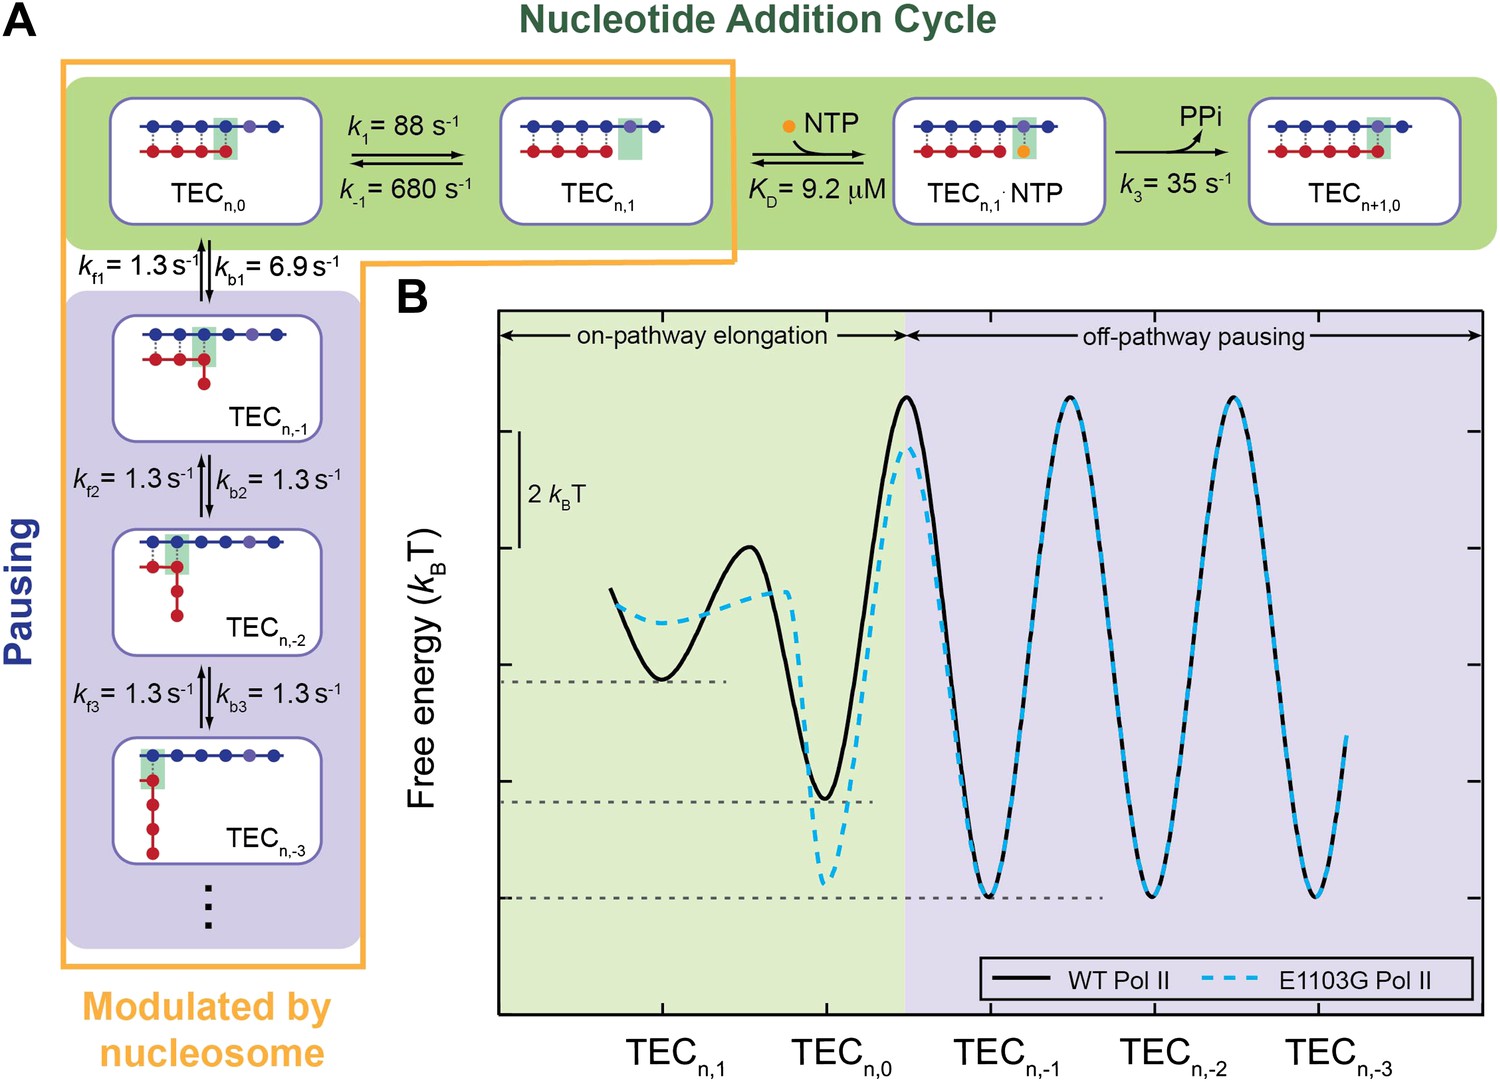
A quantitative kinetic model for transcription elongation.
(A) A comprehensive kinetic characterization of the nucleotide addition phase (highlighted in green) and the pausing phase (highlighted in blue) for transcription by the wild-type Pol II. Inside the yellow box are the transitions affected by the nucleosomal barrier. (B) The schematic translocation free energy landscape at a given RNA length for the wild-type Pol II (solid black) and the E1103G Pol II (dashed cyan). The on-pathway elongation is highlighted in green and the off-pathway pausing is highlighted in blue.
Figure 7—figure supplement 1
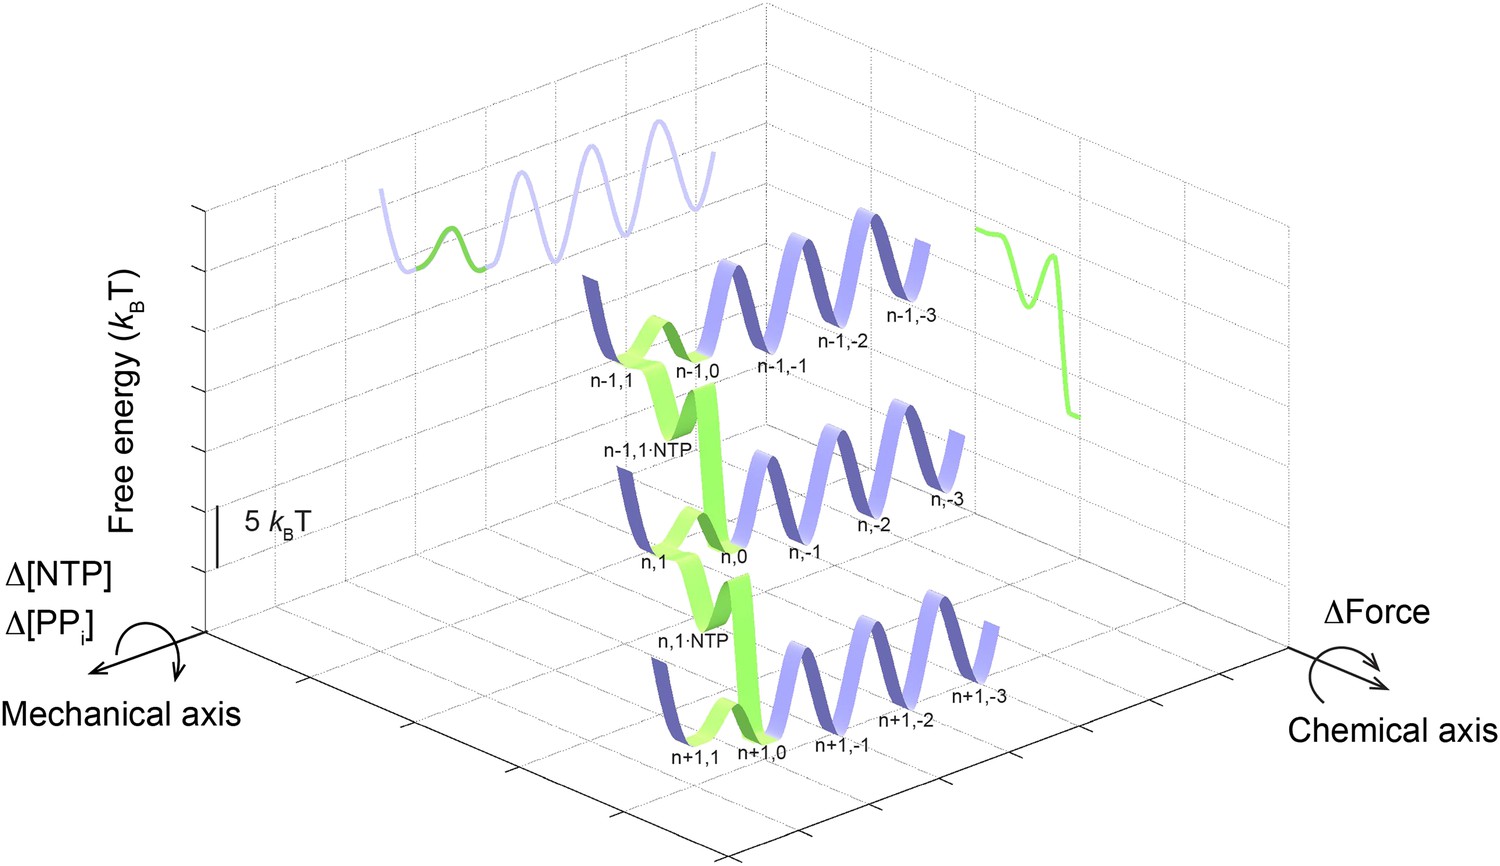
The schematic three-dimensional free energy landscape for transcription elongation by the wild-type Pol II at 1 mM NTP and zero force.
The ribbons represent the minimal energy paths of the nucleotide addition cycle (green) and the off-pathway processes (blue). The nomenclature for the TECs (e.g., n,1) is the same as that used in Figure 7. Chemical and mechanical transitions are shown in two orthogonal axes. Mechanical perturbations, such as force, affect the mechanical transitions of the enzyme by tilting the landscape around the chemical axis to a first approximation, while chemical perturbations, such as [NTP] and [PPi], rotate the landscape around the mechanical axis, again to a first approximation. Two-dimensional projections on the grids highlight the relative free energy of each state.
Tables
Table 1
Summary of pause-free velocities and apparent pause densities measured at various NTP concentrations
| Pol II | [NTP] (μM) | N | Pause-free velocity (nt/s) | Apparent pause density (bp−1) |
|---|---|---|---|---|
| wild-type | 35 | 10 | 12.4 ± 0.7 | 0.0721 ± 0.0099 |
| 50 | 11 | 11.6 ± 1.1 | 0.0526 ± 0.0086 | |
| 75 | 9 | 17.8 ± 1.2 | 0.0358 ± 0.0079 | |
| 100 | 13 | 15.7 ± 1.4 | 0.0326 ± 0.0077 | |
| 200 | 17 | 21.0 ± 2.4 | 0.0184 ± 0.0046 | |
| 1000 | 44 | 24.7 ± 1.8 | 0.0156 ± 0.0031 | |
| 2000 | 9 | 26.7 ± 4.3 | 0.0188 ± 0.0076 | |
| E1103G | 35 | 10 | 16.1 ± 0.9 | 0.0374 ± 0.0055 |
| 50 | 13 | 15.2 ± 1.0 | 0.0266 ± 0.0055 | |
| 75 | 13 | 18.9 ± 1.5 | 0.0290 ± 0.0069 | |
| 100 | 13 | 24.2 ± 1.7 | 0.0106 ± 0.0036 | |
| 200 | 13 | 27.4 ± 3.9 | 0.0100 ± 0.0027 | |
| 400 | 10 | 35.6 ± 1.9 | 0.0094 ± 0.0062 | |
| 1000 | 96 | 37.6 ± 4.9 | 0.0051 ± 0.0008 | |
| 2000 | 15 | 42.1 ± 4.9 | 0.0083 ± 0.0011 |
-
Data are shown as mean ± SEM. The apparent pause densities are determined by counting pauses that last between 1 s and 120 s. N is the number of single-molecule transcription trajectories at each condition.
Table 2
Apparent pause densities and mean pause durations on bare DNA and nucleosomal DNA in the extended NPS region
| Pol II | DNA template | N | Apparent pause density (bp−1) | Mean pause duration (s) |
|---|---|---|---|---|
| wild-type | Bare | 38 | 0.0153 ± 0.0041 | 3.9 ± 0.6 |
| Nucleosomal | 94 | 0.0280 ± 0.0036 | 9.4 ± 0.8 | |
| E1103G | Bare | 85 | 0.0046 ± 0.0015 | 3.9 ± 0.5 |
| Nucleosomal | 64 | 0.0202 ± 0.0050 | 7.6 ± 1.0 |
-
Data are shown as mean ± SEM. The extended NPS region spans −115 nt to+85 nt relative to the nucleosomal dyad.
Table 3
Summary of kinetic parameters measured in this study
| Parameters | Wild-type Pol II | E1103G Pol II |
|---|---|---|
| k1 (s−1) | 88 ± 23 | 44 ± 4 |
| k−1 (s−1) | ∼680 | ∼4.1 × 10³ |
| Kδ = k−1/k1 | ∼7.7 | ∼92 |
| K = (k−2+k3)/k2 (μM) | ∼9.2 | ∼9.2 |
| k3 (s−1) | 35 ± 3 | 195 ± 65 |
| kb1 (s−1) | 6.9 ± 2.6 | ∼3.7* |
| kf1 (s−1) | 1.3 ± 0.3 | ∼3.1* |
| kbn (s−1), n ≥ 2 | 1.3 ± 0.3 | 1.3 ± 0.3 |
| kfn (s−1), n ≥ 2 | 1.3 ± 0.3 | 1.3 ± 0.3 |
-
The values reported in the text were measured at 6.5 pN of applied assisting force and are normalized to zero force here. The italicized numbers indicate the parameters that are altered by the E1103G mutation. The asterisks indicate lower bounds of the corresponding values.
Download links
A two-part list of links to download the article, or parts of the article, in various formats.
Downloads (link to download the article as PDF)
Open citations (links to open the citations from this article in various online reference manager services)
Cite this article (links to download the citations from this article in formats compatible with various reference manager tools)
Complete dissection of transcription elongation reveals slow translocation of RNA polymerase II in a linear ratchet mechanism
eLife 2:e00971.
https://doi.org/10.7554/eLife.00971


