Acetylation of histone H3 at lysine 64 regulates nucleosome dynamics and facilitates transcription
- Institut de Génétique et de Biologie Moléculaire et Cellulaire (IGBMC), CNRS UMR, France
- Max Planck Institute of Immunobiology and Epigenetics, Germany
- Institute of Molecular Biotechnology, Austria
- College of Life Sciences, University of Dundee, United Kingdom
- Université Joseph Fourier, France
- Institut Albert Bonniot, France
- CNRS UMR5535/Université de Montpellier I and II, France
- Ulm University, Germany
- Friedrich Miescher Institute for Biomedical Research (FMI), Switzerland
- Gurdon Institute, United Kingdom
- University of Cambridge, United Kingdom
Figures
Figure 1 with 3 supplements
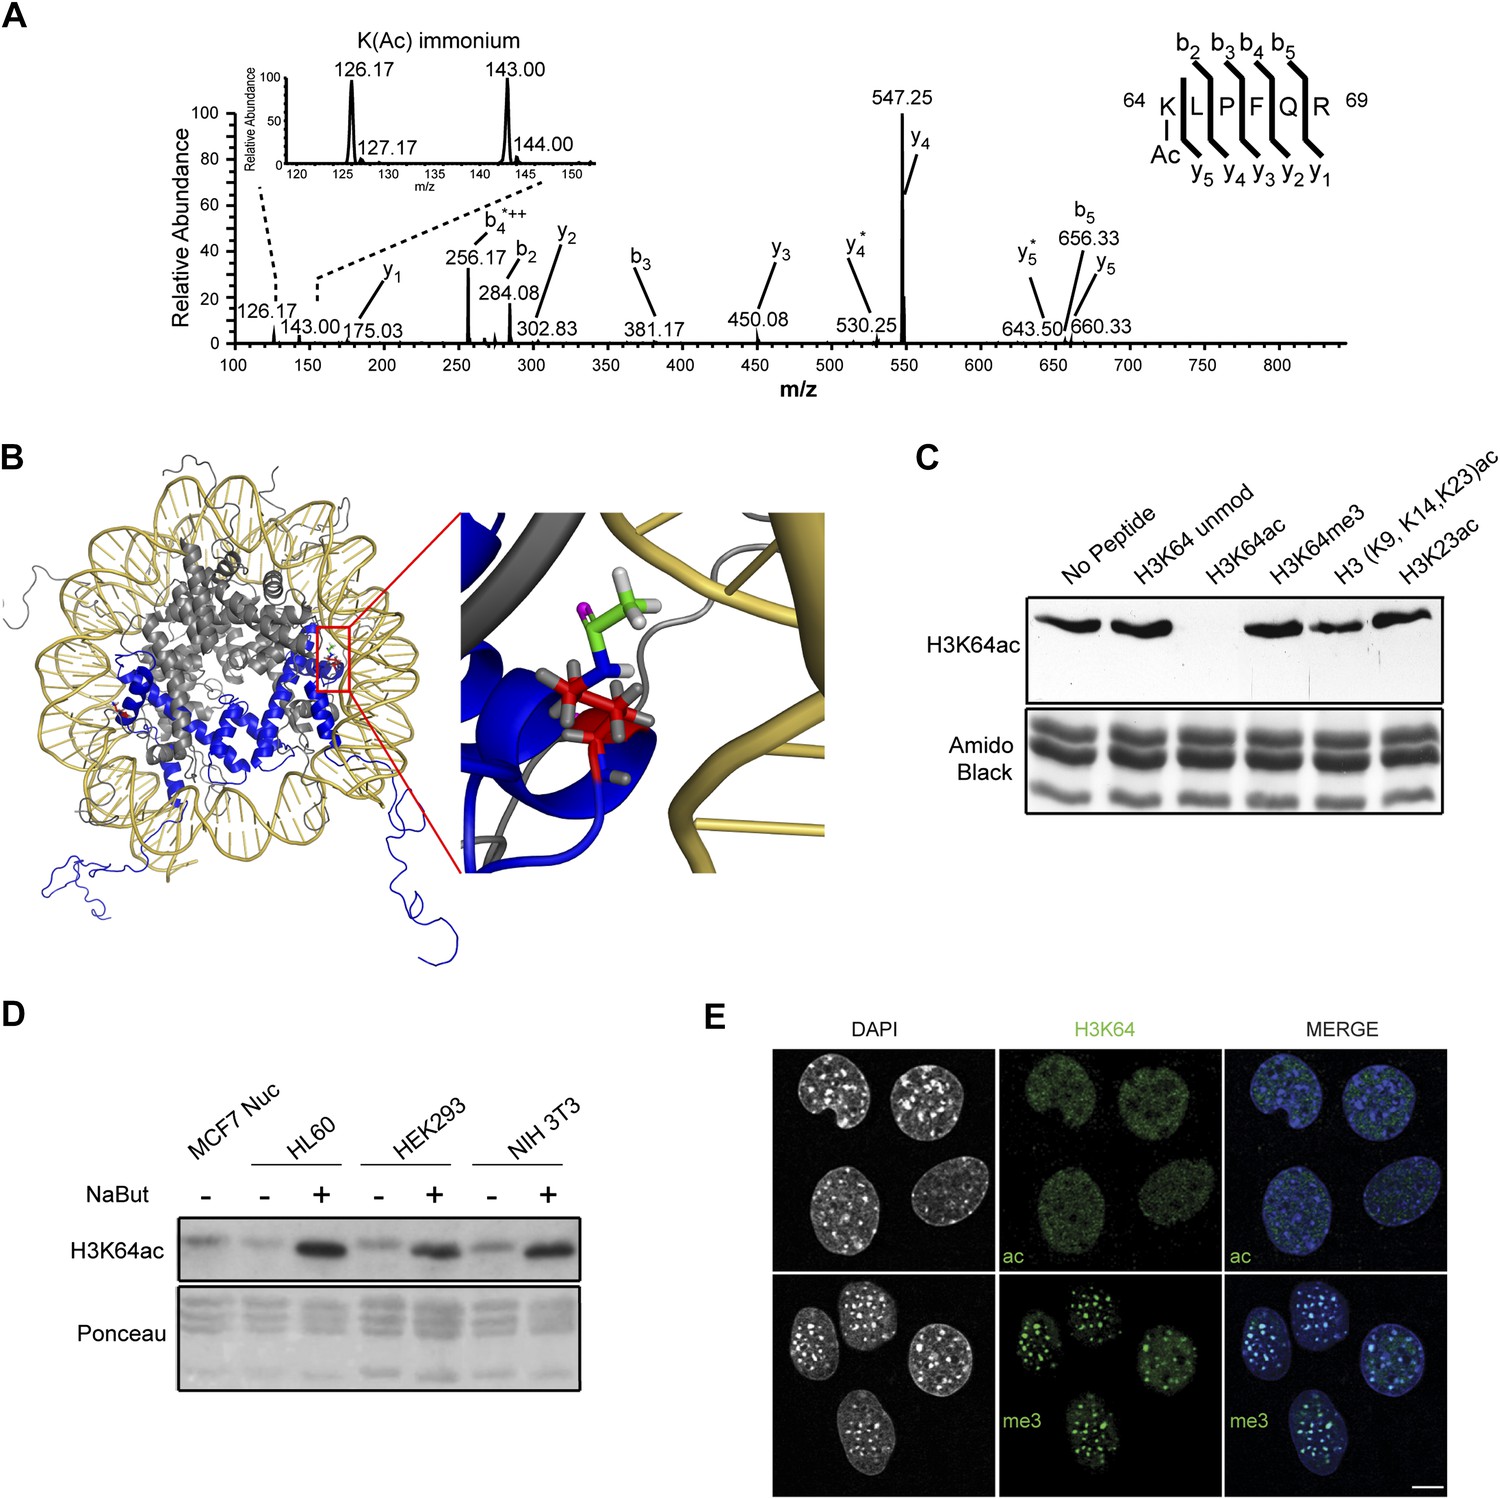
Acetylation of K64 in histone H3 is a novel histone modification.
(A) CID MS/MS spectrum of the tryptic peptide (K(ac)LPFQR; m/z [MH22+] 415.74823) derived from endogenous histone H3 demonstrating K64 acetylation. The presence of the b2, the y5, the y5-NH3(y5*) and the immonium ions derived from (ɛ) acetyl-lysine (enlarged spectrum inlet) are used for site localization to lysine 64. (B) H3K64 is on the lateral surface of the histone octamer. 3D modelling of a nucleosome. H3 dimer is shown in blue and the proximity of acetylated H3K64 (red rectangle) with the DNA is highlighted in the zoomed-in inset. In red are shown the main-chain and the side-chain of lysine 64. The acetyl group linked to the side-chain terminal nitrogen atom (in blue) appears in green, with its oxygen atom in purple. All hydrogen atoms are displayed in grey. (C) Peptide competition of H3K64ac immunoblot. H3K64ac antibody was pre-adsorbed with 50 pmoles/ml of indicated peptides. Amido black staining is shown as loading control (bottom panel). (D) Immunoblot analysis of H3K64 acetylation state in different cell lines, treated (+) or not (−) with HDACs inhibitor Na-Butyrate. Untreated MCF7 nuclesosomes were used as control. Ponceau staining is shown as loading control (bottom panel). (E) H3K64ac is enriched in euchromatic regions. H3K64 acetylation (ac, upper panels) and tri-methylation patterns (me3, lower panels) in MEFs. DAPI dense foci represent pericentric heterochromatin. Single sections are shown. Scale bar, 10 μm.
Figure 1—figure supplement 1
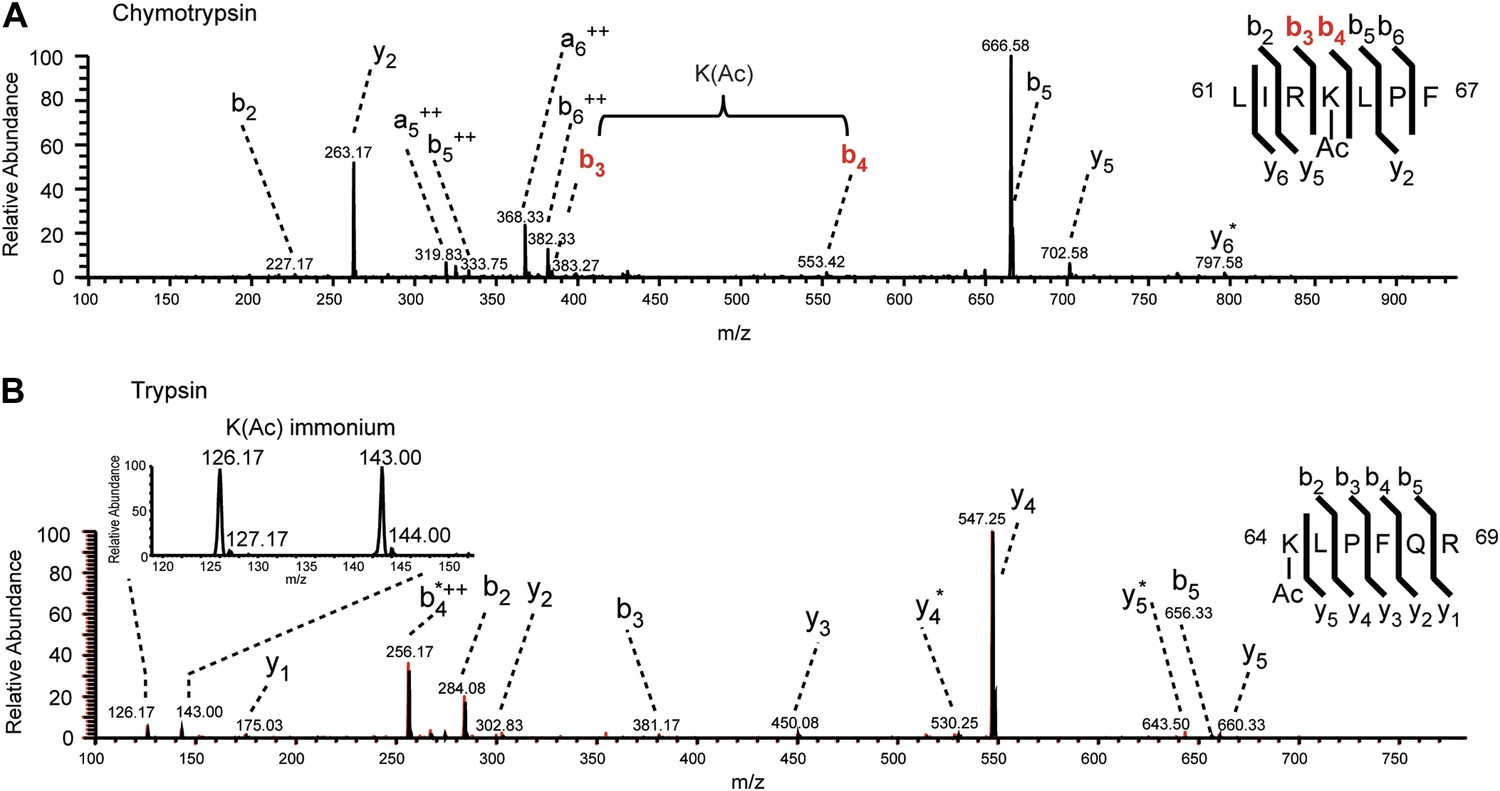
MS/MS spectra of H3K64ac peptides.
CID MS/MS spectra of a chymotryptic (LIRK(ac)LPF; m/z [MH22+] 464.80363) and a tryptic (K(ac)LPFQR; m/z [MH22+] 415.74823) peptide (A and B panels, respectively) derived from endogenous histone H3 demonstrating the acetylation of K64. The mass difference between the b4 and b3 ion of the chymotryptic peptide LIRK(ac)LPF indicates the presence of acetyl-lysine. This is further corroborated by the virtually identical MS/MS spectral overlay of the tryptic peptide K(ac)LPFQR (see also Figure 1) either derived from endogenous H3 (illustrated in black) or the synthetic peptide STELLIRK(ac)LPFQRLVGC(amide) (highlighted in red).
Figure 1—figure supplement 2
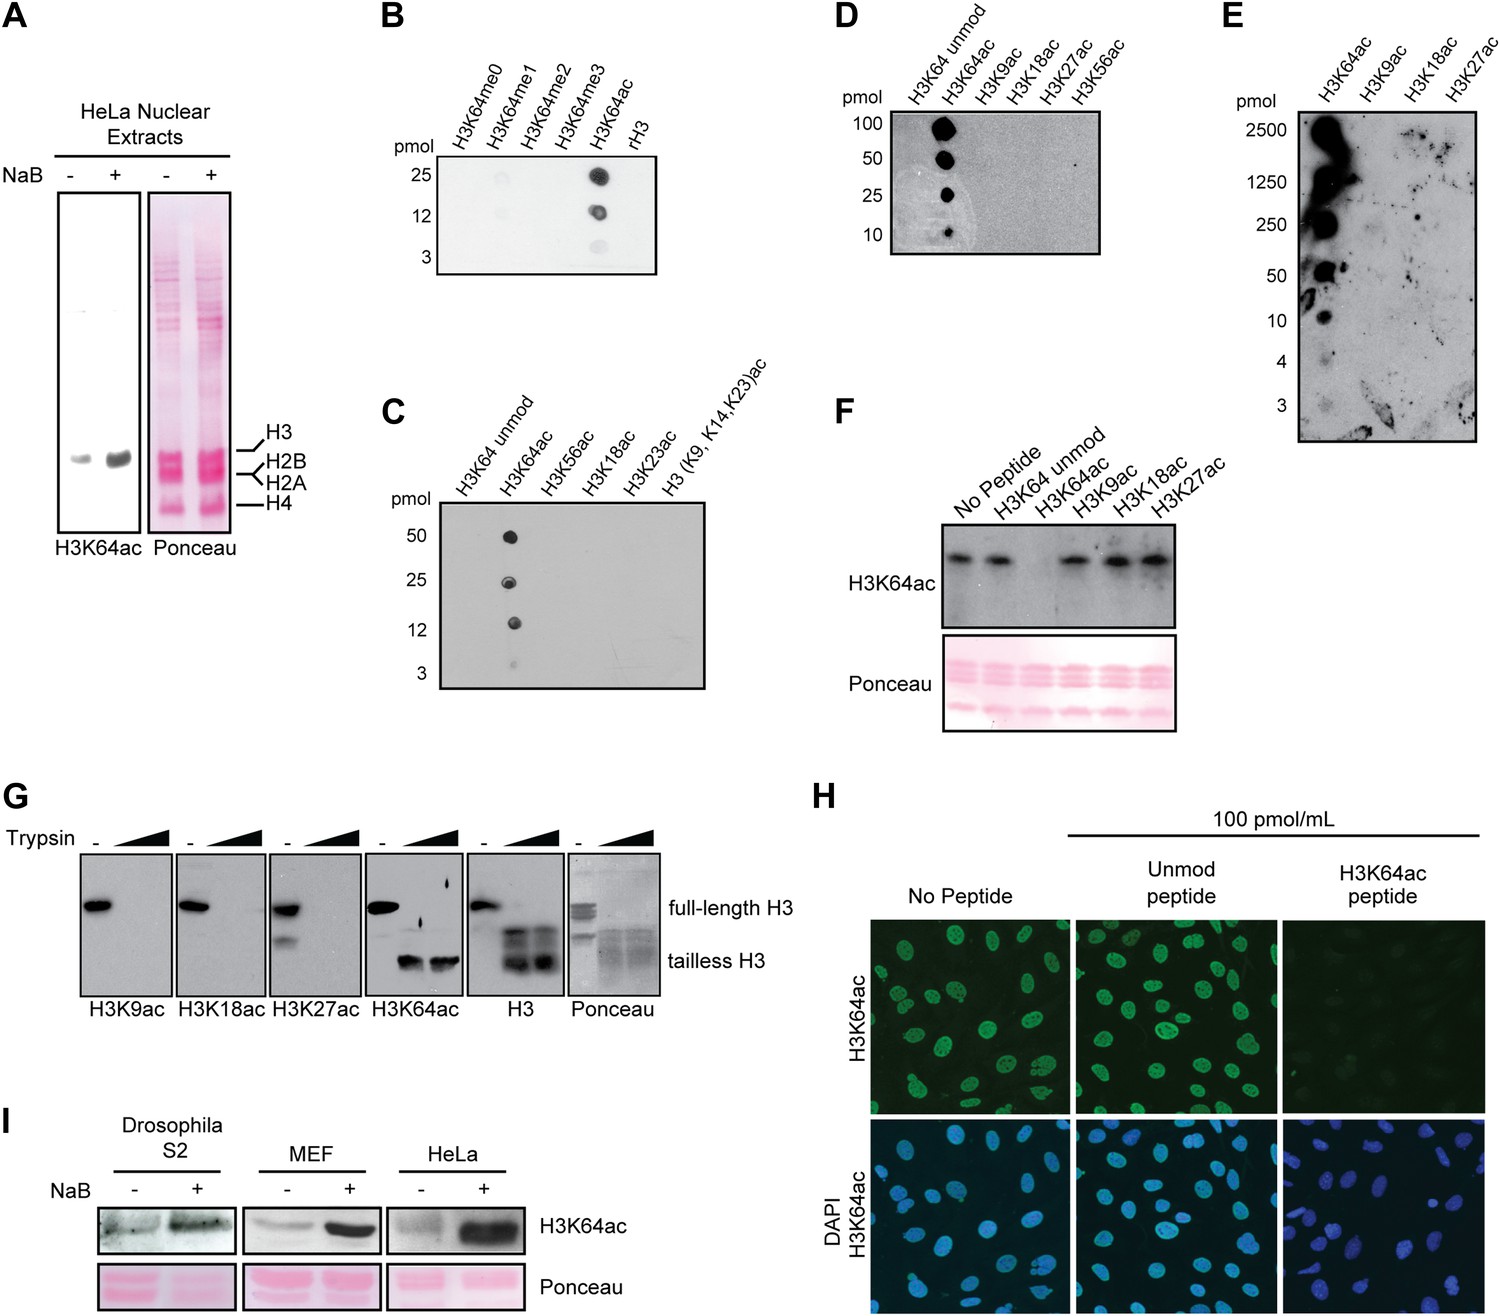
Anti-H3K64ac antibody validation.
(A) Western blot analysis with H3K64ac antibody (left panel) on nuclear extracts from untreated (−) or Na-butyrate-treated (+) HeLa cells. Ponceau staining is shown as loading control (right panel). (B), (C), (D), and (E) Immuno-dot blots showing specific reactivity of the H3K64ac antibody. Aliquots of indicated pmoles of linear H3 peptides were spotted on the membrane. Of note, detection of peptides in (E) has been checked with H3K9ac, H3K18ac, and H3K27ac specific antibodies. (F) Peptide competition assay of H3K64ac immunoblot. H3K64ac antibody was pre-adsorbed with 50 pmoles/ml of indicated peptides. Ponceau staining is shown as loading control (bottom panel). (G) The H3K64ac antibody detects globular, tailless H3. Nucleosomes from NIH3T3 cells were incubated with no (−) or increasing amounts of trypsin to cleave the histone tails and immunoblotted as indicated for H3K9ac, H3K18ac, H3K27ac, H3K64ac and H3. The position of full-length and tailless H3 is indicated and loading was controlled by ponceau staining. (H) Peptide competition assay in immunofluorescence. MEFs were treated overnight with Na-butyrate (NaB) and then stained with H3K64ac antibody, pre-incubated with 100 pmoles/ml of either unmodified or acetylated K64 peptide. (I) Immunoblot analysis of H3K64 acetylation state in additional cell lines (Drosophila S2, mouse MEFs, human HeLa) with H3K64ac antibody. Inhibition of HDACs by Na-butyrate treatment increases acetylation levels. Ponceau staining is shown as loading control (bottom panel).
Figure 1—figure supplement 3
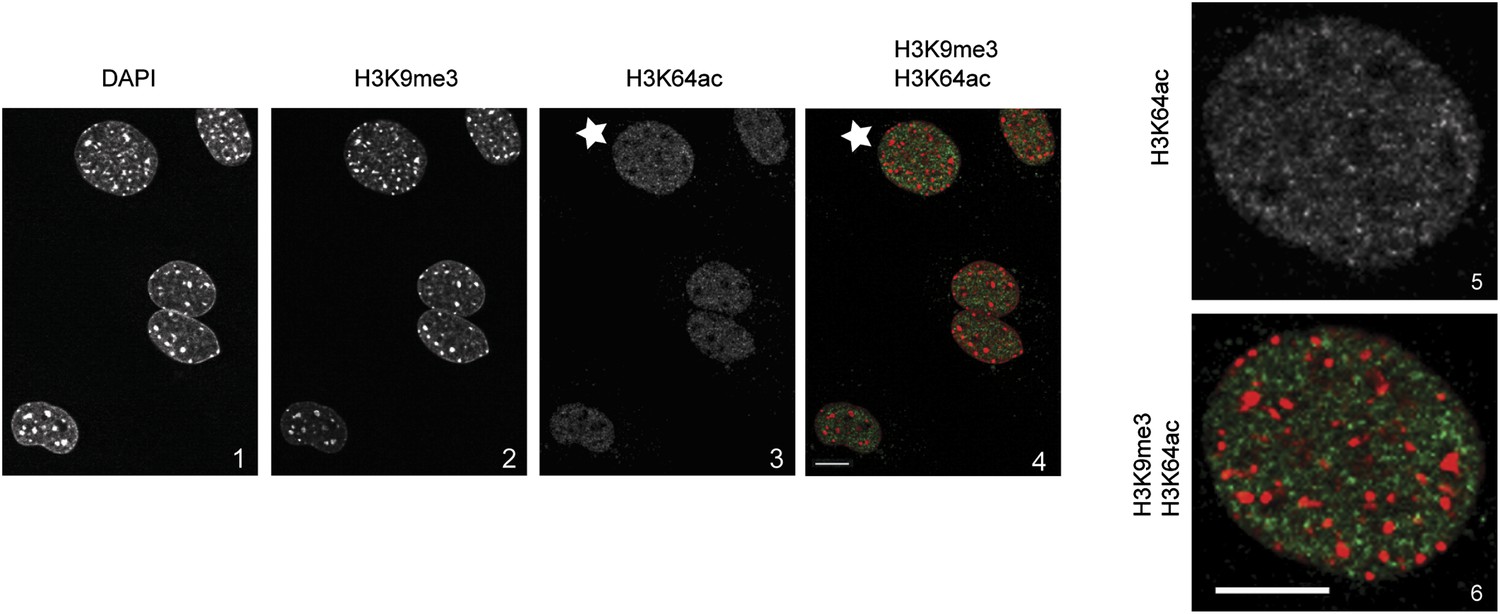
H3K64ac is excluded from heterochromatic foci.
DAPI dense foci (panel 1) represent pericentric heterochromatin where H3K9me3 is enriched and H3K64ac excluded (compare panels 2, 3 with 4 and panels 5 with 6, representing a magnified view of the cell indicated by a white star). In panel 4 and 6 H3K9me3 appears in red and H3K64ac in green. Shown are single sections, scale bar, 10 µm.
Figure 2 with 2 supplements
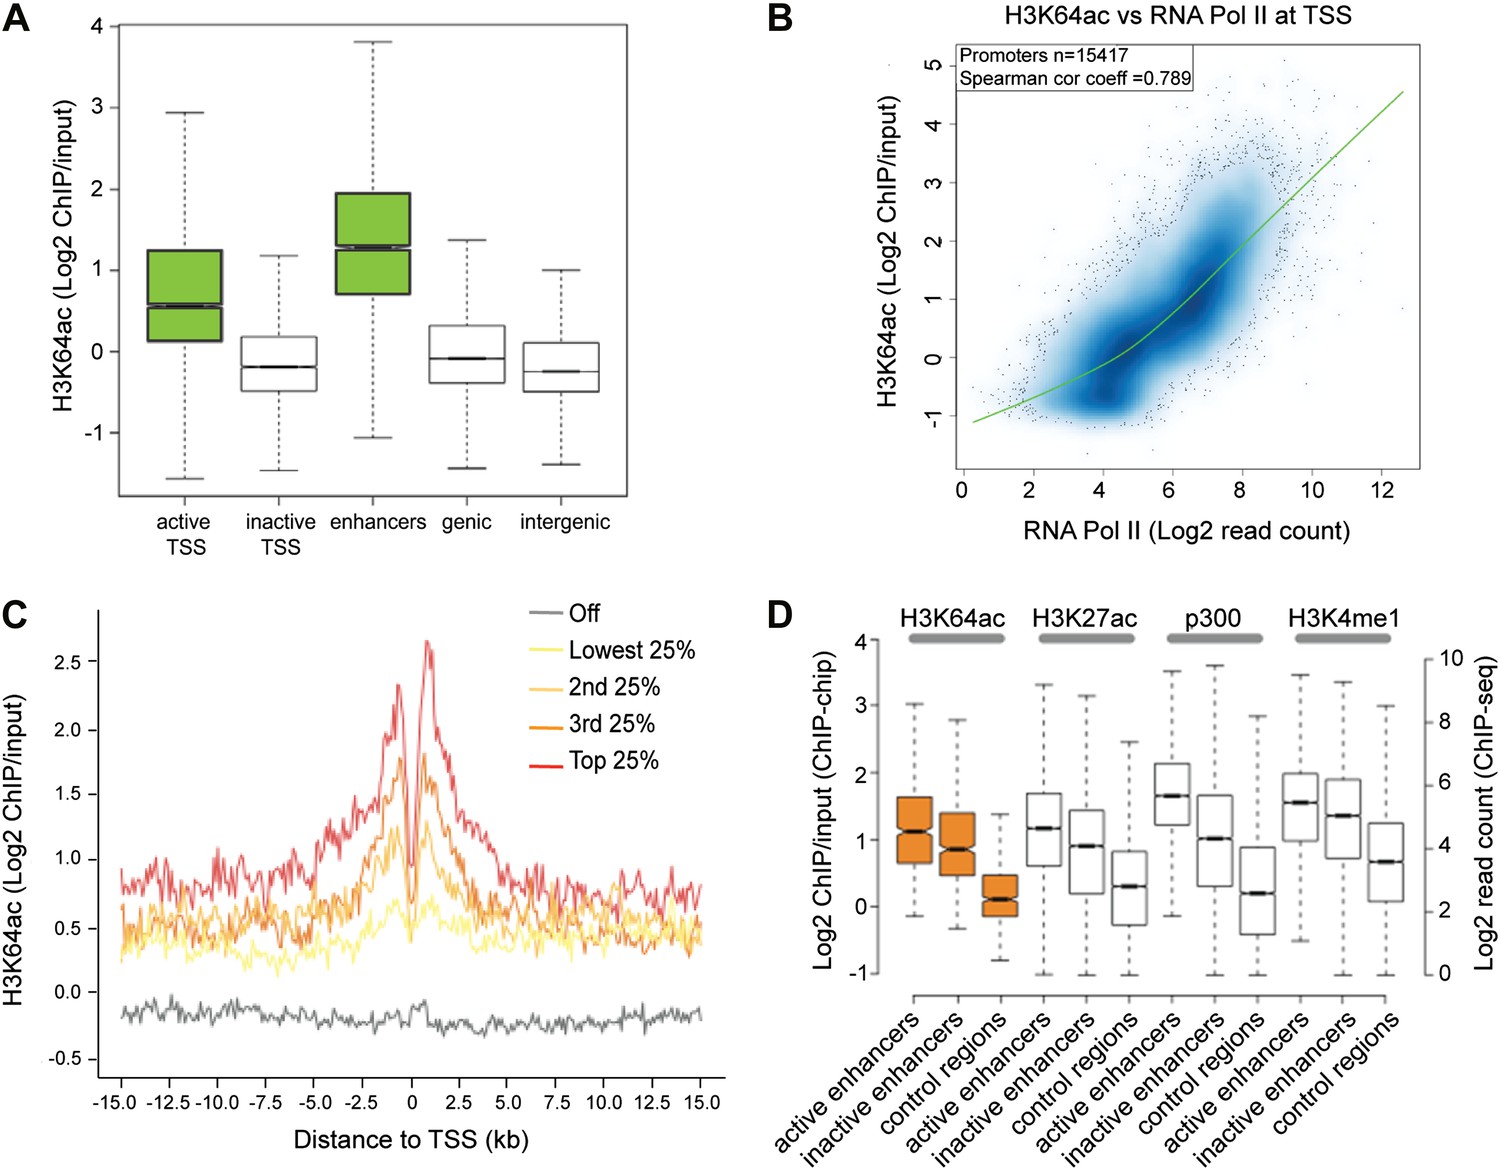
H3K64ac is enriched genome-wide at active regulatory regions.
(A) H3K64ac is predominantly localized to active TSS and enhancers in mouse ES cells (see also D). Boxplot showing H3K64ac signal intensity (log2 ChIP/input) for all microarray probes at active TSS, inactive TSS, enhancers, gene bodies, and intergenic regions. (B) Comparison of H3K64ac and RNA Pol II at TSS. Scatterplot showing signal density distribution and global correlation. The green line is a loess-fitted trend line. (C) Meta-gene plot showing H3K64ac enrichment around TSS grouped according to their expression level. (D) Boxplot comparing H3K64ac to ‘enhancer-specific’ histone modifications and p300 levels (Creyghton et al., 2010) at active enhancers, inactive enhancers and control regions (enhancer regions shifted by 100 kb). H3K64ac levels were measured by ChIP-on-chip (left Y axis), whereas the other modifications and p300 by ChIP-seq (right Y axis).
Figure 2—figure supplement 1
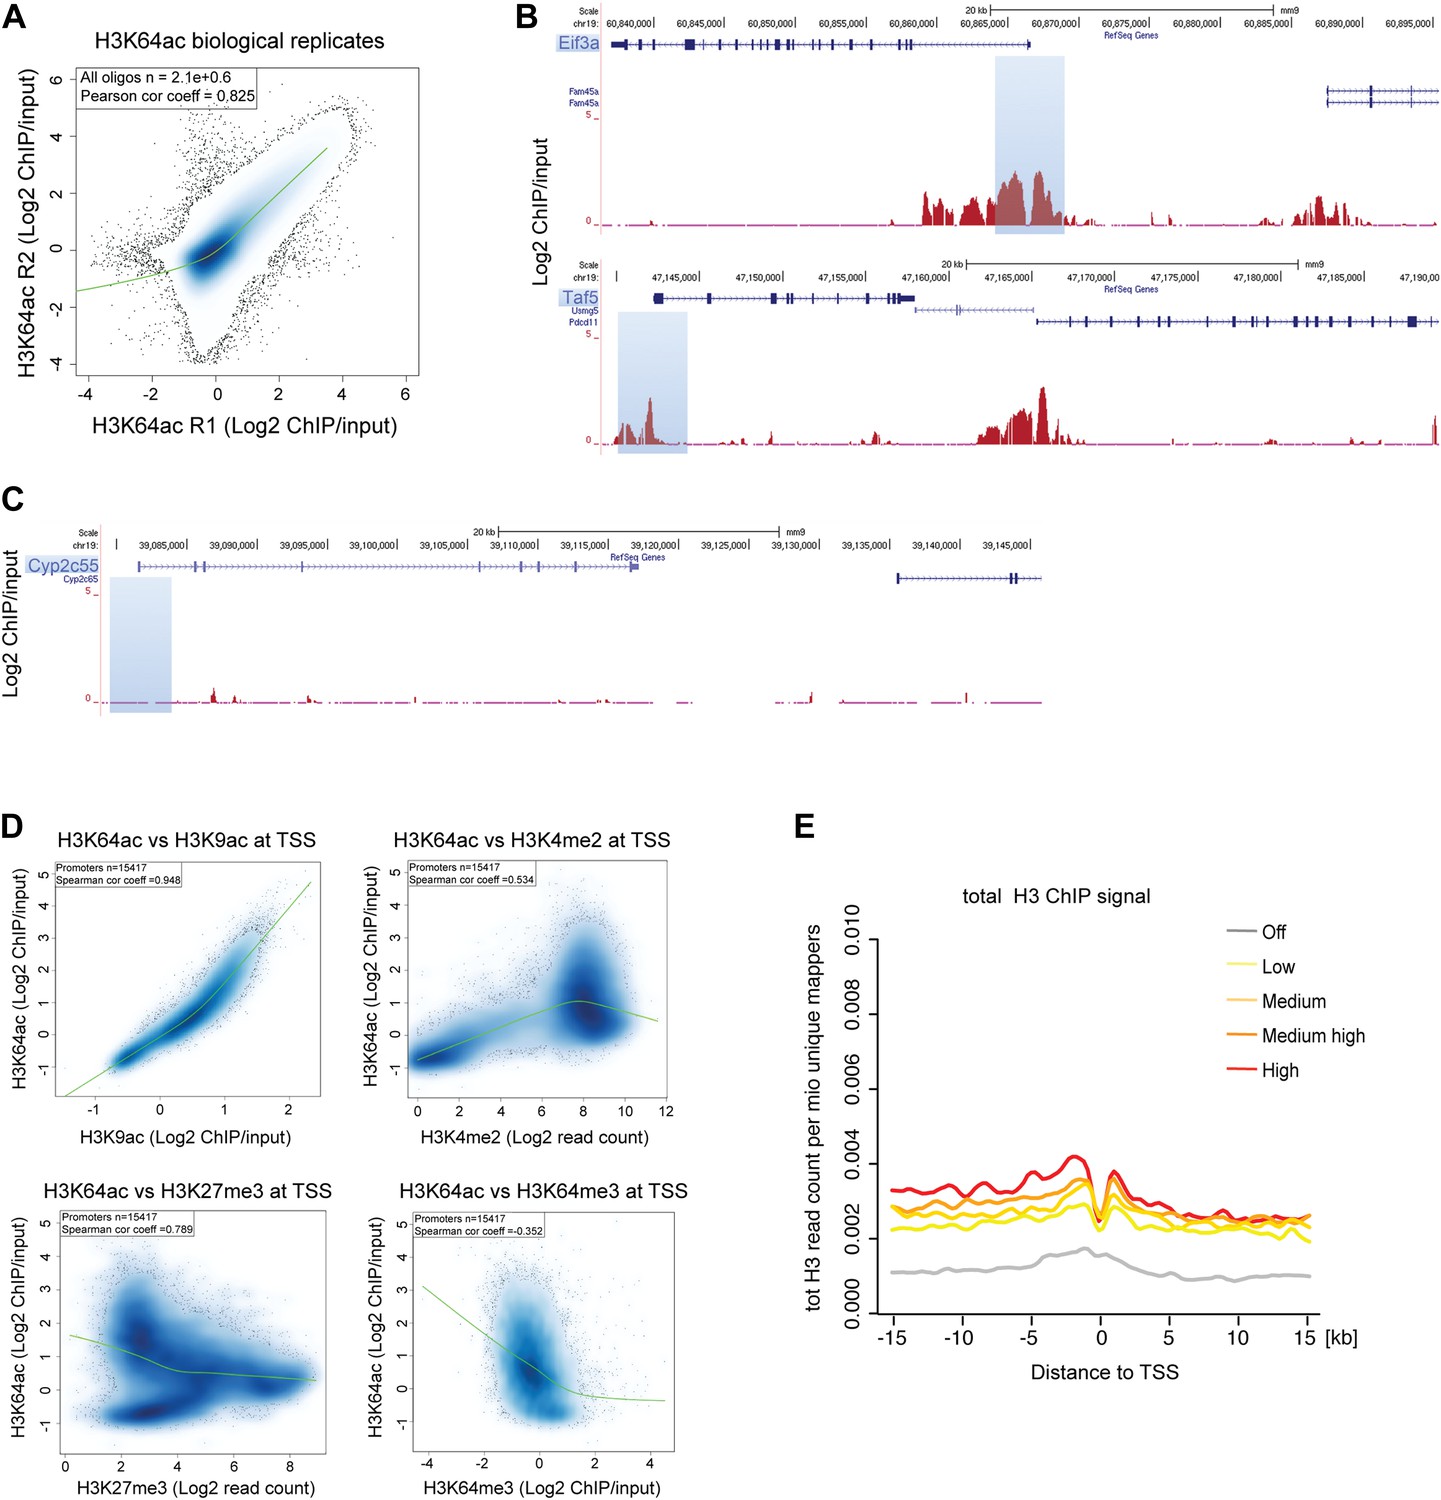
H3K64ac distribution within active chromatin.
(A) Scatterplot showing global correlation between raw data from the two biological H3K64ac ChIP-on-chip replicate experiments. The green line is a loess-fitted trend line. (B) UCSC browser screenshots of H3K64ac enrichment at the proximal promoter of active genes (Eif3a, upper panel and Taf5, lower panel). (C) UCSC browser screenshots of H3K64ac enrichment at the proximal promoter of inactive genes (Cyp2c55 and Cyp2c65). For (B) and (C) shown are the enrichments for H3K64ac (as log2 values of ChIP/input) for one biological replicate. Areas in light blue highlight the region surrounding the TSS of the indicated genes. (D) Scatterplots showing global correlation at TSS between H3K64ac and ‘active’ modifications such as H3K9ac and H3K4me2 and ‘repressive’ marks such as H3K27me3 and H3K64me3. The green line is a loess-fitted trend line. (E) Meta-gene plot showing total H3 enrichment around TSS grouped according to their expression level. Of note, H3 density is rather uniform and the slight enrichment proximal to the TSS cannot explain the strong enrichment of H3K64ac detected in the same region (Figure 2C).
Figure 2—figure supplement 2
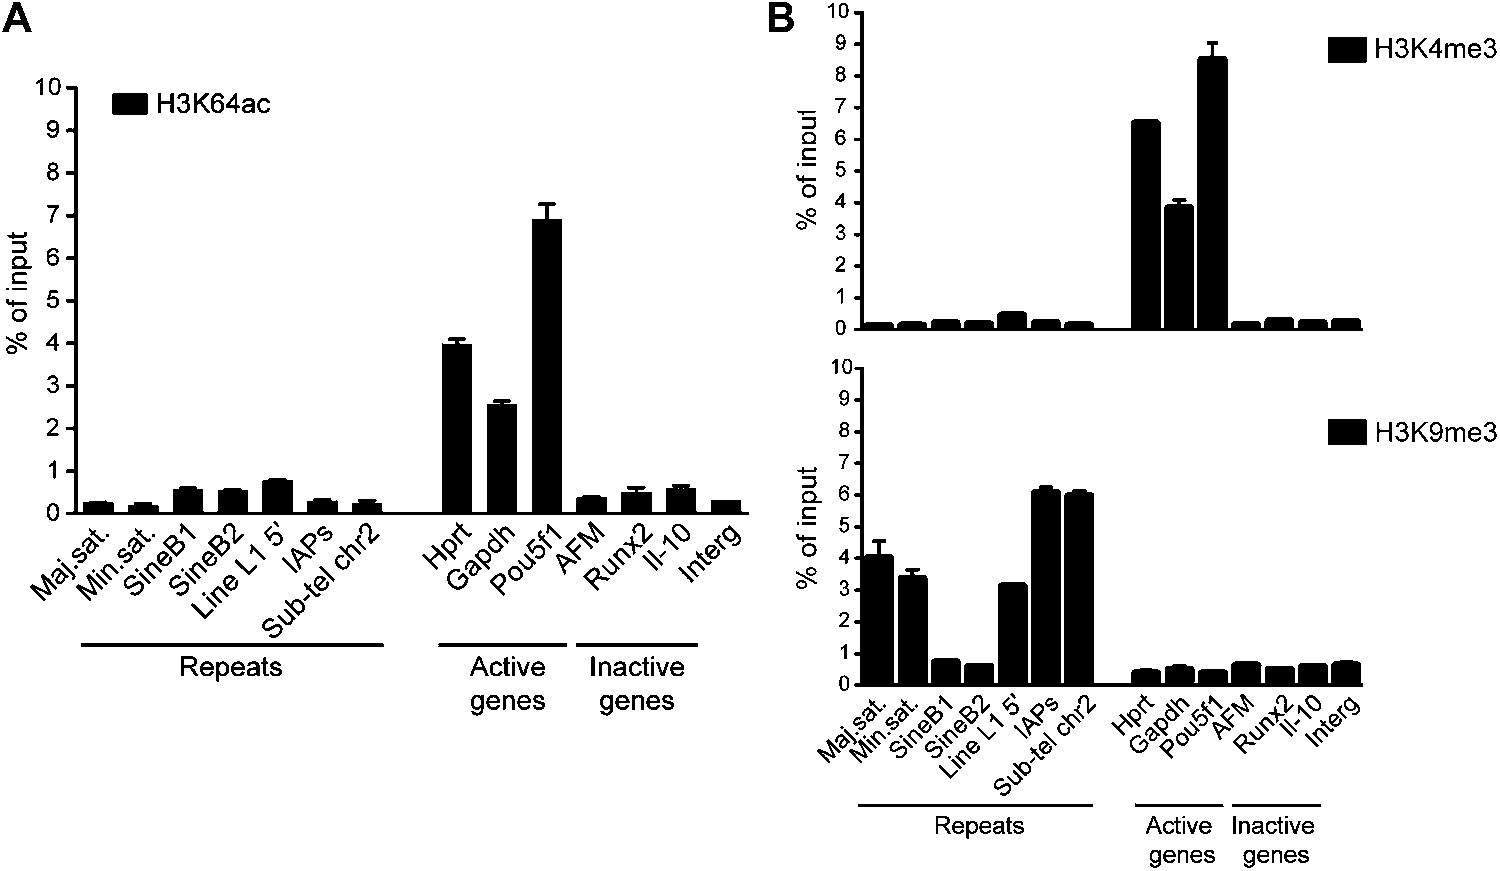
Genome-wide data validation by ChIP-qPCR.
(A) Native ChIP analysis of H3K64ac on different genomic regions in mouse ES cells. H3K64ac is enriched at the TSS of active genes, but depleted from inactive genes and repeats. (B) Native ChIP analysis performed as in (A). As expected the active H3K4me3 mark is enriched at active genes, but depleted from inactive genes and repeats, in an exact opposite manner to H3K9me3 enriched in repetitive regions.
Figure 3 with 2 supplements
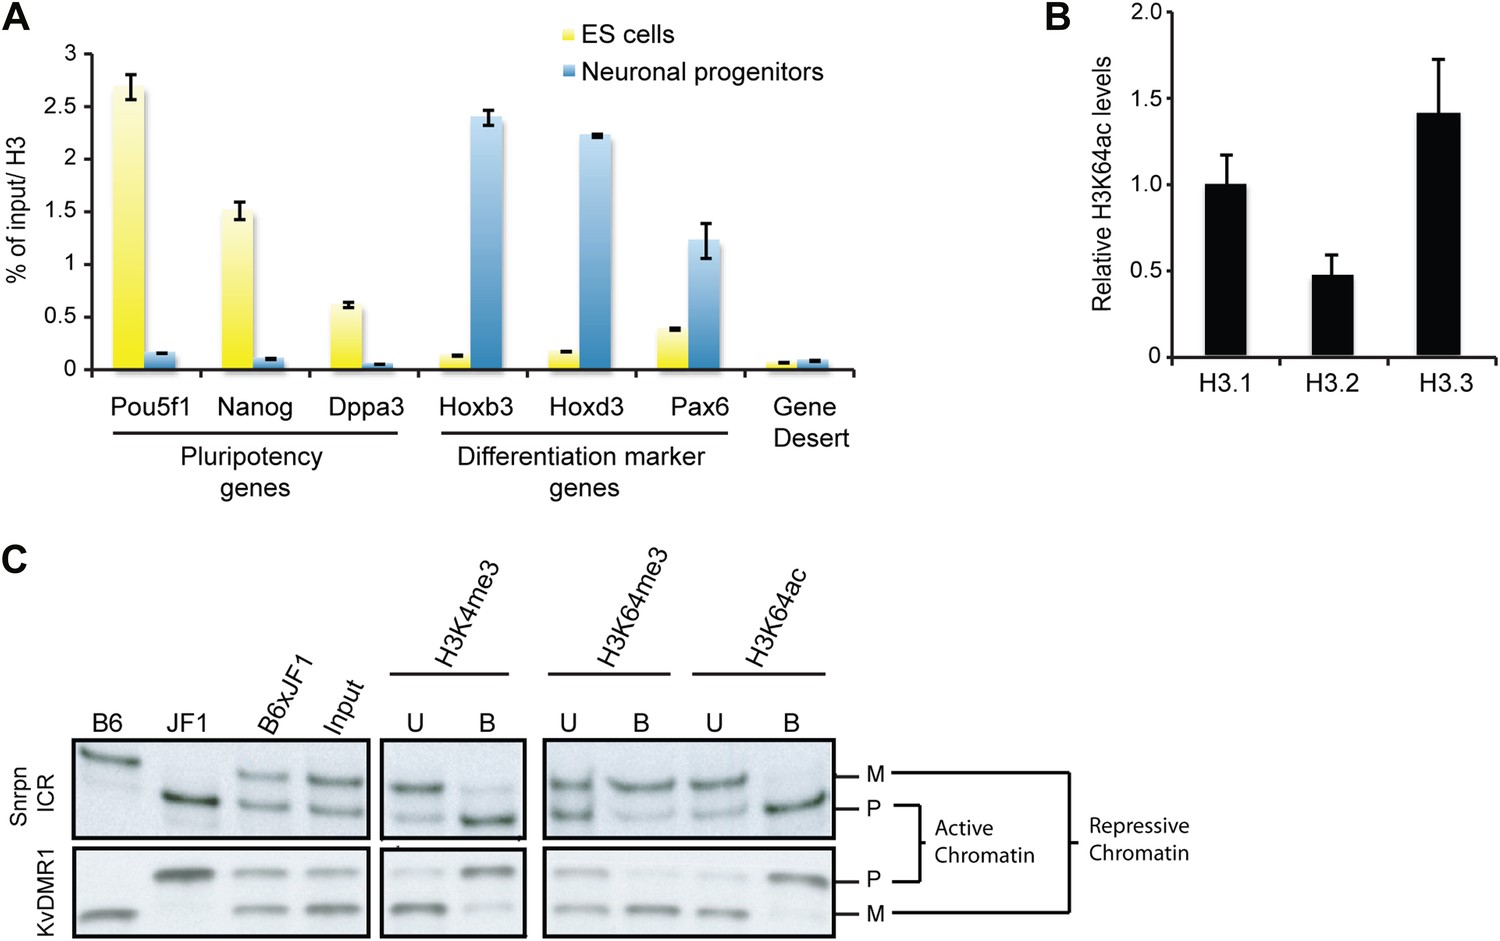
H3K64ac is enriched on active genes.
(A) ChIP analysis of H3K64ac on pluripotency genes and differentiation-specific genes. Real-time PCR analysis for indicated promoter regions and gene desert in undifferentiated (yellow bars) or retinoic acid-induced (blue bars) ES cells. (B) Distribution of H3K64ac among the H3 variants. Flag-HA-tagged histones H3.1, H3.2, or H3.3 were immunoprecipitated and probed with H3K64ac antibody. Average quantification of three biological replicates (±SD) showing H3K64ac signal over HA relative to H3.1. (C) The active alleles of ICRs are specifically marked by H3K64ac. Native ChIP performed on primary embryonic fibroblasts of (C57Bl/6 x JF1) F1 genotype followed by radioactive PCR across polymorphic nucleotides between the paternal JF1 (M. m. molossinus) and the maternal C57BL/6J (B6) genomes. Single-strand conformation polymorphisms (SSCP) were revealed by electrophoresis through a non-denaturing agarose gel. The left panels show PCRs on control genomic DNAs to depict the SSCP polymorphisms used. In the input chromatin (input), the parental were equally represented at the loci analysed. U, unbound fraction; B, bound fraction; M, maternal allele; P, paternal allele.
Figure 3—figure supplement 1
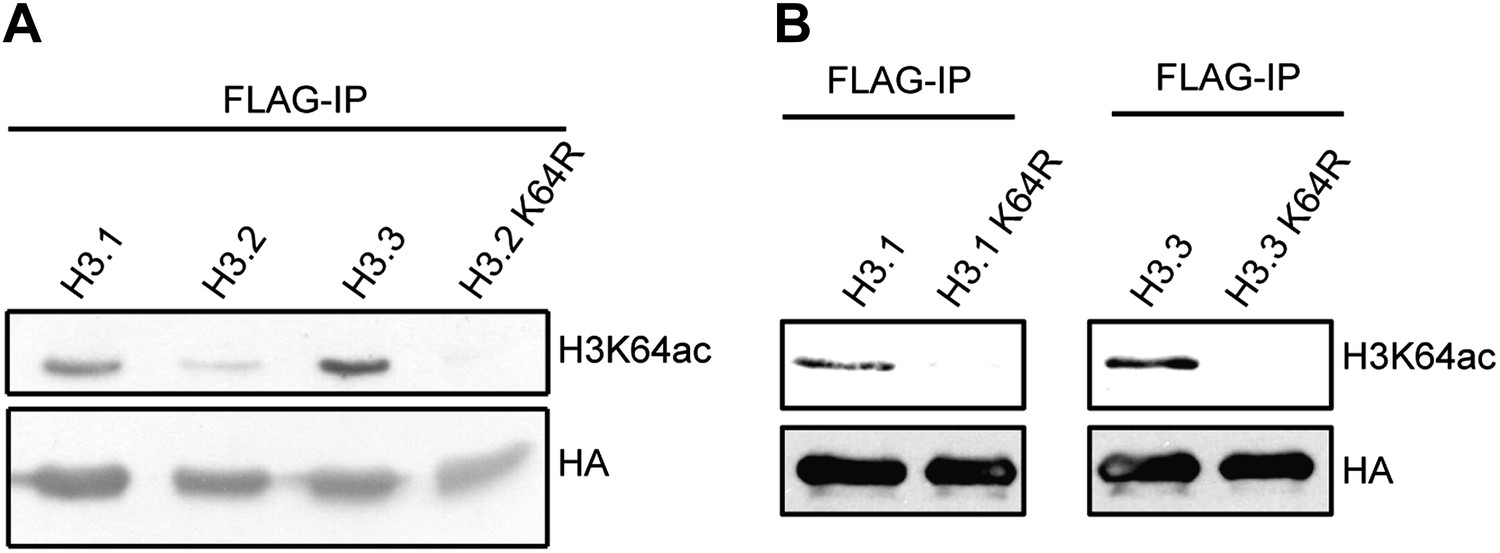
Immunoblots of H3K64ac distribution among H3 variants.
(A) Representative immunoblot of Flag-immunoprecipitated H3 variants, probed with H3K64ac antibody (top panel) and HA antibody as loading control (bottom panel). An antibody control lane with an H3.2K64R mutant is also shown. (B) Antibody specificity was verified using H3.1K64R and H3.3K64R point mutants. Flag immunoprecipitated K64R mutants or wt variants were probed with H3K64ac antibody (top), and anti-HA antibody as loading control (bottom).
Figure 3—figure supplement 2
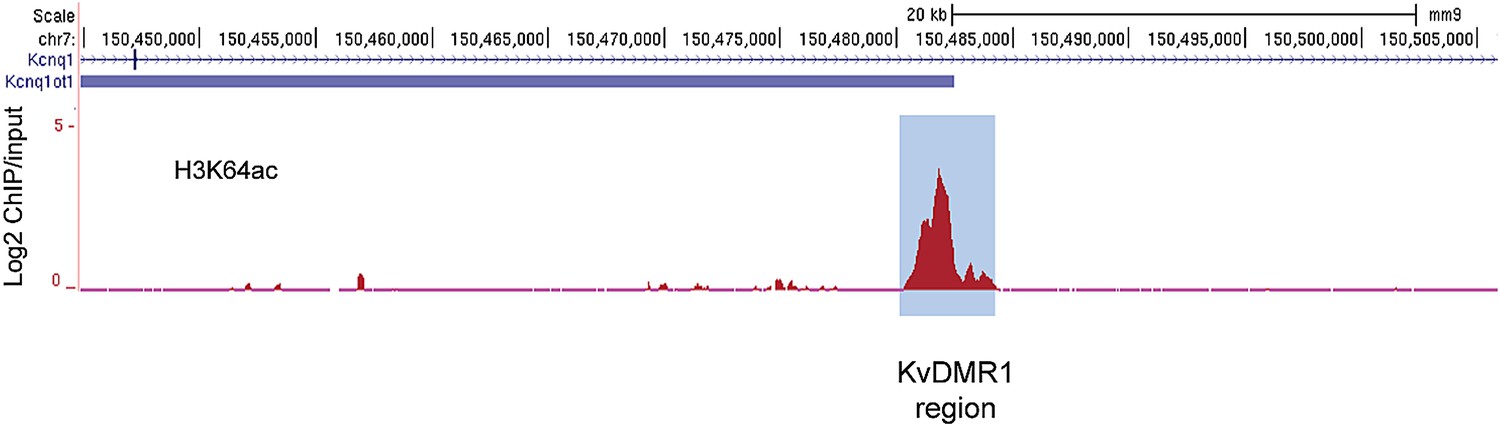
The active alleles of ICRs are specifically marked by H3K64ac.
UCSC browser screenshots of H3K64ac enrichment at the KvDMR1 ICR region in mouse ES cells validating enrichment at ICRs. Shown are the log2 values of ChIP/input measurements.
Figure 4 with 1 supplement
p300 acetylates H3K64 in vivo and in vitro.
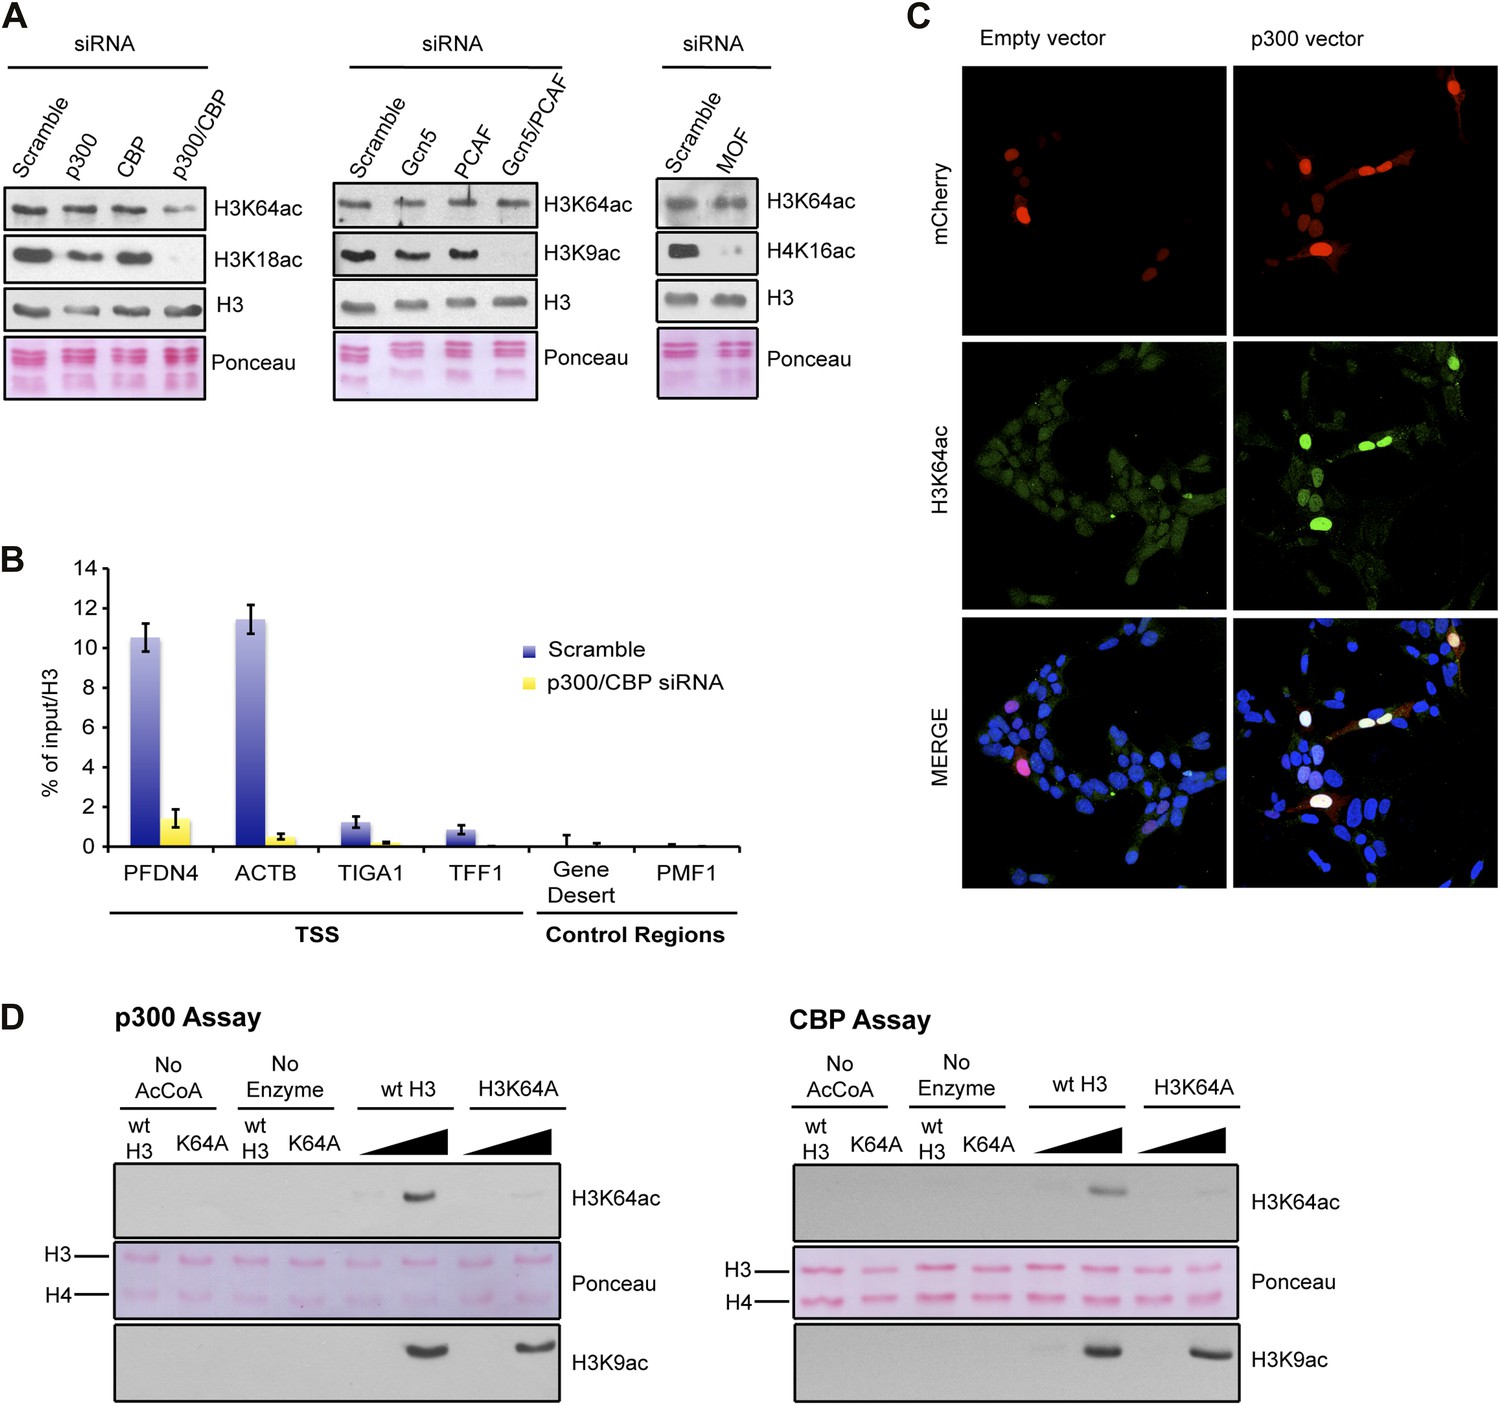
(A) siRNA-mediated depletion of HATs (as indicated) in MCF7 cells. Immunoblot analysis of global H3K64ac levels and additional modifications as controls for siRNA efficiency. Anti-H3 blot and Ponceau staining are shown as loading controls. (B) ChIP analysis of H3K64ac enrichment on different mouse genomic regions (as indicated) upon depletion of p300/CBP (yellow) compared to the control knock-down (scramble, blue). (C) Overexpression of p300 in HEK293 cells. Control (empty vector) or p300 overexpressing cells co-expressed mCherry (red, top panel) and were assessed for H3K64ac levels (green) in immunoflourescence. (D) In vitro HAT assay with p300 or CBP using recombinant H3 (wt or K64A mutant) as substrate and probed with the H3K64ac antibody (top panel). Ponceau staining as loading control (middle panel) and H3K9ac western blot as activity control (bottom panel) are shown.
Figure 4—figure supplement 1
Validation and supporting experiment to establish p300 activity on H3K64.
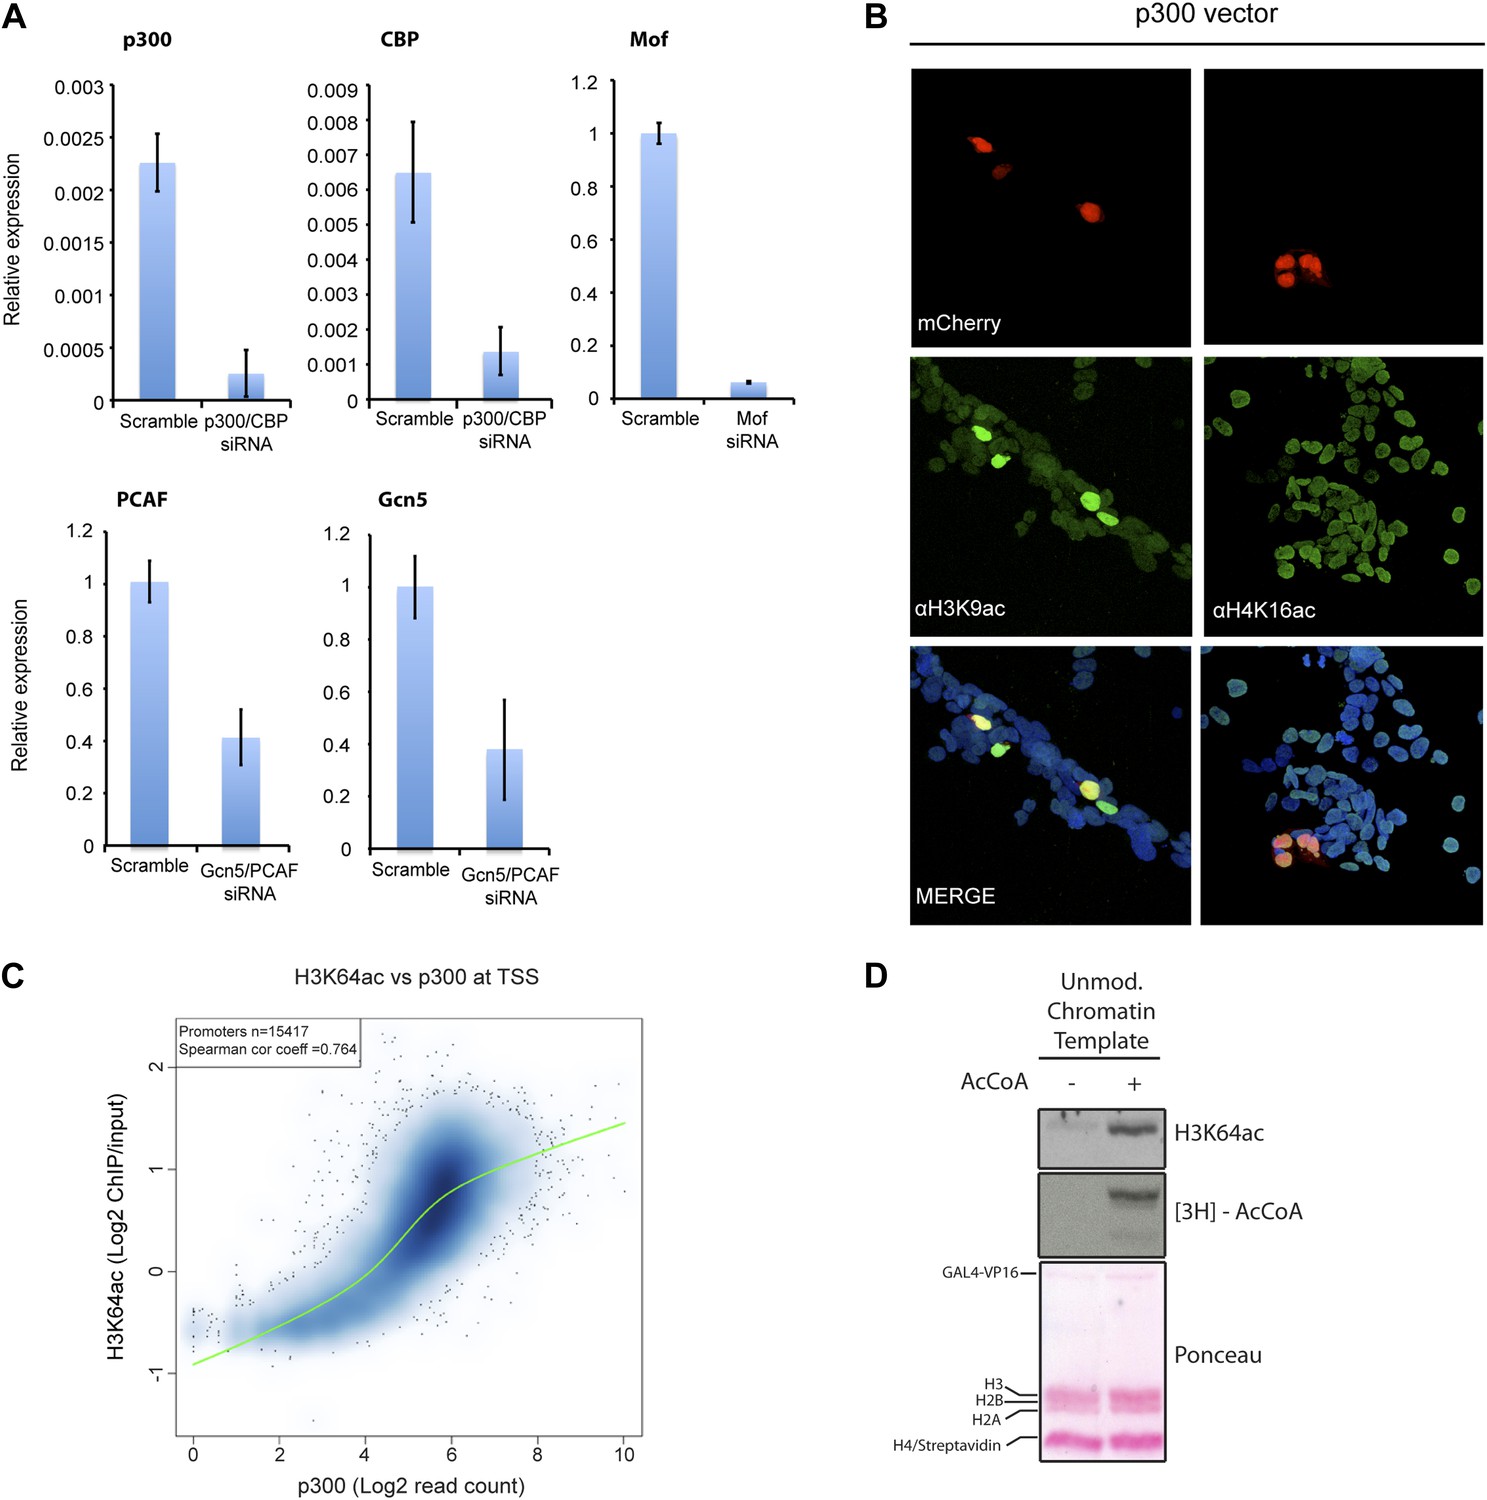
(A) Validation of HATs knock-down. Upon transfection of targeted siRNA, mRNA levels of indicated HATs are strongly reduced compared to the scramble control. (B) p300 overexpression in HEK293 cells (marked by mCherry expression, red) leads to an increase in the acetylation level of H3K9 (left panel), a p300 target, but no increase in H4K16 acetylation (right panel). (C) Scatterplot showing signal density distribution and global correlation between H3K64ac and p300 at TSS. Green lines are loess-fitted trend lines. (D) Immunoblot showing specific p300 activity on H3K64 (top) within an immobilised chromatin template. p300 was recruited by the transcriptional factor VP16. Autoradiography (3H-acetyl-CoA incorporation, middle) as enzyme activity control and ponceau staining as loading control (bottom) are shown.
Figure 5 with 5 supplements

H3K64 acetylation affects DNA-octamer interactions.
(A) H3K64ac nucleosomes are more sensitive to salt-induced disruption in in vitro FRET assays. Left, different views of a nucleosome with H3K64 highlighted in blue (spacefill) and the internal positions of the dye-labeled bases 35 bp from the end of the nucleosome. Right, the average (±s.e.) of three separate titrations is shown for unmodified (black squares), H3K9ac (unfilled squares), and H3K64ac nucleosomes (unfilled triangles). (B) Competitive in vitro nucleosome assembly reactions suggest that H3K64ac weakens histone–DNA interactions. Unmodified, H3K9ac, and H3K64ac nucleosomes were assembled in the presence of an excess of non-specific competitor DNA. The average (±s.e.) of three independent competitive assembly reactions is shown. (C) In spermatogenesis H3K64ac levels are high in elongating spermatids during the wave of massive chromatin remodelling. Schematic of mouse spermatogenesis (top). Immunofluorescence stainings (IF) show high H3K64ac levels in elongating spermatids (E) and below detection limit in spermatocytes (P) and round spermatids (R). Scale bar, 5 µm. (D) Immunohistochemistry stainings (IHC) on sections of mouse testis tubules. H3K64ac (brown) is enriched in elongating spermatids (stages IX-X), which are present near the lumen. Scale bar, 20 μm.
Figure 5—figure supplement 1
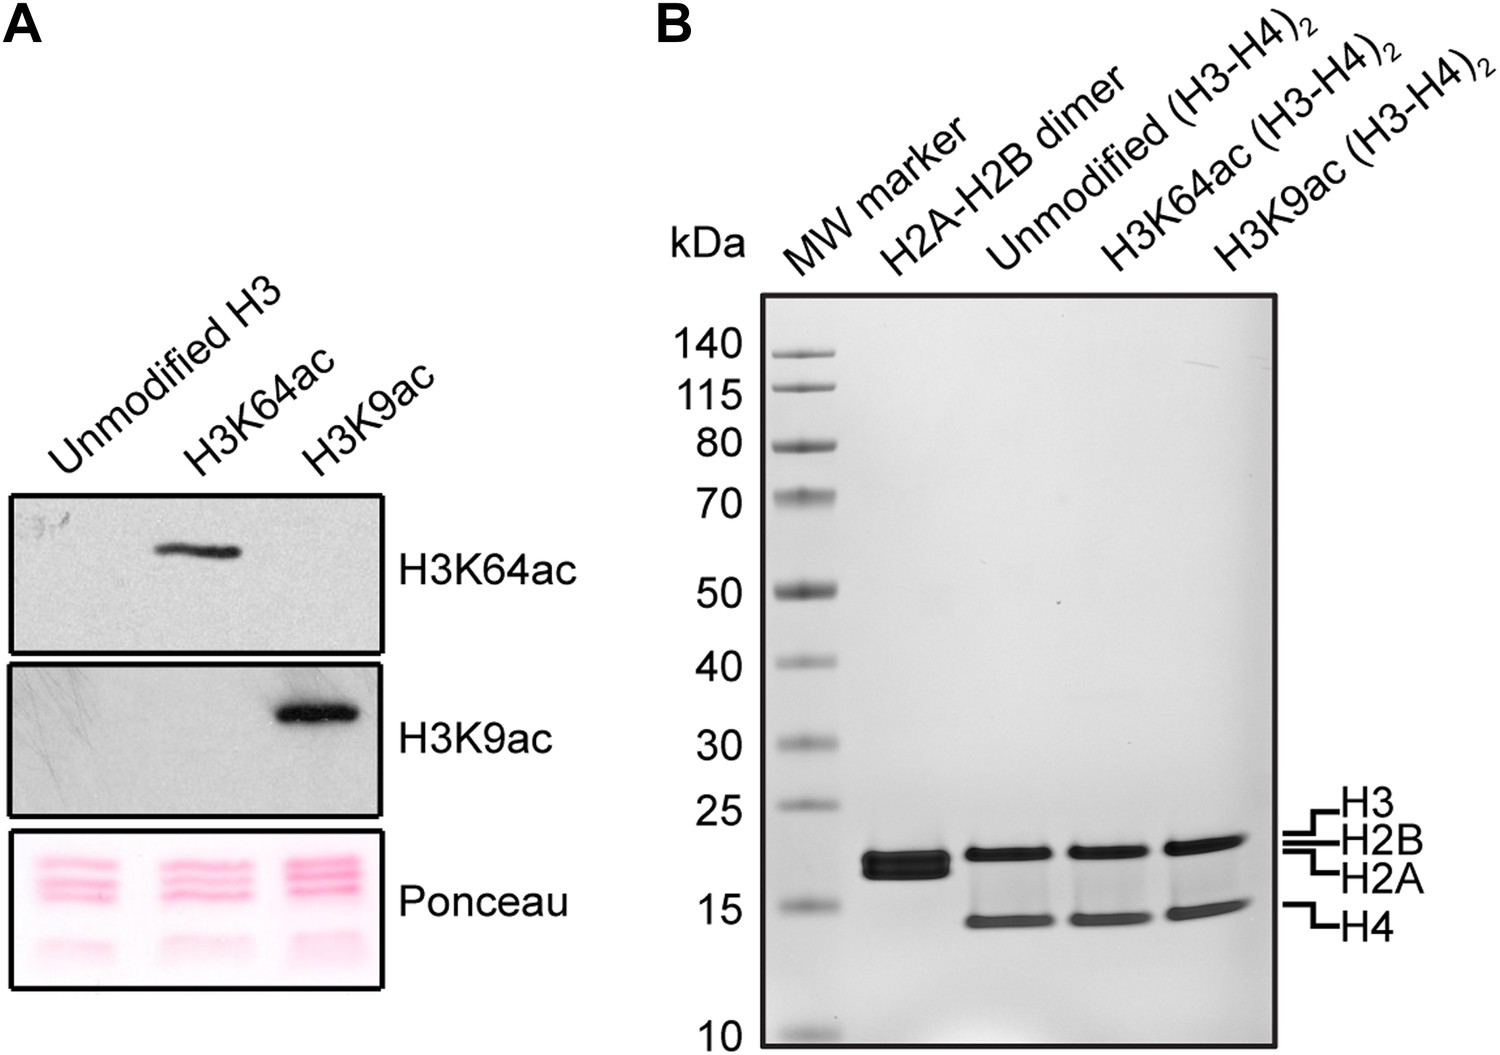
Validation of the substrates used in the in vitro assays.
(A) Validation of H3 acetylation on the octamer substrates used in the in vitro assays. The immunoblots show the acetylation levels of the reconstituted octamers specifically acetylated either on H3K64 or H3K9 compared with the unmodified H3. Ponceau staining is shown as loading control. (B) Staining of protein gel used to check that equal amounts of proteins had been used in the experiments and to assess H2A–H2B dimer, as well as unmodified, H3K64ac, and H3K9ac tetramer qualities.
Figure 5—figure supplement 2
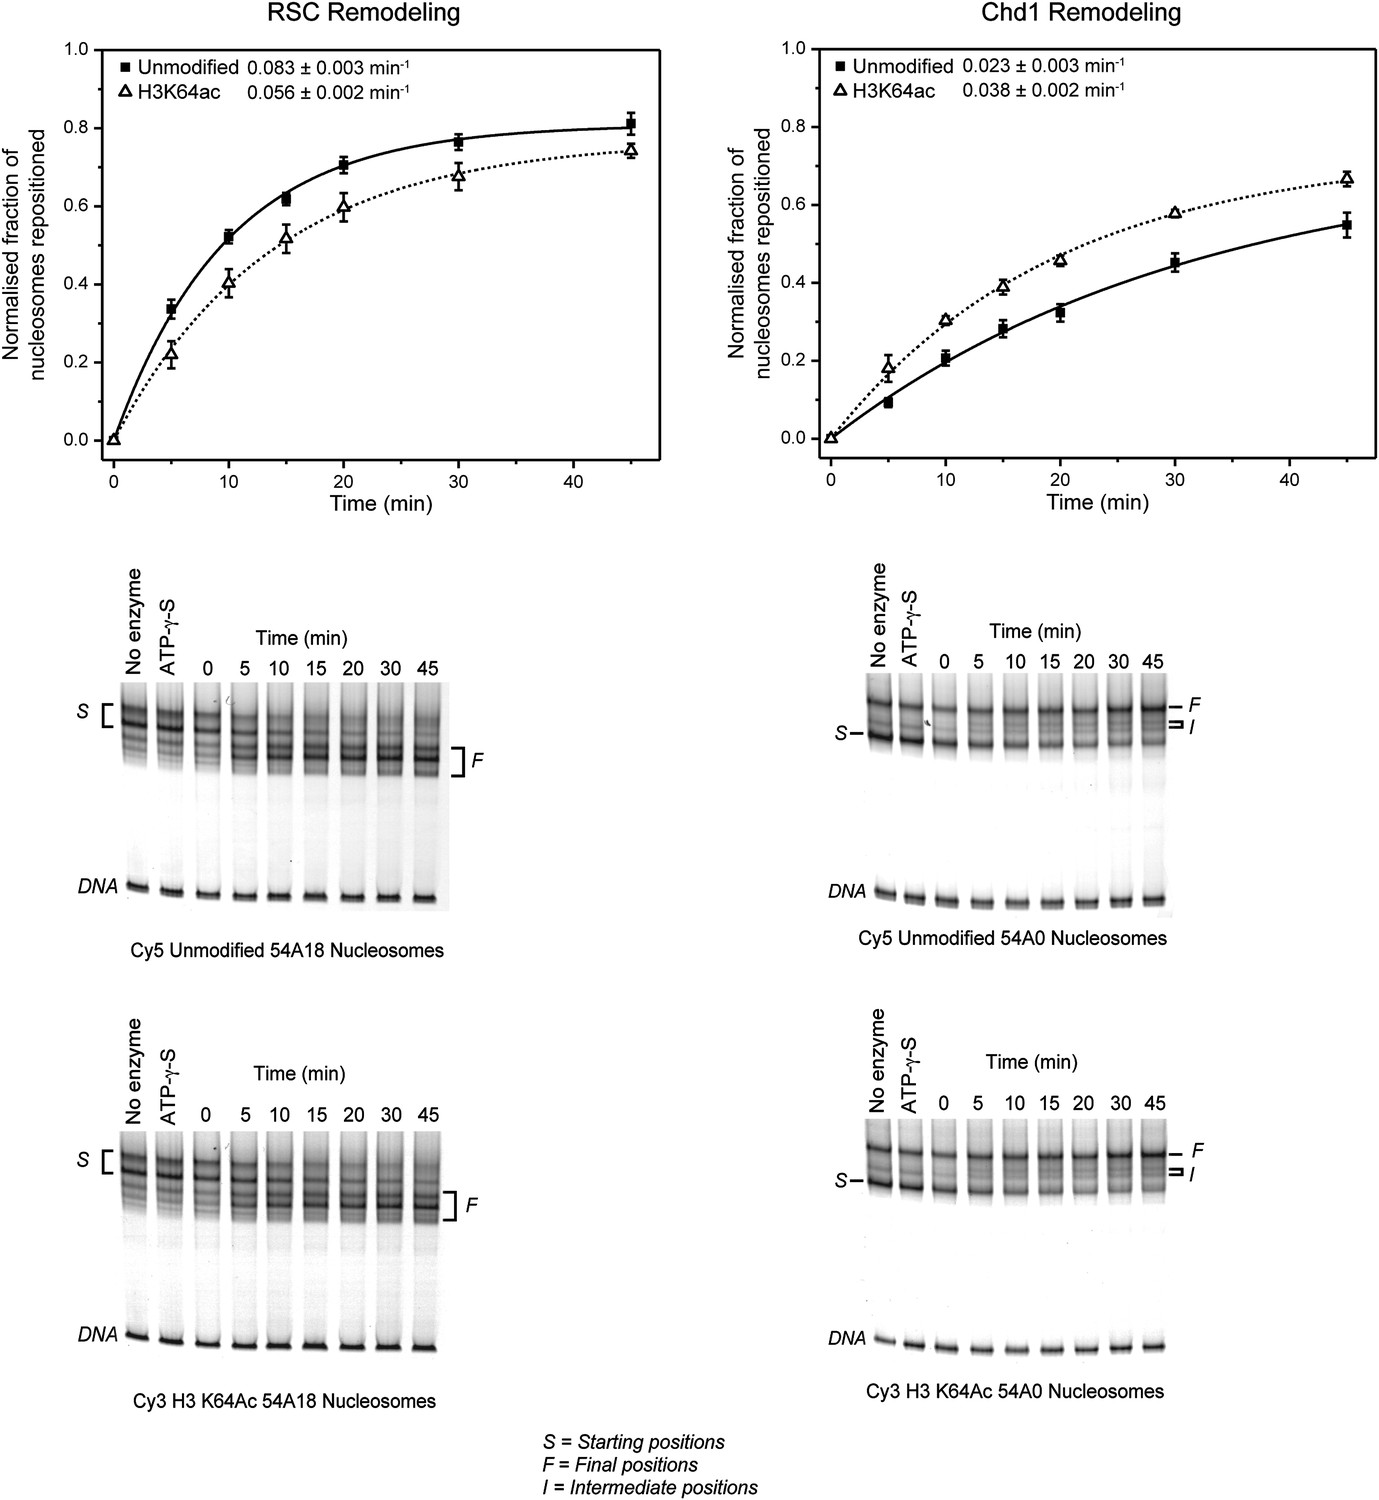
Effect of H3K64ac on repositioning by RSC and Chd1.
RSC or Chd1 were incubated with a mixture containing equal amounts of differentially fluorescent-labeled nucleosomes: unmodified (Cy5), H3K64ac (Cy3). Bottom panels show representative native PAGEs used to calculate the relative rates of remodeling by RSC and Chd1. Top panels show the relative rates of remodeling determined by fitting the data with a single exponential function (solid line for unmodified, dashed line for H3K64ac). The rates of nucleosome positioning (±s.e.) calculated from three independent remodeling reactions are shown.
Figure 5—figure supplement 3
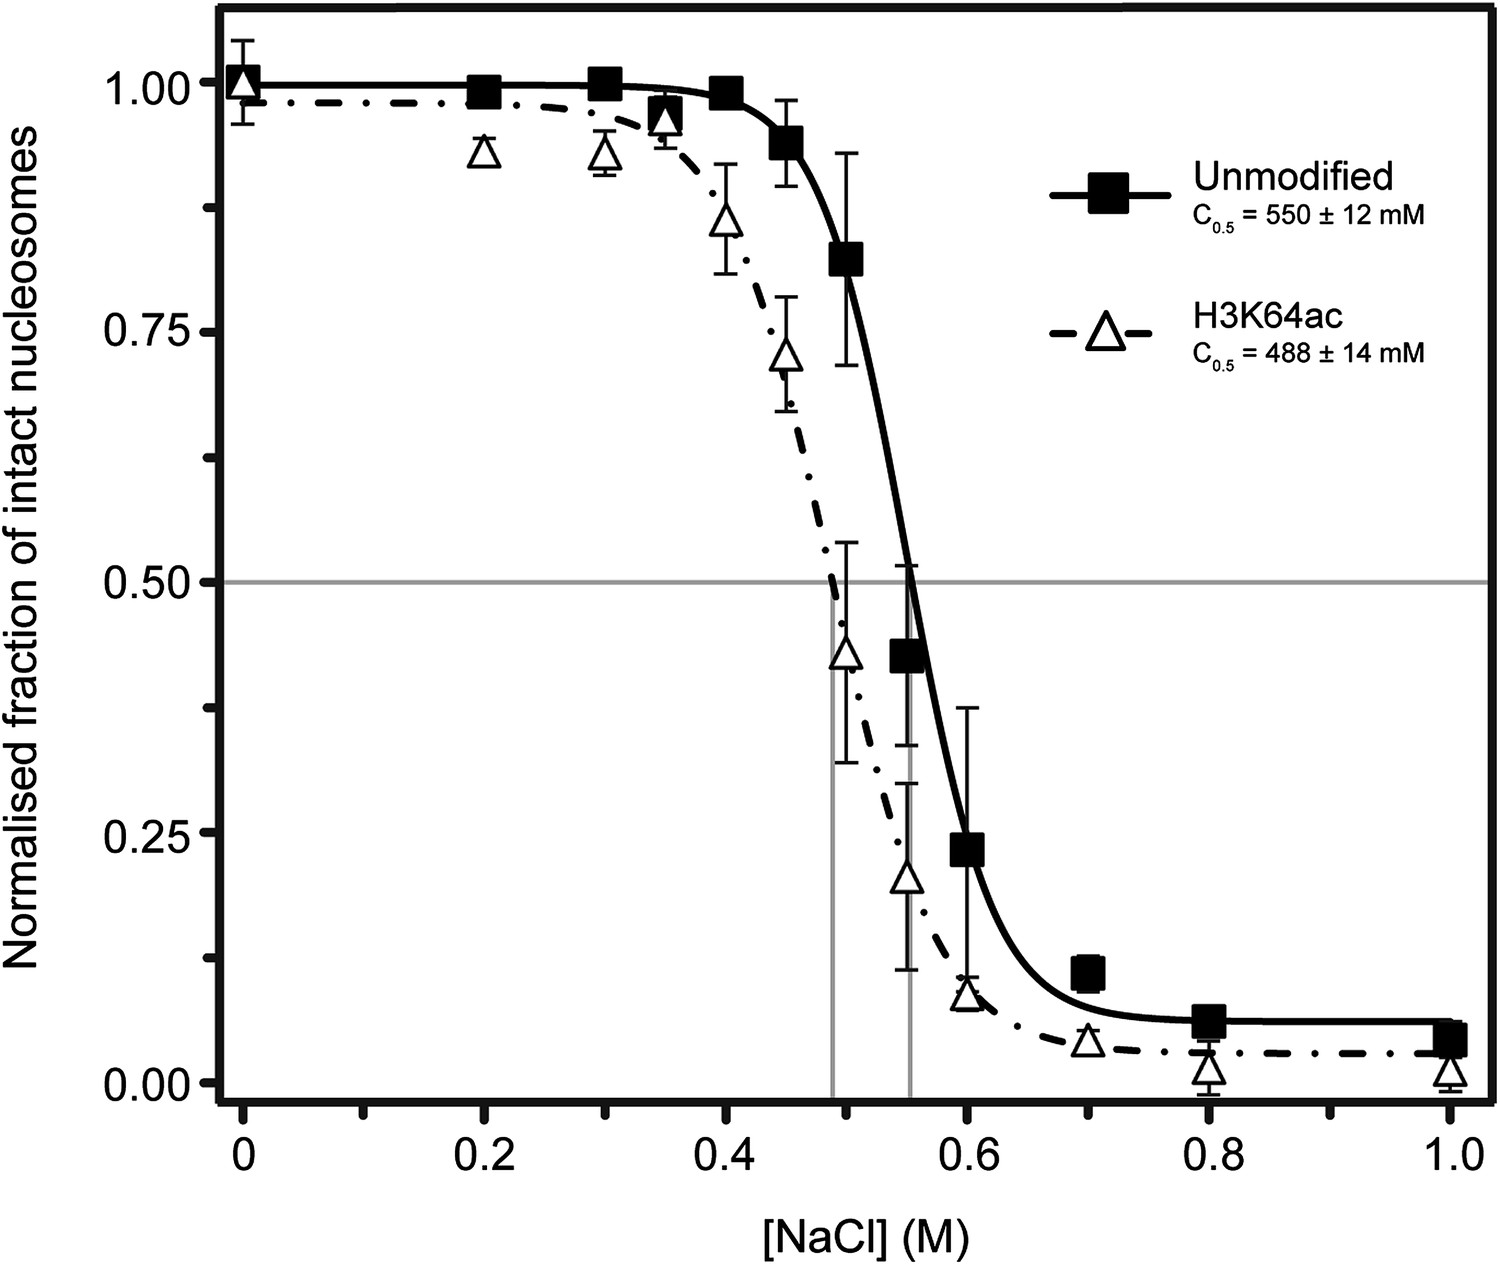
Single-molecule analysis of unmodified and H3K64ac salt-dependent nucleosome stability.
The fraction of intact nucleosomes at each salt concentration was normalized to the fraction at 0 mM NaCl. Every data point is the average (±SD) of at least three measurements. The data were fit with a sigmoidal function to determine the NaCl concentrations at which the FRET signal is 0.5 (C0.5, see Supplemental methods).
Figure 5—figure supplement 4
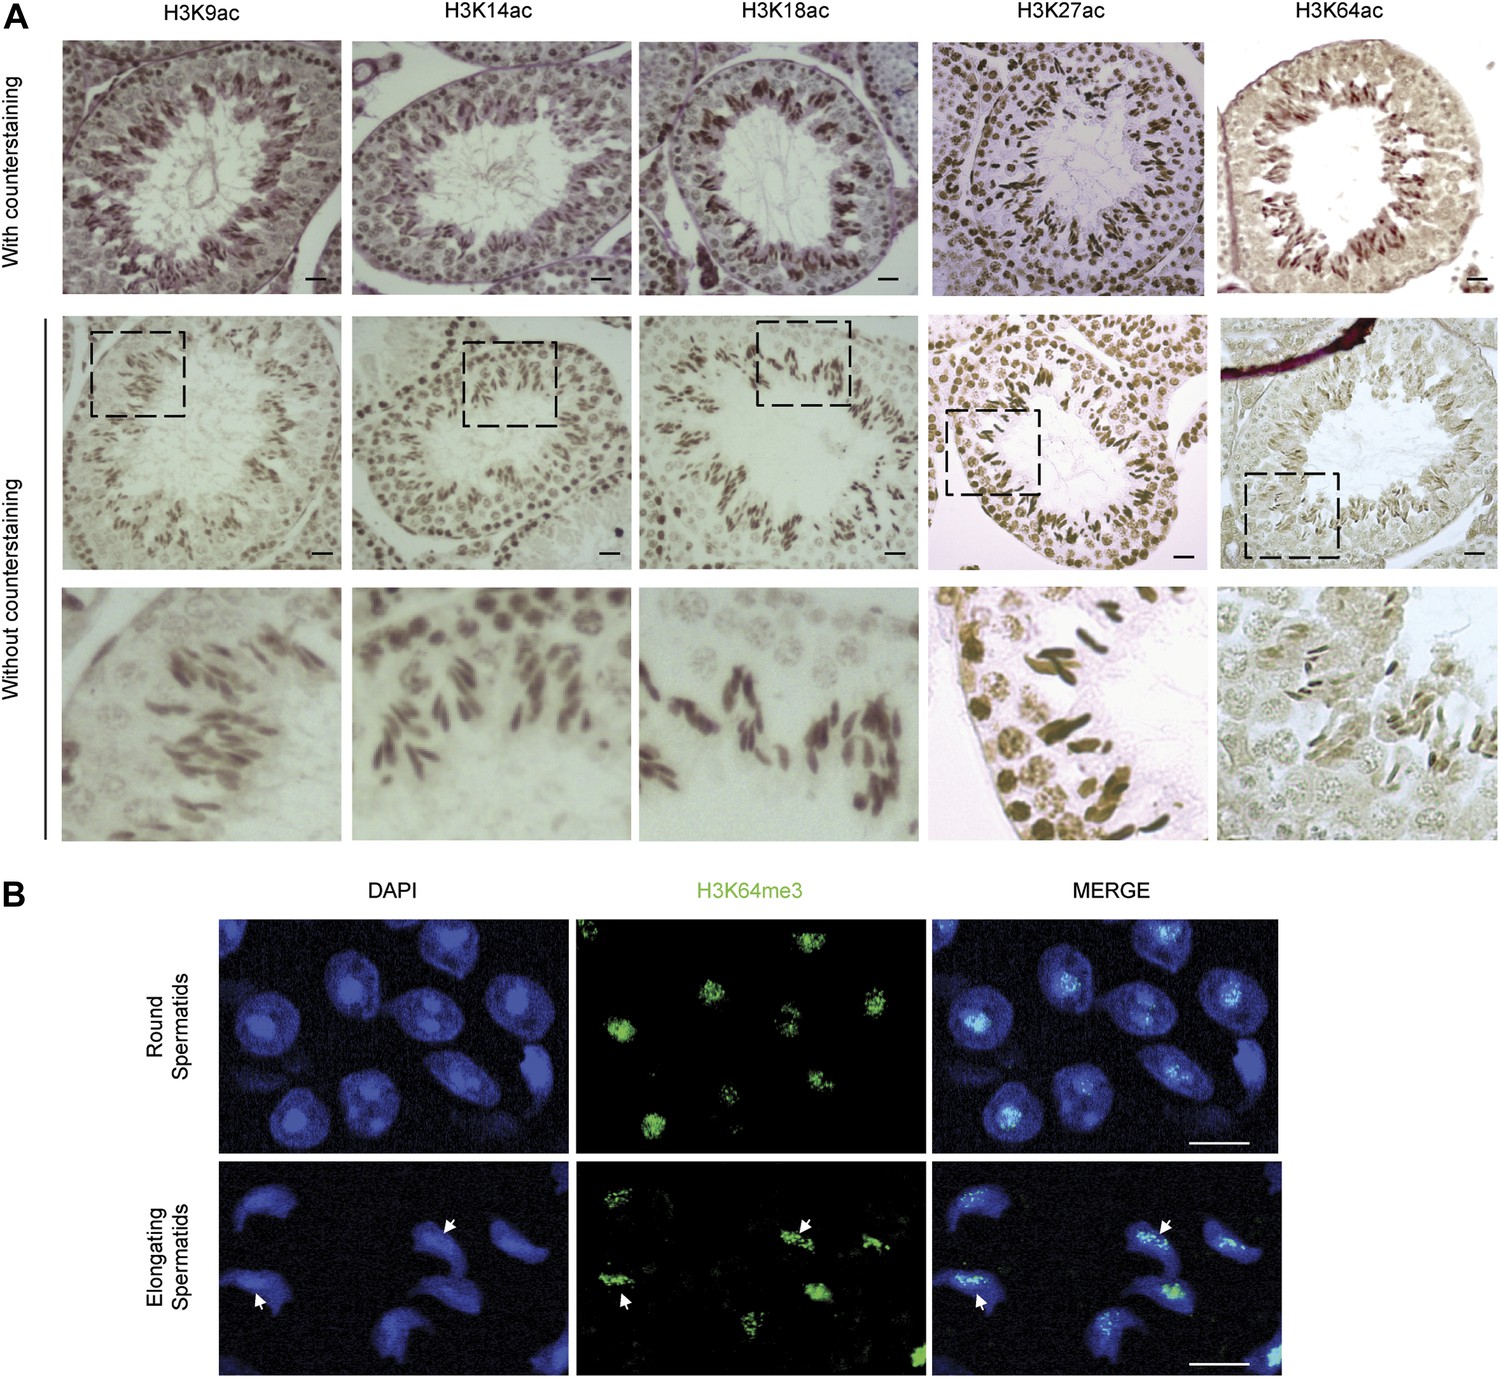
H3 acetylation and H3K64me3 stainings in spermatogenesis.
(A) Immunohistochemistry (IHC) stainings on sections of mouse testis tubules for different acetylation sites on H3. Note that modification shows distinct patterns of enrichment across the differentiation stages of spermatocytes. Top panels show the specific antibody staining (brown) together with the counterstaining (eosin, red). In the middle planels, only the staining from each specific antibody (brown) is shown. The area in the dashed-line box is magnified 3X in the bottom panel. Scale bar, 20 μm. (B) Immunofluorescence on sections of mouse testis tubules. H3K64me3 signal is strongly detected in the chromocenter of round spermatids as well as in elongating spermatids, in particular at regions where histone replacement occurs late (arrows), scale bar, 5 µm.
Figure 5—figure supplement 5
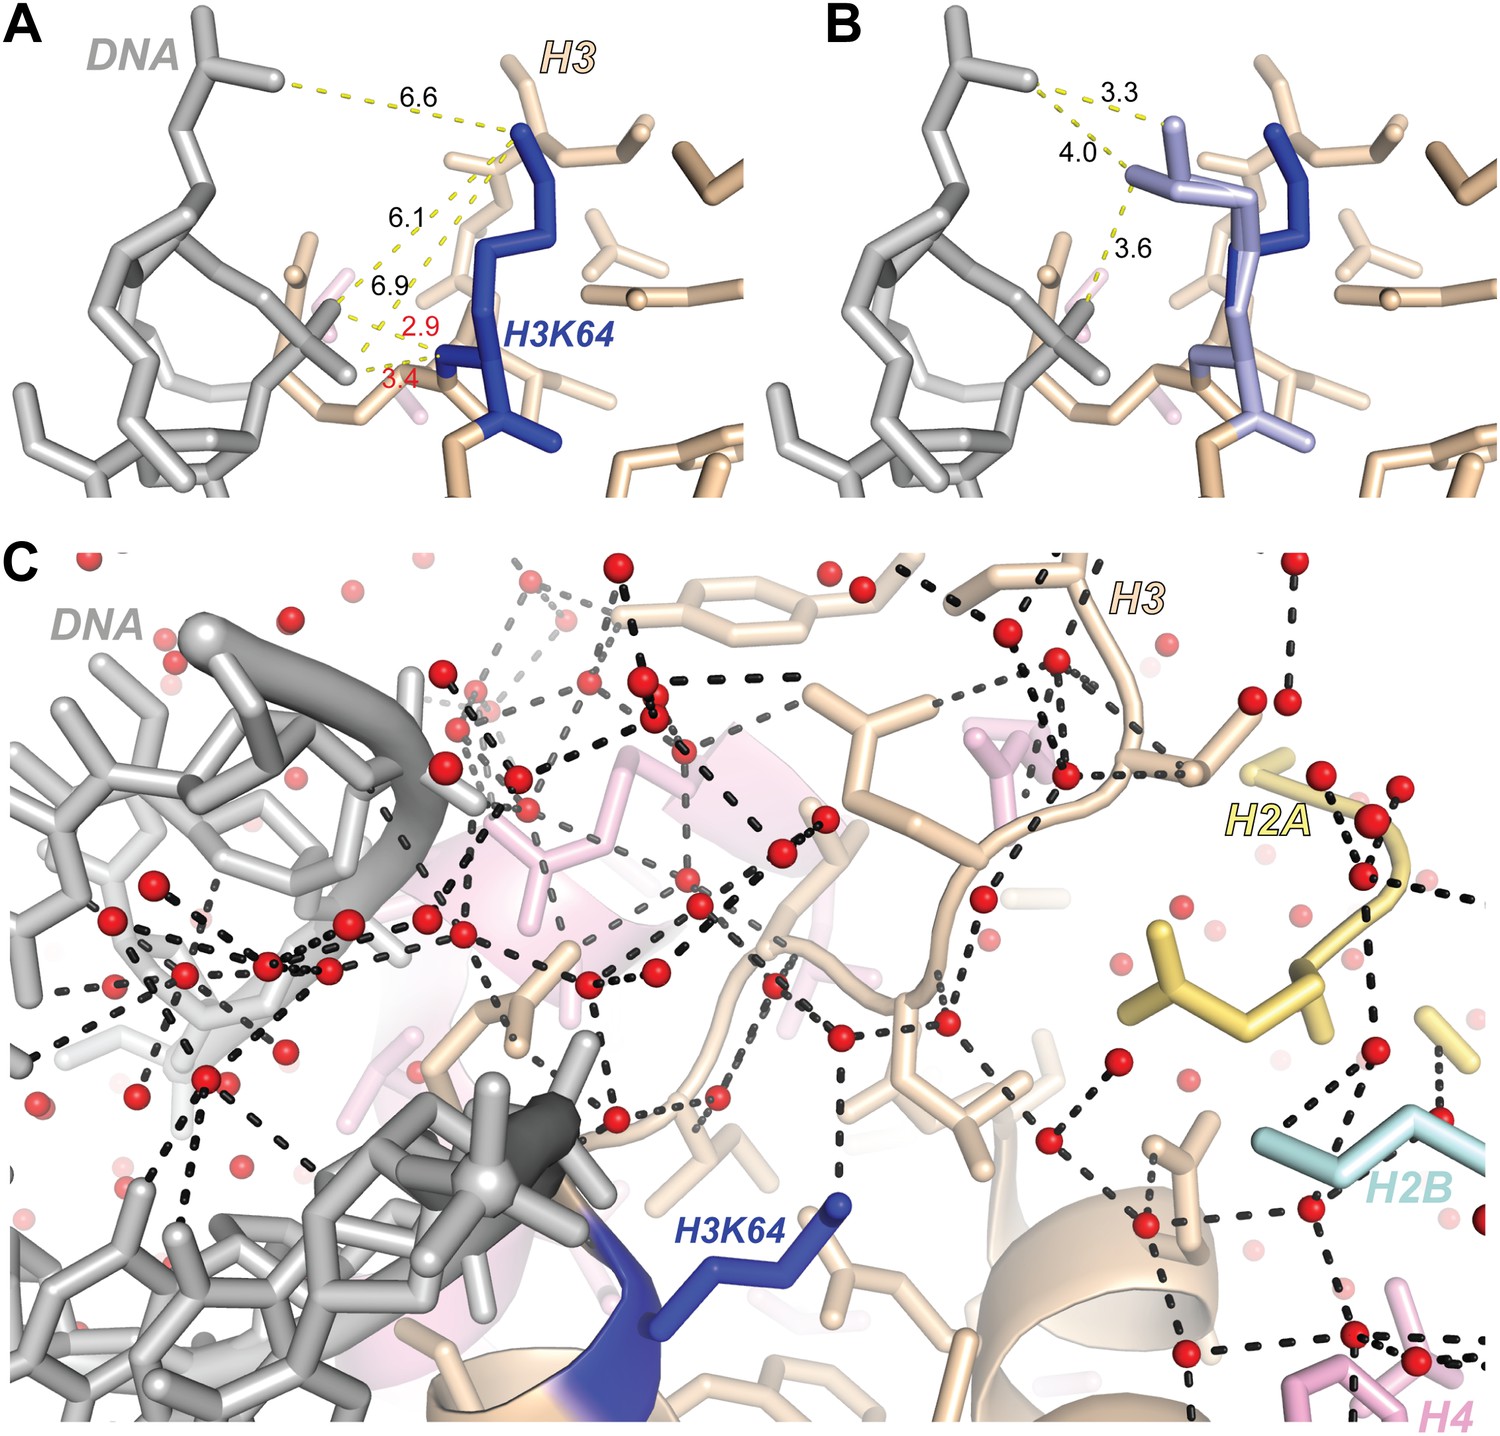
Structural analysis of H3K64 interactions.
(A) Distances in Å between DNA backbone phosphate oxygen atoms and H3K64 main-chain amide (red text) or terminal nitrogen atoms (black text) in the high-resolution (1.9 Å) crystal structure of the nucleosome (PDB ID 1KX5). The H3K64 main-chain amide directly interacts with the DNA phosphate backbone, this places the H3K64 side-chain within a range to form direct interactions with the DNA. The measured distances are shown as yellow-dashed lines. (B) Two alternate side-chain rotamer conformations of H3K64 (light blue) are shown that demonstrate that the H3K64 side-chain has the potential to form direct ionic interactions with the DNA phosphate backbone. (C) The side-chain of H3K64 is part of an extensive water-mediated hydrogen bonding network between histones and DNA in the high-resolution crystal structure of the nucleosome (PDB ID 1KX5). Water atoms are shown as red spheres and hydrogen bonds as dashed black lines. Each of the displayed hydrogen bonds can be traced back to the water molecule bound to H3K64.
Figure 6 with 3 supplements
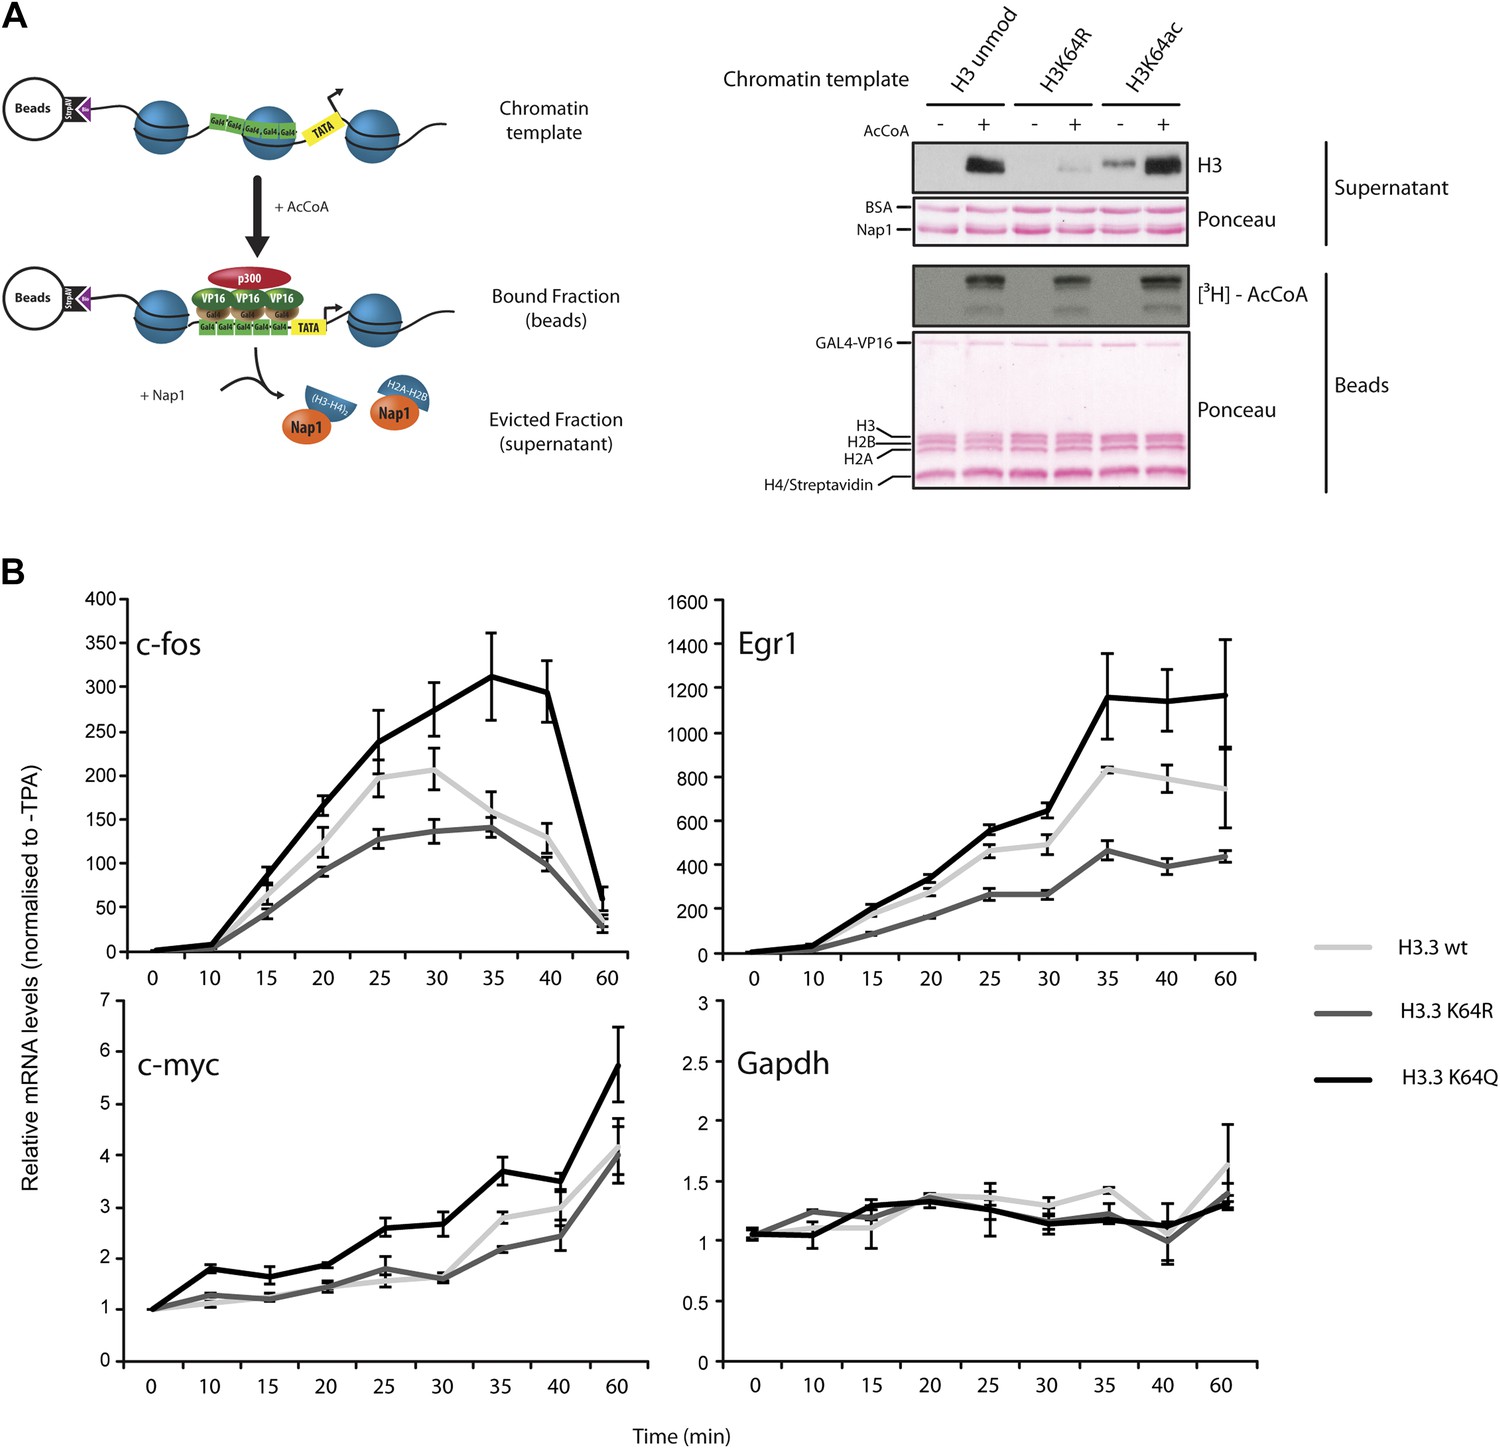
H3K64ac can promote histone eviction and facilitate transcription.
(A) H3K64ac promotes histone eviction. Schematic of eviction assay (left) shows chromatin templates assembled on a biotin-labeled pG5-MLP promoter fragment. Recruitment of transcriptional activators and p300 causes displacement of histone octamers, and histones can be trapped onto a supercoiled plasmid (not shown) by Nap1. Immunoblot of the evicted fraction (right, supernatant) with anti-H3 antibody shows the total amount of H3 released from unmodified H3, H3K64R, or H3K64ac chromatin templates in the presence or absence of acetyl-CoA. Ponceau staining as loading control and autoradiography (3H-acetyl-CoA incorporation) on the immobilized fraction as control for p300 activity are shown. (B) The acetylation mimic H3K64Q promotes transcription of early-response genes. NIH3T3 cells overexpressing either wild type, K64R, or K64Q FlagHA-H3.3 were stimulated with 25 nM TPA for the indicated times. mRNA levels of the indicated genes were analysed by qPCR. Gapdh is shown as control gene. Average of three experiments (±s.e.) are shown.
Figure 6—figure supplement 1
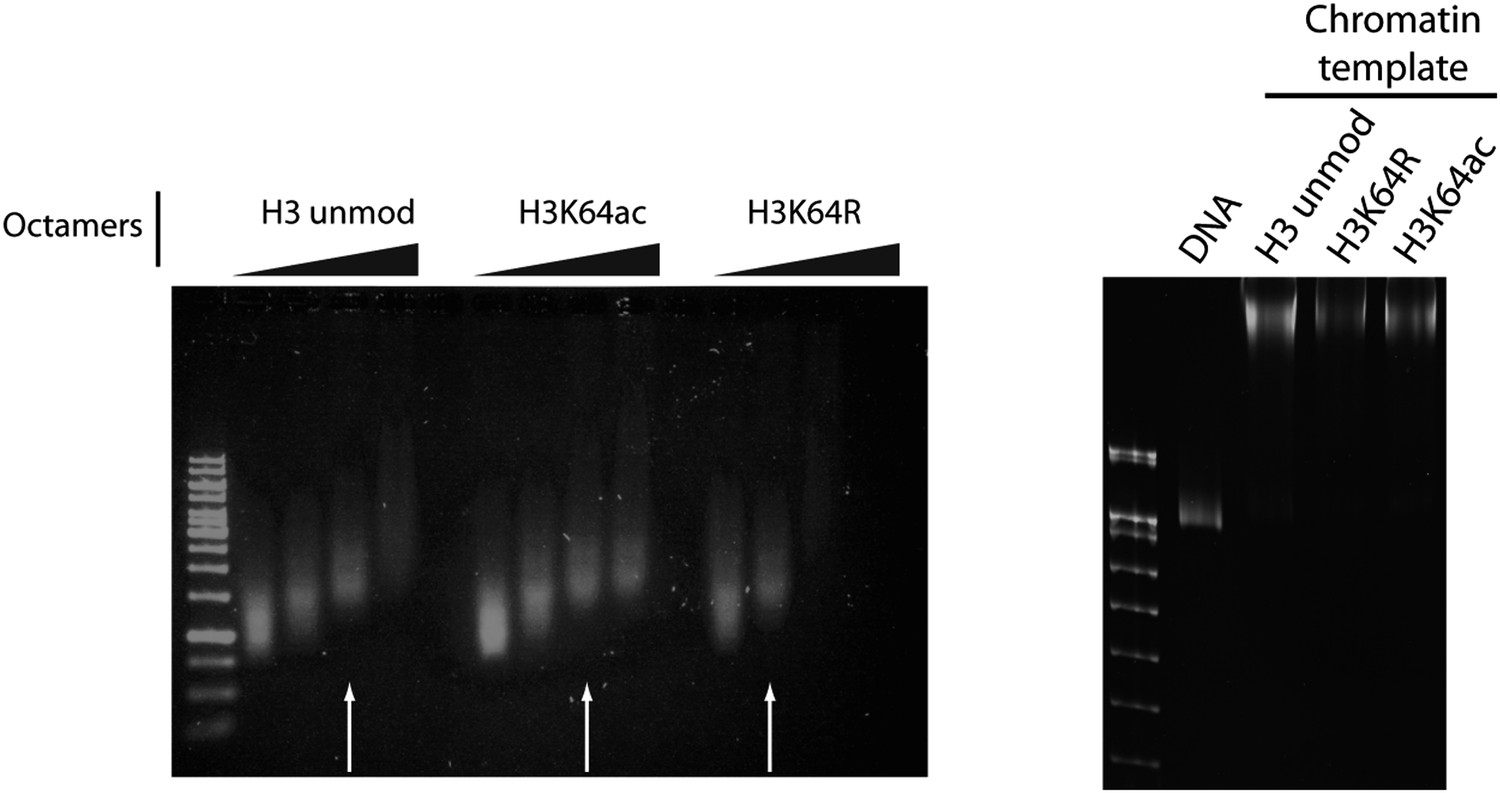
Validation of the chromatin templates used in the in vitro assay.
Representative gels for chromatin assembly onto pG5-MLP promoter DNA fragment (≈ 680 bp). Ethidium bromide staining of a 0.8% agarose gel (left) showing chromatin reconstitution efficiency at different octamer:DNA ratios. Comparable chromatin templates were selected and used in the assays (arrows). Ethidium bromide staining of native 5% polyacrylamide gel (right) shows that comparable chromatin templates were used in the assays.
Figure 6—figure supplement 2
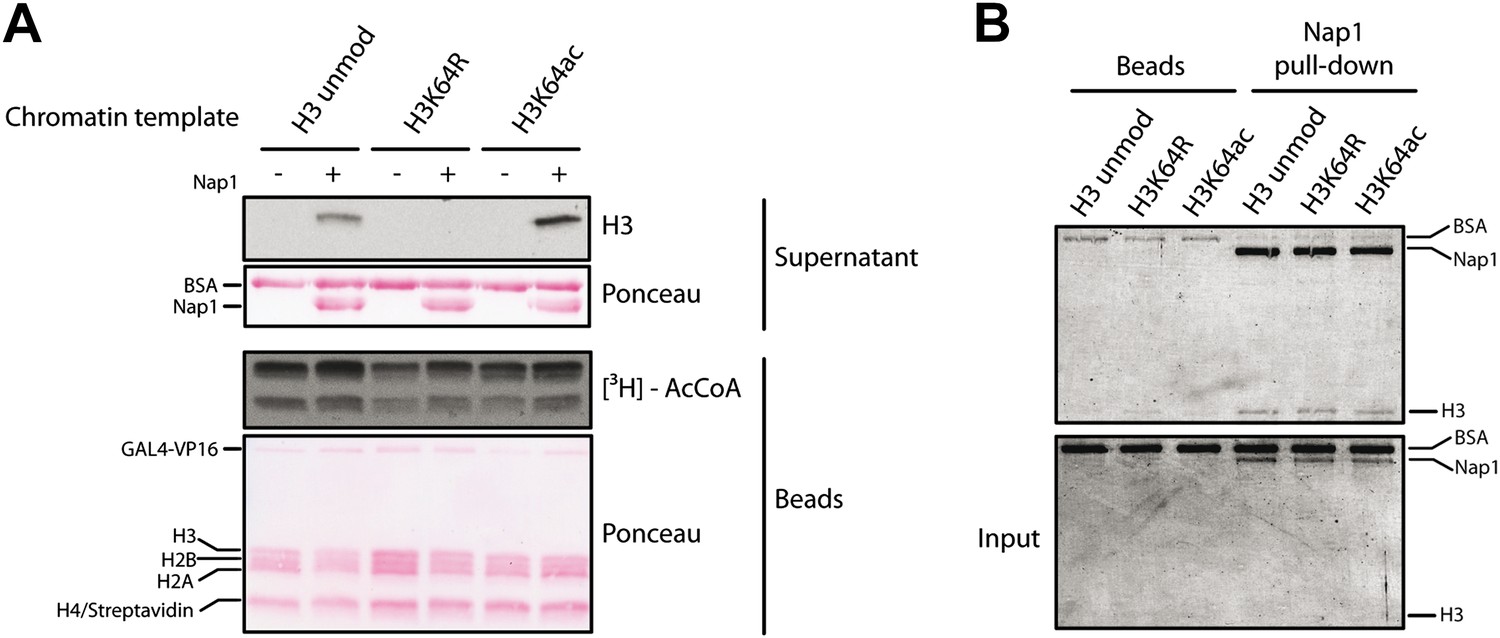
Control experiments for the eviction assay involving the role of Nap1.
(A) Eviction assay performed as described in the Figure 6A, but comparing the effect of Nap1 (+/− Nap1). Anti-H3 immunoblot of the supernatant fraction shows that the presence of Nap1 is essential for this assay. Ponceau staining as loading control and autoradiography (3H-acetyl-CoA incorporation) on the immobilized fraction as control for p300 activity are shown. (B) Coomassie staining of the Nap1 pull-down of each H3 species showing that Nap1 binds equally unmodified, K64R, or K64ac H3s. Top gel shows the pull-down material from Ni2+ beads with or without Nap1; bottom gel shows the input before the pull-down, as control.
Figure 6—figure supplement 3

Controls for H3.3 expression and gene induction.
(A) Anti-HA immunoblot (top) shows that the generated NIH3T3 stable cell lines express each of the exogenous FlagHA-H3.3 types (wt, K64R, or K64Q). Untransfected control is used for signal specificity; ponceau staining is used for loading control; asterisk indicates the molecular size of the FlagHA-H3.3 shifted upwards compared to endogenous H3. (B) Expression of the negative control gene Hsp70 upon TPA induction. Hsp70 is inducible only by heat shock and its expression does not significantly vary among each stable cell line upon TPA stimulation.
Figure 7
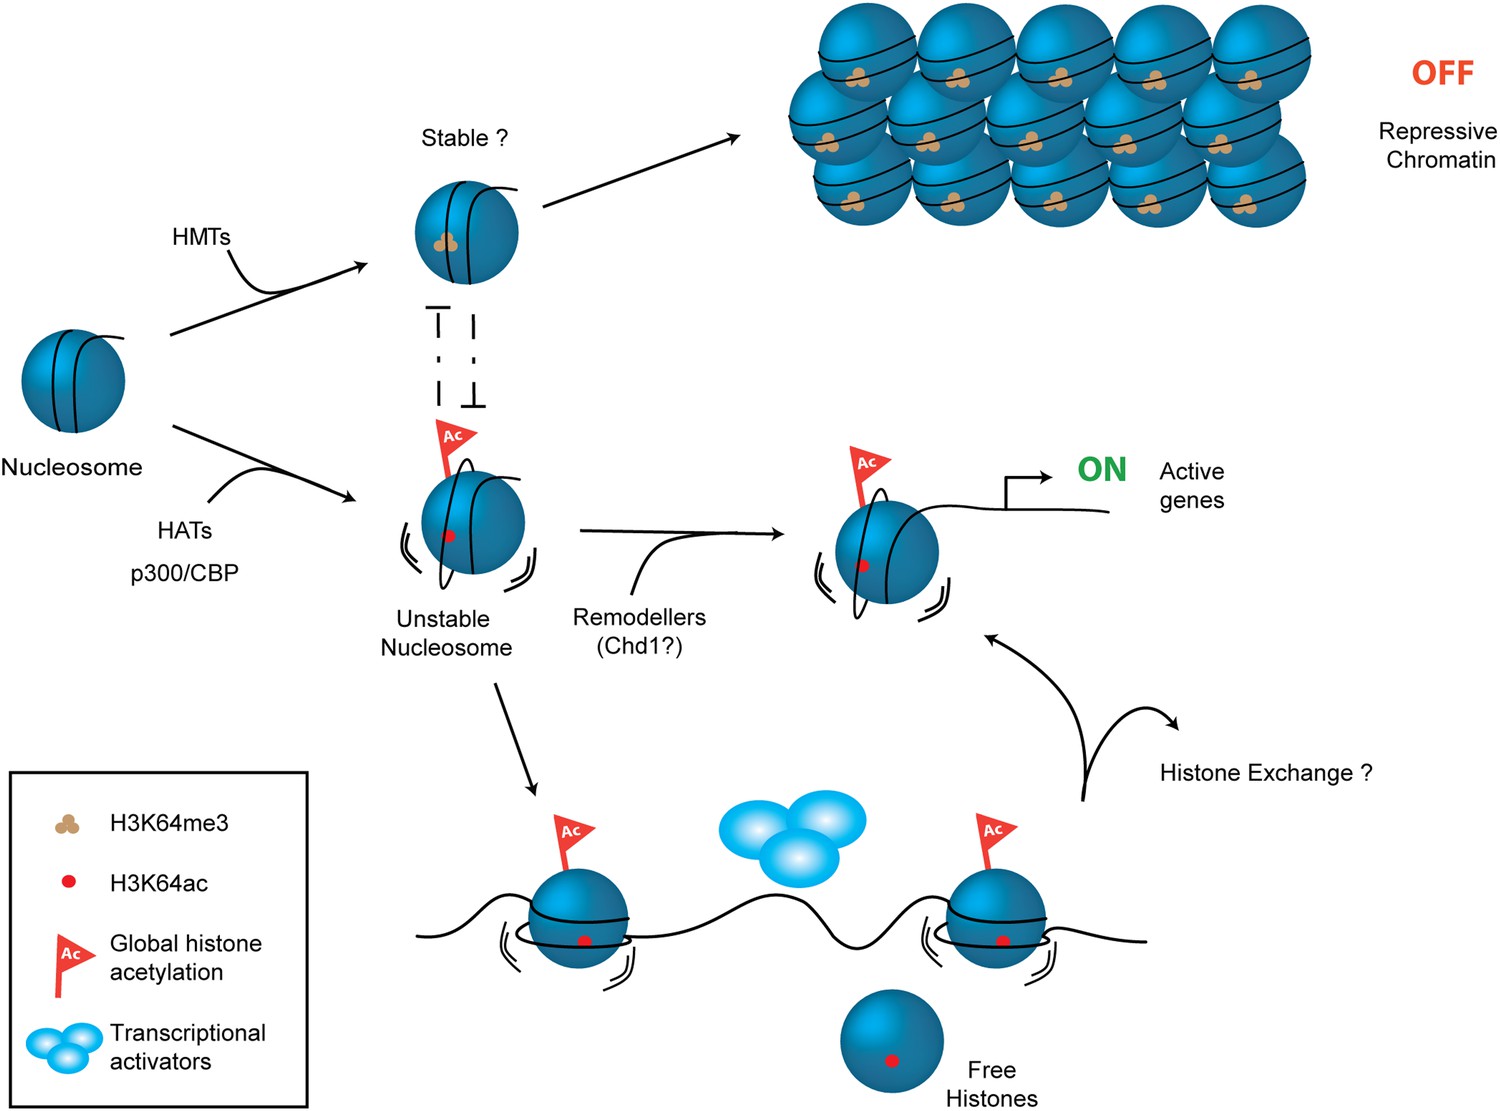
Schematic model for H3K64ac function.
H3K64ac (bottom) helps to create an open, permissive chromatin environment. In contrast to this H3K64me3 could lock the nucleosomes in a stable, repressive conformation (top), resulting in an inactive chromatin environment. H3K64ac can directly act by affecting nucleosome dynamics, but also indirectly by blocking methylation of the same residue.
Additional files
-
Supplementary file 1
Oligonucleotides used in this study.
- https://doi.org/10.7554/eLife.01632.026
Download links
A two-part list of links to download the article, or parts of the article, in various formats.
Downloads (link to download the article as PDF)
Open citations (links to open the citations from this article in various online reference manager services)
Cite this article (links to download the citations from this article in formats compatible with various reference manager tools)
Acetylation of histone H3 at lysine 64 regulates nucleosome dynamics and facilitates transcription
eLife 3:e01632.
https://doi.org/10.7554/eLife.01632


