Regulation of branching dynamics by axon-intrinsic asymmetries in Tyrosine Kinase Receptor signaling
- Vlaams Instituut voor Biotechnologie, Belgium
- University of Leuven School of Medicine, Belgium
- Doctoral School for Biomedical Sciences, University of Leuven Group Biomedicine, Belgium
- University of Texas Southwestern Medical Center, United States
- Howard Hughes Medical Institute, United States
- Vlaams Instituut voor Biotechnologie (VIB), Belgium
- Institute of Translational Medicine, University of Liverpool, United Kingdom
Figures
Figure 1
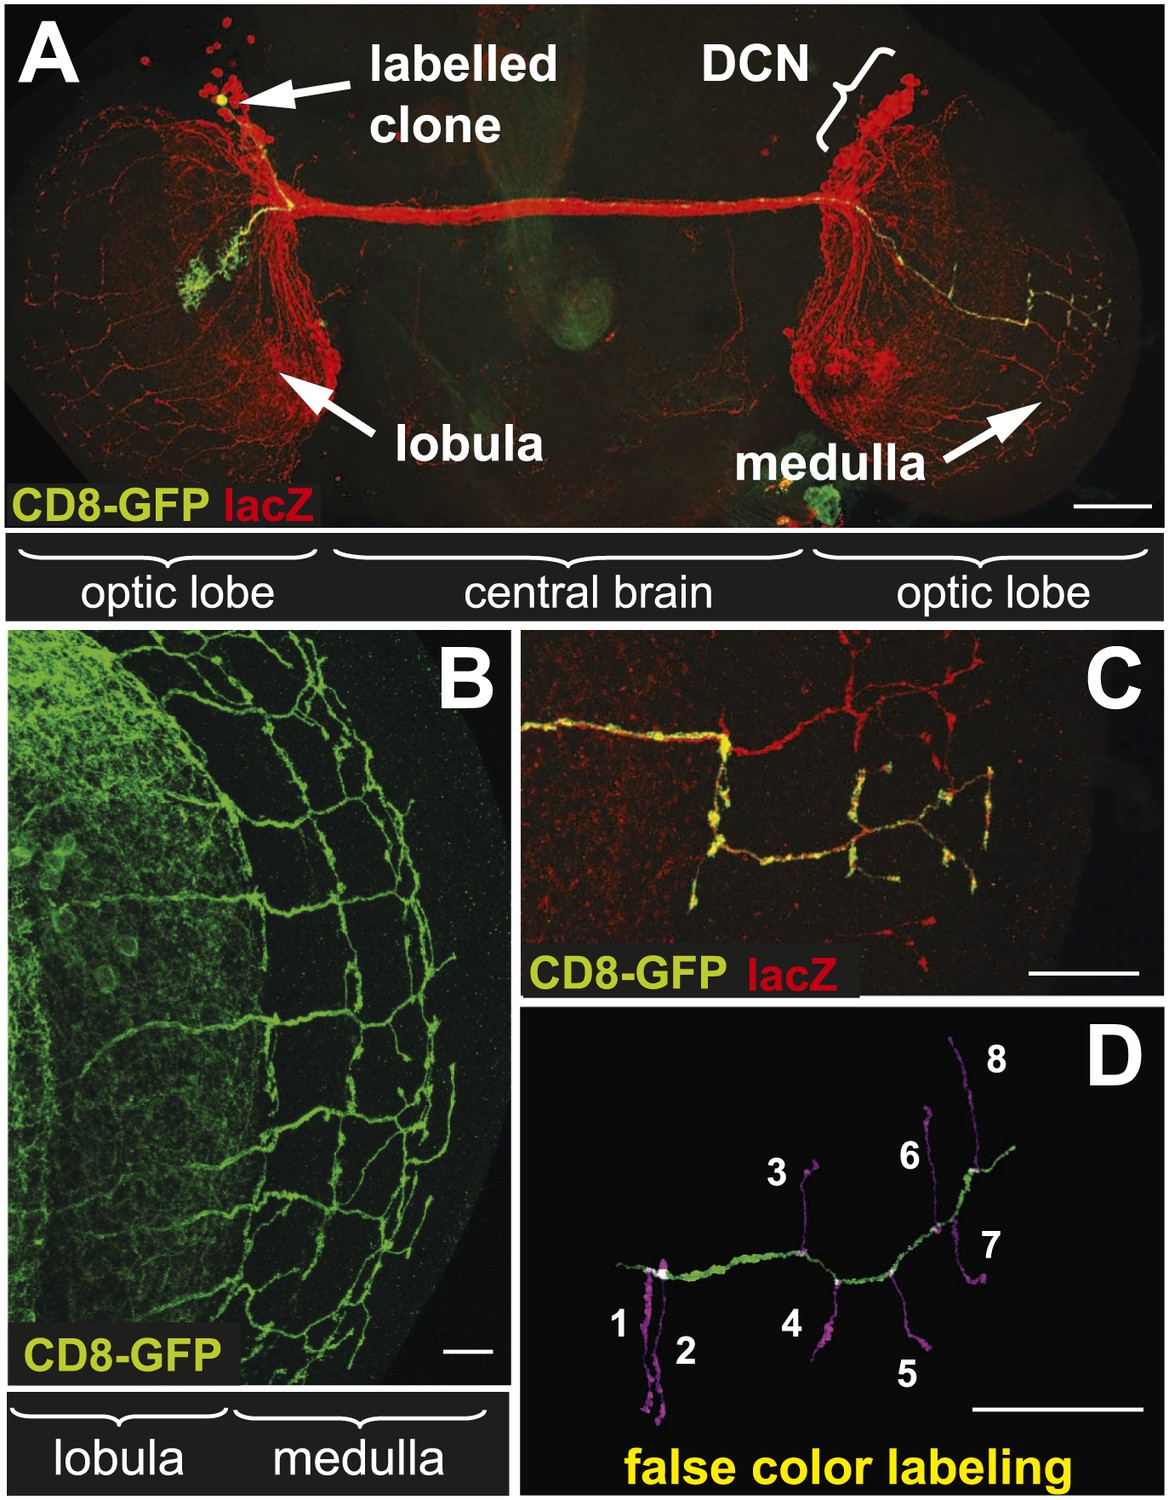
The axonal network of medulla dorsal cluster neurons (DCNs) in the adult central nervous system of Drosophila.
(A) Dorsal cluster neurons, labeled with lacZ (red) using the atoGal4-14a driver, with its dendritic and axonal projections in the optic lobes of the CNS. Using the FLP-out system, an individual neuron is labeled with mCD8-GFP (green) within the background of the entire cluster. AtoGal4-14a is used in all the following experiments except when stated otherwise. (B) DCN axons, labeled with mCD8-GFP, form a stereotypic pattern of axonal branches within the medulla (Me) of the adult optic lobe. (C) Using the FLP-out system the axon and branches of an individual neuron are labeled with mCD8-GFP (green) within the background of the entire cluster labeled with lacZ (red). (D) False color labeling of one Me DCN axon with its main shaft (green) and branches (magenta) using a tracer tool. The scale bars represent 100 µm in (A) and 20 µm in (B–D).
Figure 2 with 3 supplements
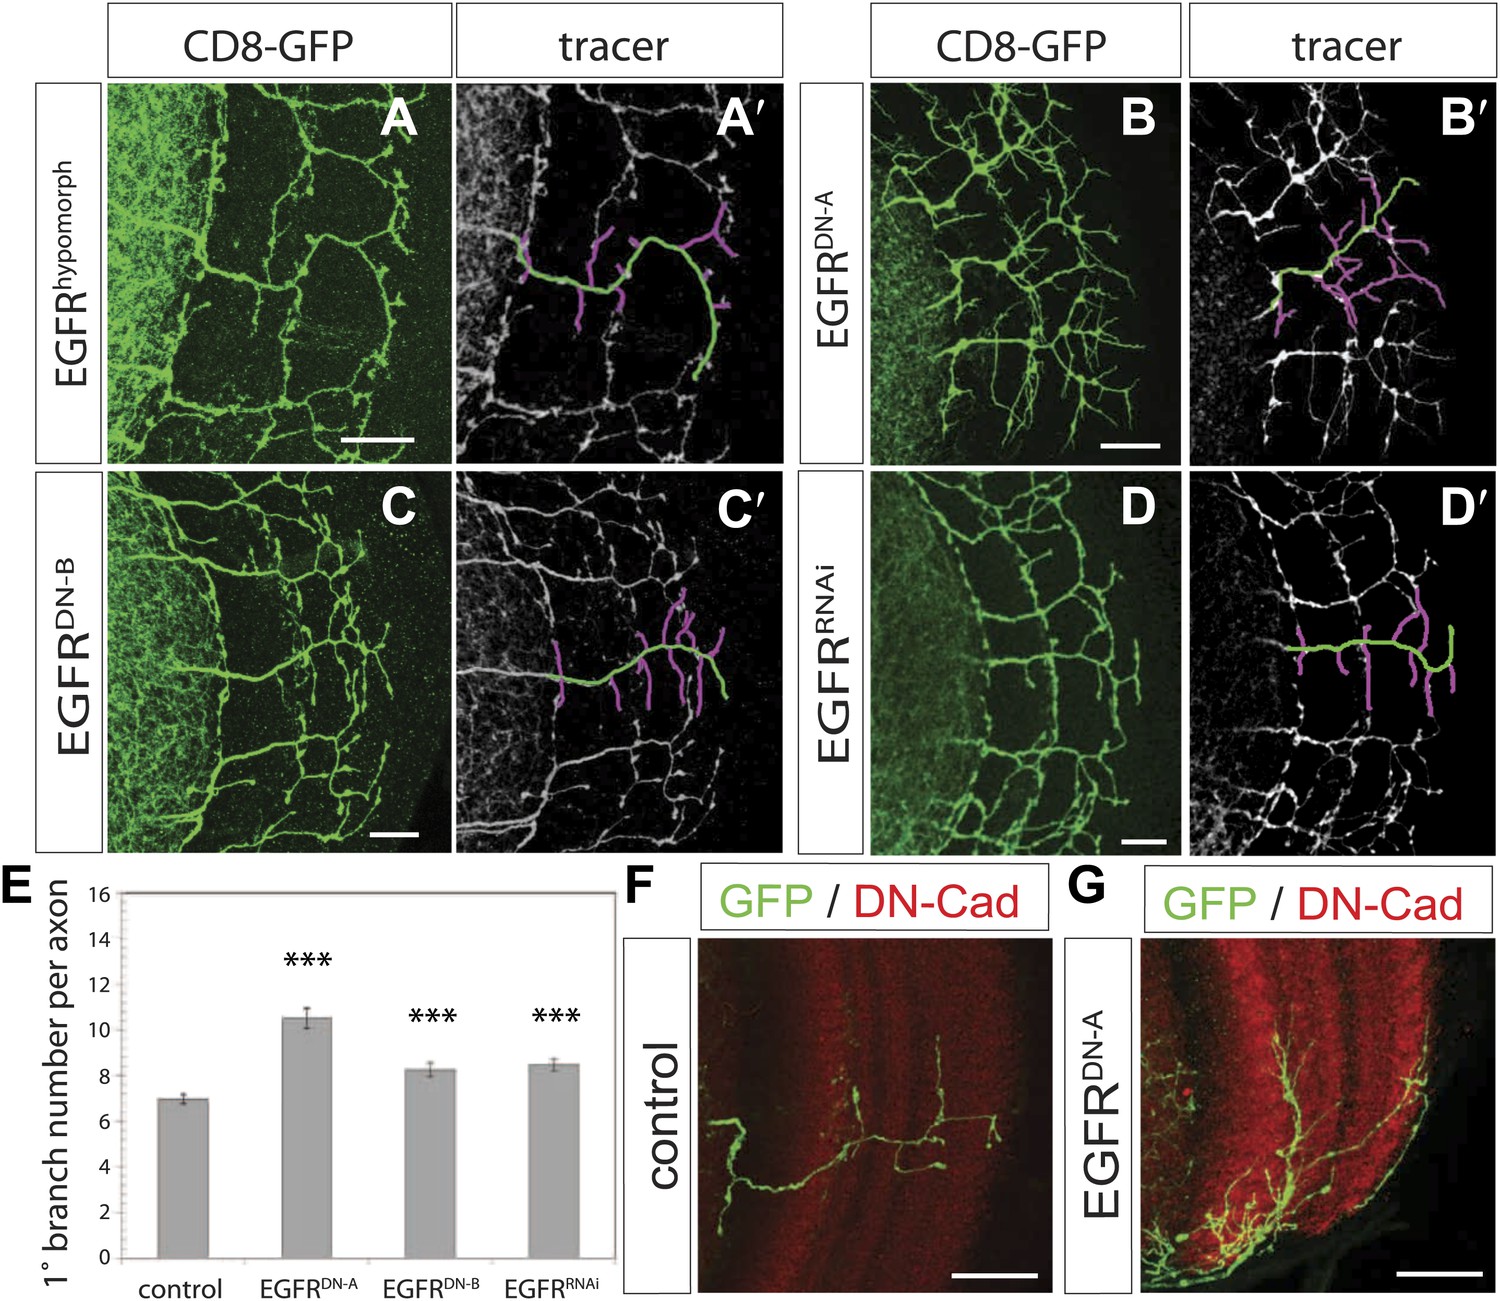
EGF-receptor downregulation in the DCNs results in excessive axonal branches in the adult.
(A) The homozygous hypomorphic allele EGFRT1 shows additional, short branches. (B–D) Downregulation of the EGFR specifically in the DCNs results in an increase of adult branches via overexpression of (B) a dominant-negative form A (UAS-EGFRDN-A), (C) a dominant-negative form B (UAS-EGFRDN-B) and (D) a RNAi against EGFR (UAS-EGFRRNAi). (A′–D′) Visualization of branches (purple) along a single main axon shaft (green) using the tracing tool reveals excessive branches of the aforementioned genotypes in (A–D). (E) Quantification of adult primary branch numbers per axon for the genotypes shown in (B–D) shows significant increase of branches. Control 6.96 ± 1.34 (n = 60), EGFRDN-A 10.5 ± 2.5 (n = 45, p<0.001) EGFRDN-B 8.3 ± 1.46 (n = 40, p<0.001), EGFRRNAi 8.5 ± 1.09 (n = 40, p<0.001). (F–G) Adult Drosophila brain in which the neuropil is marked with DN-Cad (red). Flip out DCN clones are generated in control (F) and EGFRDN−A (G) background. Error bars represent SEM. Non-parametric ANOVA Kruskal–Wallis test. ***p<0.001. The scale bars represent 20 µm.
Figure 2—figure supplement 1

EGFRnull MARCM clones show early branch growth defects.
(A) Example of an adult Drosophila brain in which a single GFP-positive EGFR mutant DCN is generated using the MARCM technique. (A′) High magnification of the axonal projection of the clone in (A) in the contralateral brain half. The scale bars represent 20 µm.
Figure 2—figure supplement 2
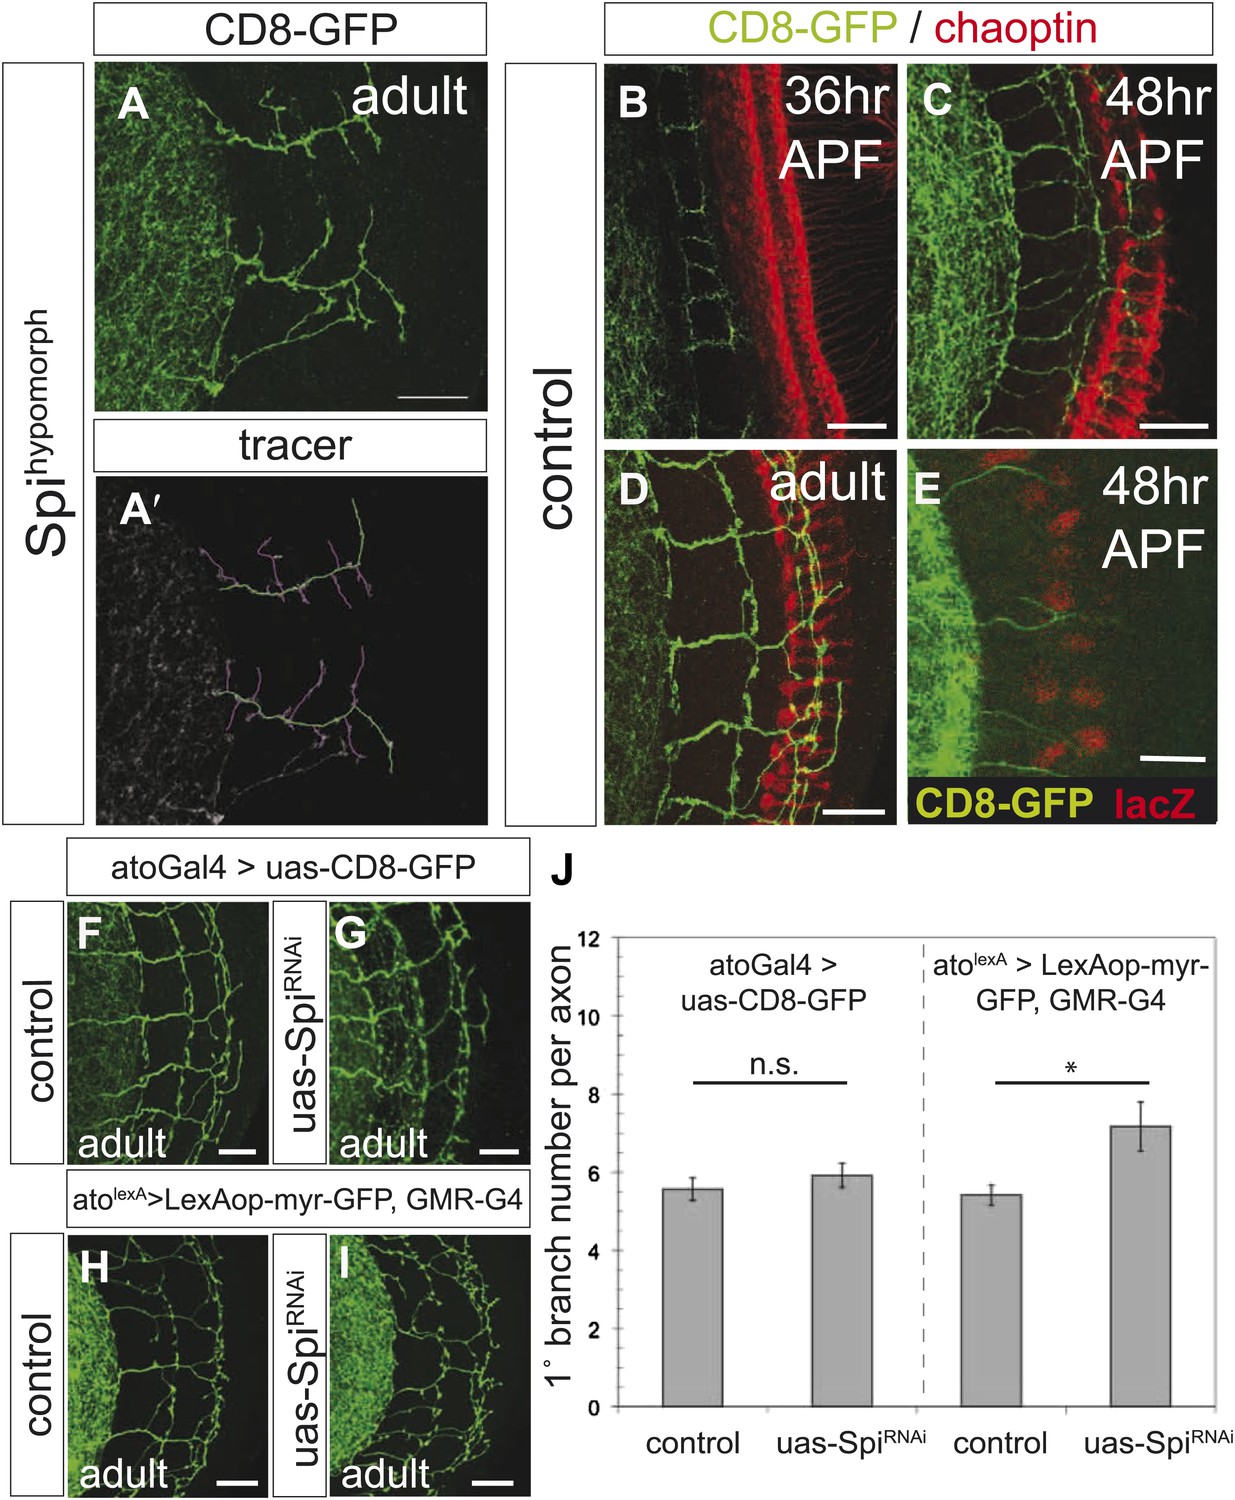
Spi release from photoreceptor axons regulates DCN axon branch pruning.
(A) The homozygous, hypomorphic allele Spiscp2 shows ectopic short branches. (A′) Visualization of branches (purple) along a single main axon shaft (green), using the tracing tool. (B–D) Co-innervation of DCN axon branches (green) and photoreceptor axons (anti-chaoptin, red) in the medulla at 36 hr APF (B), at 48 hr APF (C) and adult (D). (E) Vein-LacZ expression in unknown cells, probably glia, very close to the more proximal branches of the DCNs, suggesting that Vein may be the other ligand activating EGFR in the DCNs. (F–G) No difference in branch number was observed after downregulation of Spi using UAS-SpiRNAi in the DCNs using the ato-Gal4-14a. (H–I) Spi downregulation in photoreceptors using the GMR-Gal4 driver causes a significant increase in DCN branches whereby DCN axons are labeled with LexAop-myr-GFP driven by an IMAGO LexA knock-in into the atonal locus (atolexA). (J) Analysis of the RNAi experiment represented in (F–I). Significant increase of DCN branch numbers occurs only after photoreceptor specific Spi downregulation. Control (atoGal4-14a>UAS-CD8-GFP) 5.6 ± 1.1 (n = 12), SpiRNAi (atoGal4-14a>UAS-SpiRNAi) 5.9 ± 1.1 (n = 12), control (GMR-Gal4>UAS-CD8-GFP) 5.42 ± 0.9 (n = 12), SpiRNAi (GMR-Gal4>UAS-SpiRNAi) 7.17 ± 2.17 (n = 12). Error bars represent SEM. t test. *p<0.05. The scale bars represent 20 µm.
Figure 2—figure supplement 3
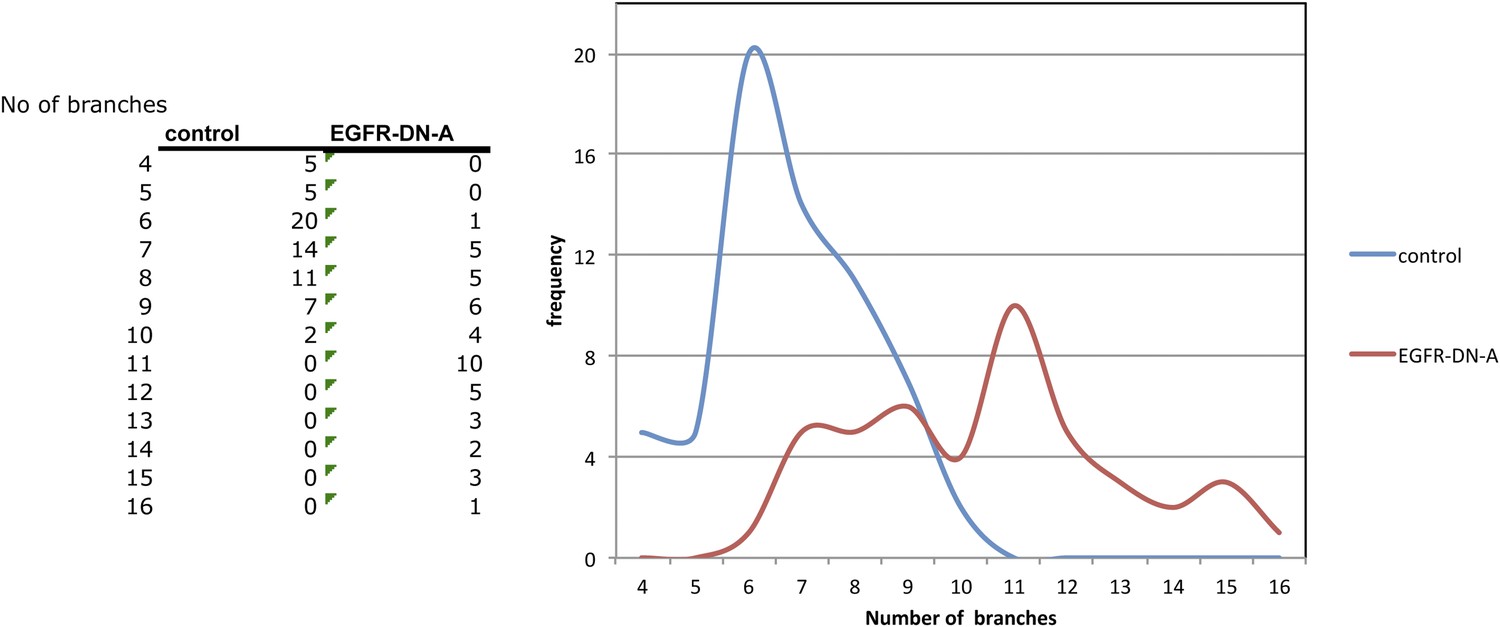
Distribution of axon branch numbers in control and EGFR-DN flies.
Inhibition of EGFR signalling in the DCNs increases both the average number and the variability of axonal branch numbers.
Figure 3 with 2 supplements
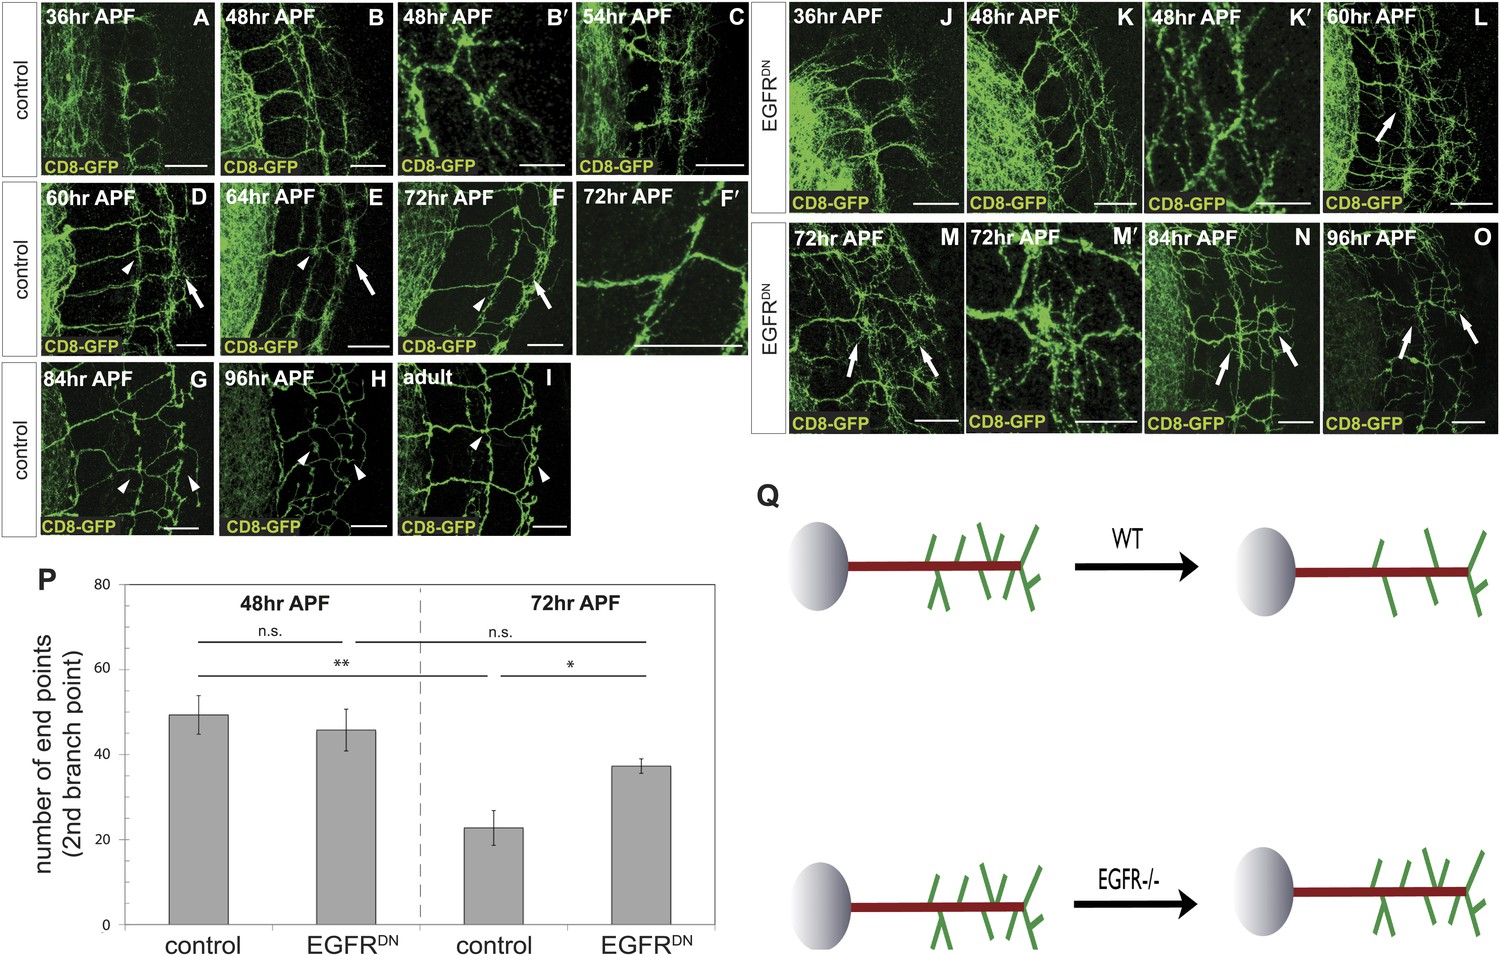
Loss of EGFR function impairs developmental axon branch pruning.
(A–I) Axonal branch pattern at different pupal stages shows excessive branching at early to mid-pupal development. Successive refinement of exuberant branches can be observed between 60 hr and 96 hr (arrowhead, compare D–H). Branch morphology at (A) 36 hr APF, (B and B′) 48 hr APF, (C) 54 hr APF, (D) 60 hr APF, (E) 64 hr APF, (F and F′) 72 hr APF, (G) 84 hr APF, (H) 96 hr APF and (I) adult stage. High magnification of branches is shown in B′ and F′. (J–O) Axonal branch pattern at different pupal stages of EGFRDN expressing DCNs shows excessive branching at early to mid-pupal time points similar to wild type. Impaired refinement of exuberant branches can be observed between 60 hr and 96 hr (arrow, compare L–O). Branch morphology at (J) 36 hr APF, (K and K′) 48 hr APF, (L) 60 hr APF, (M and M′) 72 hr APF, (N) 84 hr APF, (O) 96 hr APF. High magnification of branches is shown in K′ and M′. (P) Quantification of branches at the second branch point at 48 hr and 72 hr APF comparing control and EGFRDN using the Skeleton Analysis tool of ImageJ (‘Materials and methods’). EGFR downregulation does not result in increased branches at 48 hr APF compared to control. Significant decrease of developmental branch numbers at 72 hr APF occurs due to refinement in control. No significant decrease in branch number was observed after EGFR downregulation between 48 hr and 72 hr APF. Compared to control more branches persist after EGFR downregulation at 72 hr APF. Control (48 hr APF) 49.33 ± 9.87 (n = 18), control (72 hr APF) 22.75 ± 9.1 (n = 18, p<0.01), EGFRDN (48 hr APF) 45.77 ± 10.96 (n = 16), EGFRDN (72 hr APF) 37.3 ± 3.83 (n = 14) (to control 72 hr APF, p<0.05). Error bars represent SEM. t test. *p<0.05; **p<0.01. The scale bars represent 20 µm except in B′, K′ and M′ with 10 µm. (Q) Schematic representation of the role of EGFR signaling in DCN axonal branch formation.
Figure 3—figure supplement 1
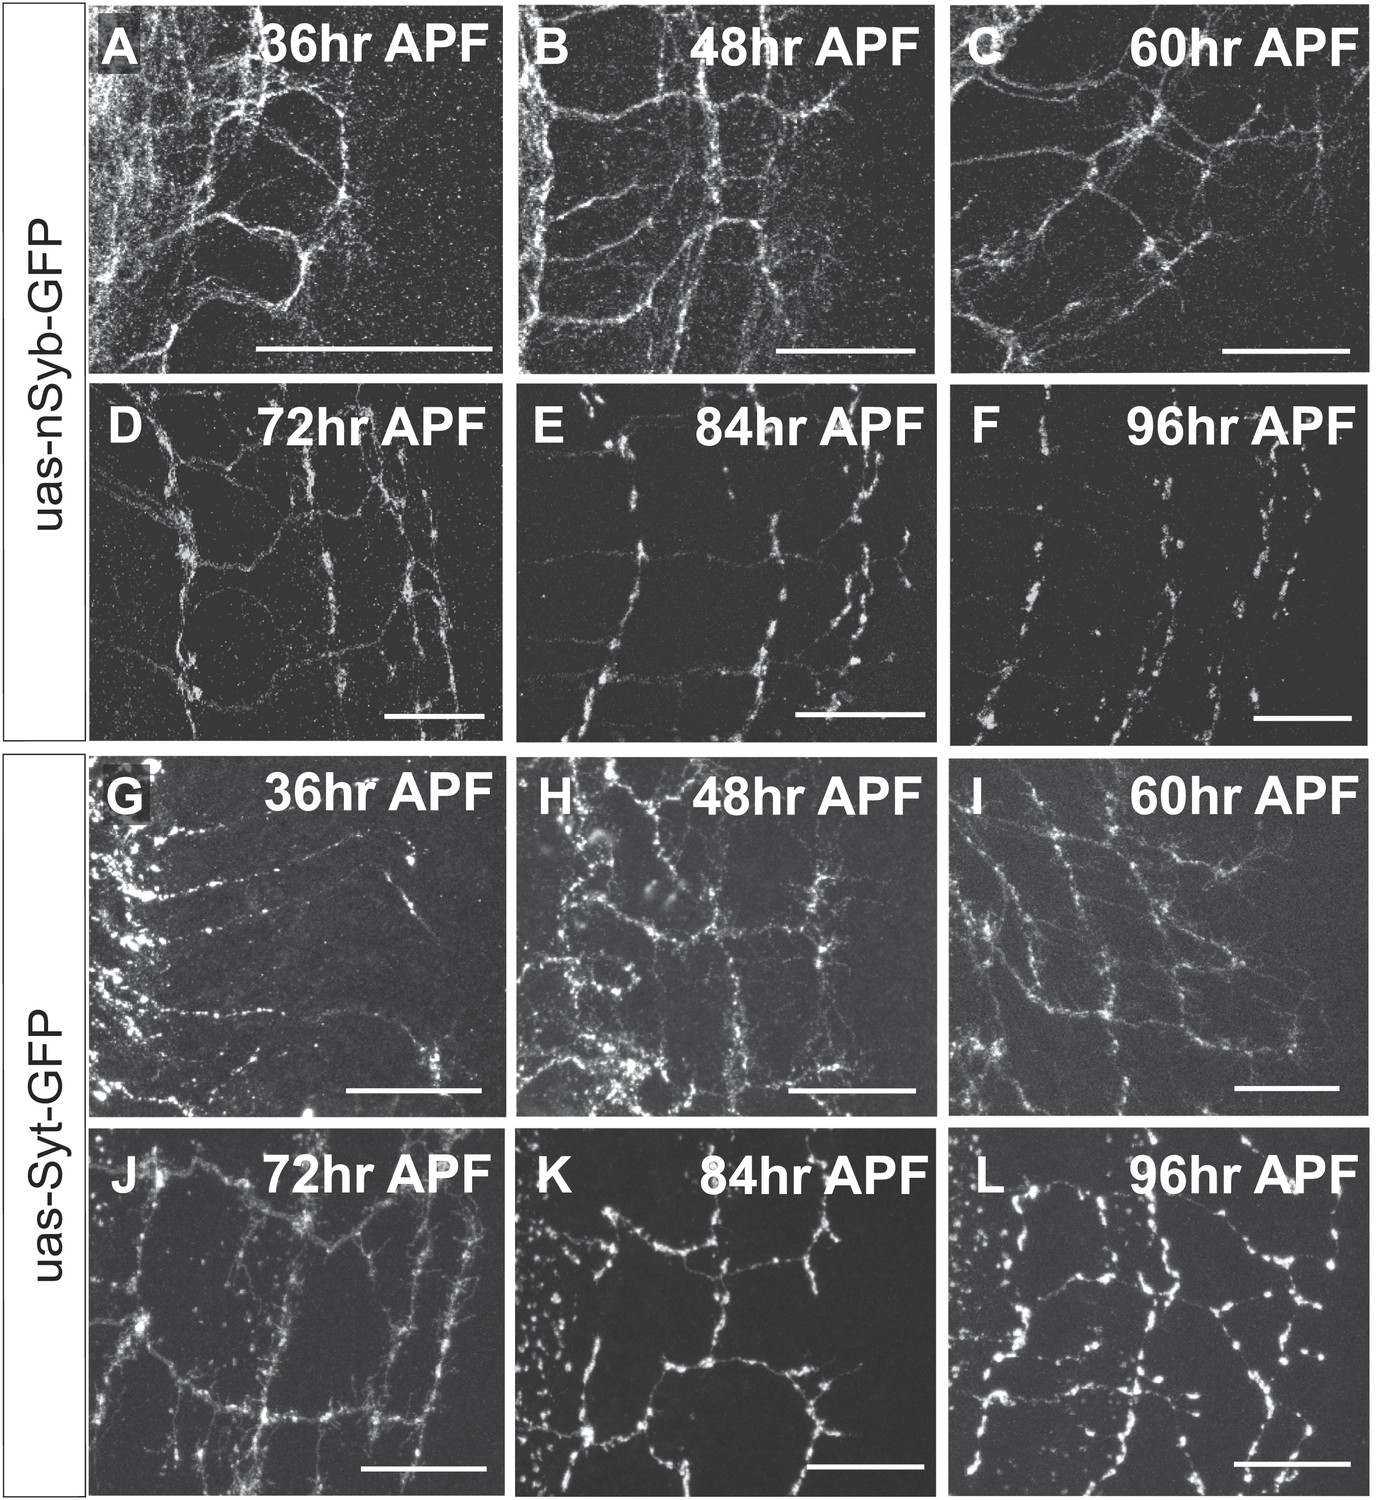
DCN axon branches.
(A–F) DCN axon branches labeled with nSyb-GFP during pupal development at (A) 36 hr APF, (B) 48 hr APF, (C) 60 hr APF, (D) 72 hr APF, (E) 84 hr APF, (F) 96 hr APF. (G–L) DCN axon branches labeled with nSyb-GFP during pupal development at (G) 36 hr APF, (H) 48 hr APF, (I) 60 hr APF, (J) 72 hr APF, (K) 84 hr APF, (L) 96 hr APF. The scale bars represent 20 µm.
Figure 3—figure supplement 2

Branch growth is not enhanced in aged EGFRDN flies.
(A) DCN axon branching (green) of 2-days-old EGFRDN flies does not exceed the neuropil marked with DN-cadherin (red). (B) DCN axon branching (green) of aged EGFRDN flies at 18 days does not exceed the neuropil marked with DN-cadherin (red). The scale bars represent 20 µm.
Figure 4 with 1 supplement
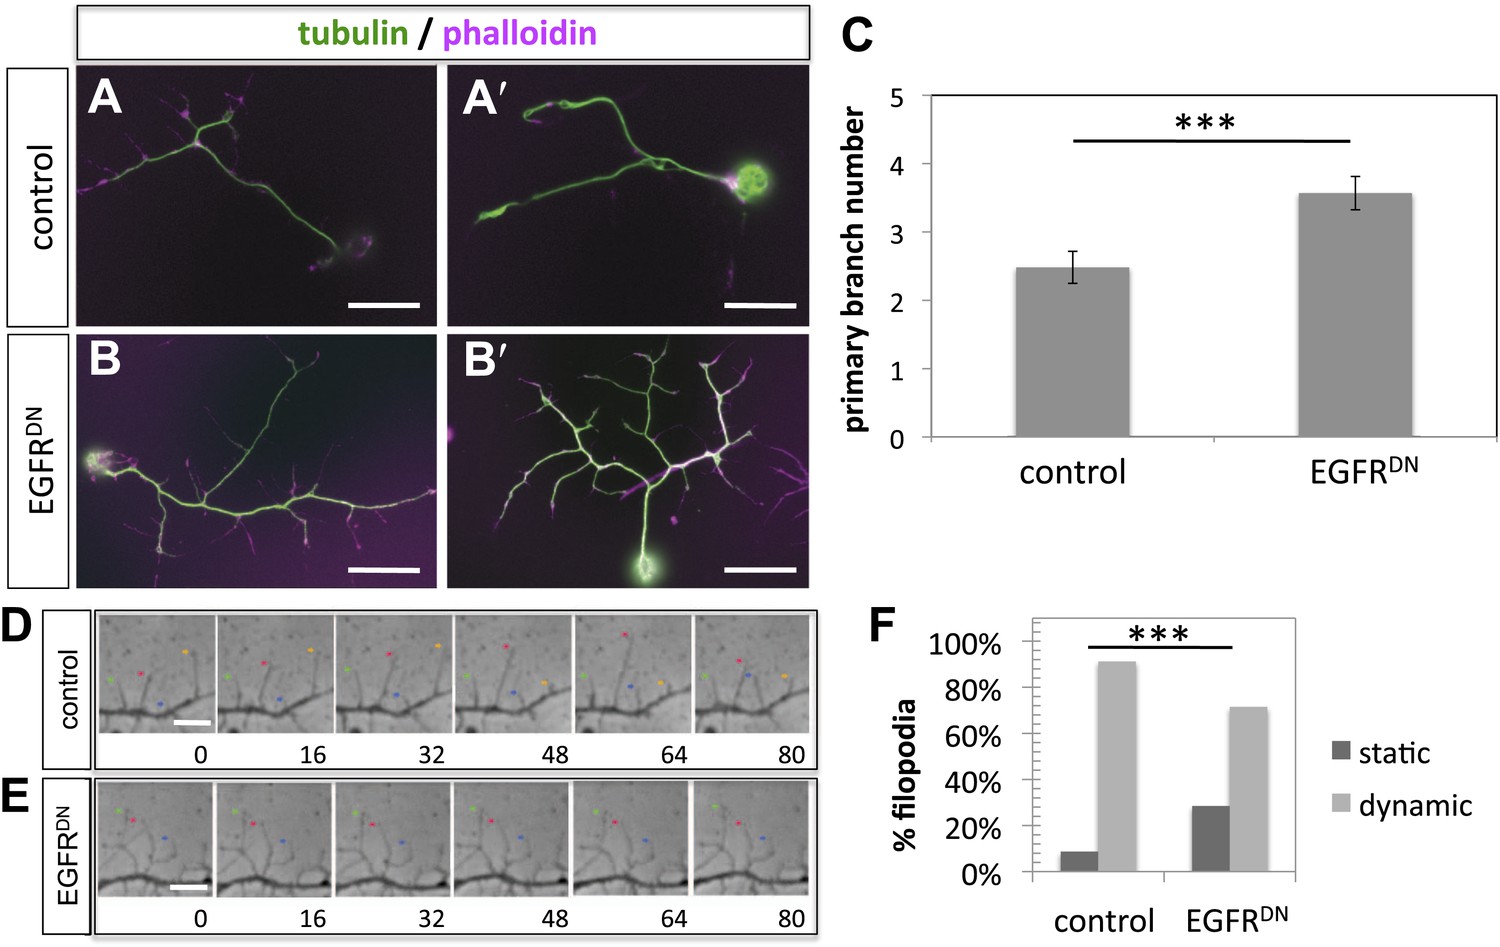
EGFR regulates filopodia dynamics in primary Drosophila neuronal cultures.
(A and B) Branch formation in cultured primary Drosophila neurons (2 days). (B–B′) Overexpression of UAS-EGFRDN using the sca-Gal4 driver results in an increase of branches when compared to (A–A′) wild type (control). For the visualization of branches, neurons were stained with anti-tubulin (green) and phalloidin (magenta). (C) Quantification of primary branch numbers per axon shows significant increase of branches in UAS-EGFRDN neurons (control: 2.48 ± 0.2 (n = 83); EGFRDN: 3.57 ± 0.24; n = 74, p<0.001). (D–E) Still images from videos of (D) wild type and (E) UAS-EGFRDN-expressing neurons. Overexpression of UAS-EGFRDN using the sca-Gal4 driver results in a decrease of filopodia dynamics in primary Drosophila neurons cultured for 6–8 hr. Different filopodia are marked by colored arrows and can be followed over time. (F) Quantification of static vs dynamic (extensions and retractions) behaviors shows a significant distribution change between wild type vs EGFRDN-expressing filopodia (control: static = 10, dynamic = 110; EGFRDN: static = 41, dynamic = 86, p<0.001). Error bars represent SEM. Mann–Whitney test. ***p<0.001. The scale bars in (A–B) represent 10 µm and in (D–E) represent 3 µm.
Figure 4—figure supplement 1

Increase in filopodia containing microtubules by expression of UAS-EGFRDN.
(A and B) Filopodia containing microtubules in cultured primary Drosophila neurons (6 hr). (B) Overexpression of UAS-EGFRDN using the sca-Gal4 driver results in an increase of filopodia containing microtubules (arrowhead) when compared to (A) wild type (control). Neurons were stained with anti-tubulin (green) and phalloidin (magenta). (C) Quantification of filopodia containing microtubules, the percentage of filopodia with microtubules is increase in UAS-EGFRDN neurons (in percentages, control: 13 ± 0.8 (n = 253); EGFRDN: 17 ± 0.7; n = 239, p<0.001). Error bars represent SEM. Mann–Whitney test. ***p<0.001. The scale bars in (A and B) represent 3 µm.
Figure 5 with 2 supplements
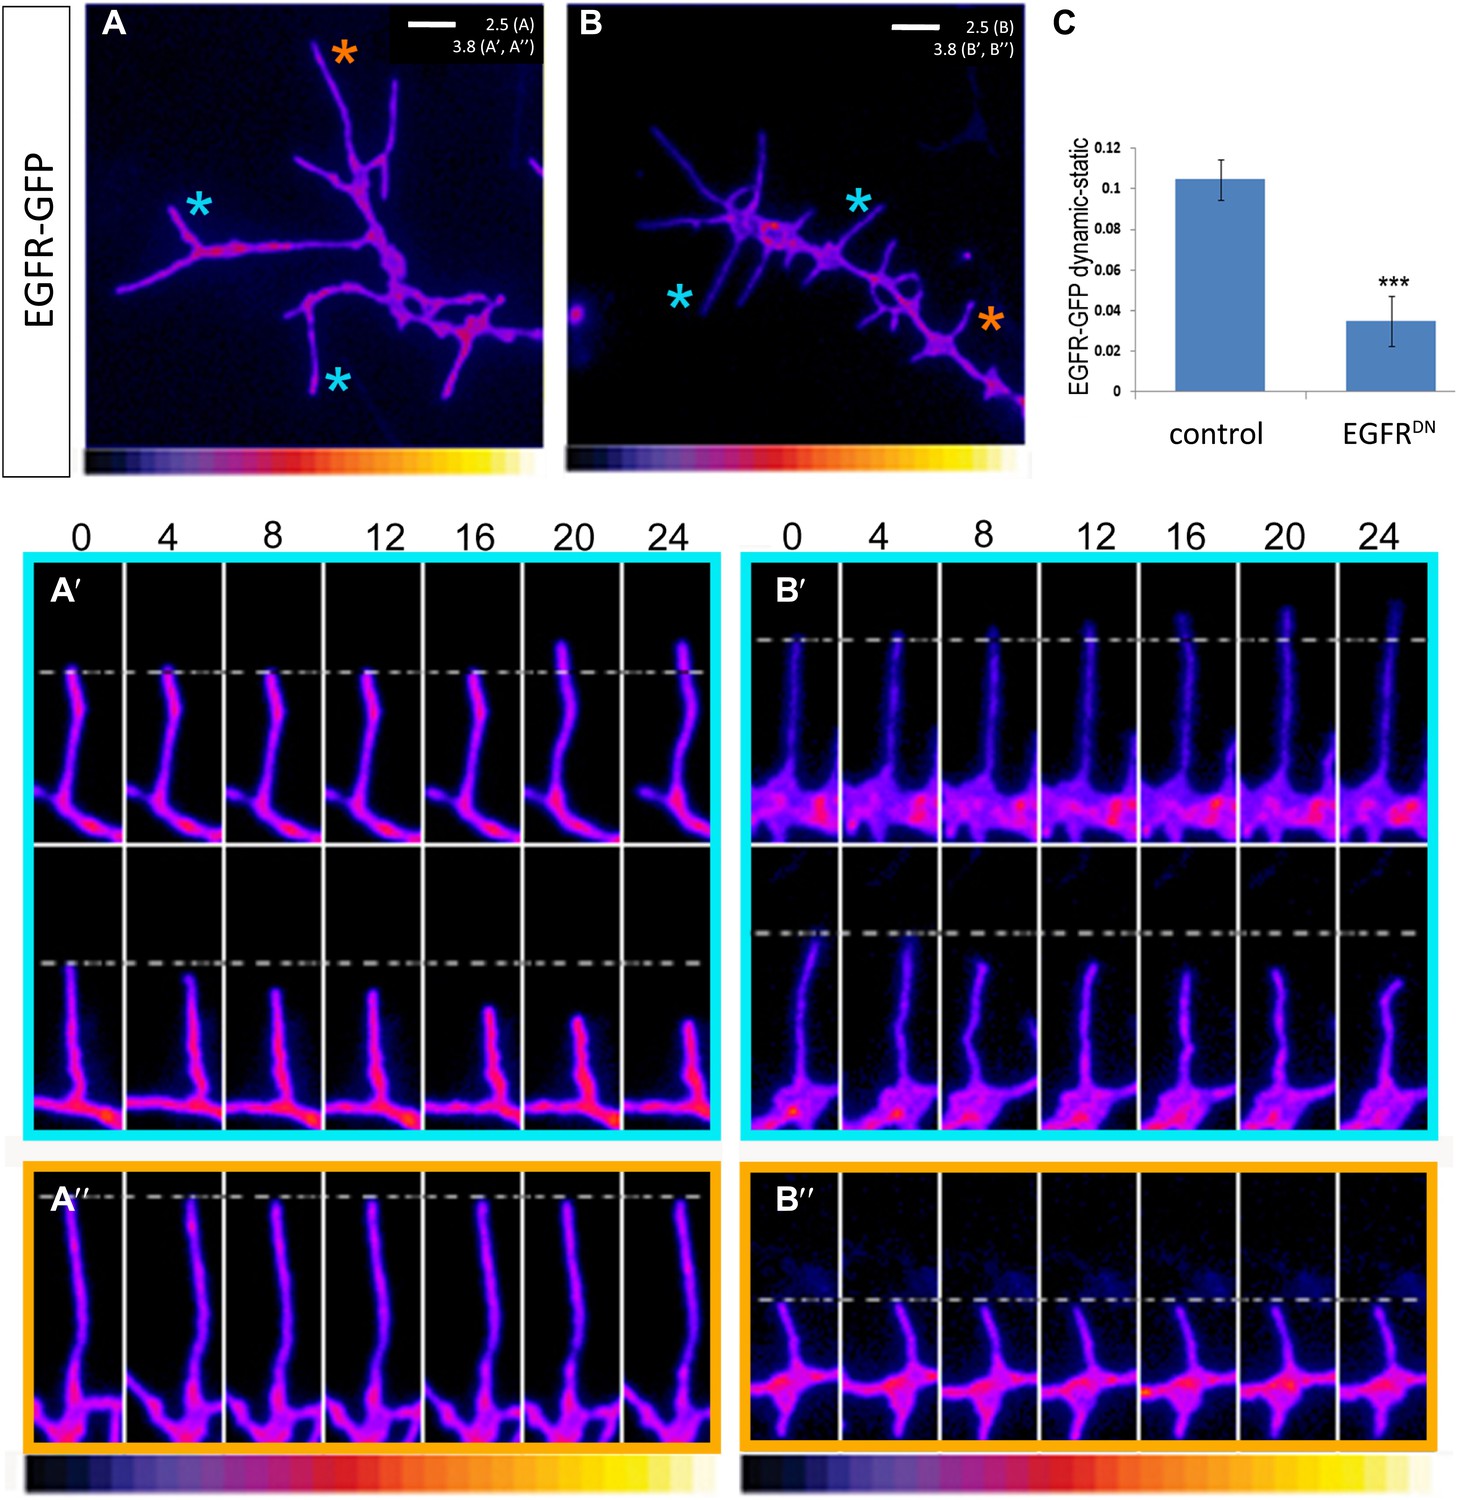
EGFR shows differential localization in filopodia of primary Drosophila neurons.
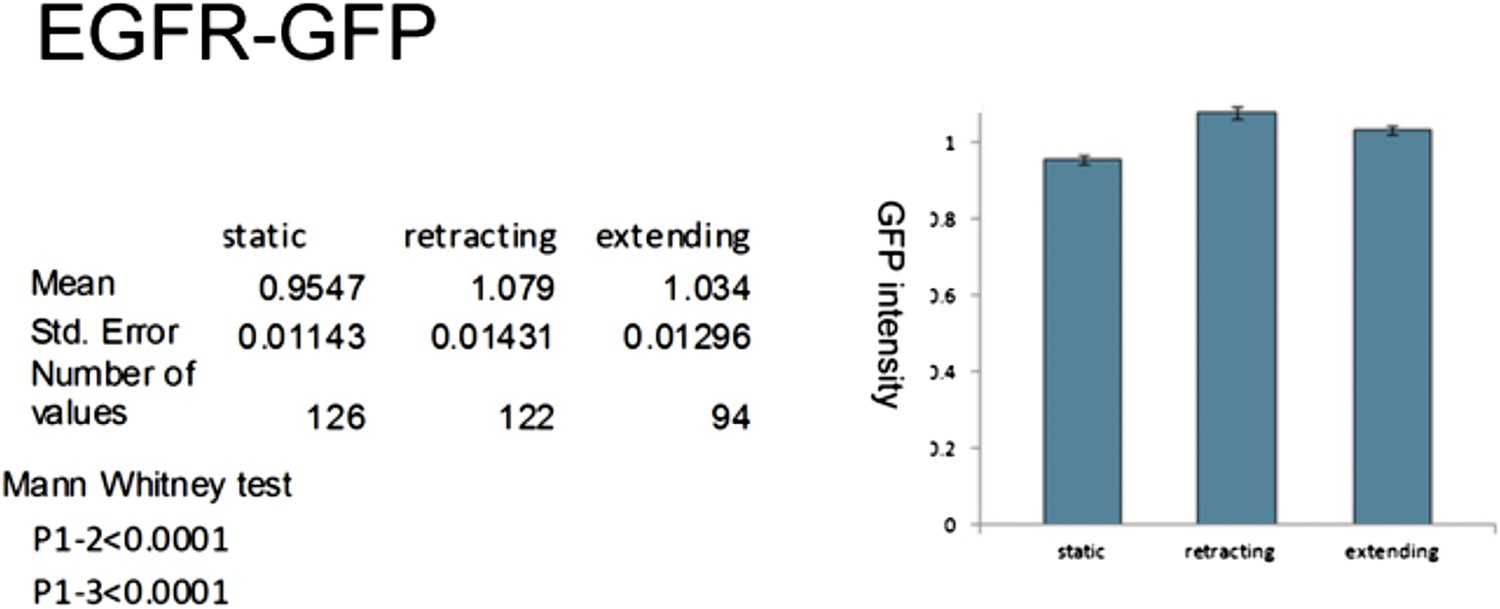
(A–B) UAS-EGFRGFP expressed with elav-Gal4 in wild type (A) and EGFRDN (B) primary Drosophila neurons. False color image displaying a heat map of an EGFRGFP-expressing growth cone. EGFRGFP expression in dynamic (A′ and B′) and static filopodia (A″ and B″) is followed over time in wild type (A′ and A″) and EGFRDN (B′ and B″). A′ and B′ each shows one filopodia growing and one retracting (C). To quantify EGFRGFP intensity in static vs dynamic filopodia in the absence (control) or presence of EGFRDN, we calculated the ratio of EGFRGFP in dynamic minus static filopodia (GFP maximal intensity of each dynamic phase minus the mean of GFP maximal intensity in static filopodia). The difference in EGFRGFP levels between dynamic filopodia and static filopodia are significantly reduced in the presence of EGFRDN (control dynamic-static: 0.1046 ± 0.009, n=216; EGFRDN dynamic-static: 0.0349 ± 0.0121, n=124, p<0.001). Error bars represent SEM. Mann–-Whitney test. ***p<0.001.
Figure 5—figure supplement 1
Localization of EGFR in cultured neurons.
UAS-EGFRGFP under control of sca-Gal4 is significantly higher expressed in dynamic filopodia compared to static filopodia in cultured wild-type neurons.
Figure 5—figure supplement 2
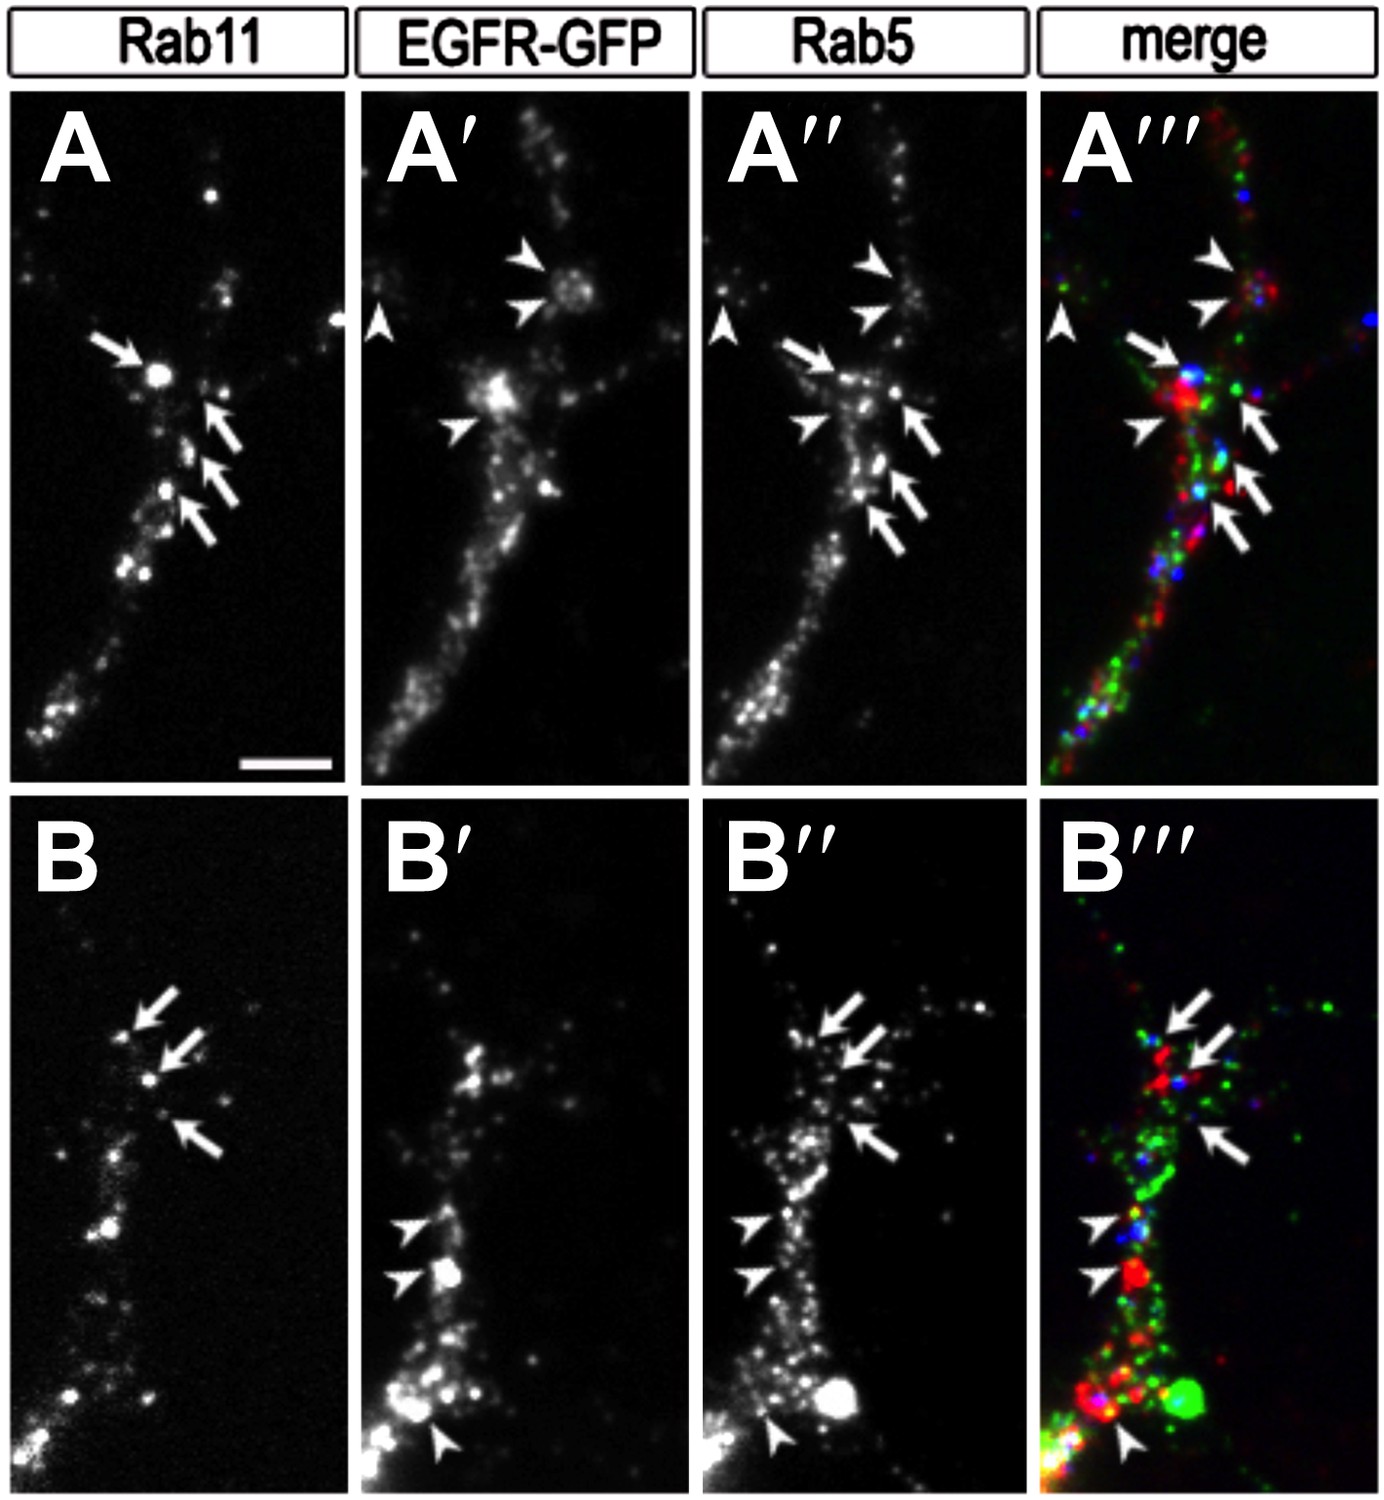
Colocalization of EGFR with Rab11 and Rab5 in the growth cone.
(A–B) Growth cones from primary Drosophila neurons expressing UAS-EGFRGFP with elav-Gal4. Neurons were inmunostained for the recycling endosomal marker Rab11 (A, B, A‴, B‴ in red), GFP (A′, B′, A‴, B‴ in green) and the early endosomal marker Rab5 (A″, B″, A‴, B‴ in blue). Note that a fraction of EGFR granules colocalises with Rab11 (arrows) or Rab5 (arrowheads). The scale bars in (A) represent 1 µm.
Figure 6
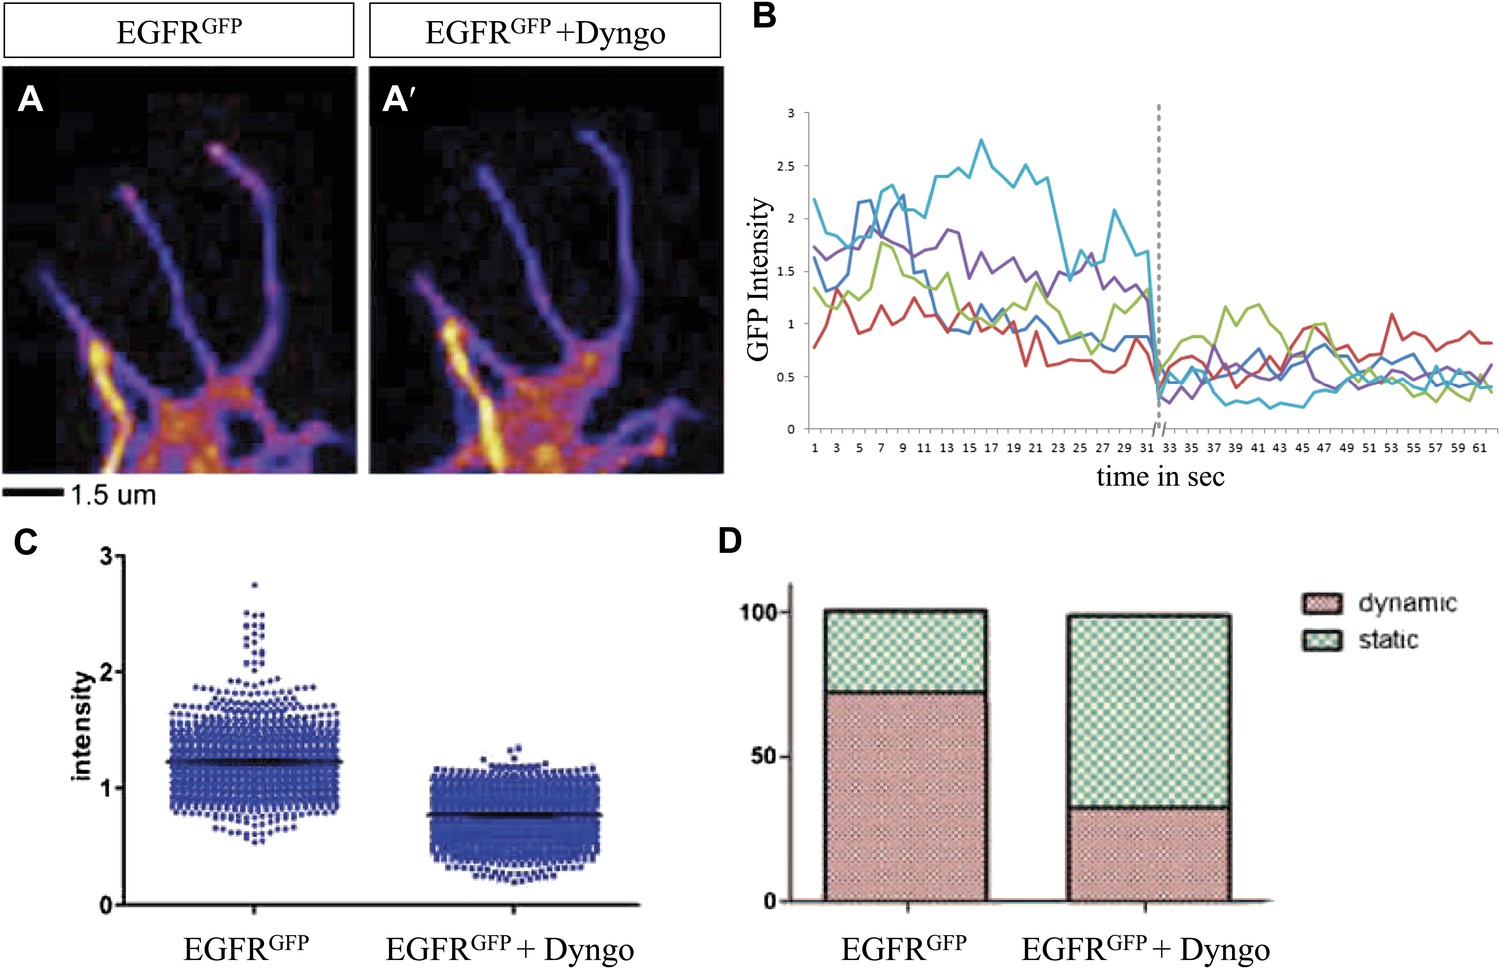
Differential EGFR localization in filopodial of primary Drosophila neurons requires endocytosis.
(A–A′) UAS-EGFRGFP expressed with elav-Gal4 driver in primary Drosophila neurons. False color image displaying a heat map of an EGFRGFP-expressing growth cone before (A) and after (A′) treatment with Dyngo. (B) Maximal intensity of EGFRGFP in filopodia within one neuron over time (2 min), before and after treatment (indicated by dotted line) with Dyngo. (C) Scatter plot from EGFRGFP maximal intensities from filopodia from 6 neurons, showing a significant decrease in levels after treatment with Dyngo (EGFRGFP maximal intensities in DMSO: 1.229 ± 0.0074, n = 1403; EGFRGFP maximal intensities in Dyngo: 0.768 ± 0.005, n = 1401, p<0.001). (D) Effect of Dyngo on filopodia dynamics. Quantification of static vs dynamic (extensions and retractions) behaviors of filopodia shows a significant distribution change between controls (EGFRGFP-expressing neurons in DMSO) and Dyngo-treated EGFRGFP-expressing neurons (control: static = 28, dynamic = 72; Dyngo treated: static = 66, dynamic = 32, p<0.001). Mann–Whitney test. ***p<0.001.
Figure 7 with 4 supplements
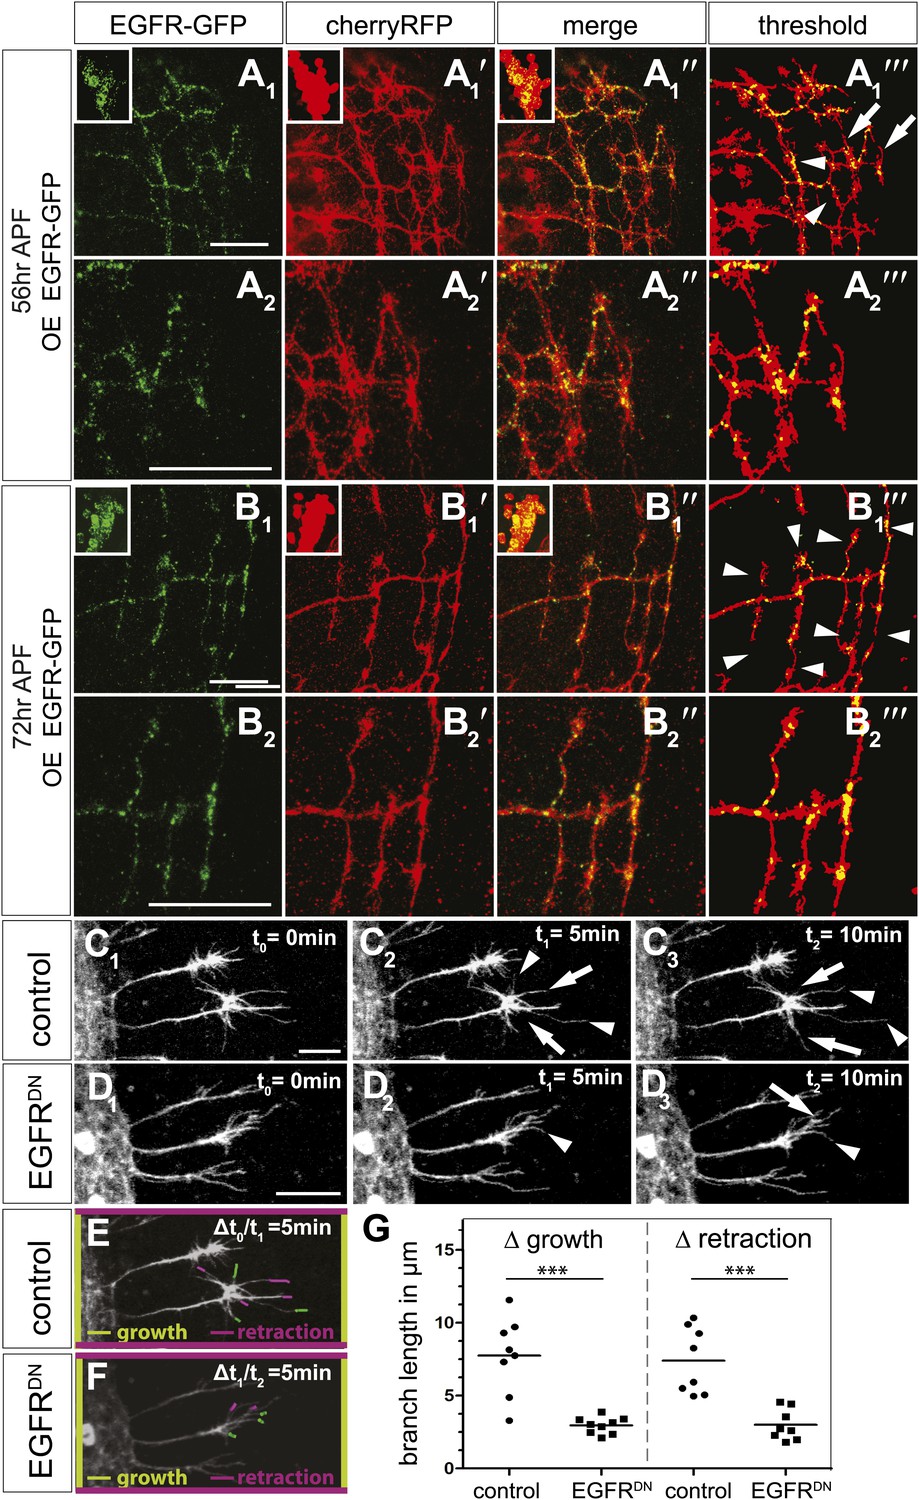
EGFR mediates a probabilistic branch refinement process.
(A–B) EGFR localization examined by expressing UAS-EGFRGFP (green) in the DCNs (red, UAS-cherryRFP) during pupal development at (A) 56 hr APF and (B) 72 hr APF. EGFRGFP expression was observed in a punctate pattern in the cell bodies (insets in A and B) and along the axonal branches (A and B). Images A/B and A′/B′ were subjected to thresholding and merged (A‴/B‴). Differential localization results in branches with (A‴, arrowheads) and without (A‴, arrows) EGFRGFP at 56 hr APF, whereas most if not all branches contain EGFRGFP at 72 hr APF (B‴, arrowheads). High magnification shows EGFR localization at branches at 56 hr APF (A2) and 72 hr APF (B2). (C) Z-stack projections from live imaging time-lapse videos of control axons at around 40 hr APF between t0 = 0 min (C1) and t2 = 10 min (C3) with 5-min intervals. (D) Z-stack projections from live imaging time-lapse videos of EGFRDN axons at around 40 hr APF between t0 = 0 min (D1) and t2 = 10 min (D3) with 5 min intervals. Arrows indicate branches being pruned while arrowheads point to growing branches. (E) Visualization of growth (green) and retraction (purple) events between t0 = 0 min (C1) and t1 = 5 min (C2) in control. (F) Visualization of growth (green) and retraction (purple) events between t1 = 5 min (D2) and t2 = 10 min (D3) in EGFRDN. (G) Quantification of growth and retraction dynamics at branches using the tracer tool shows significant decrease in branch lengths in EGFRDN compared to control. Control (growth) 7.75 ± 2.65 (n = 8), EGFRDN (growth) 2.97 ± 0.56 (n = 9, p<0.001). Control (retraction) 7.4 ± 2.28 (n = 8), EGFRDN (retraction) 3 ± 1.08 (n = 8, p<0.001). Horizontal lines represent the mean for each data set. t test. ***p<0.001. The scale bars represent 20 µm.
Figure 7—figure supplement 1

Localization of EGFR.
(A) Expression of genomic EGFRGFP (green) during brain development at 48 hr APF and the neuropil marked with DN-cadherin (blue). (B) Axonal arbor of lateral neurons ventral (LNv) (green) in wild type and EGFRDN. (C–E) EGFR localization by expressing UAS-EGFRGFP (green) in the adult DCNs (red, UAS-cherryRFP) in one brain hemisphere (C), in the cell bodies (D) and in the axonal branches (E). The scale bars represent 20 µm except in C with 100 µm. (F) EGFR localization by expressing UAS-EGFRGFP (green) in the DCNs (red, UAS-cherryRFP) of two different individual flies during pupal development at 56 hr APF. Differential localization results in branches with (arrowheads) and without (arrows) EGFR localization at 56 hr APF. The scale bars represent 20 µm. (G) EGFR localization examined by expressing UAS-EGFRGFP (green) in the LNvs (red, UAS-lacZ) at (G) larval stage (L3) and in (G′) adult. The scale bar represents 60 µm.
Figure 7—figure supplement 2
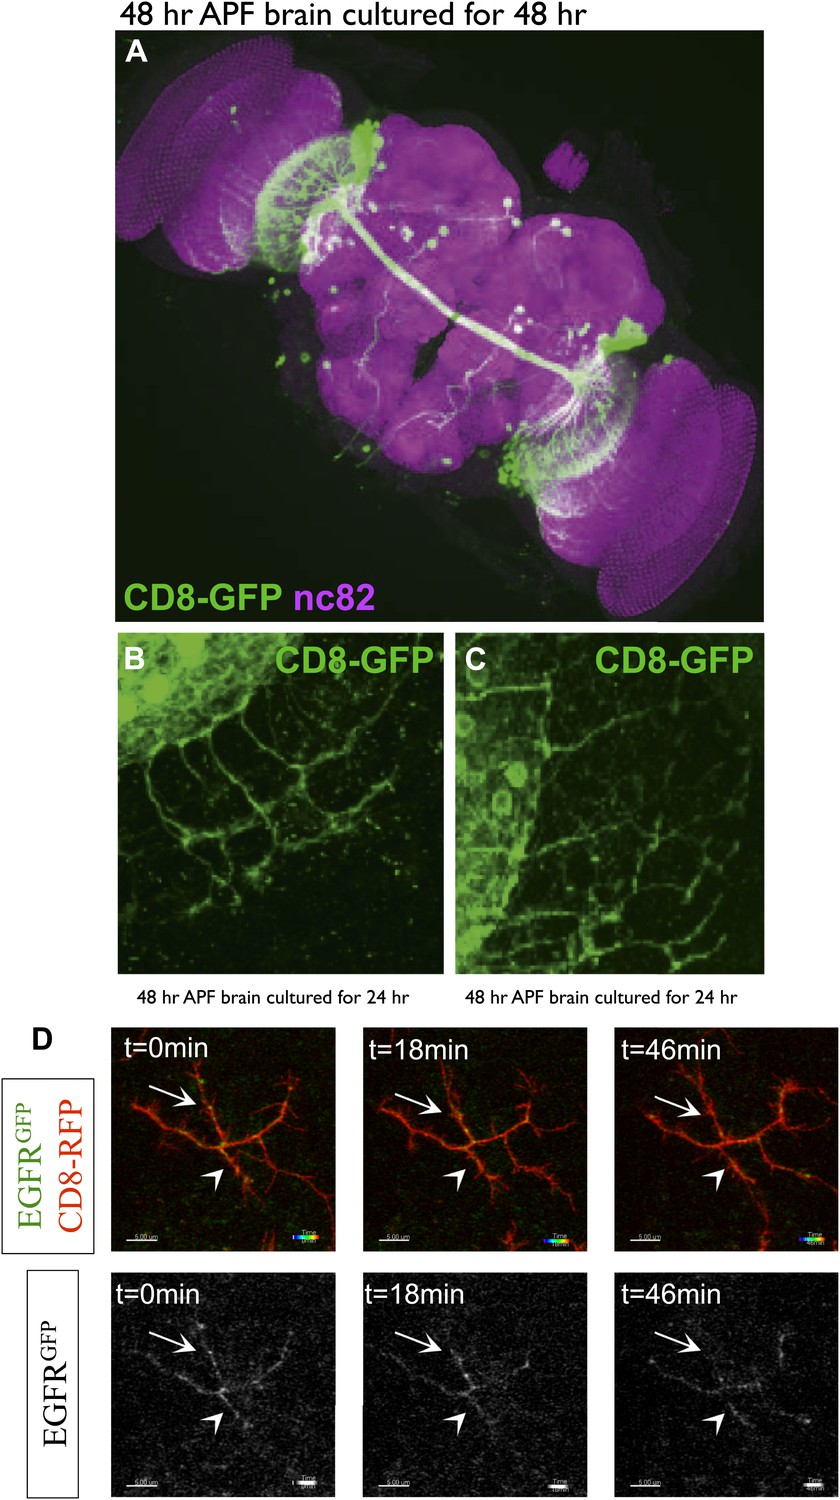
DCN branch pattern in cultured pupal brains.
(A) DCN branch morphology of a brain dissected from pupae at 48 hr APF and then cultured under standard conditions (‘Materials and methods’) for 48 hr. Morphology of the neuropils has been visualized by nc82 staining (magenta). (B–C) Axon branch morphology in the optic lobe of pupal brain dissected at 48 hr APF and cultured for (B) 24 hr and (C) 48 hr. (D) EGFR shows differential and dynamic localization in developing dorsal cluster neurons in vivo. UAS-CD8-RFP and UAS-EGFR-GFP were expressed with ato-Gal4 in wild-type Drosophila brains. Intact eye–brain complexes were imaged live at 45% APF. Maximum projection images demonstrating a single DCN axon terminal from live imaging time-lapse videos at t = 0 min (left) t = 18 min (middle) and t = 46 min (right), for both channels (upper) and only EGFR channel (lower). Two directly opposing branches of the same DCN axon were followed over time. At t = 0 both branches have significant levels of EGFR signal (arrow and arrowhead). 18 min later upper (arrow) branch retains its EGFR signal while lower (arrowhead) branch demonstrates a significant decrease. 28 min later the lower branch demonstrates a slight increase in the signal while the upper branch almost completely loses it. Scale bars correspond to 5 µm in all images.
Figure 7—figure supplement 3
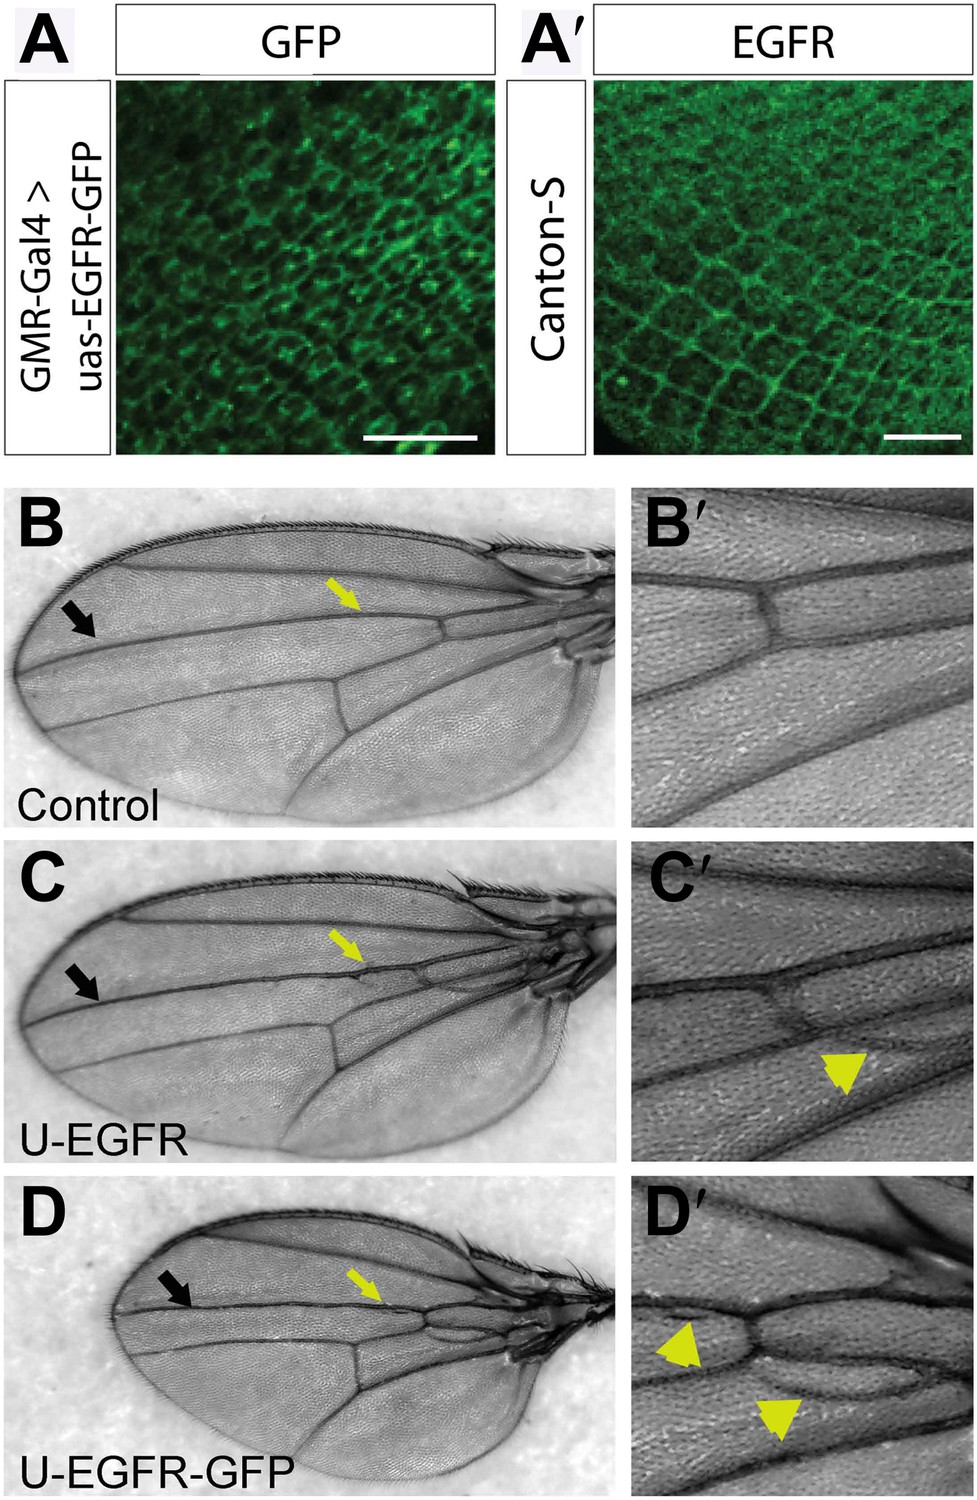
UAS-EGFRGFP localizes and functions similar to endogenous EGFR.
(A) Expression of UAS-EGFR-GFP in photoreceptor neurons at developing L3 eye disc using GMR-Gal4. (A′) Expression of endogenous EGFR revealed by immunohistochemistry on developing Canton-S L3 eye disc. The scale bars represent 20 µm. (B–D′) EGFR-GFP overexpression in the wing produces increase in vein tissue. (B) Control bearing Dpp-Gal4, showing the wild-type vein pattern, (B′) Zoom in of a ROI in (B). (C) Flies over-expressing wild-type-untagged EGFR in the wing using Dpp-Gal4 (along vein L3, black arrow) show a vein-specific increase in vein thickness (yellow arrow) and formation of ectopic veins (yellow arrowheads), (C′) zoom in of a ROI in (C). (D) Flies expressing EGFR-GFP using Dpp-Gal4 produces similar phenotypes to wild type EGFR over-expression (yellow arrow and arrowhead), (D′) zoom in of a ROI in (D).
Figure 7—figure supplement 4

Overexpression of wild-type EGFR does not cause a significant increase in axonal branching.
Quantification of the number of axonal branches in DCNs overexpressing untagged or GFP-tagged EGFR. Neither causes a significant increase in the average number of axonal branches.
Figure 8 with 3 supplements
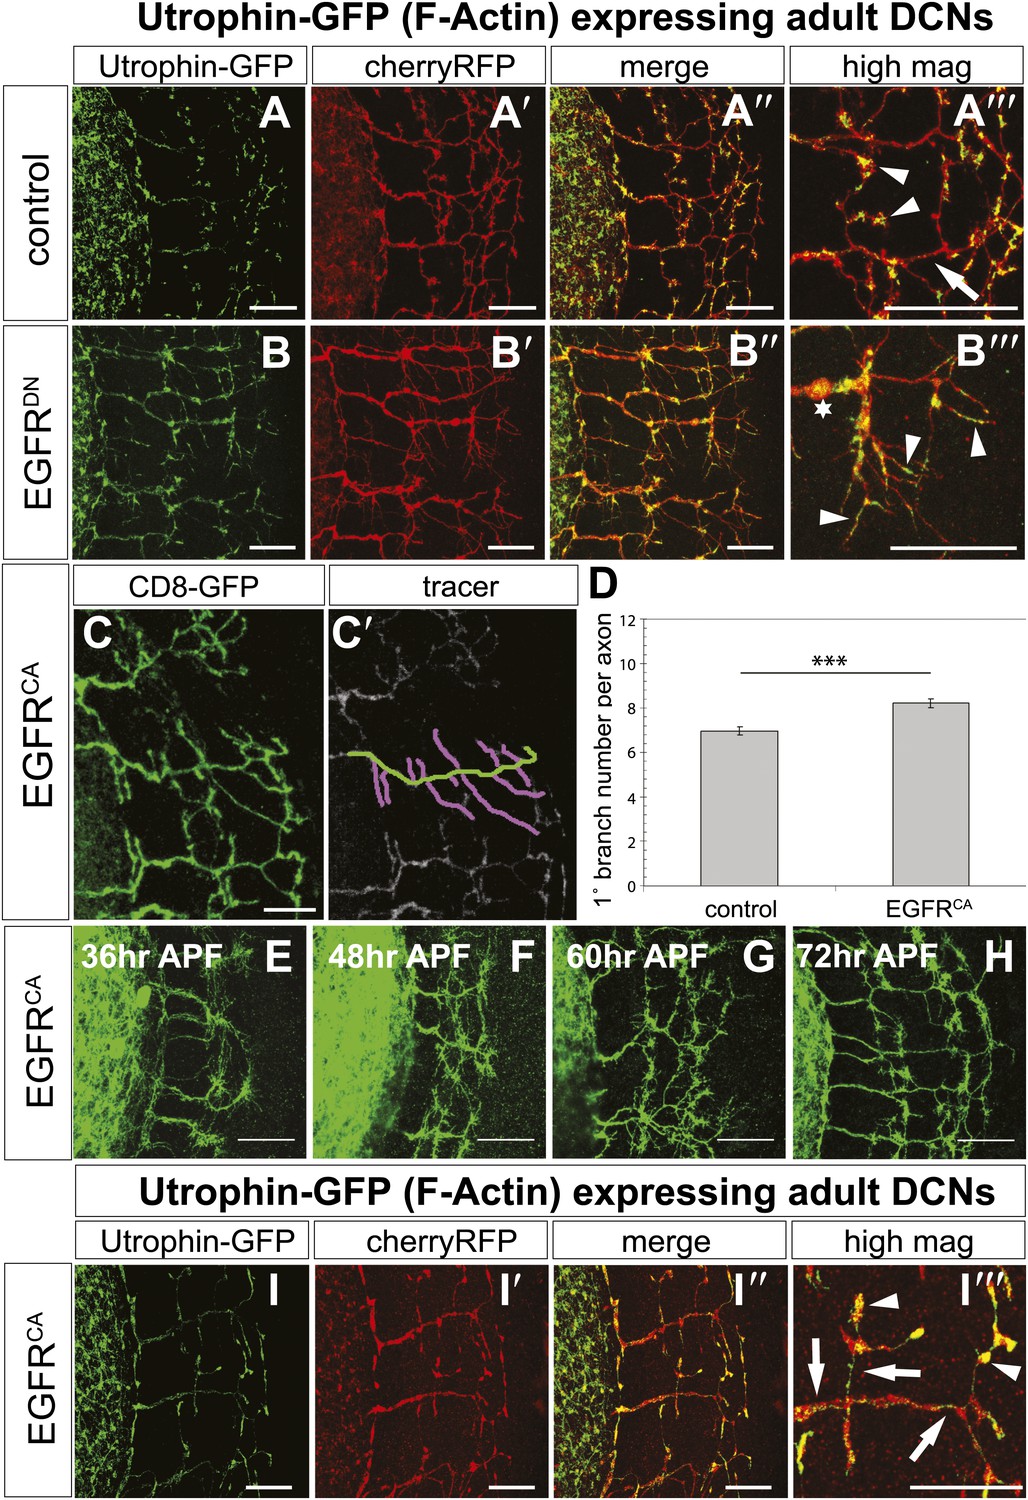
EGFR regulates actin polymerization in DCN axonal branches.
(A–B) Utrophin (F-actin) localization in adult DCN (red, UAS-cherryRFP) by expressing UAS-utrophin-GFP (green) in (A) control and (B) EGFRDN. (A‴–B‴) High magnification of the branch tips. Arrowheads show localization of Utrophin at the branch tips. Arrows show Utrophin localization along axon shafts. Asterisk in (B‴) shows weak Utrophin accumulation in axonal swellings. (C) Overexpression of a constitutively active form of EGFR (UAS-EGFRCA) results in increased branching in the adult DCN. (C′) Visualization of branches (purple) along a single main axon shaft (green), using the tracing tool. (D) Quantification of adult primary branch numbers per axons shows significant increase of branches in EGFRCA compared to control. Control 6.96 ± 1.34 (n = 60), EGFRCA 8.22 ± 1.47 (n = 55, p<0.001). Error bars represent SEM. Mann–Whitney test. ***p<0.001. (E–H) Axonal branch pattern at different pupal stages shows excessive branching during mid-pupal development. Branch morphology at (E) 36 hr APF, (F) 48 hr APF, (G) 60 hr APF, and (H) 72 hr APF.(I–I′) Utrophin (F-actin) localization in adult DCN (red, UAS-cherryRFP, I′) by expressing UAS-utrophin-GFP (green, I) in an EGFRCA background. (I″) Merge of DCNs (red) and Utrophin (green). (I‴) High magnification of the branch tips. Arrowheads show localization of Utrophin at the branch tips. Arrowheads show localization of Utrophin at the branch tips. Arrows show Utrophin localization along axon shafts. The scale bars represent 20 µm.
Figure 8—figure supplement 1

The canonical MAPK pathway is not involved in DCN refinement.
(A) Localization of phosphorylated ERK (dpERK, red) in developing eye discs as readout for activated EGFR pathway. (B) Absence of dpERK (red, B′) at the DCN cell bodies (green, B) during pupal development. (B″) Merge of DCNs (green) and dpERK (red). (C–F) DCN branch pattern in neurons with genetically altered MAPK pathway activity by expression of (C) a constitutively active form of ERK (ERKCA), (D) Ras1RNAi, (E) a constitutively active form of Ras1 (Ras1CA) and (F) Drk RNAi. (G) Quantifications of the genotypes in (C–F) do not reveal significant changes in DCN branch numbers compared to control. Control 6.96 ± 1.34 (n = 60), ERKCA 7.43 ± 1.07 (n = 30), Ras1RNAi 7.2 ± 1.71 (n = 59), Ras1CA 7.07 ± 1.44 (n = 14), DRKRNAi 7.36 ± 1.22 (n = 14). Non-parametric ANOVA Kruskal–Wallis test was not significant. The scale bars represent 20 µm.
Figure 8—figure supplement 2
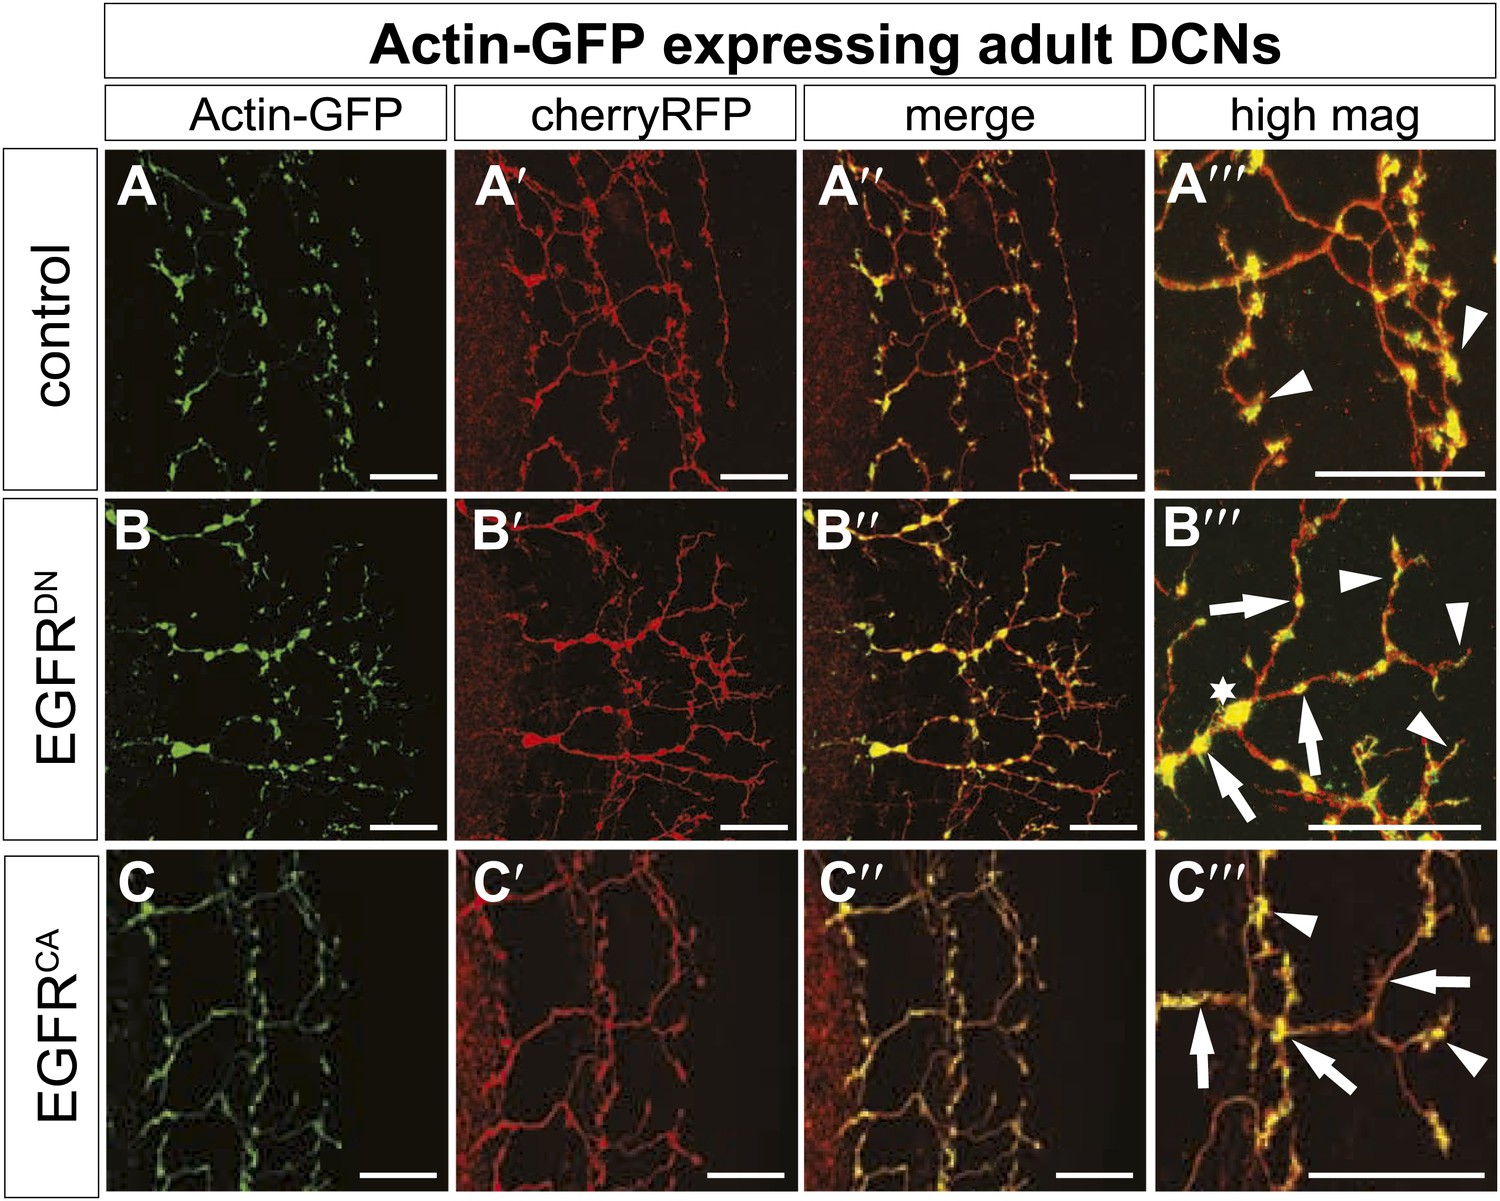
EGFR regulates actin polymerization in DCN axonal branches.
(A–C) Actin localization in adult DCN (red, UAS-cherryRFP) by expressing UAS-Actin-GFP (green) in (A) control, (B) EGFRDN and (C) EGFRCA. (A‴–B‴) High magnification of the branch tips. Arrowheads show localization of Actin at the branch tips. Arrows show actin localization along axon shafts. Asterisk in (B) shows total actin accumulation in axonal swellings. The scale bars represent 20 µm.
Figure 8—figure supplement 3

Branch increase in cultured neurons by expression of EGFRCA.
(A–A′) Overexpression of UAS-EGFRCA using the sca-Gal4 driver in neurons cultured for 2 days results in an increase of branches when compared to wild type (compare to Figure 4A–A′). For the visualization of branches, neurons were stained with anti-tubulin (green) and phalloidin (magenta). (B) Quantification of primary branch numbers per axon shows significant increase of branches in UAS-EGFRCA neurons (control: 1 ± 0.05 (n = 235); EGFRCA: 1.37 ± 0.09; n = 120, p<0.01). Error bars represent SEM. Mann–Whitney test. **p<0.01.
Figure 9
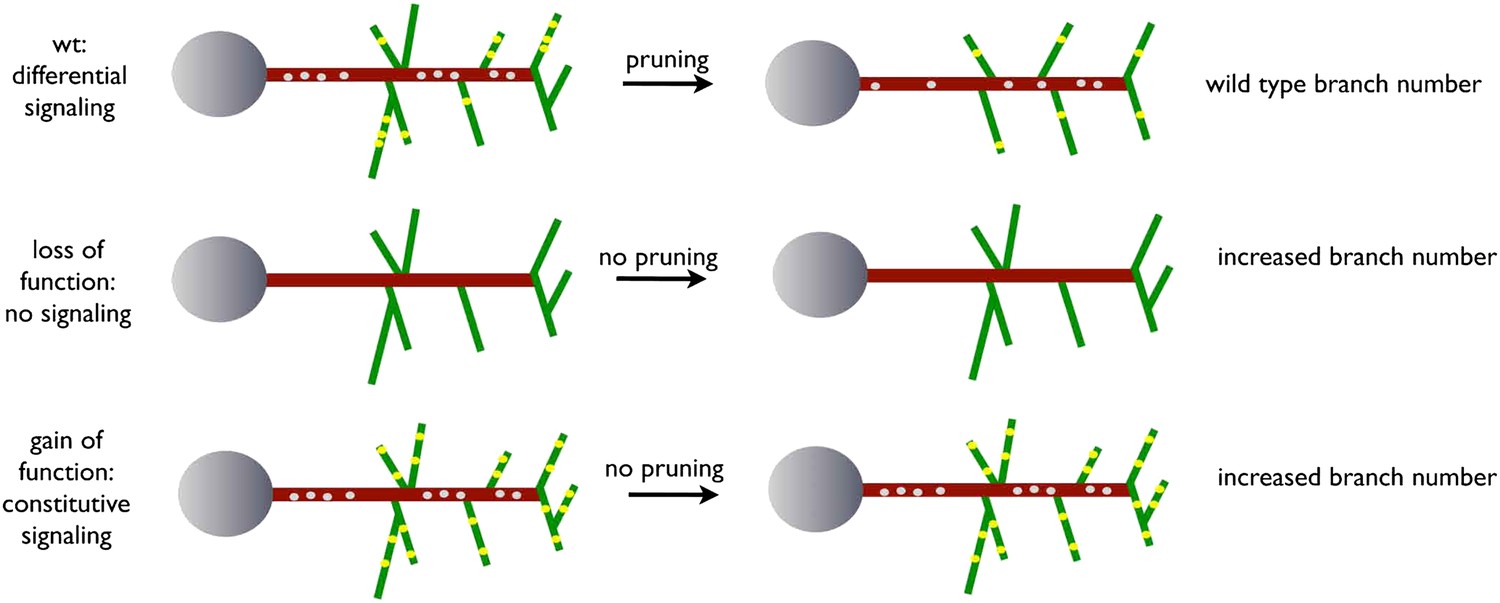
A model for EGFR function in axonal branching.
Local asymmetries in tyrosine kinase receptor activity in axonal branch, driven by differential distribution of active receptor molecules in filopodia, generate dynamical behavior and drive branch pruning. Gray dots represent EGFR puncta trafficked along the axon shaft (red) while yellow dots represent active EGFR puncta within branches (green).
Videos
Video 1
EGFR-GFP cell culture filopodia.
This video is related to Figure 5. Live imaging time-lapse video of axons from different primary neurons grown in culture for 4 days. UAS-EGFRGFP is expressed with elav-Gal4 driver. Images were collected every 4 s.
Video 2
EGFR-GFP cell culture filopodia.
This video is related to Figure 5. Live imaging time-lapse video of axons from different primary neurons grown in culture for 4 days. UAS-EGFRGFP is expressed with elav-Gal4 driver. Images were collected every 4 s.
Video 3
EGFR-GFP cell culture filopodia.
This video is related to Figure 5. Live imaging time-lapse video of axons from different primary neurons grown in culture for 4 days. UAS-EGFRGFP is expressed with elav-Gal4 driver. Images were collected every 4 s.
Video 4
Comparison egfr vs egfr + dingo.
This video is related to Figure 6. Video shows the side-by-side comparison of dynamic behavior of filopodia with and without Dyngo-4a (a dynamin inhibitor) treatment. The intensity of the EGFR-GFP signal is displayed in yellow. The outlines of the filopodia have been segmented by subsequently thresholding and outline detection of the fluorescent signal. To show the dynamic behavior of the filopodia in the time-lapse video, the outlines of the following two frames (4 and 8 s ahead of the current frames) are displayed in red and in blue respectively. The untreated filopodia move more than the Dyngo-4a treated ones.
Video 5
brain culture WT 40 hr.
This video is related to Figure 7. Live imaging time-lapse videos of control axons at around 40hr APF. Corresponds to images presented in Figure 7C and quantified in Figure 7G. Images were collected every 5 min for 45 min.
Video 6
brain culture EGFR-DN 40 hr.
This video is related to Figure 7. Live imaging time-lapse videos of EGFRDN axons at around 40hr APF. Corresponds to images presented in Figure 7D and quantified in Figure 7G. Images were collected every 5 min for 40 min.
Video 7
brain culture EGFR-GFP.
This video is related to Figure 7. EGFR shows differential and dynamic localization in developing dorsal cluster neurons in vivo. UAS-CD8-RFP and UAS-EGFR-GFP were expressed with ato-Gal4 in wildtype Drosophila brains. Intact eye–brain complexes were imaged live at 45% APF. Maximum projection images demonstrating three DCN axon terminals in a time-lapse video of 3 hr with 2 min time intervals. Extension of the axons over time could be observed especially in the upper axon. All axons demonstrate rapid filopodial dynamics as well as changes in EGFR localization over time.
Download links
A two-part list of links to download the article, or parts of the article, in various formats.
Downloads (link to download the article as PDF)
Open citations (links to open the citations from this article in various online reference manager services)
Cite this article (links to download the citations from this article in formats compatible with various reference manager tools)
Regulation of branching dynamics by axon-intrinsic asymmetries in Tyrosine Kinase Receptor signaling
eLife 3:e01699.
https://doi.org/10.7554/eLife.01699


