Escherichia coli swimming is robust against variations in flagellar number
- University of Illinois at Urbana-Champaign, United States
- Baylor College of Medicine, United States
Figures
Figure 1 with 5 supplements
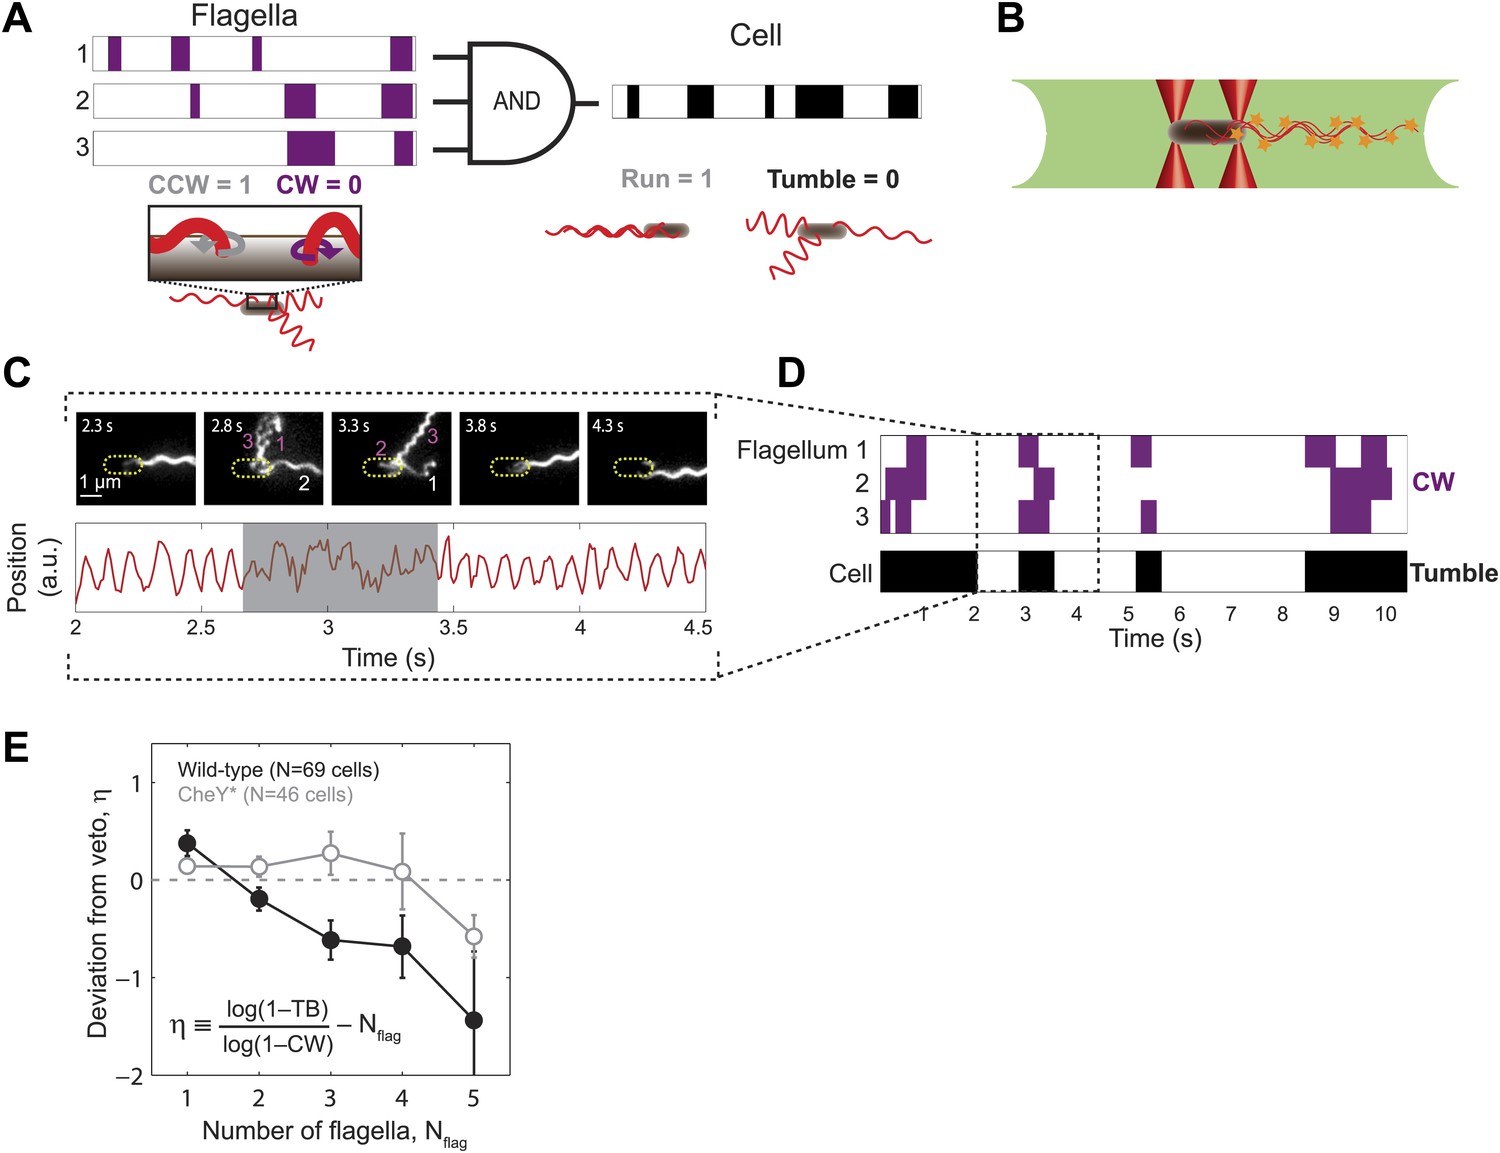
Wild-type E. coli cells deviate from the ‘veto’ model.
(A) The mapping relating the run/tumble state of the cell to the CCW/CW state of its flagella according to the veto model. Schematic time trace from a cell with 3 flagella, showing CW (purple) and CCW (white) intervals for each flagellar motor and the resulting tumbles (black) and runs (white) of the cell. The veto model corresponds to an AND gate, by which cell runs only occur when all flagella rotate CCW (where CCW = 1, CW = 0, run = 1, and tumble = 0). (B) Schematic of a cell held by two optical traps (red cones) in the fluorescence excitation volume (green) within the sample chamber. (C) Representative data trace from a trapped cell with three flagella. Still images of fluorescently labeled flagella at 0.5-s intervals (top). The approximate location of the unlabeled cell body is indicated by a dashed yellow line. Flagella rotating CW (purple) and CCW (white) are numbered in frames in which they appear distinct. Corresponding cell-body rotation signal for the same cell (red line, bottom) as detected from deflections of the trapping laser. Tumbles (shaded area) were determined from the erratic cell-body rotation signal. (D) Long-term time trace of CCW/CW flagellar rotation state and run/tumble cell swimming state. CW intervals (purple, top) for each flagellum were determined from the fluorescence images. Tumbles (black, bottom) were determined from the cell-body rotation signal. (E) Mean deviation η from the veto model vs number of flagella per cell. Wild-type cells (solid black circles) with multiple flagella deviate significantly from the model (p=0.0003, N = 69 cells). CheY* cells (open gray circles; N = 46 cells) match the model (p=0.77). Error bars denote SEM. See ‘Materials and methods’ for more details.
Figure 1—figure supplement 1
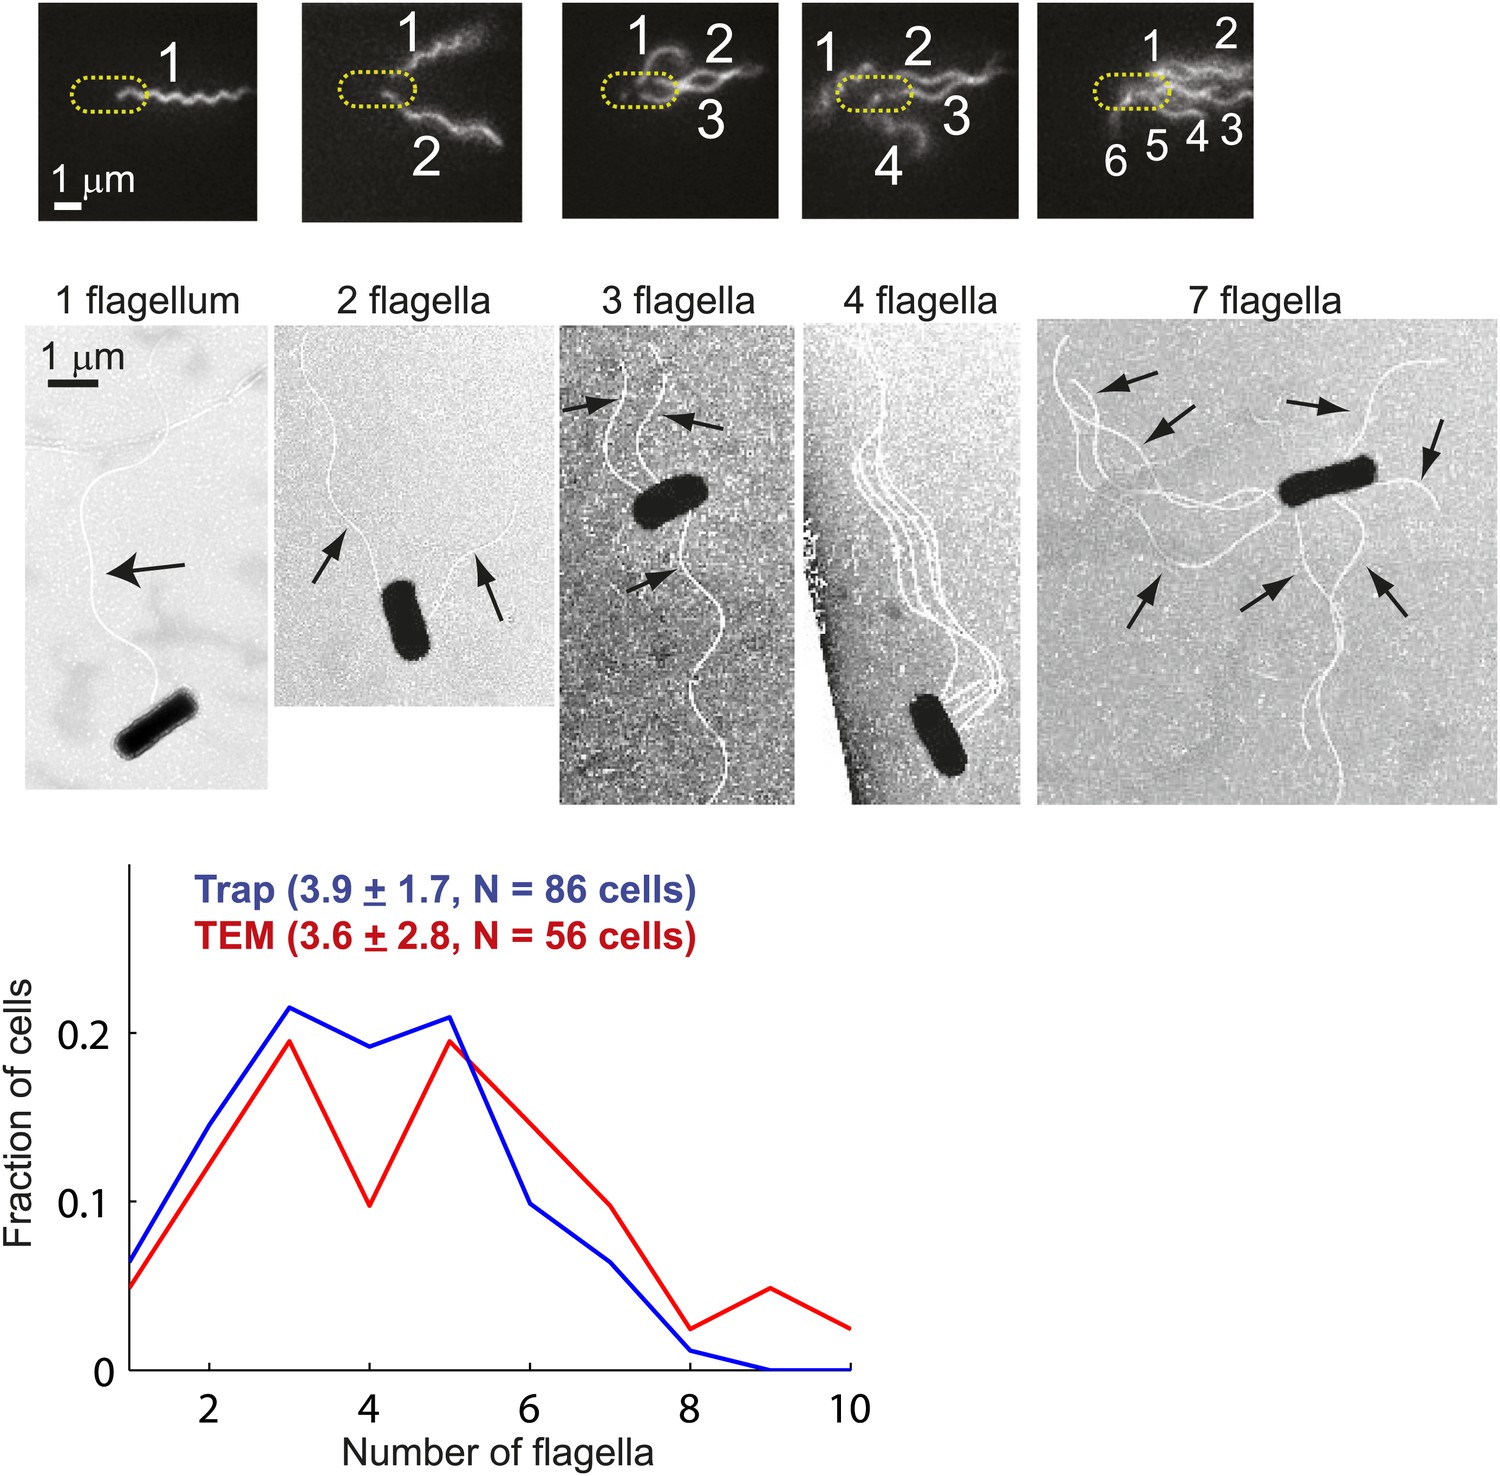
Distribution of flagellar number.
Top, fluorescently-labeled flagella on trapped E. coli cells. Images show cells with 1, 2, 3, 4, and 6 flagella (left to right). The image contrast was adjusted to make flagella more visible (see ‘Materials and methods’ for details on the labeling, imaging and image processing protocols). Middle, transmission electron microscopy (TEM) images of cells possessing 1, 2, 3, 4 and 7 flagella (left to right). The images were enhanced to make flagella more visible (see ‘Materials and methods’ for details of the imaging and image processing). Bottom, distributions of the number of flagella per cell. Cells with zero flagella were excluded because non-swimming cells were not trapped. The distributions from trapped cells (blue, N = 86 cells) and TEM (red, N = 56 cells) have very similar means. Error bars denote SEM.
Figure 1—figure supplement 2
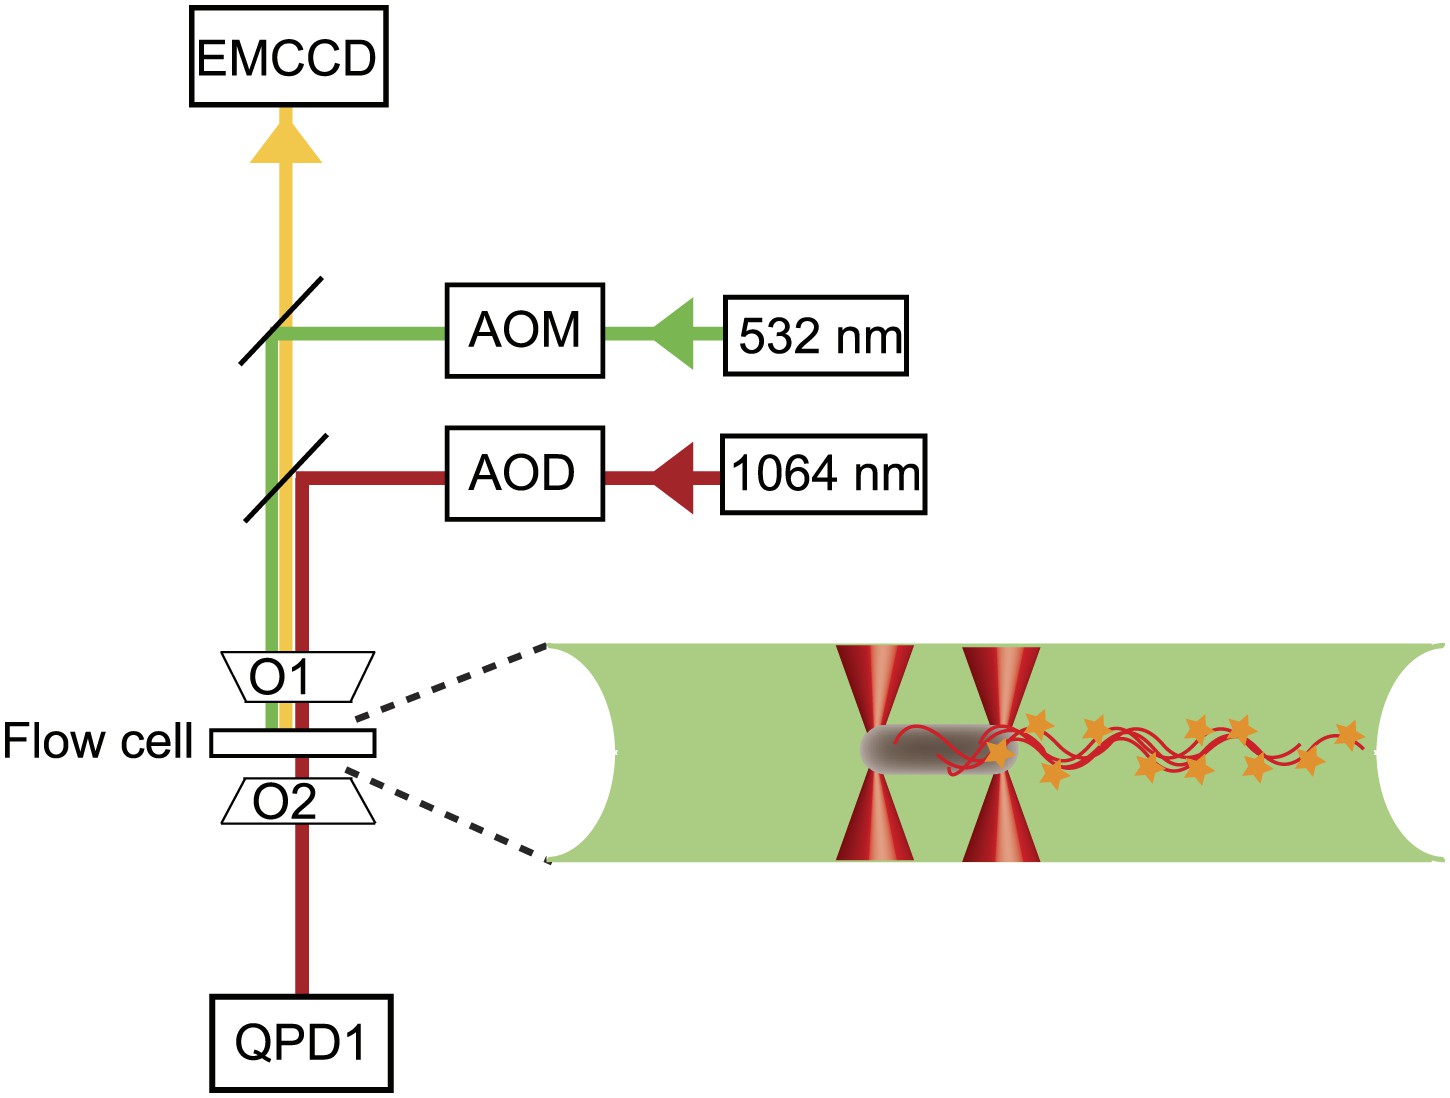
Instrument layout.
Layout of the combined optical trap/epi-fluorescence microscope, showing the 1064-nm trapping laser beam (red), 532-nm fluorescence excitation laser beam (green), fluorescence emission path (yellow), objectives (01 and 02), quadrant photodiode (QPD), and fluorescence imaging, charge-coupled device camera (EMCCD). To the right is a schematic of a cell held by two optical traps (red cones) in the fluorescence excitation volume (green) within the sample chamber.
Figure 1—figure supplement 3
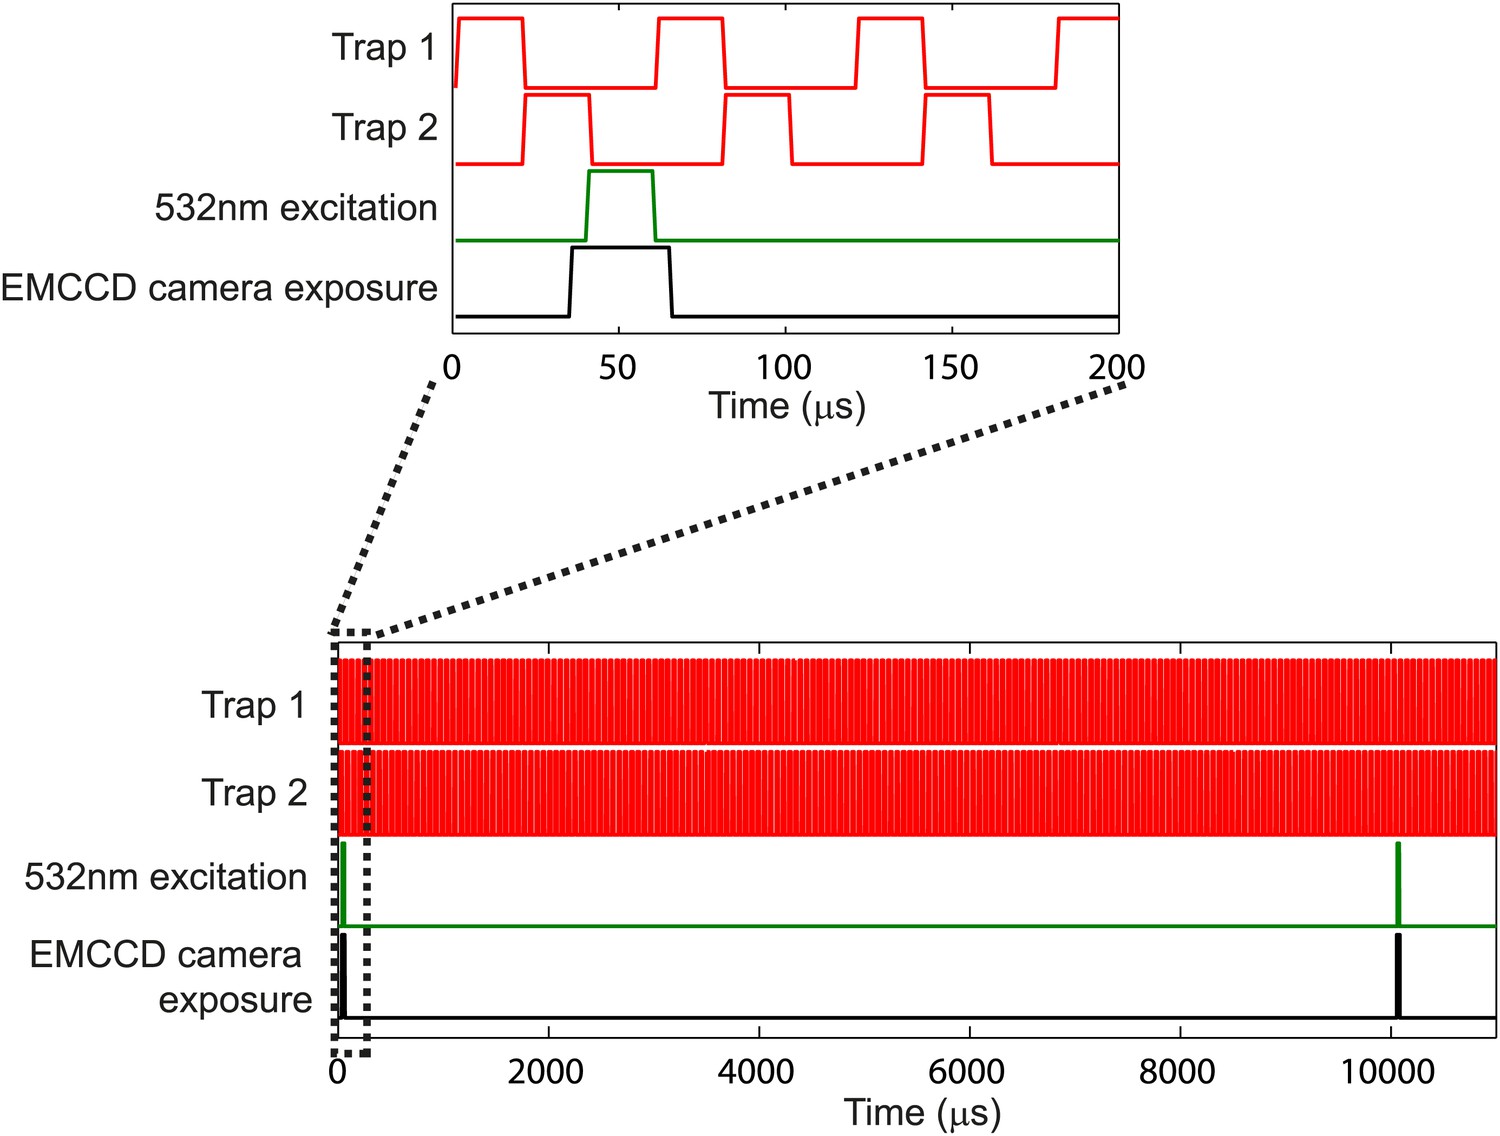
Laser temporal interlacing scheme.
Schematic of the temporal interlacing of the trapping laser (red), excitation laser (green) and camera exposure (black). The 1064-nm trapping laser alternates with the 532-nm fluorescence excitation laser, such that they are never on at the same time. The camera exposure (30-μs exposure) is synchronized with the fluorescence excitation laser for stroboscopic imaging. Lower panel shows the interlacing over a longer time scale. The fluorescence excitation pulse and camera exposure occur once every 10 ms to create movies at 100 fps. See ‘Materials and methods’ for additional details.
Figure 1—figure supplement 4
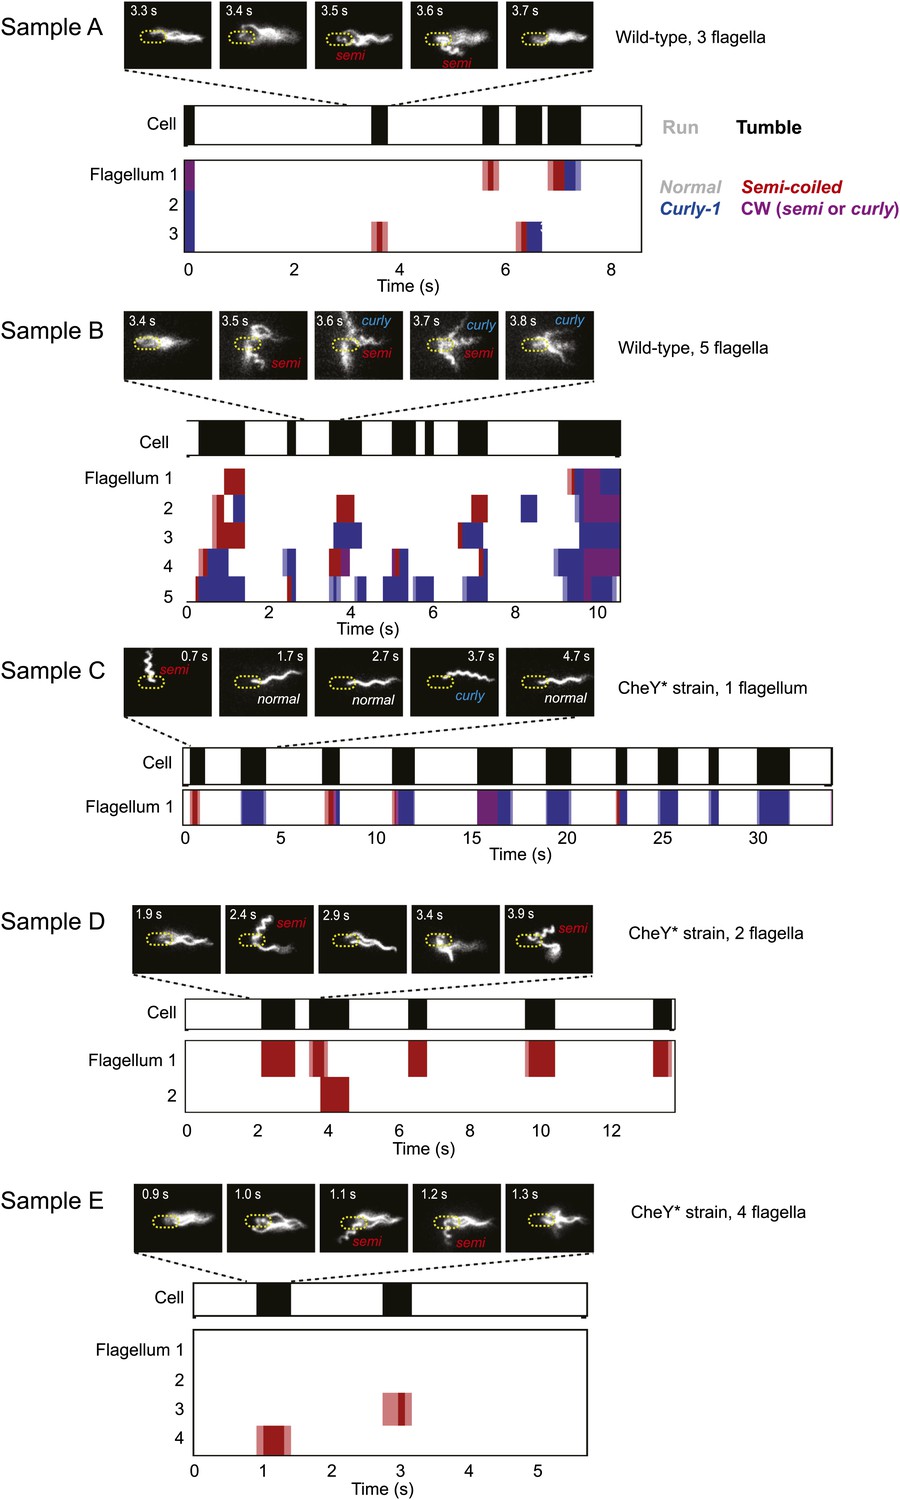
Sample data from representative cells.
Typical data from trapped cells with different numbers of flagella. A few still images (out of hundreds for each sample) of the fluorescently labeled flagella at different time points are shown. In the panels below, colors indicate the swimming state as runs/tumbles (white/black) and flagella waveforms as ‘normal’/‘semi-coiled’/‘curly-1’/‘semi-coiled’ or ‘curly-1’ (white/red/blue/purple). Light colors indicate periods when the flagellum was transitioning between two different waveforms. Light blue indicates a transition between normal and semi-coiled, light red indicates a transition between normal and curly-1. Samples A and B are wild-type cells, samples C–E are CheY* cells.
Figure 1—figure supplement 5
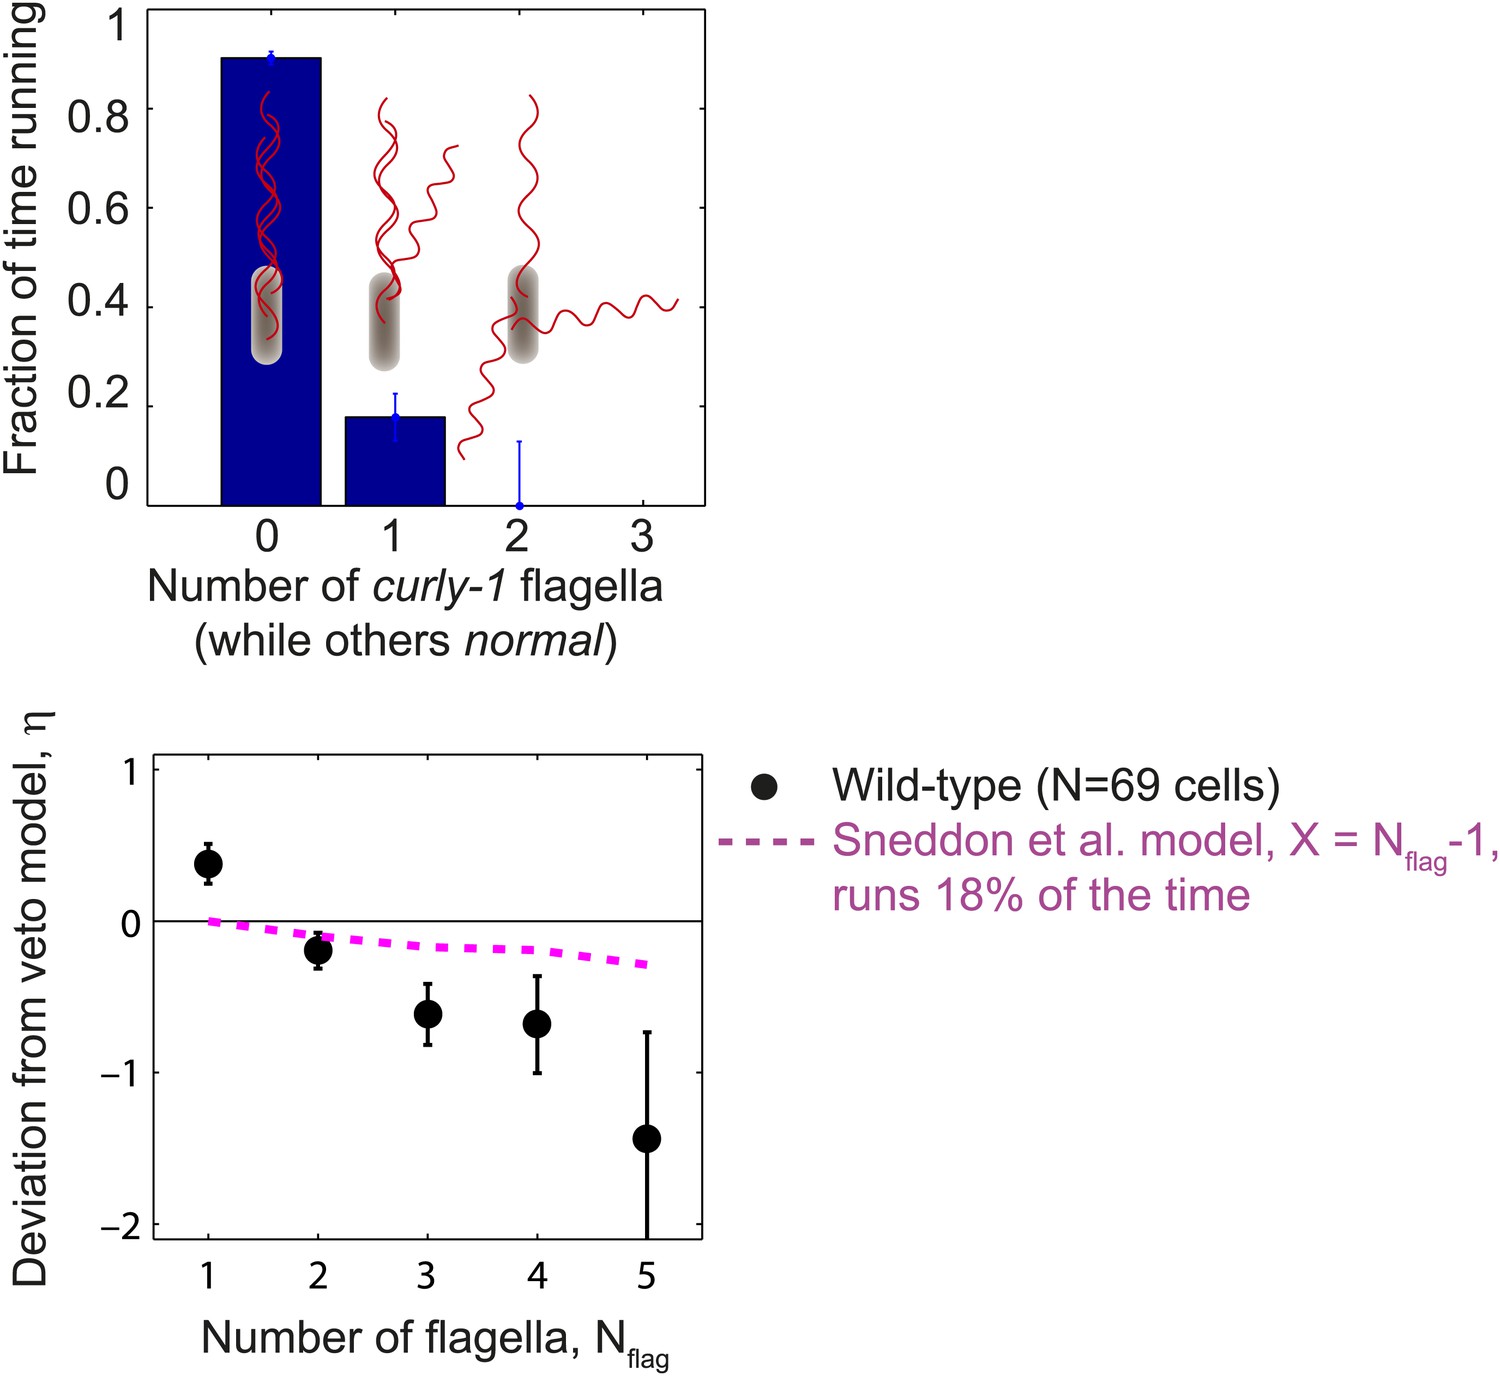
Cells with flagella in the curly-1 state rarely run.
Top, the fraction of time that cells spent running vs the number of flagella that were in the curly-1 waveform (while all other flagella were in the normal waveform). When all flagella were in the normal waveform, cells ran 91% of the time. When the waveform of a single flagellum was curly-1, and the rest were normal, cells ran 18% of the time. Bottom, mean deviation from veto model, η, vs number of flagella per cell. Same as Figure 1E, with an additional theoretical model in which cells run 18% of the time when the waveform of a single flagellum is curly-1 (magenta). Error bars denote SEM.
Figure 2 with 2 supplements
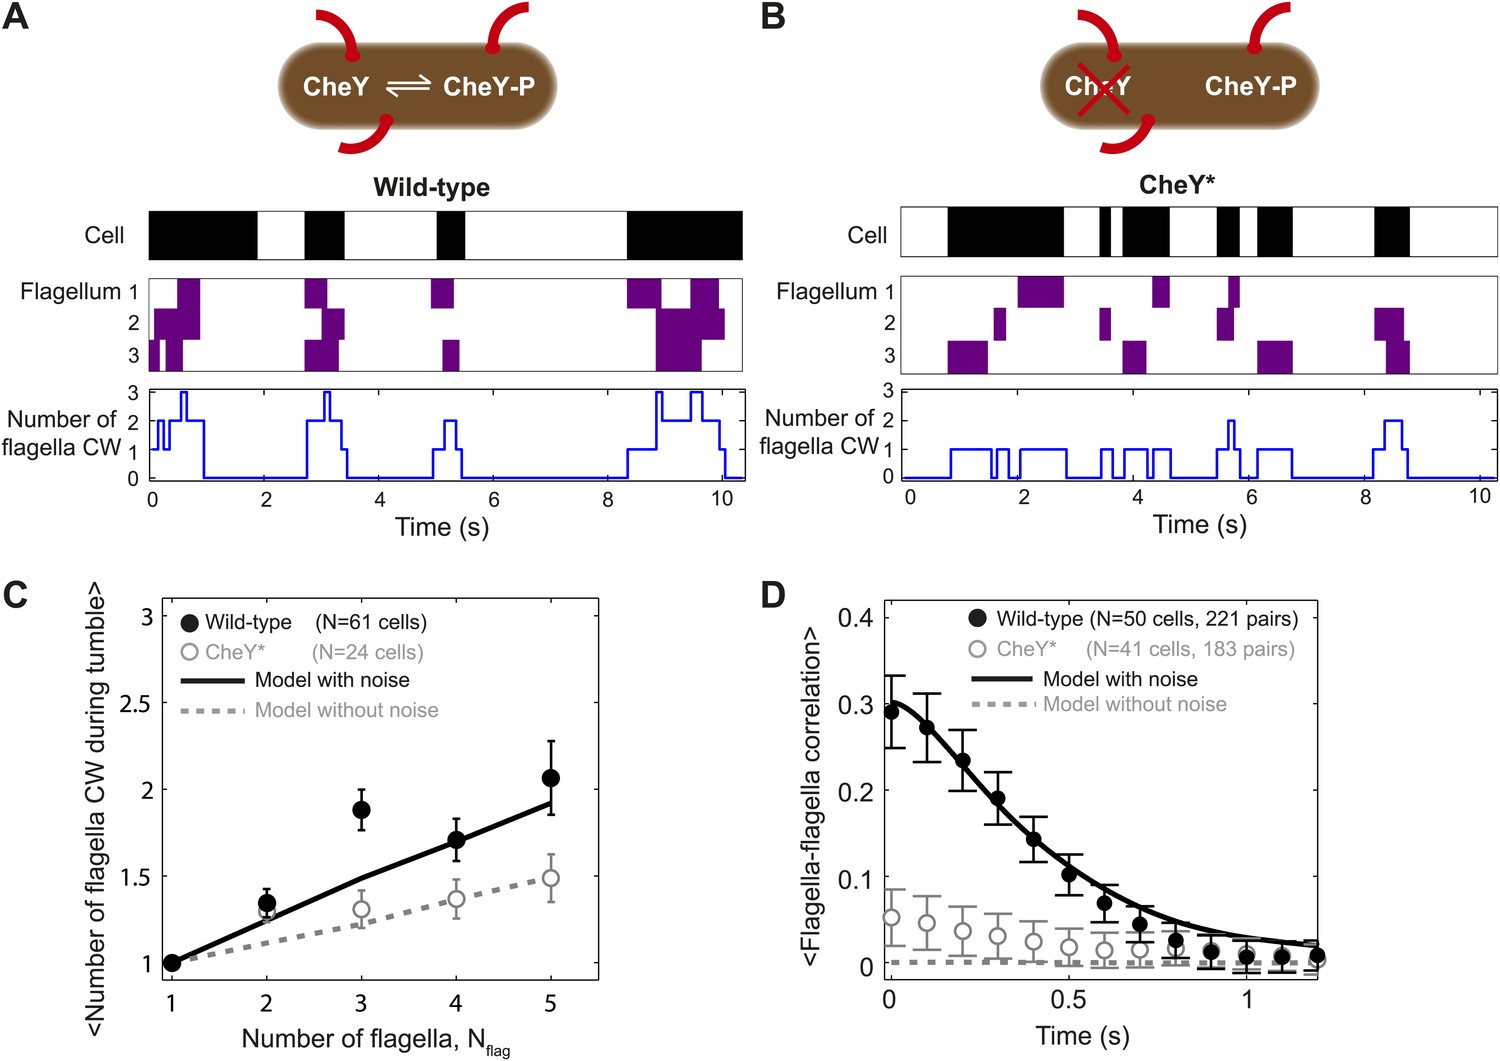
Tumbles in wild-type cells involve multiple CW flagella.
(A) A typical time trace from a wild-type cell with 3 flagella. Colors indicate runs/tumbles (white/black, top) and CCW/CW (white/purple, middle). The blue line (bottom) shows the corresponding number of CW flagella at each time point. (B) Same as (A) for a typical CheY* cell with 3 flagella. (C) Mean of the maximum number of CW flagella during a tumble vs number of flagella per cell. Consistently more flagella are CW during tumbles in the wild-type (black circles; N = 61 cells) compared to the CheY* strain (open gray circles; N = 24 cells). Simulations incorporating fluctuations in CheY-P (black line) and without fluctuations (gray dashed lines) reproduce the observed trends (simulations detailed in the text and Figure 4). (D) Cross-correlation between flagella pairs, averaged over all pairs and all cells. Wild-type (black circles) match simulations with fluctuations in CheY-P (black line). CheY* strain (open gray circles) matches simulations without fluctuations in CheY-P (gray dashed line), which exhibit almost no correlation. Error bars denote SEM. See ‘Materials and methods’ for more details.
Figure 2—figure supplement 1
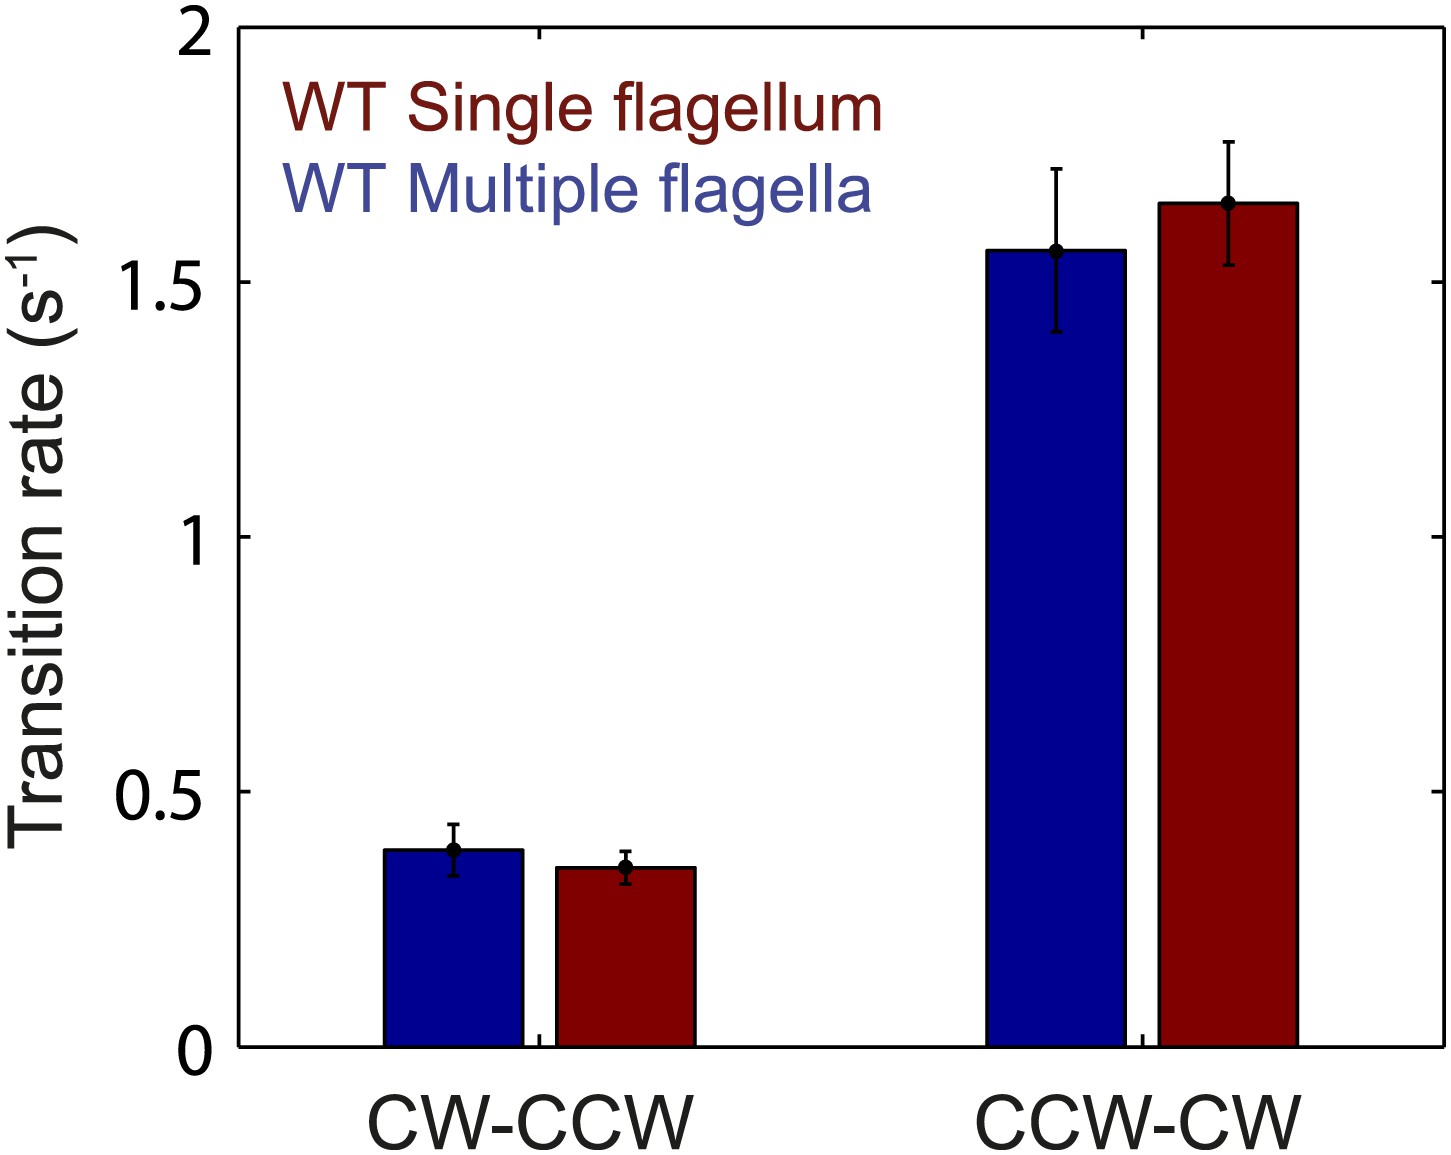
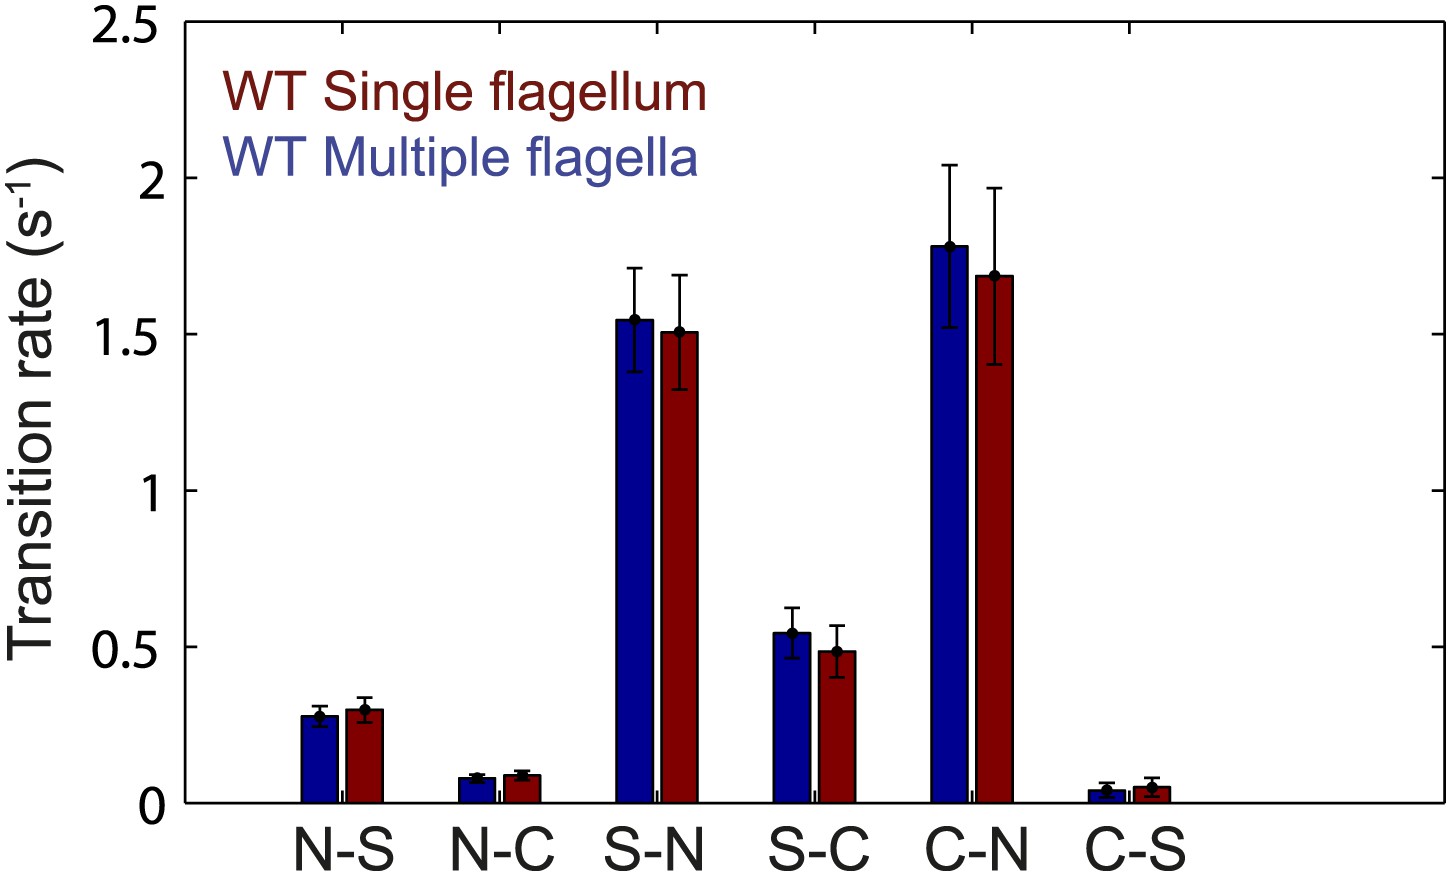
Flagellar transition rates vs number of flagella per cell.
Flagella motor transition rates, separated into two groups corresponding to cells with a single flagellum (red) and cells with multiple flagella (blue). All data from wild-type cells (N = 52 cells). Error bars denote SEM.
Figure 2—figure supplement 2
Flagellar transition rates vs number of flagella per cell.
Transitions between the three observed flagella waveforms (normal, semi-coiled and curly-1), separated into two groups corresponding to cells with a single flagellum (red) and cells with multiple flagella (blue). All data from wild-type cells (N = 52 cells). Error bars denote SEM.
Figure 3 with 1 supplement
Wild-type behavior matches the veto model for cells with a lower effective number of flagella.
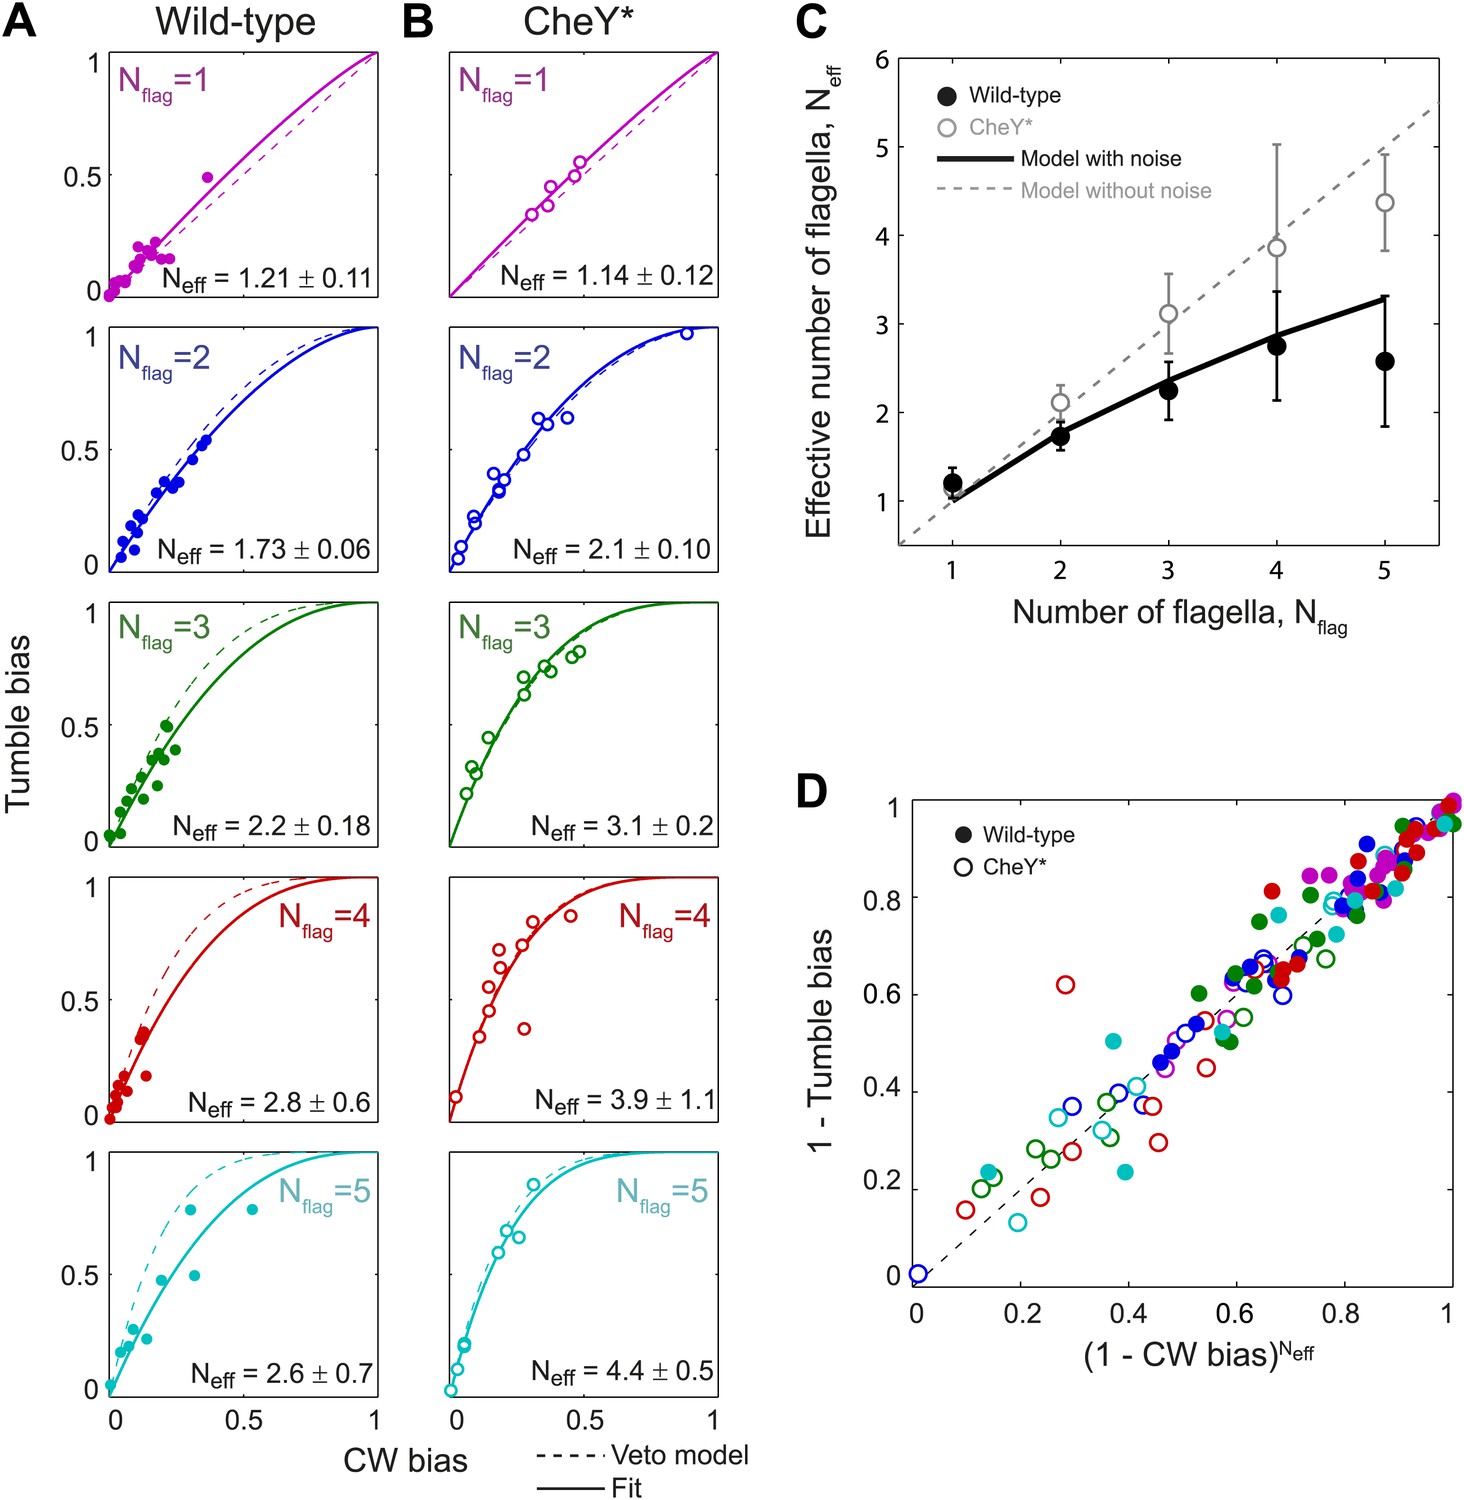
(A) Tumble bias vs CW bias for individual wild-type cells (N = 69), plotted separately for different numbers of flagella per cell (Nflag = 1, purple; 2, blue; 3, green; 4, red; 5, cyan). The prediction from the veto model in Equation (1) (dashed lines) does not match the data for cells with multiple flagella (R2 = 0.88, 0.60, 0.41, 0.39 for Nflag = 2, 3, 4, 5). The data were fit (solid lines) to Equation (1), while allowing the number of flagella to be used as a fitting parameter, Neff. Error bars denote SD. (B) Same as (A) for CheY* (open circles, same color code as [A] N = 46 cells). The veto model prediction (dashed lines) matches the data well (R2 = 0.91, 0.97, 0.93, 0.67, 0.98 for Nflag = 1, 2, 3, 4, 5). Fits (solid lines) yield Neff values almost identical to Nflag. (C) Fitted Neff values vs number of flagella per cell for wild-type (black circles) and CheY* (open gray circles) cells. Simulations (described in the text) reproduce the observed trends. (D) Data points from individual wild-type (solid circles) and CheY* (open circles) cells all collapse onto a single line when using Neff from fits to wild-type data in (A) and the actual flagellar number Nflag for CheY* cells in (B). Error bars denote SEM. See ‘Materials and methods’ for more details.
Figure 3—figure supplement 1
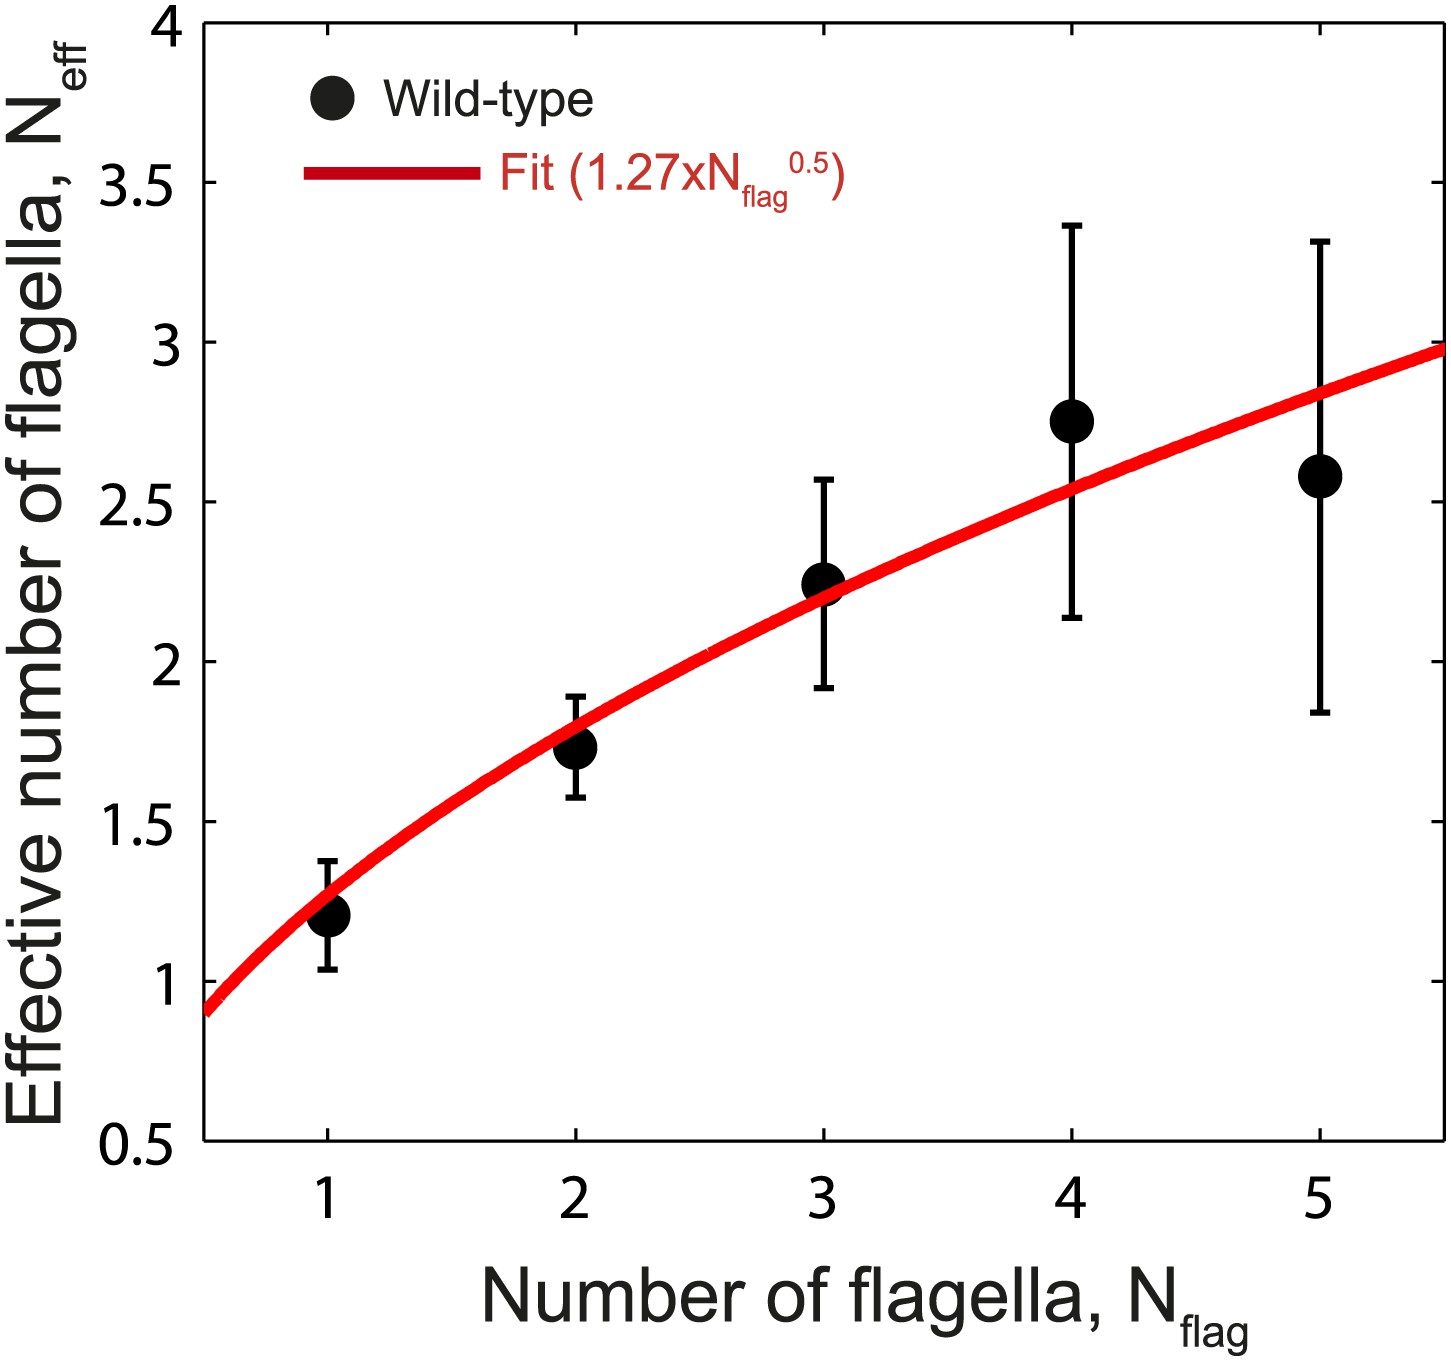
Fit to Neff vs Nflag.
Data points show fitted Neff values vs number of flagella per cell for wild-type cells as in Figure 3C. The data was fit empirically to a power law (red line) given by Neff = 1.27 × Nflag0.5.
Figure 4 with 4 supplements
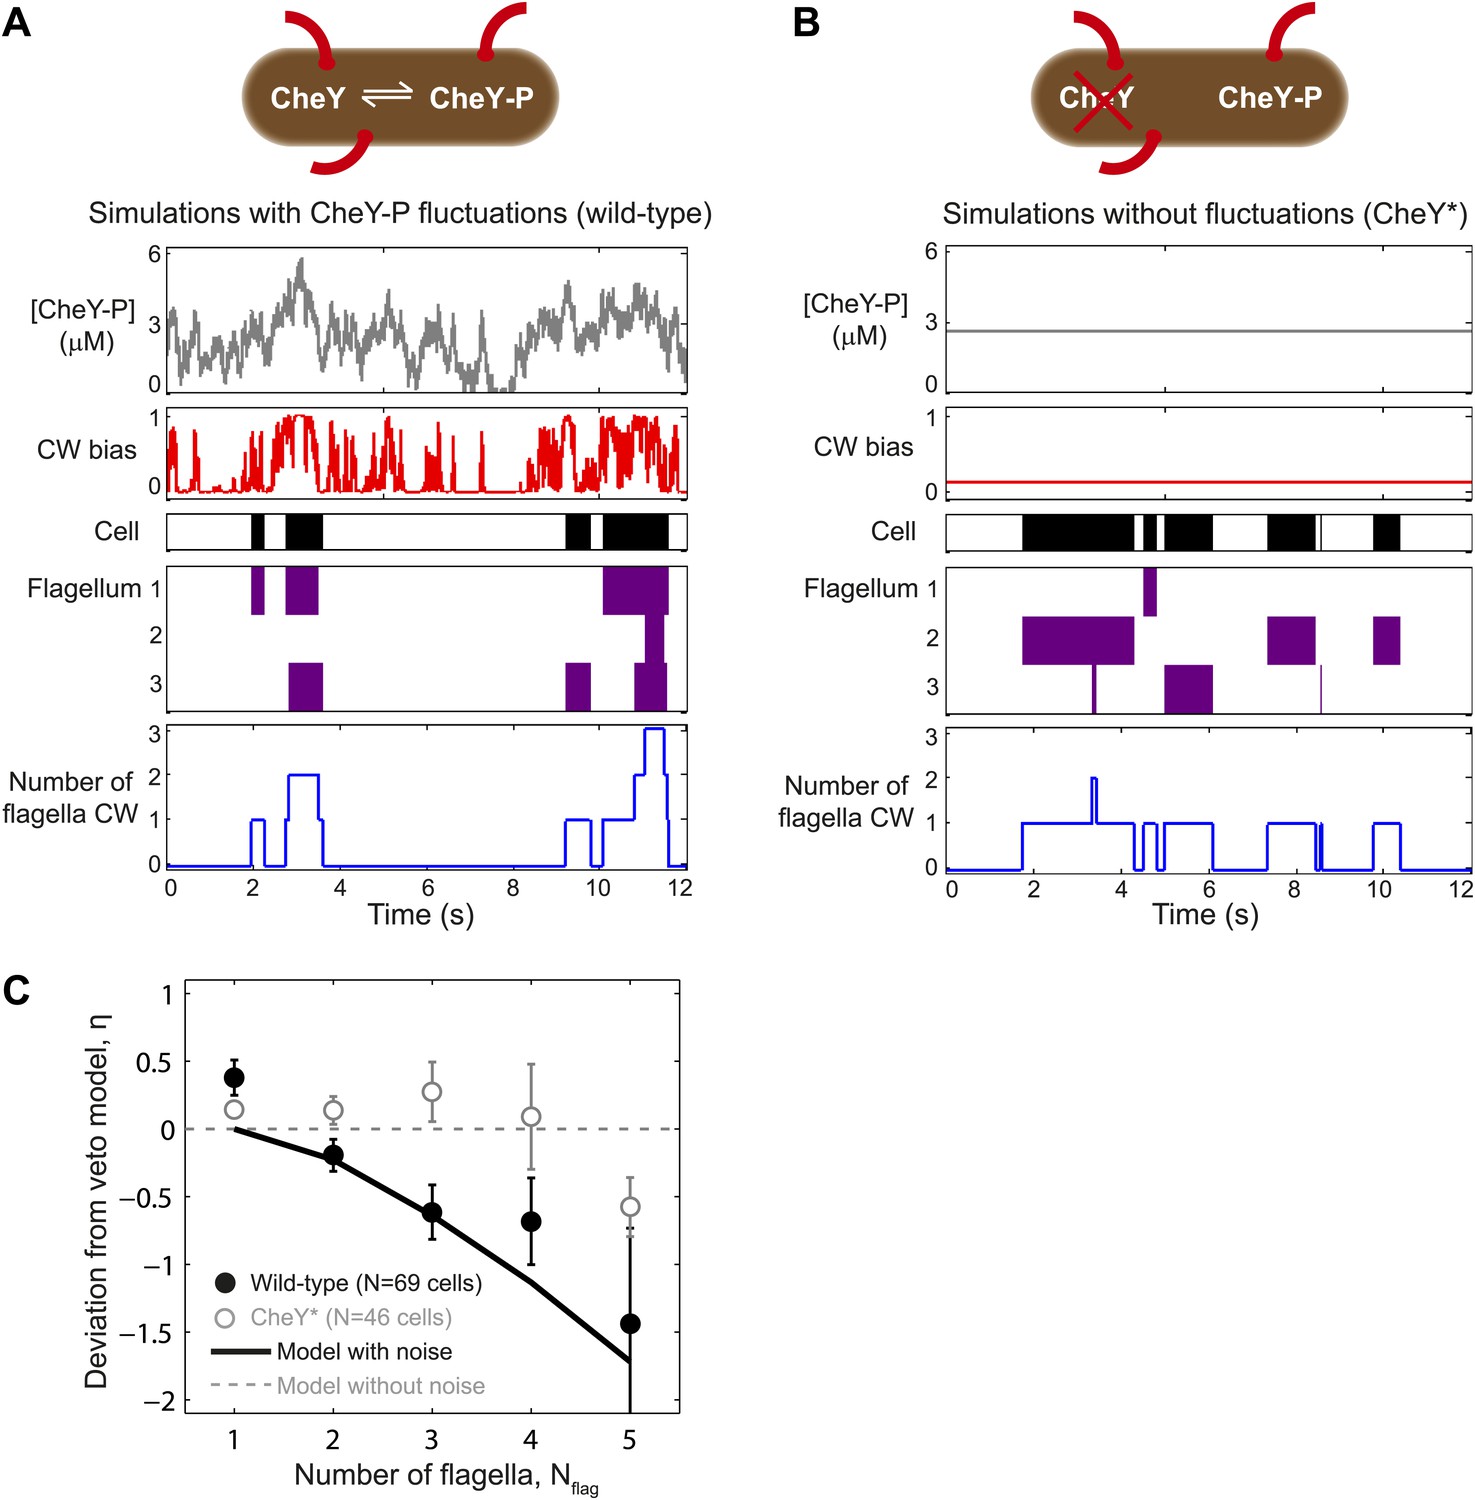
A theoretical model incorporating CheY-P fluctuations reproduces wild-type data.
(A) Simulated time trace for a wild-type cell. Representative simulated time trace of CheY-P concentration (gray line, top), CW bias (red), run/tumble state (white/black), CCW/CW flagellar rotational direction (white/purple) and number of CW flagella (blue line, bottom) for a cell with 3 flagella. CheY-P simulation parameters are described in the text and in Table 3. (B) Same as (A) from a simulated CheY* cell, in which CheY-P concentration (gray line) does not fluctuate. (C) Deviation from veto model. The theoretical model that includes CheY-P concentration fluctuations (black line) reproduces the wild-type data (black circles). A simple veto model with constant CheY-P concentration (gray dashed line) reproduces the CheY* data (open gray circles). Error bars denote SEM. See ‘Materials and methods’ for more details.
Figure 4—figure supplement 1
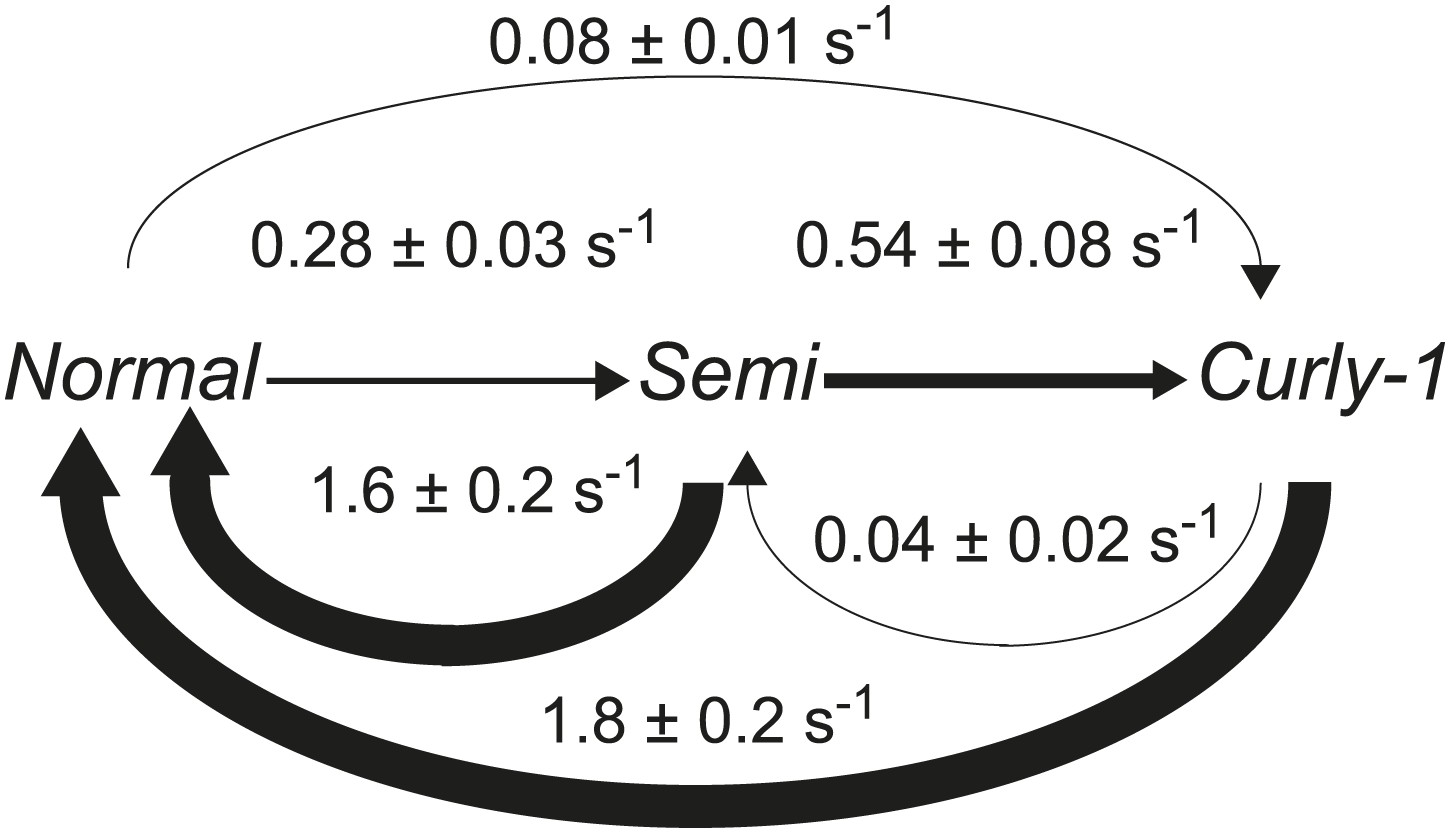
Flagellar waveform transition rates.
Diagram of the transitions rates between different flagellar waveforms: normal (CCW), semi-coiled and curly-1 (both CW). Data from wild-type cells (N = 52 cells, 203 tumbles). Values are mean ± SEM. Arrow thickness is proportional to the transition rate.
Figure 4—figure supplement 2
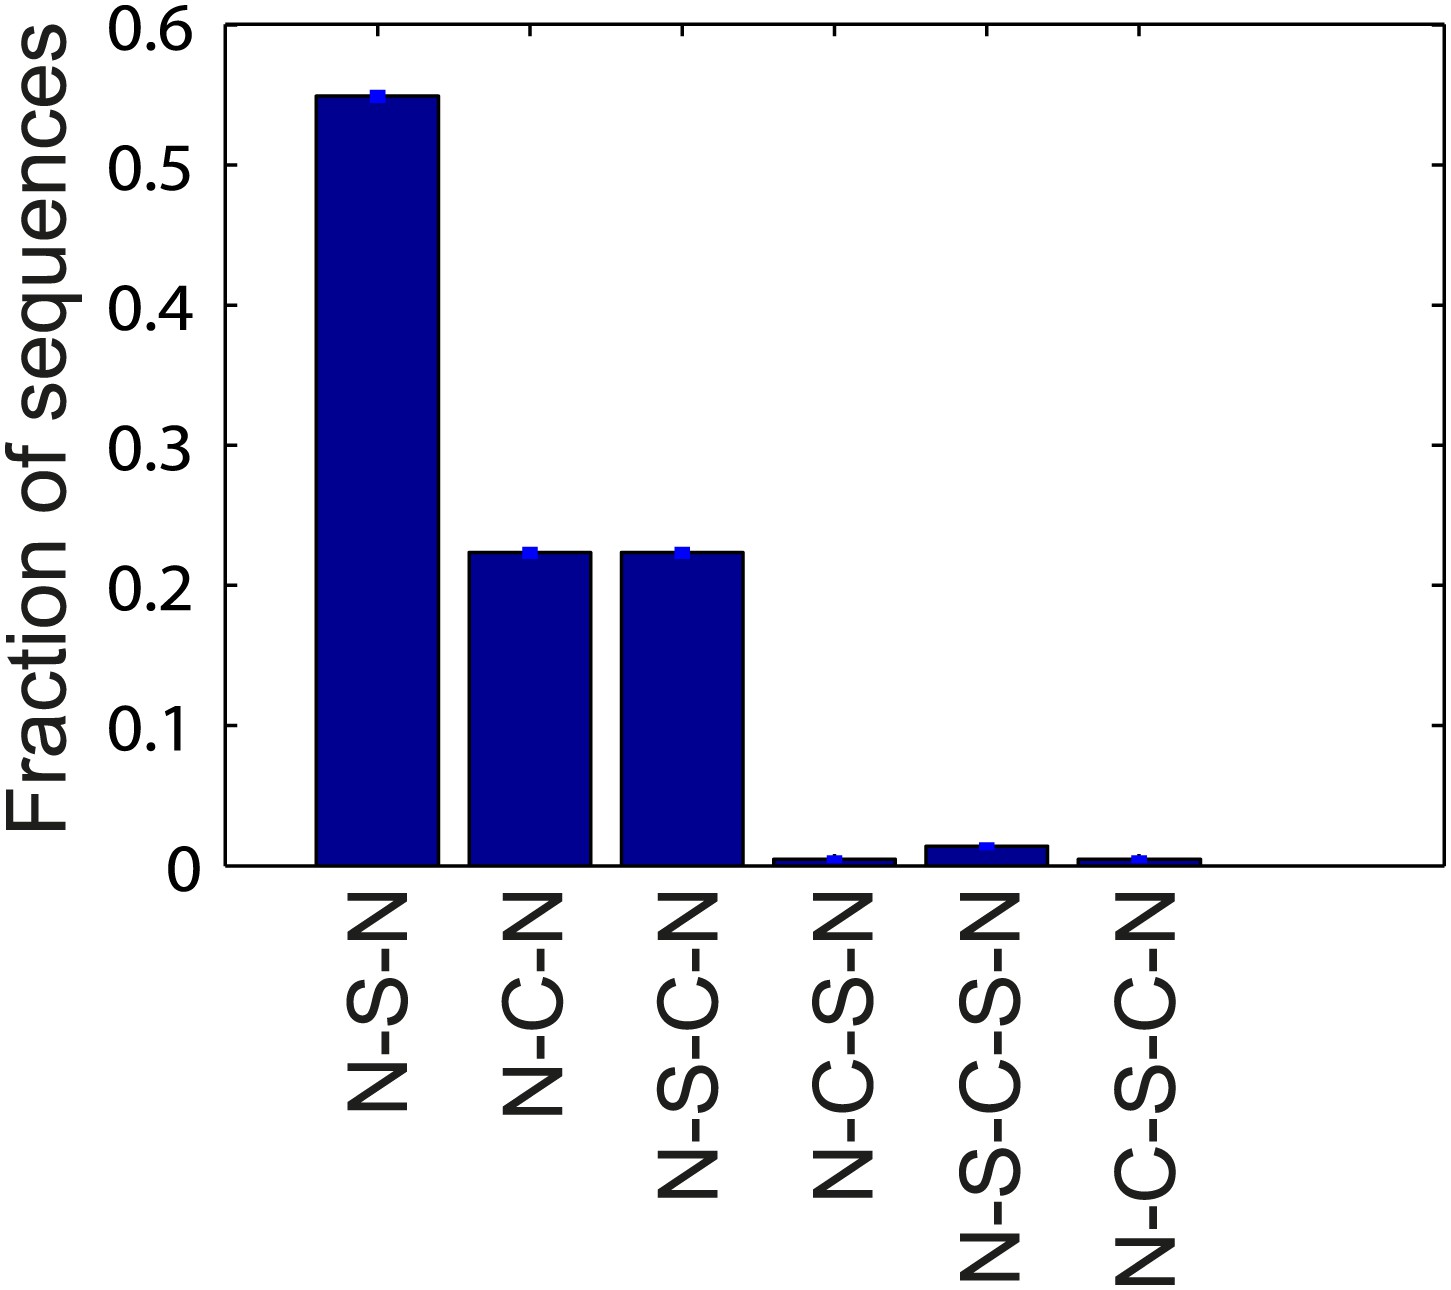
Flagellar waveform transition sequences.
Histogram of the sequence of flagellar waveforms when flagella motor rotation switches from CW to CCW (N = normal, S = semi-coiled, C = curly-1). Note that prior to CW rotation all flagella had the normal waveform. The majority of CCW-to-CW switches caused flagella to transition to the semi-coiled waveform (77%, 164/213 of all flagellar switching events). Of those flagella, most remained semi-coiled until the motor returned to CCW (71%, 117/164), while some instead transitioned to the curly-1 waveform (29%, 47/164). Some fraction of flagella (22%, 47/213) also skipped the semi-coiled waveform altogether and transitioned immediately from CCW to curly-1. Those flagella never switch to the semi-coiled state.
Figure 4—figure supplement 3
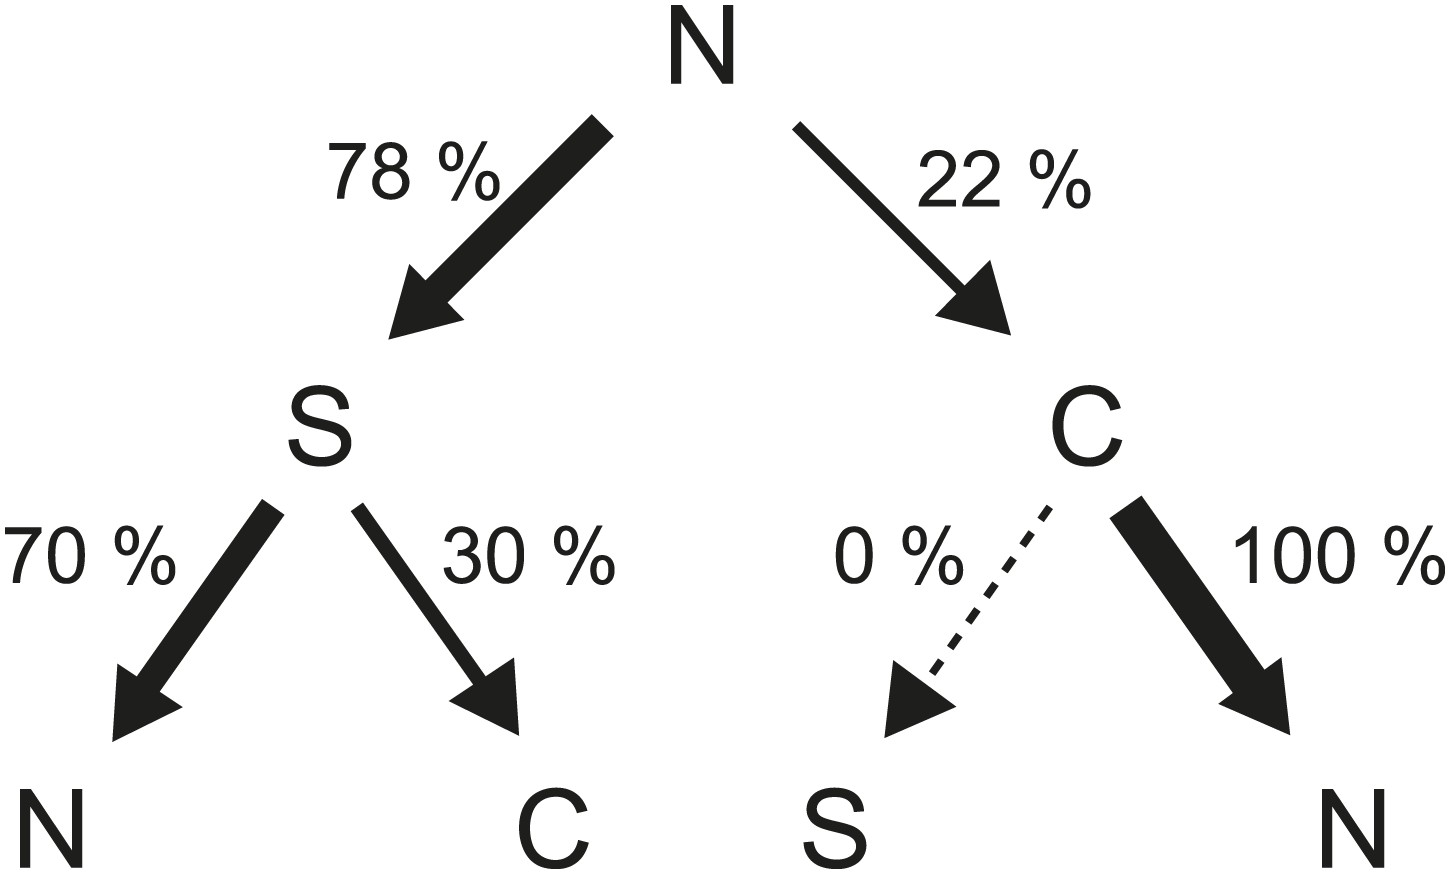
Flagellar waveform transition sequences.
Decision tree showing the probability of each sequence of flagellar waveforms when flagella switch from CCW to CW rotation (N = normal, S = semi-coiled, C = curly-1). Arrow thickness is proportional to the probability of a specific transition.
Figure 4—figure supplement 4
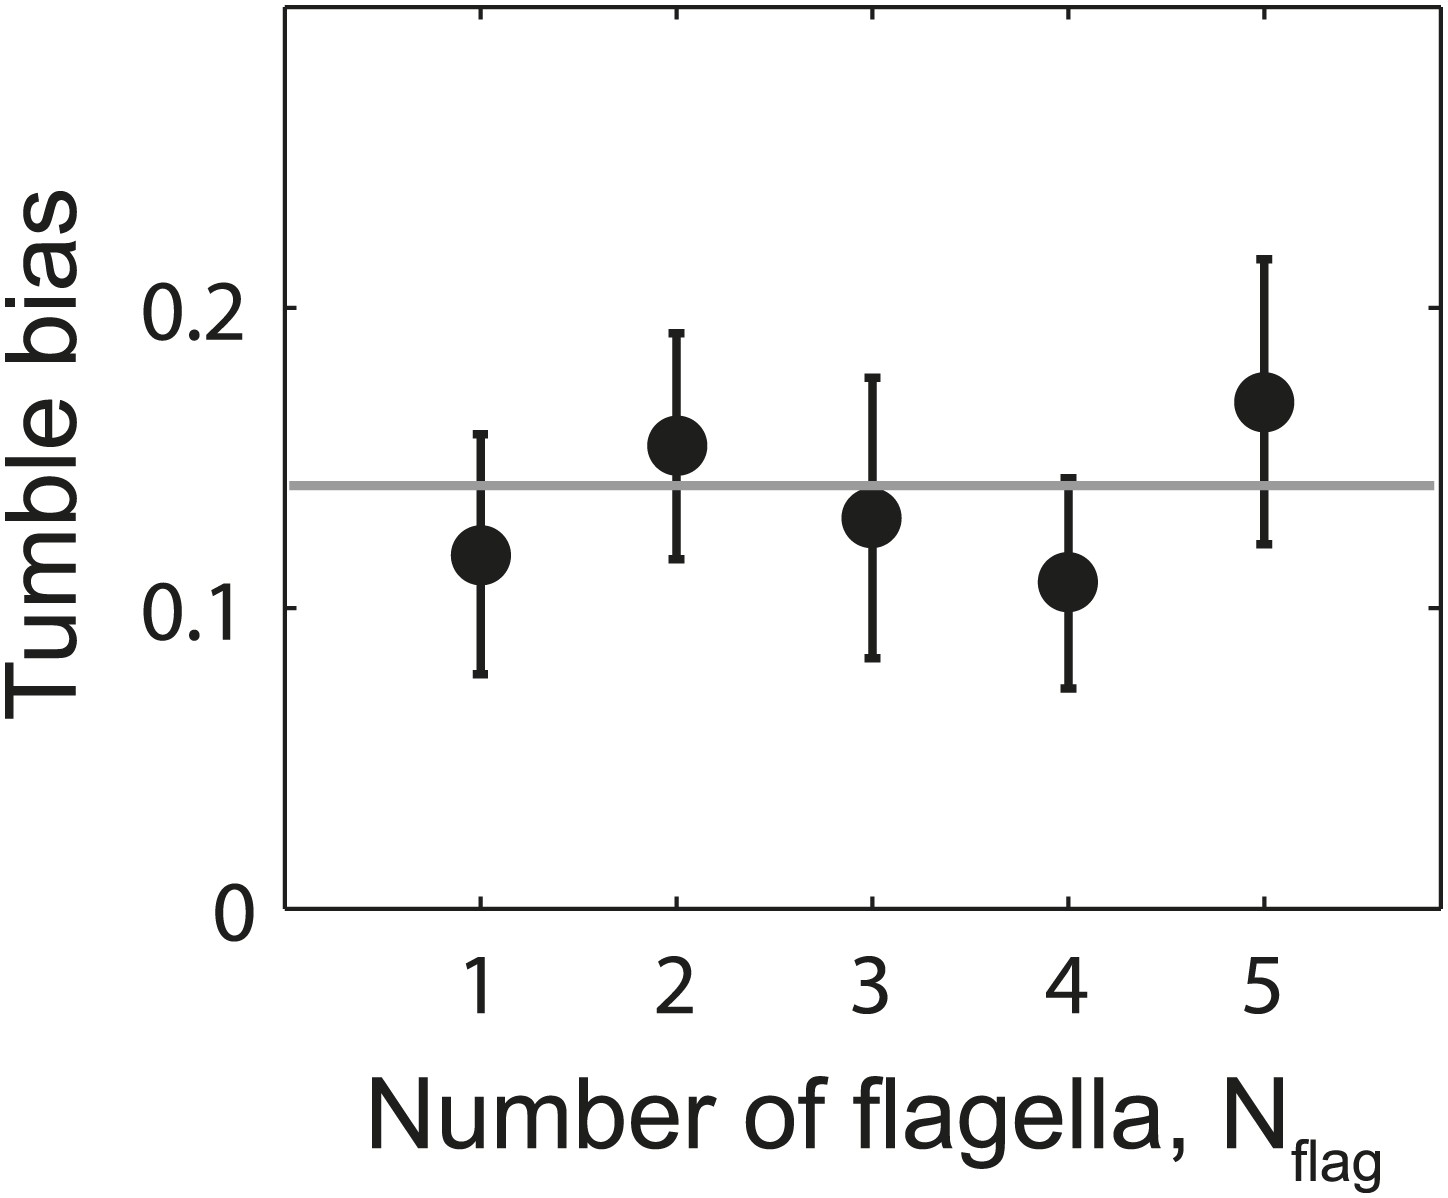
Tumble bias vs number of flagella per cell.
Mean tumble bias of wild-type cells vs number of flagella per cell. Data were filtered to exclude outliers with a CW bias outside the range of 0–0.25 (N = 61 cells remaining). Gray line shows the mean tumble bias from all cells. Error bars denote SEM.
Videos
Video 1
Video of trapped wild-type cell with three labeled flagella as it runs and tumbles.
Slow motion video of the wild-type cell in Figure 1C with three long, fluorescently labeled flagella. The approximate location of the unlabeled cell body is indicated by the dotted line. The trap signal used to determine runs and tumbles (bottom, scrolling blue curve) measures the position of the cell body in the trap as it rotates. At the beginning of the video (time stamp = 2.4 s), all three flagella are in a bundle and the cell is running. One by one, the flagella switch to CW rotation (2.7–3.0 s), which disrupts the bundle and causes the cell to tumble. Flagella can be observed in all three waveforms, normal, semi-coiled, and curly-1. Near the end of the video, the flagella all return to CCW rotation and coalesce into a bundle, causing the cell to resume running (3.4 s). In addition to the three long flagella, a short flagellar stub is visible. The stub does not affect the swimming behavior and is not analyzed. Scale bar in bottom left corner is 1 µm. Frames were recorded at 400 frames per second, video shows every other frame at 20 frames per second.
Video 2
Video of trapped CheY* cell with two labeled flagella as it runs and tumbles.
Slow motion video, similar to Video 1, of a trapped CheY* cell with two fluorescently labeled flagella. Still images from this cell are shown in Figure 1—figure supplement 4, sample D. The approximate location of the unlabeled cell body is indicated by the dotted line. At the beginning of the video (time stamp = 7.4 s), both flagella are in a bundle, rotating CCW in the normal waveform, and the cell is running. At 7.6 s, one flagellum switches to CW rotation and transitions to the semi-coiled waveform, which disrupts the bundle and causes the cell to tumble. At the 8.5 s, the semi-coiled flagellum returns to CCW rotation and both flagella coalesce into a bundle, causing the cell to resume running. Scale bar in bottom left corner is 1 µm. Frames were recorded at 100 frames per second, video plays at 20 frames per second.
Tables
Table 1
Strains and plasmids used in this work
| Strain | Genotype | Comments | Source |
|---|---|---|---|
| HCB1660 | fliC::Tn5 (KanR) | ‘wild type’ Contains plasmid pBAD33-fliCS219C | (Turner et al., 2010) Gift of H Berg |
| PM87 | cheBYZ::FRT, fliC::Tn5 (KanR) | ‘CheY*’ Contains plasmids pMS164 and pPM5 | This study |
| RP437 | Wild-type for chemotaxis | (Parkinson and Houts, 1982) | |
| SK109 | cheBYZ::Cm | This study | |
| SK110 | cheBYZ::FRT | This study | |
| SK112 | cheBYZ::FRT, fliC::Tn5 (KanR) | This study | |
| Plasmids | |||
| pBAD33 fliCS219C | fliCS219C under ParaBAD promoter, CmR, p15a origin | Expresses mutant version of FliC for fluorescent labeling | (Turner et al., 2010) Gift of H Berg |
| pPM5 | fliCS219C under ParaBAD promoter, AmpR, colE1 origin | Expresses mutant version of FliC for fluorescent labeling | This study |
| pMS164 | cheYD13K under PlacOP promoter, CmR, pSC101 origin | Expresses constitutively active version of CheY | (Alon et al., 1998) Gift of P Cluzel |
| pDK46 | Helper plasmid | (Datsenko and Wanner, 2000) | |
| pKD3 | Template for CmR cassette | (Datsenko and Wanner, 2000) | |
| pCP20 | Helper plasmid | (Cherepanov and Wackernagel, 1995) |
Table 2
Primers used in this work
| Primer | Sequence | Comments |
|---|---|---|
| SK140F | TGCGTGGTCAGACGGTGTATGCGCTAAGTAAGGATTAACG GTGTAGGCTGGAGCTGCTTC | cheBYZ deletion forward |
| SK140R | GCCTGATATGACGTGGTCACGCCACATCAGGCAATACAAA CATATGAATATCCTCCTTAG | cheBYZ deletion reverse |
| SK141F | CCTTAAACCCGACGGATTGC | cheBYZ deletion check forward |
| SK141R | TTGCTGCCACACATCAAGC | cheBYZ deletion check reverse |
| SK163F | AGGGTTATTGTCTCATGAGC | pZE11 sequencing forward |
| SK163R | GTTTTATTTGATGCCTCTAG | pZE11 sequencing reverse |
| PM7F | GGG GACGTC ATCGATGCATAATGTGCCTG | amplify ParaBAD fliCS219C forward |
| PM7R | GGG GTCGAC TTAACCCTGCAGC | amplify ParaBAD fliCS219C reverse |
Table 3
Model parameters
| Parameter | Description | Value | Source |
|---|---|---|---|
| kccw->cw | Motor switching rate from CCW→CW | 0.26 s−1 | Our data |
| kcw->ccw | Motor switching rate from CW→CCW | 1.7 s−1 | Our data |
| CB | Average clock-wise bias of wild-type motors | 0.13 | Our data |
| <Y> | Mean concentration of CheY-P | 2.59 µM | Fit to our data |
| ω | Characteristic motor switching time | 0.5 s | Our data |
| λ−1 | Transition rate from semi-coiled to curly-1 state | 0.68 s−1 | Our data |
| x | From the model in Sneddon et al.; number of flagella that must be normal for a run to occur (while other flagella are curly-1) (Sneddon et al., 2012) | Nflag (variable in Figure 1—figure supplement 5) | Our data |
| σ2 | Variance in [CheY-P] | 1.0 µM2 | Fit to our data |
| τ | Characteristic time-scale of fluctuations in [CheY-P] | 0.2 s | Fit to our data |
| Kd | Midpoint of CW bias vs CheY-P response curve | 3.1 µM | (Cluzel et al., 2000) |
| H | Hill coefficient for CW bias vs CheY-P response curve | 10.3 | (Cluzel et al., 2000) |
| dt | Simulation time steps | 0.001 s | – |
-
Note:
Table 4
Flagella waveform transition rates
| Initial | Final | ||
|---|---|---|---|
| Normal | Semi-coiled | Curly-1 | |
| Normal | 0.28 ± 0.03 s−1 | 0.08 ± 0.01 s−1 | |
| Semi-coiled | 1.6 ± 0.2 s−1 | 0.54 ± 0.08 s−1 | |
| Curly-1 | 1.8 ± 0.2 s−1 | 0.04 ± 0.02 s−1 | |
-
Transition rates between different flagellar waveforms: normal (CCW), semi-coiled and curly-1 (both CW). Data from wild-type cells (N = 52 cells, 203 tumbles). Values are mean ± SEM.
Download links
A two-part list of links to download the article, or parts of the article, in various formats.
Downloads (link to download the article as PDF)
Open citations (links to open the citations from this article in various online reference manager services)
Cite this article (links to download the citations from this article in formats compatible with various reference manager tools)
Escherichia coli swimming is robust against variations in flagellar number
eLife 3:e01916.
https://doi.org/10.7554/eLife.01916


