RGS7/Gβ5/R7BP complex regulates synaptic plasticity and memory by modulating hippocampal GABABR-GIRK signaling
- The Scripps Research Institute, United States
- Universidad de Castilla-La Mancha, Spain
- University of Minnesota, United States
Figures
Figure 1
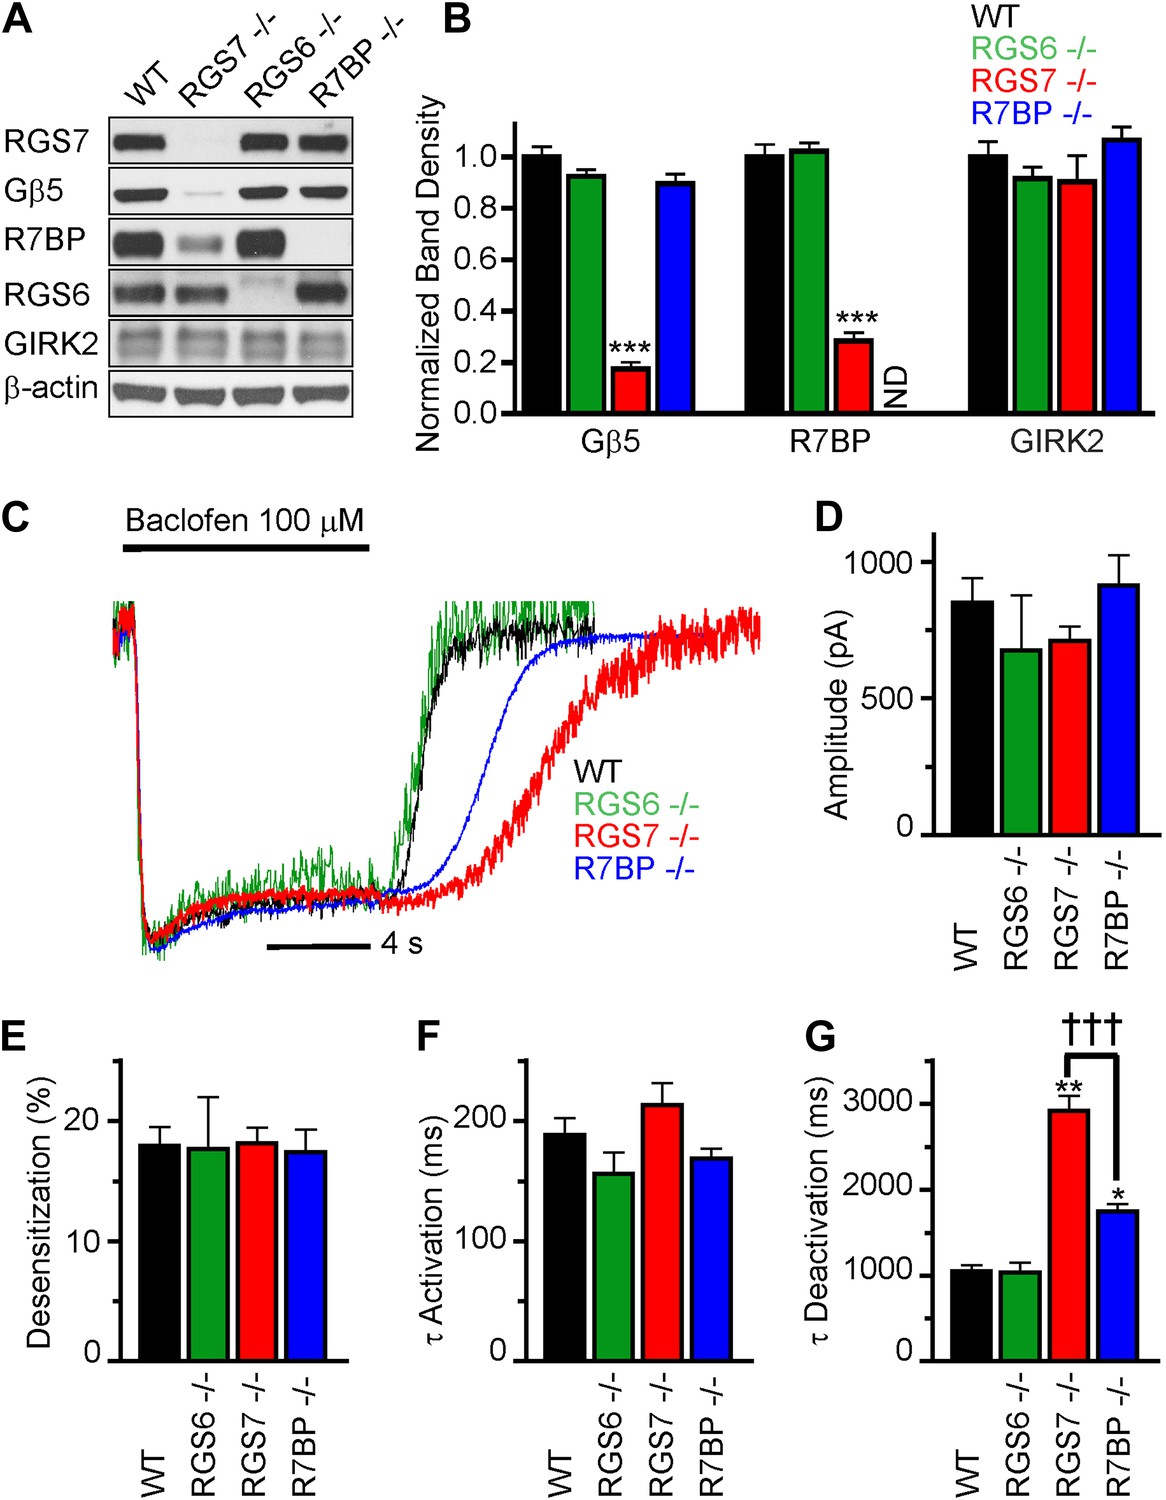
RGS7 and R7BP modulate GABABR-GIRK signaling in cultured hippocampal neurons.
(A) Western blot analysis of protein expression in hippocampi extracted from wild-type (WT) mice, or mice lacking RGS7 (Rgs7−/−), RGS6 (Rgs6−/−) or R7BP (R7bp−/−). (B) Quantification of Western blotting data, with protein levels arrayed as a function of genotype, ***p<0.01, One-Way ANOVA n = 3 mice. ND-undetectable. (C) Representative normalized traces of GIRK currents evoked by a saturating concentration of the GABABR agonist baclofen (100 µM). (D–E) Rgs6, Rgs7, and R7bp knockouts do not affect GIRK current amplitudes (D), desensitization (E) and current onset kinetics (F) evoked by 100 μM Baclofen. p>0.05, One-Way ANOVA, n = 8–29 cells for each genotype. (G) Current deactivation rate following removal of baclofen was slower in neurons from Rgs7−/− and R7bp−/− mice as compared to WT controls, *p<0.05 and **p<0.01 vs WT, †††p<0.001 Rgs7−/− vs R7bp−/−. One-Way ANOVA, Bonferroni’s post hoc test, n = 8–29 cells.
Figure 2
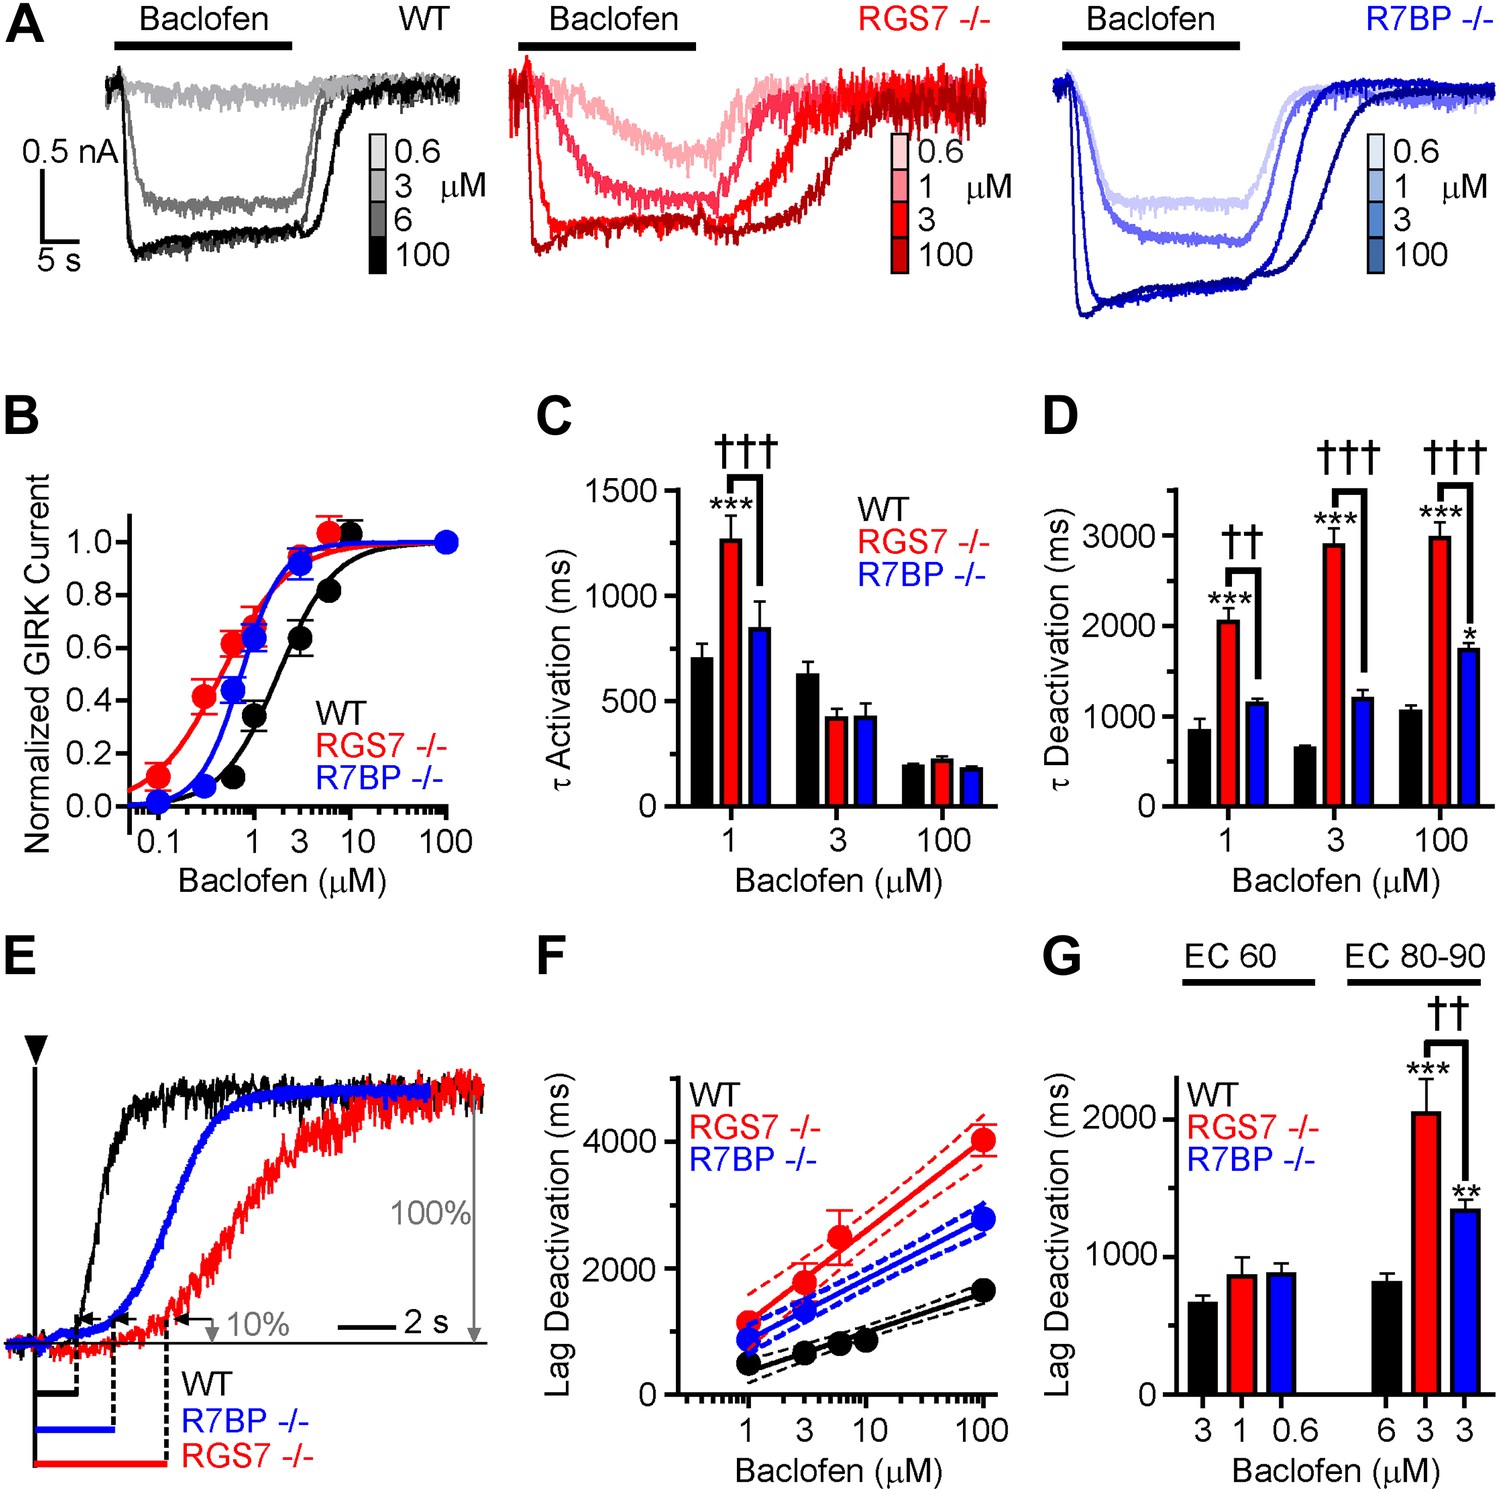
Timing and sensitivity of GABABR-GIRK signaling is differentially controlled by RGS7 and R7BP.
(A) Representative traces of GIRK currents evoked by increasing concentrations of baclofen. (B) Dose-response curves fit by Hill equation. EC50 values are 1.48–2.14 μM for WT, 0.35–0.58 μM for Rgs7−/−, and 0.65–0.81 μM for R7bp−/− (95% CI). Hill coefficients were 1.48 ± 0.17 in WT, 1.23 ± 0.21 in Rgs7−/−, and 2.04 ± 0.28 in R7bp−/−. p<0.0001 for difference in EC50 or each curve; p=0.04 for difference in Hill coefficients, Extra sum-of-squares F test, n = 10–22 cells. (C) Rgs7−/− cultured hippocampal neurons show slower current activation at lower concentrations of baclofen. ***p<0.001 vs WT, †††p<0.001 for Rgs7−/− vs R7bp−/−, Two-Way ANOVA, Bonferroni’s post hoc test, n = 10–22 cells. (D) Dependence of GIRK current deactivation kinetics on agonist concentration. *p<0.05 and ***p<0.001 vs WT; ††p<0.01, †††p<0.001 for Rgs7−/− vs R7bp−/−, Two-Way ANOVA, Bonferroni’s post hoc test, n = 10–22 cells. (E–G) Differences in the lag times before the onset of response deactivation (Lag Deactivation). (E) Representative traces of currents evoked by 100 µM baclofen show Lag time measurement as time between the onset of agonist removal and the point at which 10% of the current deactivated: 1560, 4900 and 3000 ms for WT, Rgs7−/−, R7bp−/−, respectively. (F) Semi-log plot of lag time dependence on concentration. The data were fitted with a linear regression, R2 = 0.66, 0.67, and 0.84; and slopes 619 ± 69, 1440 ± 151, and 952 ± 84 for WT, Rgs7−/−, R7bp−/−, correspondingly. p<0.0001 for differences in slopes, two way ANOVA, n = 10–22 cells. (G) Comparison of lag times at baclofen concentrations that generated equivalent responses. Lag times were significantly different in genotypes at saturating (EC90) but not submaximal (EC60) concentrations, *p<0.05 and ***p<0.001 vs WT, ††p<0.01 Rgs7−/− vs R7bp−/−, Two-Way ANOVA, Bonferroni’s post hoc test, n = 10–22 cells.
Figure 3

Changing the ratio of Gβγ to an effector affects response deactivation lag in a reconstituted system.
(A) Schematic representation of the assay principle. The assay measures interaction of YFP-tagged Gβγ with its effector reporter GRK, tagged with N-luc, producing BRET signal. Gβγ subunits are released upon GABABR stimulation with GABA increasing BRET signal. Inactivation of GABABR with an antagonist CGP 54626 results in dissociation of Gβγ from GRK and re-association with Gαo to form inactive heterotrimer. (B) Time course of changes in BRET signal upon stimulation of cells with GABA and subsequent deactivation by CGP 54626. Cells were transfected with varying amounts of constructs encoding Gβγ and GRK reporter (from black to green). (C) Deactivation phase of the response showing kinetics of signal decay. The lag deactivation time (dotted line for the trace in black) is defined as the time that it takes to quench the BRET signal by 10% from its steady state value in the presence of an agonist. (D) Quantification of a lag deactivation time as a function of Gβγ/GRK ratio. Error bars are SEM values, n = 4 per condition.
Figure 4
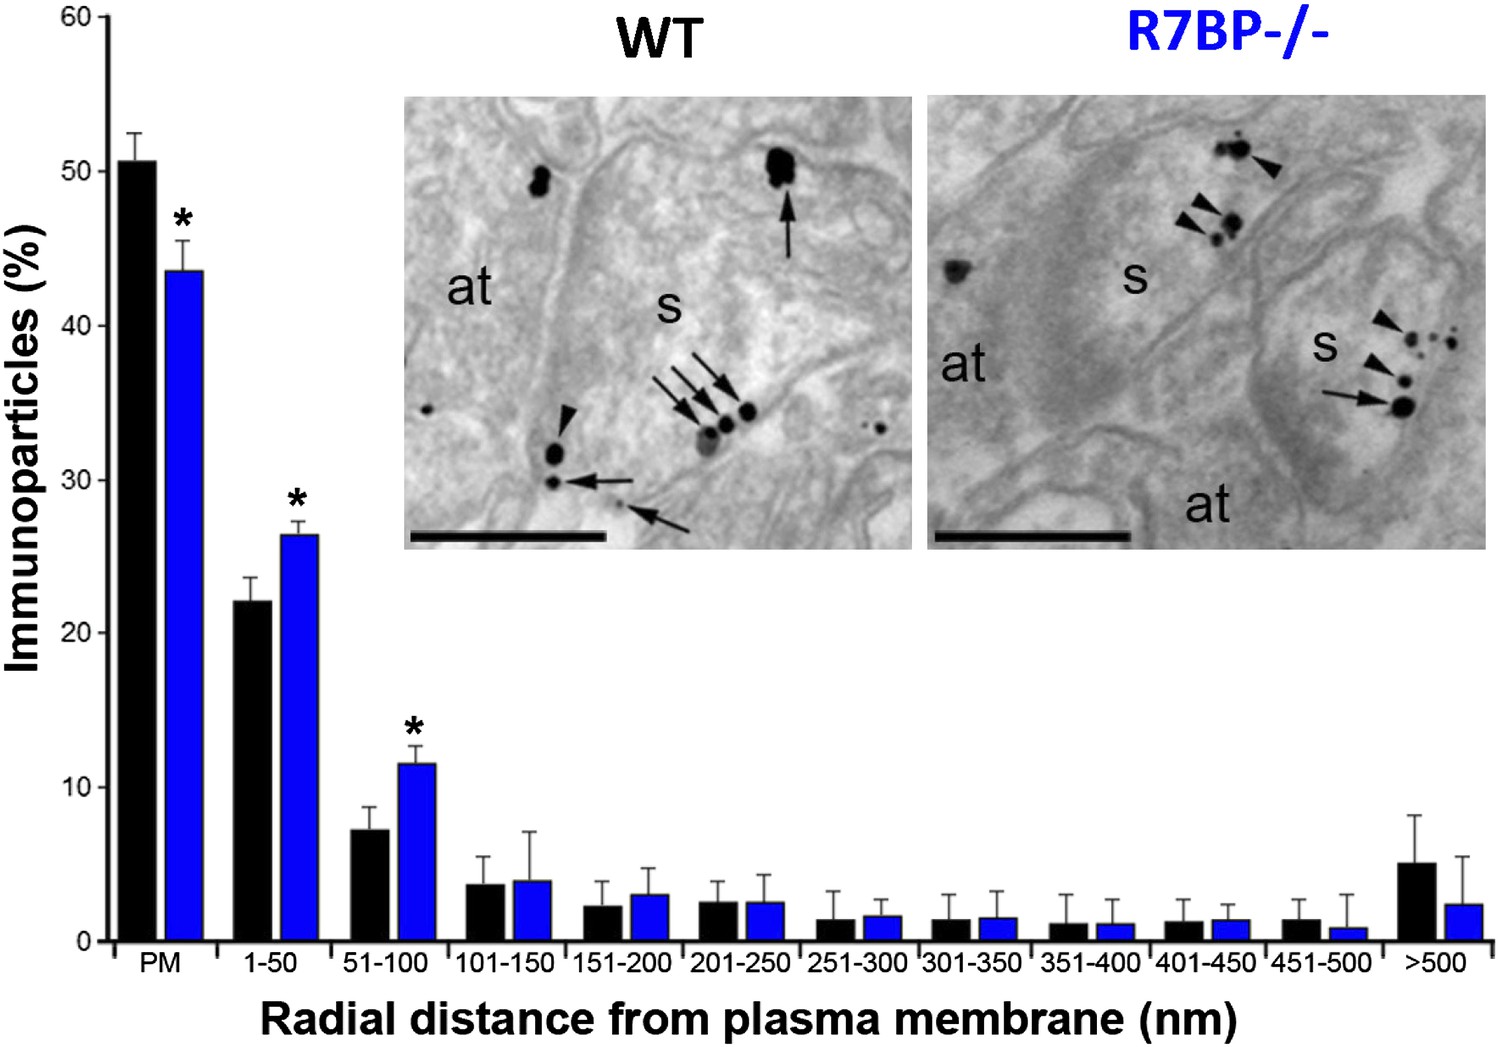
Change in subcellular localization of RGS7 in the hippocampus of the R7bp−/− mice.
Electron micrographs of the stratum radiatum of the hippocampal CA1 region showing immunoparticles for RGS7, as detected using a pre-embedding immunogold method. Dendritic spines (s) and axon terminals (at) are marked. Arrows indicate locations of immunoparticles at the plasma membrane, while arrowheads identify RGS7 immunoparticles found just below the membrane. Quantitative analysis showed that RGS7 is less frequently detected in the plasma membrane, and accumulates within the first 100 nm from the plasma membrane, samples from R7bp−/− mice, *p<0.05, One-way ANOVA followed by the Bonferroni’s post hoc test, n = 3 mice. Scale bar: 0.2 μm.
Figure 5
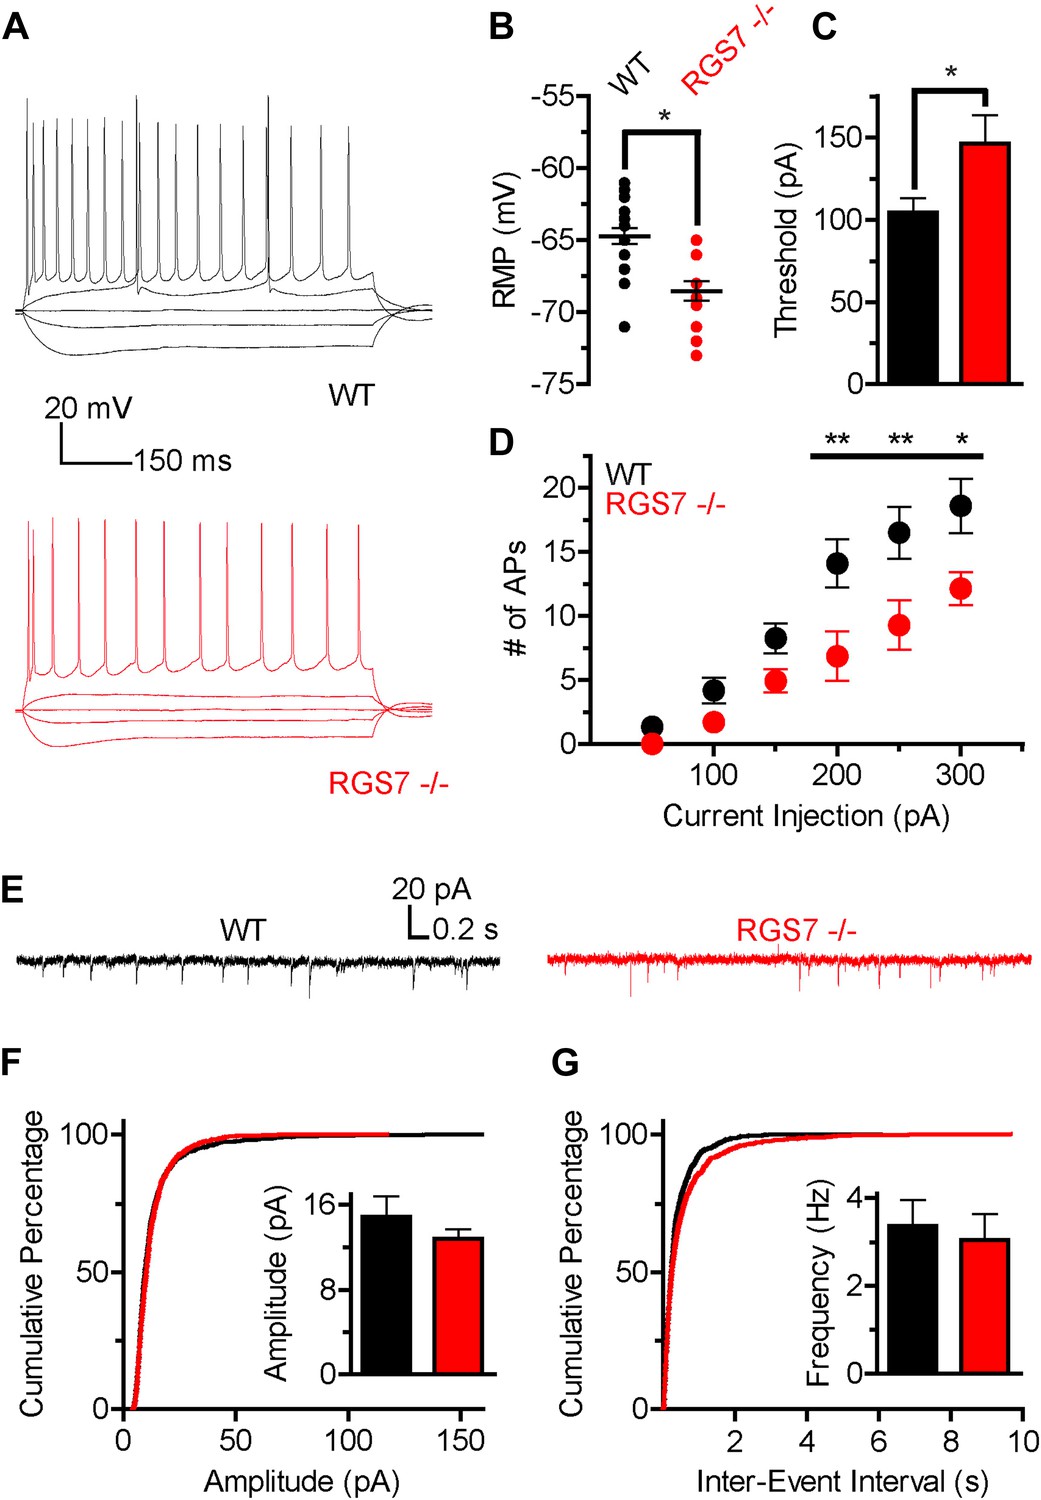
Altered intrinsic excitability and excitatory transmission in CA1 hippocampal neurons from Rgs7−/− mice.
(A) Representative traces of responses elicited by current injections of −150, −50, 0, +50, and +300 pA in WT and Rgs7−/− CA1 neurons. (B) Hyperpolarized resting membrane potential (RMP) in Rgs7−/− neurons, ***p=0.0001, t test, n = 14–23 cells. (C) Current required to evoke an action potential (firing threshold) is higher in Rgs7−/− neurons, *p=0.02, t test, n = 14–23 cells. (D) Lower intrinsic excitability in Rgs7−/− neurons. **p<0.01 and *p<0.05, two-way ANOVA with Bonferroni’s posttest, n = 14–23 cells. (E) Representative traces of slow excitatory synaptic currents (sEPSCs) in WT and Rgs7−/− cells. (F) Cumulative distribution and mean values for sEPSCs amplitudes (14.9 ± 1.9 vs 12.8 ± 0.9 pA in WT and Rgs7−/− correspondingly, p=0.3, unpaired t test; n = 11 cells and 1100 events for each genotype). (G) Cumulative distribution and mean values for sEPSCs and frequencies (3.4 ± 0.6 vs 3.1 ± 0.6 Hz in WT and Rgs7−/− correspondingly, p=0.7, unpaired t test, n = 11 cells and 1100 events for each genotype).
Figure 6

RGS7 ablation disrupts hippocampal synaptic plasticity.
Field EPSP (fEPSP) slope change following induction of: (A) LTP in Rgs7−/−, 166 ± 9% vs wild-type, 155 ± 6% slices; p=0.33, t test, n = 6–10; (B) LTD in Rgs7−/−, 90 ± 2% vs wild-type, 81 ± 2%; *p=0.01, t test, n = 6–7; (C) depotentiation (DP) in Rgs7−/−, 111 ± 3% vs wild-type, 128 ± 6%; *p=0.013, t test, n = 6–11. Insets show representative fEPSP traces at baseline and 1 hr following induction protocol in WT (black and grey) and Rgs7−/− (red and pink) slices. (D) Quantification of the EPSP slope change 55–60 min following induction of each form of plasticity after normalization to pre-induction baseline. (E) Paired Pulse Ratio (PPR) dependence on the inter stimulus interval for wild-type (WT) and Rgs7−/−. Significant inter-stimulus interval but not genotype effect was observed, p<0.0001 and p=0.5, correspondingly. Two-way ANOVA, n = 4 slices per genotype. (F–H) Basal synaptic transmission properties in Rgs7−/− slices. Dependence of fEPSP slope (F) and FV amplitude (G) on stimulus intensity. (H) Linear regression plot of fEPSP slope dependence on FV amplitude. The data were fitted with a linear regression, R2 = 0.67 and 0.53; and slopes 1.9 ± 0.1 and 1.5 ± 0.2 for WT and Rgs7−/−correspondingly. p=0.1 for differences in slopes, two way ANOVA, n = 12–13 cells.
Figure 7
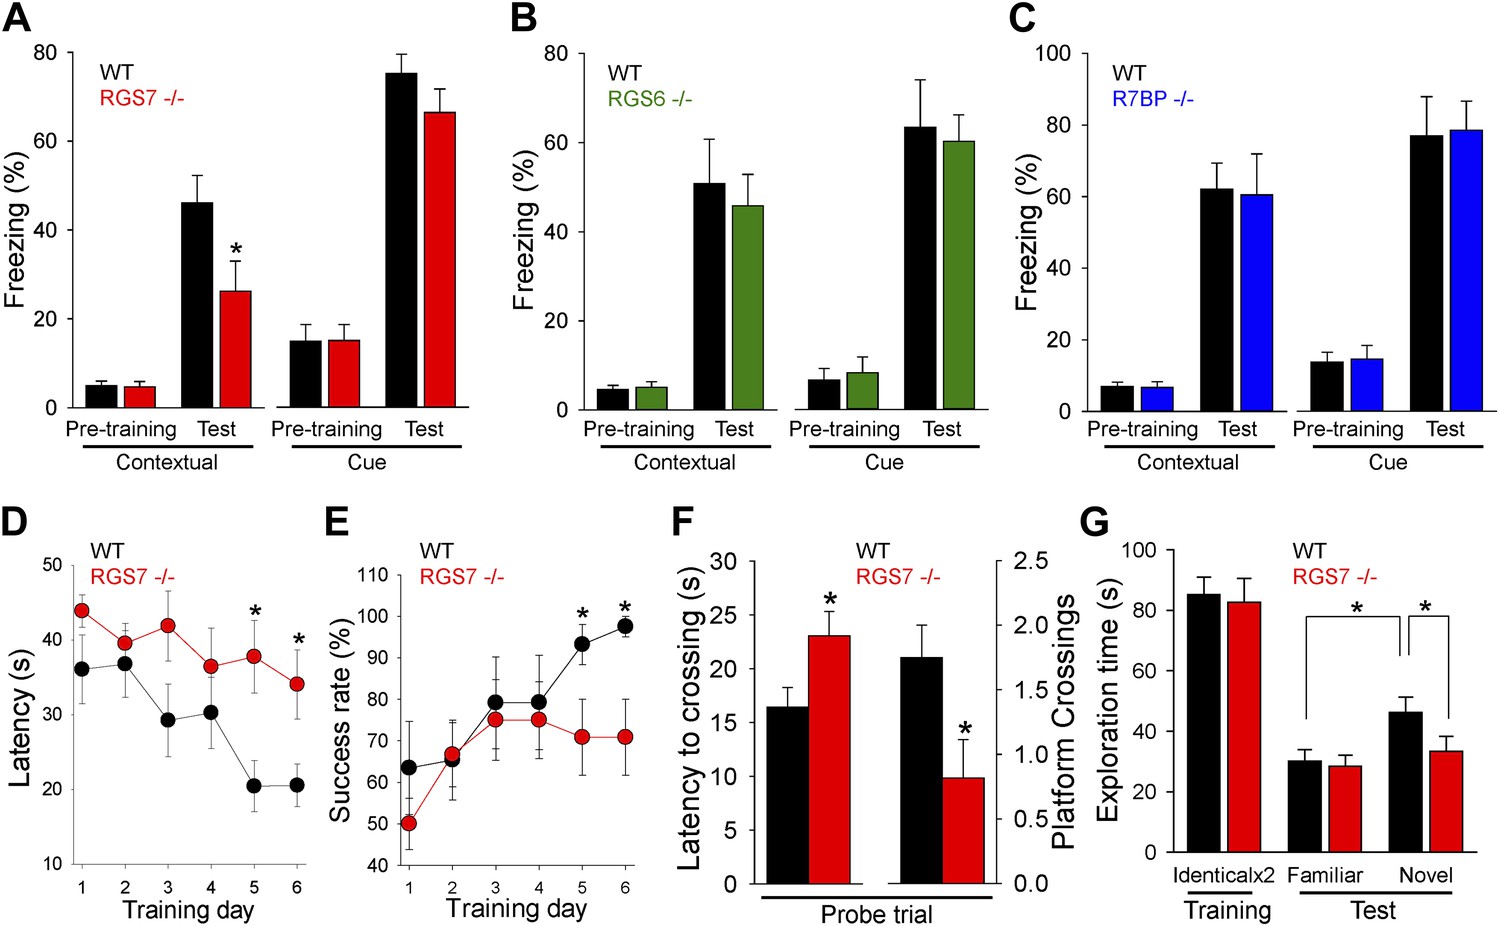
RGS ablation affects hippocampal-dependent learning and memory.
(A–C) Evaluation of mouse behavior in fear conditioning paradigm. (A) Rgs7−/− mice show deficits in hippocampal-dependent contextual, but not cue, memory.*p<0.05, t test; n = 12 per genotype. (B) Normal contextual and cue memory of Rgs6−/− mice in the fear conditioning test as compared to wild-type (WT) littermates. n = 8 per genotype. (C) R7bp−/− mice showed the same contextual and cue memory in fear conditioning test as compared to WT littermates, n = 8 per genotype. (D–F) Evaluation of mouse behavior in Morris water maze. Rgs7−/− mice (n = 13) and their WT littermates (n = 12) were trained for 6 d with 4 trials/d with an inter-trial interval of approximately 15 min. Performance during the acquisition phase was monitored and plotted as average time (D) or success rate (E) to reach the hidden platform. Mice showed improvement with training. There was a significant effect of a genotype in both escape latencies (*p<0.05) and success rates (*p<0.05) using two-way ANOVA analysis. Post hoc comparison revealed a significant impairment of Rgs7−/− mice during the last two acquisition days (*p<0.05, Tukey’s test). (F) Results of a probe trial given 24 hr after 6 d of training. The latency to the first crossing of the former location of the platform and the total number of crossing are shown, *p<0.05, t test. (G) Evaluation of mouse behavior in novel object recognition paradigm. Rgs7−/− mice showed significant impairment during the test trial with a novel object in comparison with wild-type littermates. *p<0.05, t test; n = 12–13.
Download links
A two-part list of links to download the article, or parts of the article, in various formats.
Downloads (link to download the article as PDF)
Open citations (links to open the citations from this article in various online reference manager services)
Cite this article (links to download the citations from this article in formats compatible with various reference manager tools)
RGS7/Gβ5/R7BP complex regulates synaptic plasticity and memory by modulating hippocampal GABABR-GIRK signaling
eLife 3:e02053.
https://doi.org/10.7554/eLife.02053


