Cell-intrinsic mechanisms of temperature compensation in a grasshopper sensory receptor neuron
- Humboldt-Universität zu Berlin, Germany
- Bernstein Center for Computational Neuroscience Berlin, Germany
Figures
Figure 1 with 3 supplements

Cooling mildly affected electrophysiologically recorded firing rates generated by auditory receptor neurons in response to sound.
(A) Voltage traces at 29 and 21°C for one neuron (red and blue lines, respectively). Black horizontal lines mark time intervals of stimulus presentation; stimulus intensity as indicated. (B) Firing-rate as a function of sound intensity was well described by sigmoidal functions at both temperatures (same neuron as in A). The three sigmoidal parameters (saturation rate, sound level at half-maximum, and dynamic-range width) were extracted from fits to the experimental data. (C) Statistics of the measured temperature dependence, , were computed for several quantities x. For a population of nine receptor neurons all three parameters of the sigmoidal function, as well as the spike rate and slope at the cold half-maximum were temperature compensated (median , see also Figure 1—figure supplement 2 and Figure 1—figure supplement 3).
Figure 1—figure supplement 1
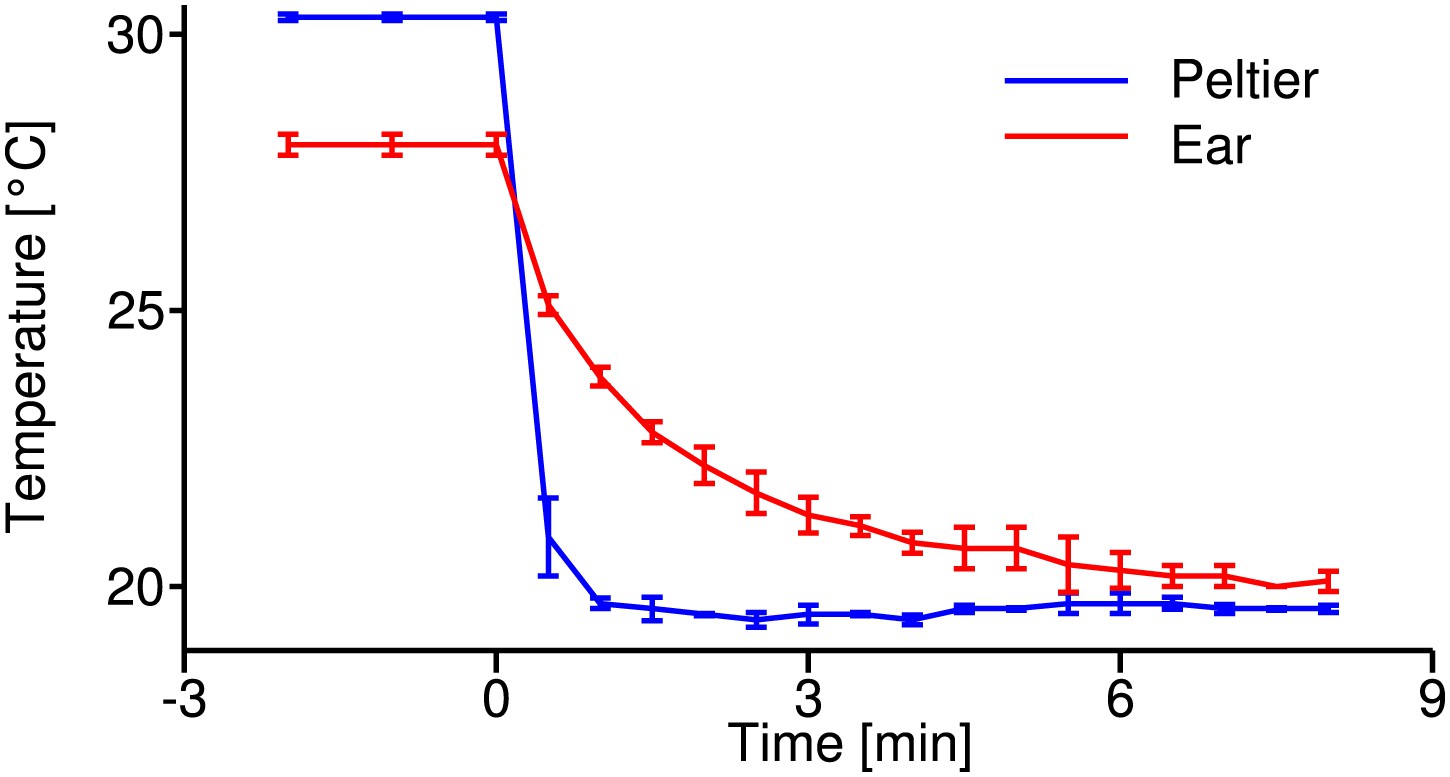
Temperature calibration curve.
Time course of temperature changes during the cooling-down procedure at the Peltier element (blue) and the tissue close to the tympanal membrane, where auditory receptor neurons attach (red); recordings from four animals. These curves were used as reference to estimate the temperature change during electrophysiological recordings.
Figure 1—figure supplement 2
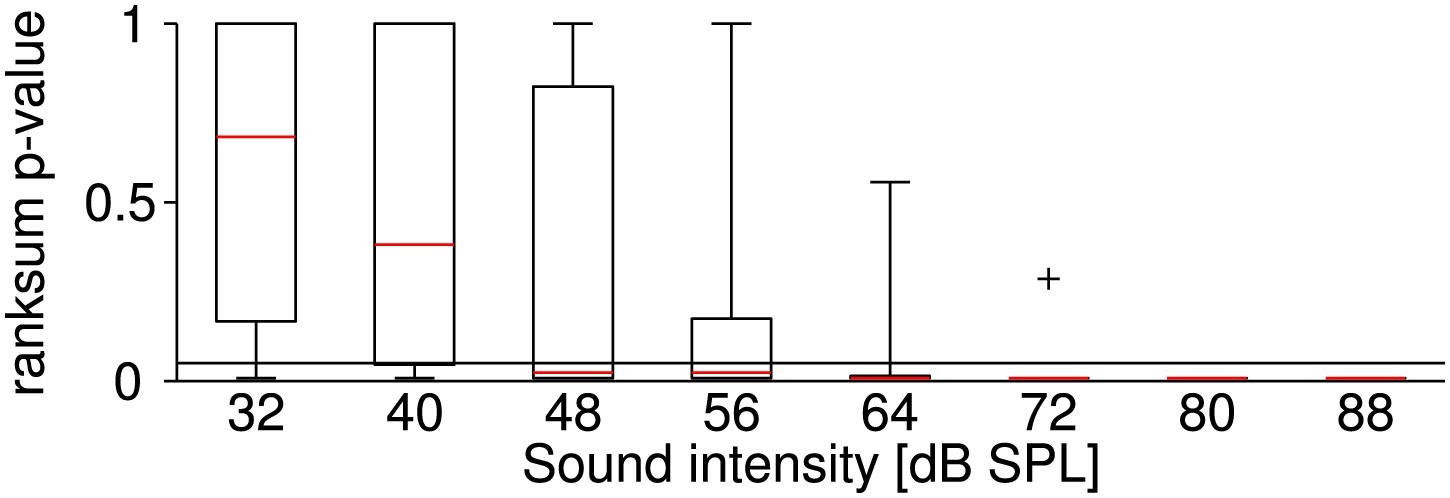
Sound-intensity resolved p-values of statistical differences between firing rates at the two temperatures.
Stimuli at each sound intensity were presented five times (before and after the temperature change). It was tested whether the corresponding firing rates at the two temperatures belong to an identical distribution with equal medians (ranksum test; p-values < 0.05 indicate a significant effect of temperature on firing rate). The figure illustrates the distribution of the test's p-values across all neurons at different levels of sound intensity (the symbol + indicates an outlier). The effect of temperature on firing rate was most significant for high sound intensities. Presumably, a higher relative variability in firing rate obscured the effect of temperature at lower firing rates (i.e., at lower sound intensities).
Figure 1—figure supplement 3
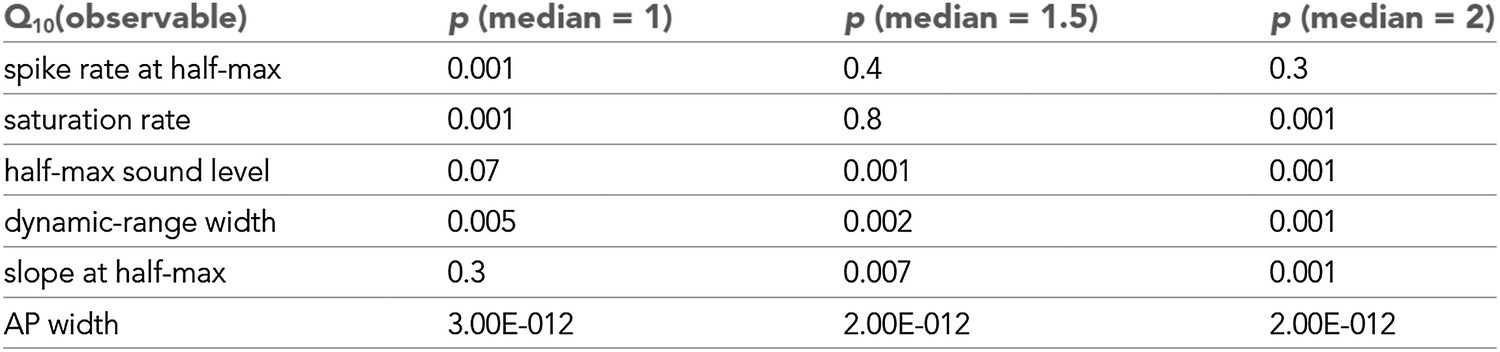
Statistical analysis of Q10 values.
Statistical significance of observables shown in Figure 1C. Based on a Wilcoxon signed rank test the null hypotheses that the median of a distribution was 1, 1.5, or 2 were tested. For values of medians were statistically different (from 1, 1.5, or 2.0, respectively). Spike rates both at half-max and at saturation were significantly affected by temperature changes (), but not significantly different from 1.5 (), indicating temperature compensation. values of saturation spike rates, in particular, were also significantly lower than 2.0. The median temperature dependencies of half-max sound level and slope at half-max were not significantly different from 1, indicating temperature invariance. Dynamic-range width and action-potential width significantly increased with cooling ().
Figure 2 with 1 supplement
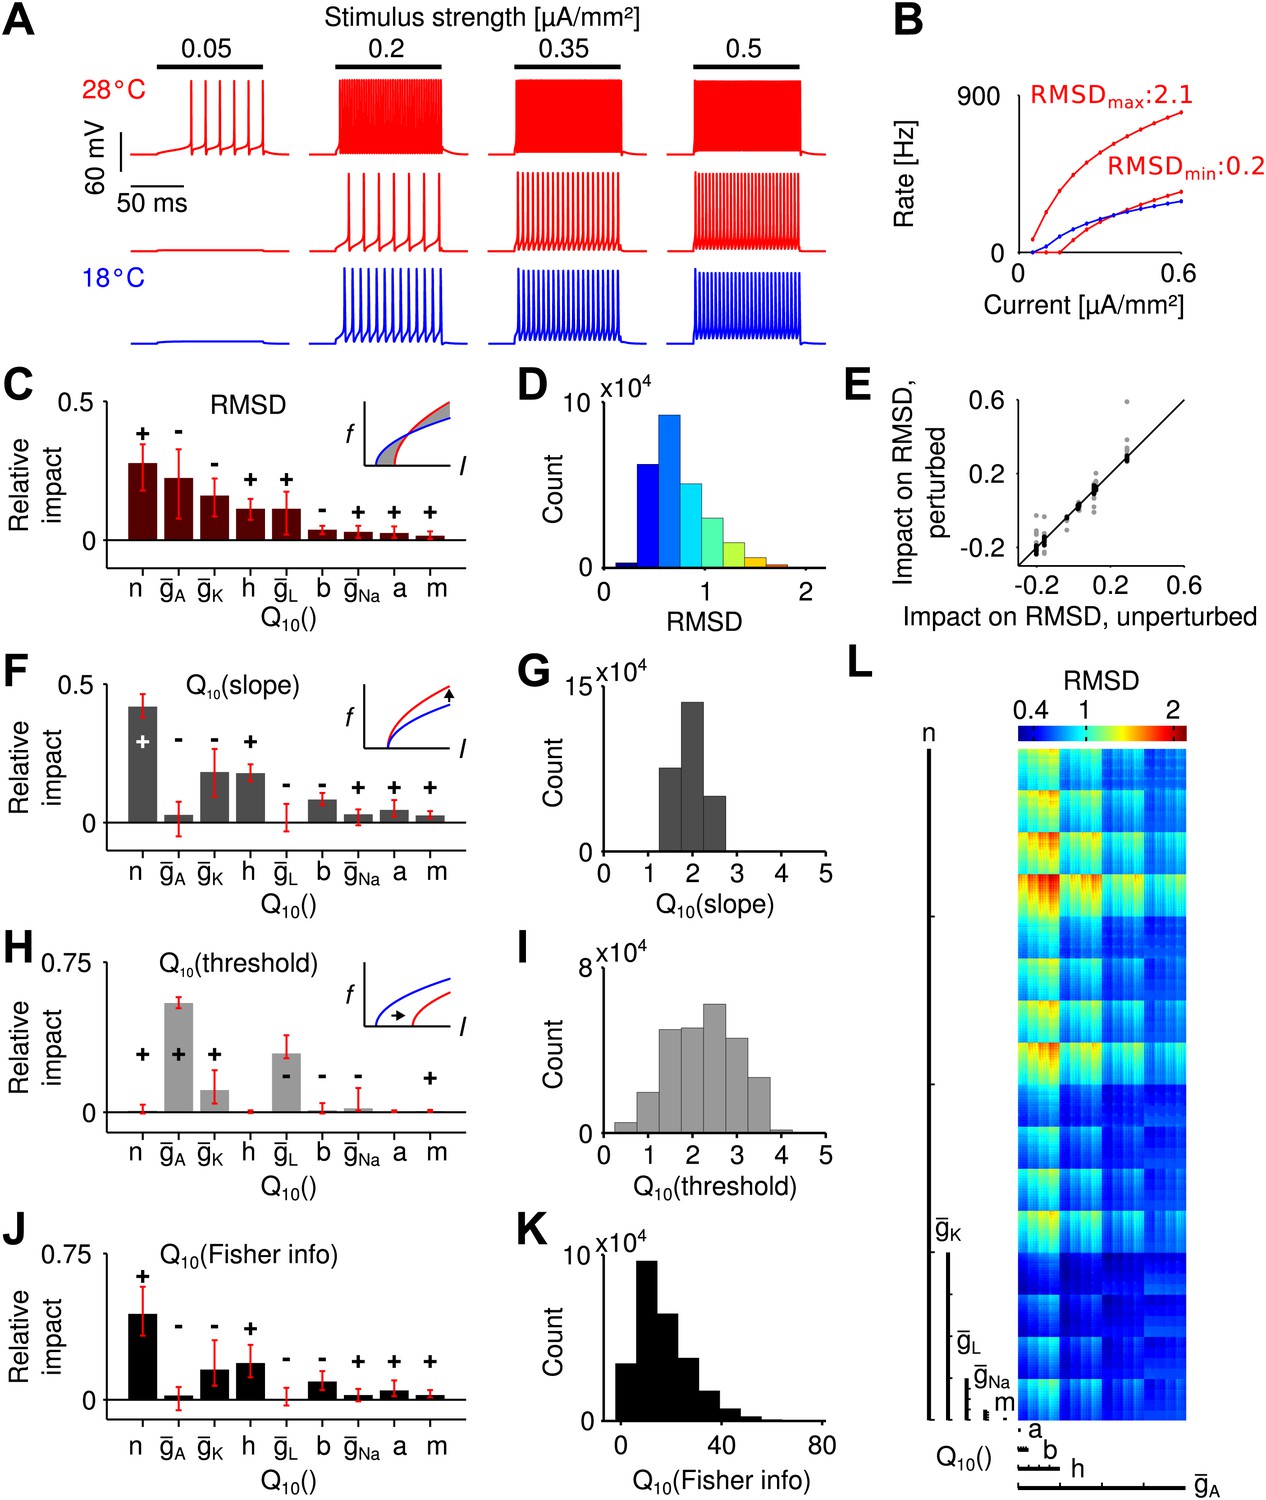
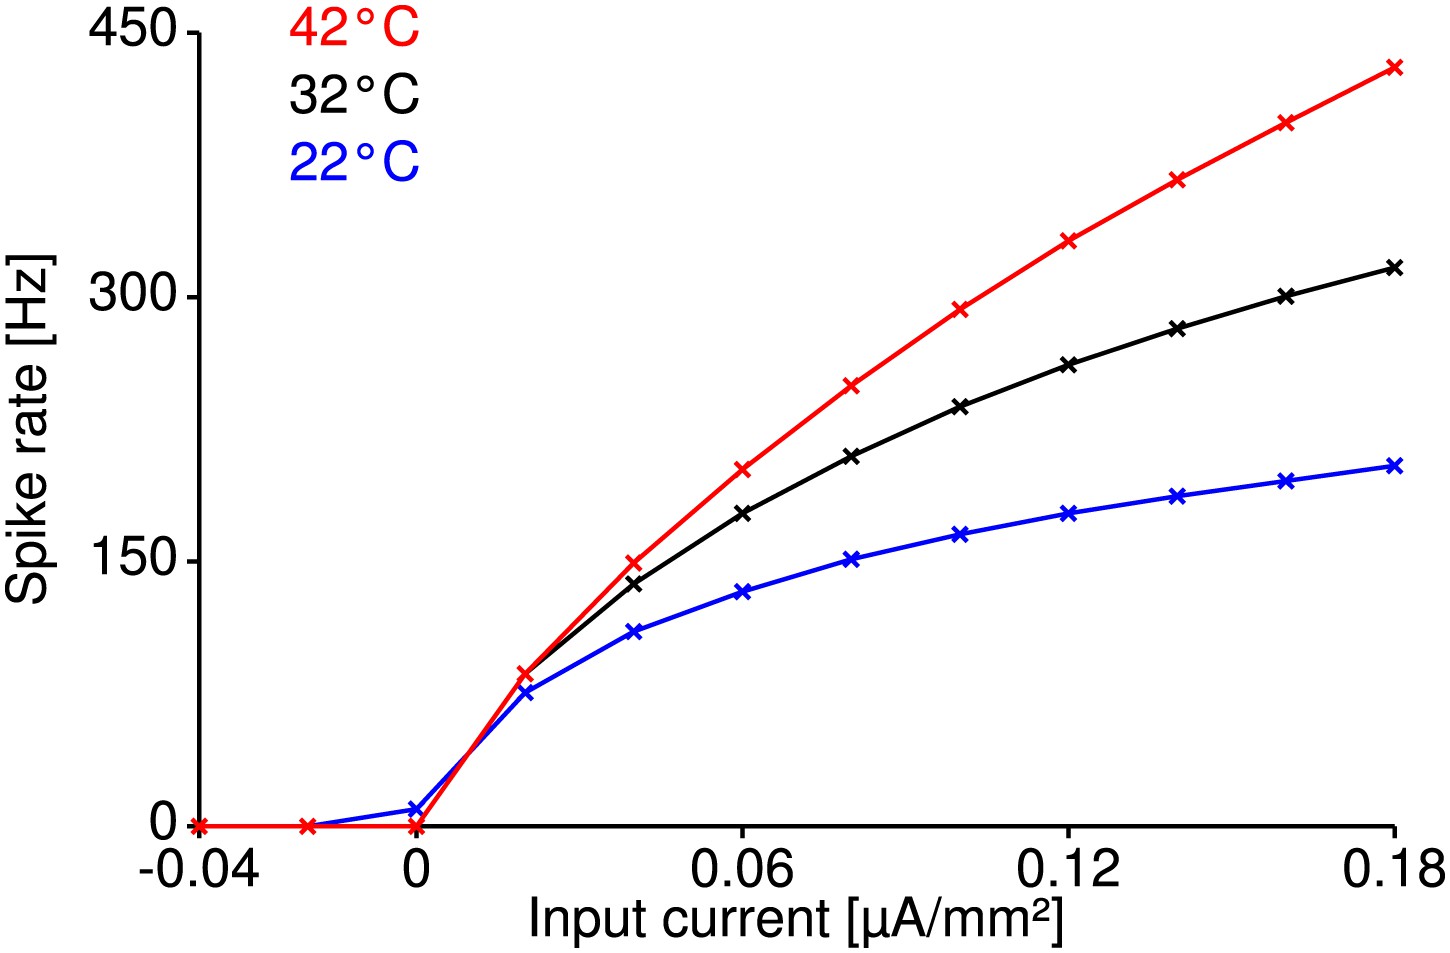
Temperature dependence of spike generation in a conductance-based neuron model.
(A) Voltage responses to step current stimuli of different amplitudes; blue: 18°C (the reference temperature), red: 28°C. Top trace corresponds to a model with strongly temperature-dependent firing rate, middle trace to a temperature-compensated model. (B) f-I curves at both temperatures, corresponding to the examples shown in A. (C) Results of the sensitivity analysis for the RMSD. The largest impact is exerted by temperature dependencies of the potassium conductances (, , and ). Signs +/− indicate the qualitative impact (see main text for details). (D) Distribution of the RMSD, across all models. Note that a of 1.5 corresponds to an RMSD of ∼0.5 (50% relative change). (E) Parameter impacts on RMSD were robust against ±20% perturbation of the model's peak conductances at 18°C (black symbols: perturbations of individual peak conductances; grey symbols: all combinations of ±20% changes to the four peak conductances). (F) Results of the sensitivity analysis for the temperature dependence of the slope of f-I curves. (G) Distribution of values of the slope across all models. (H and I) as panels (F) and (G), but for the threshold of the f-I curves. (J and K) Sensitivity analysis of information transfer. For two basic noise models (Poissonian and input-independent Gaussian), the temperature dependence of firing rate-based information transfer J is related to that of the slope of the f-I curve: . The conductance parameters with highest impact were very similar to those of the changes in slope (compare to panel F). Information transfer increased with temperature for all models. (L) Visualization of the RMSD for the parameter space spanned by the temperature dependencies of the Connor-Stevens model based on dimensional stacking. Axes order was chosen according to the impact ranking as presented in (C); color code as in (D).
Figure 2—figure supplement 1
Temperature compensation in the Traub-Miles model.
Temperature compensation of spike generation is also possible in a structurally different Traub-Miles model despite a realistic temperature dependence of its conductances (). Shown are the model at reference temperature (32°C for this model, black curve), and the model heated up by 10°C (red curve) or cooled down by 10°C (blue curve), with temperature parameters that minimize the RMSD of the corresponding f-I curves within the physiologically realistic range (identical to that explored for the Connor-Stevens model with peak conductances () and transition rates of the (in-) activation variables ). Optimal parameters minimizing the RMSD were identified by a genetic algorithm. Relative changes in firing rate were on the order of those observed experimentally ( for the red curve and for the blue curve).
Figure 3 with 2 supplements

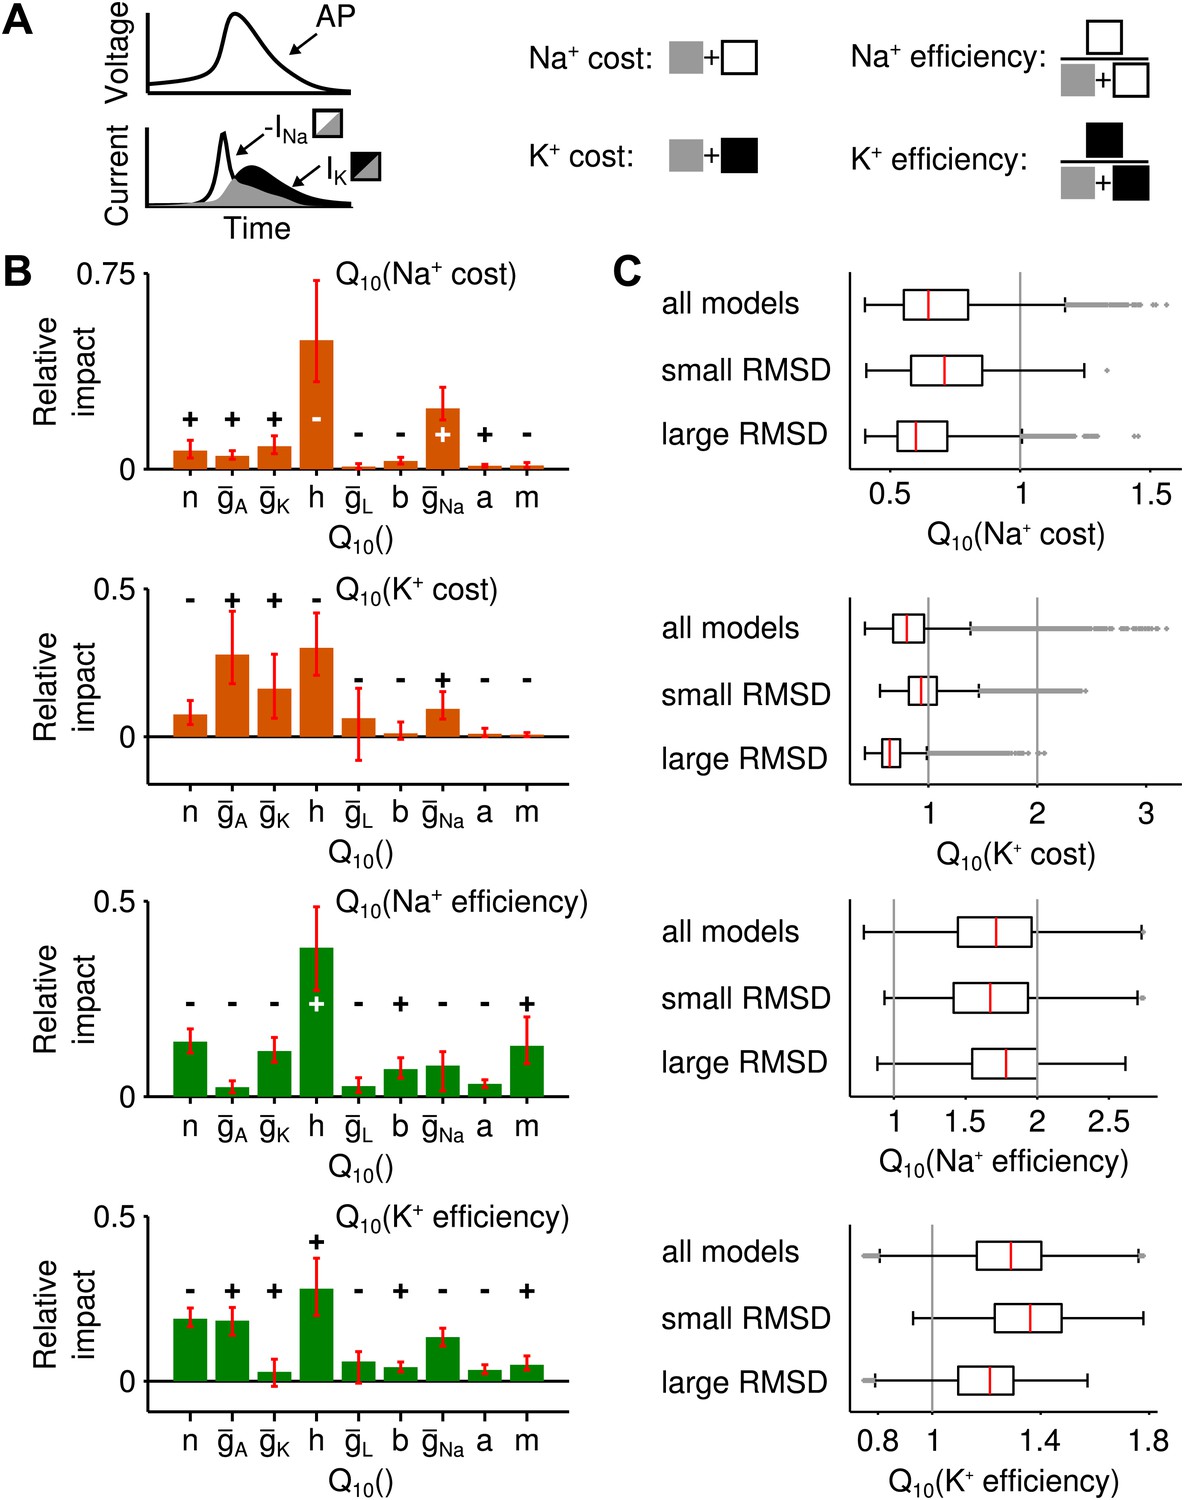
Temperature dependence of the metabolic cost (spiking and maintenance of the resting potential).
(A) Illustration of the periods during which spiking cost and resting-potential cost were estimated in terms of the Na+ current (two corresponding examples at the higher and lower temperature; red and blue curves, respectively). Energy consumption during spiking was averaged per spike and across the suprathreshold parts of the f-I curve. (B) Distribution of the temperature dependence of the spiking cost . Top: all models; middle and bottom: distribution across the 25% of models with lowest and highest temperature dependence of firing rate (RMSD), respectively. Spiking cost decreased at higher temperature for the majority of models. In particular, values of minimal energy consumption at the higher temperature were similar for the subgroups of models with lowest and highest temperature dependence. (C) Distribution of the temperature dependence of the resting cost , analog to (B). Resting-potential cost decreased for the majority of models; top, middle and bottom panels comprising subgroups of models as in (B). (D) Temperature dependence of firing rate and spiking energy consumption are determined by different sets of conductance parameters. While potassium-channel temperature dependencies have the largest impact on firing rate (Figure 2C), the energy consumption per spike was predominantly determined by sodium-channel temperature dependence. Faster sodium inactivation () and lower peak sodium conductance fostered energy efficiency at higher temperature. (E) Parameters that reduce resting energy at high temperature also reduce RMSD (same sign of the impact values as in Figure 2C). (F and G) Impacts on energy consumption were robust against ±20% perturbations of the model's peak conductances at 18°C (Figure 2E, ‘Materials and methods’).
Figure 3—figure supplement 1
Alternative measures of metabolic cost and energy efficiency of spiking.
(A) Schematic illustration of the measures used (sodium-current-based and potassium-current-based cost, as well as energy efficiency estimated by the separability of sodium and potassium currents either in relation to the sodium current or the potassium current). (B) Impact of the model parameters' values for all four measures. In all cases, temperature dependence of sodium inactivation, had the largest impact on metabolic cost or energy efficiency. In contrast, the temperature dependence of delayed-rectifier potassium activation, (which proved most influential for the temperature dependence of firing rate) exerted a smaller impact on both potassium- and sodium-based energy consumption. (C) The distribution of energy measures across all spike generation models as well as models with particularly high and low RMSD (subgroup of models within the bottom and top 25 percentile of RMSDs).
Figure 3—figure supplement 2
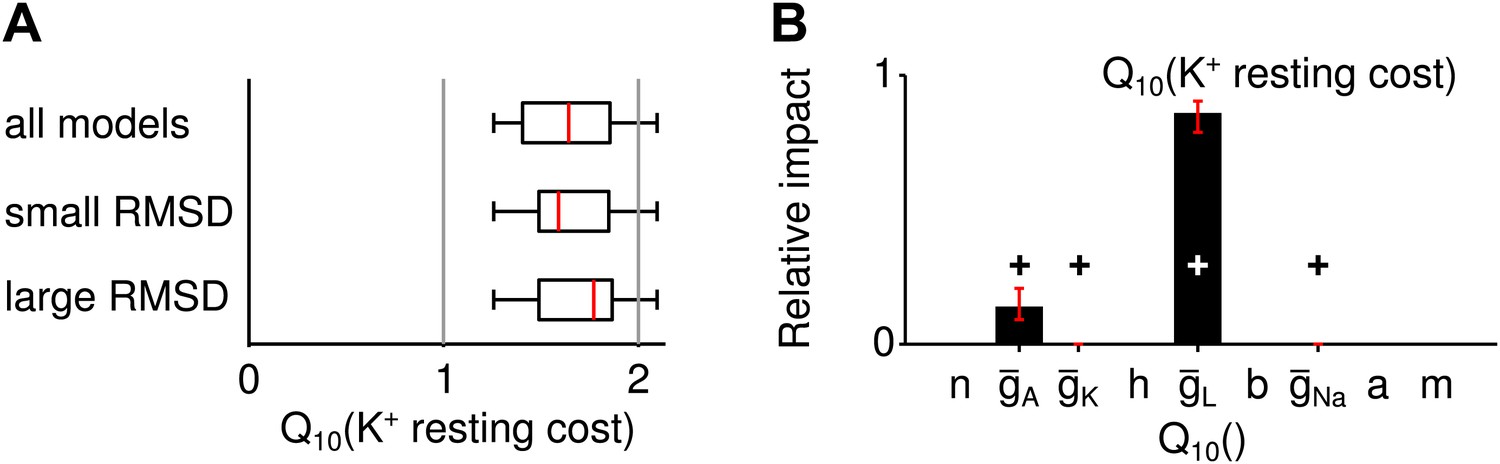
Potassium-current based resting cost.
(A) The distribution of the temperature dependence ( values) of the resting cost based on potassium-current across all spike generation models as well as models with particularly high and low RMSD (subgroup of models within the bottom and top 25 percentile of RMSDs). Overall, this type of resting cost increased with larger temperatures because A-type potassium currents were larger. (B) The temperature dependence of the leak conductance influenced this type of resting cost most.
Figure 4
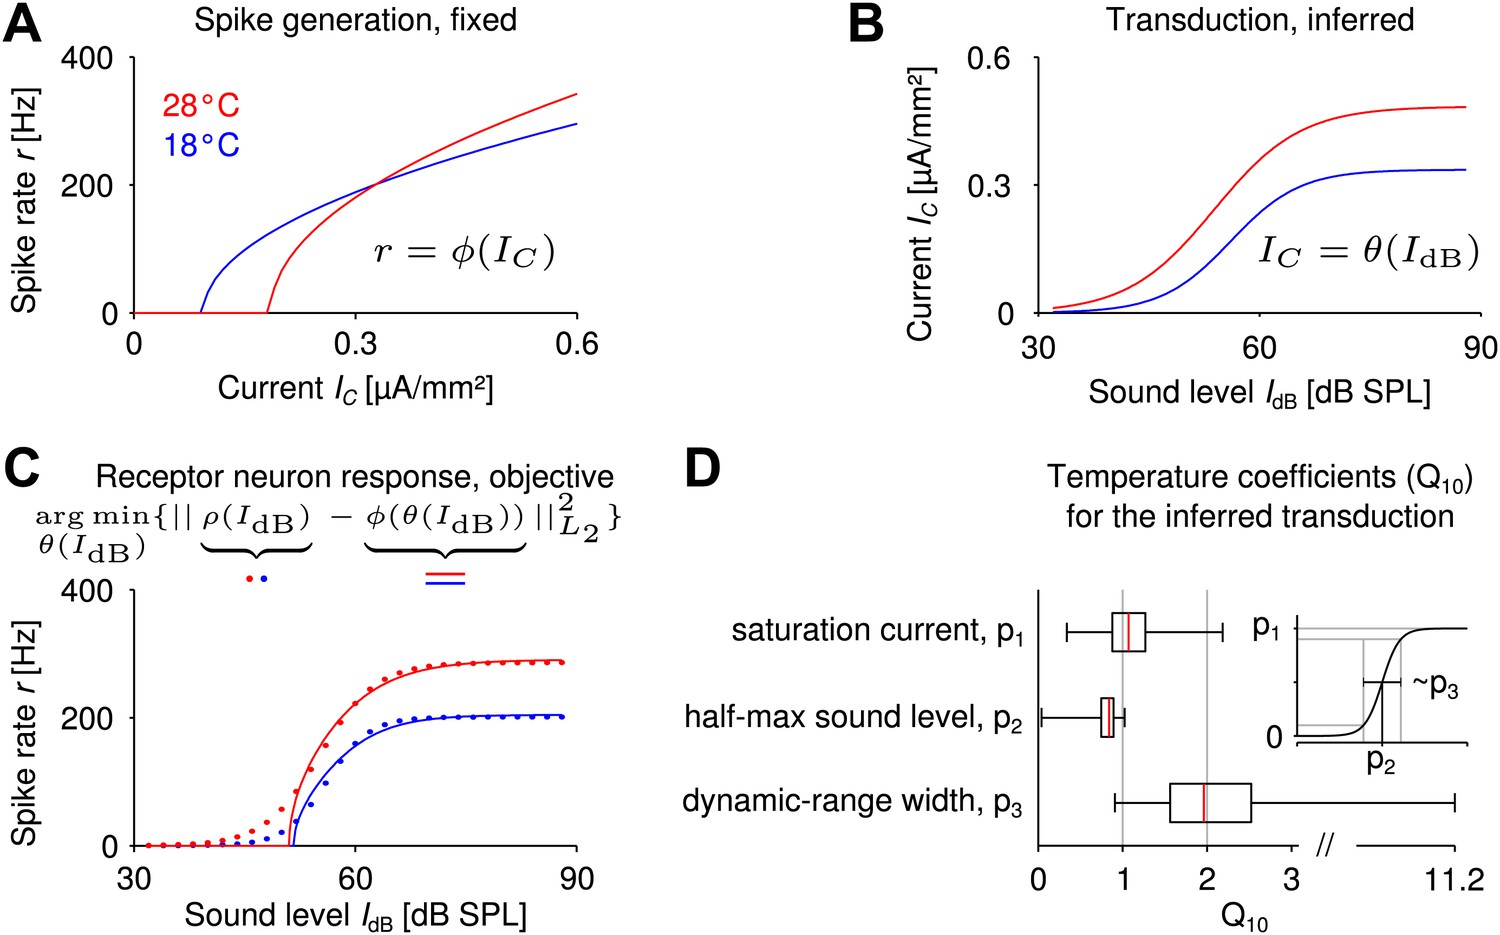
Reverse engineering mechanosensory transduction functions that favor temperature compensation of firing rate.
(A) Example of a model-based f-I curve, denoted , at two temperatures. (B) Example of a sigmoidal transduction function converting sound intensity to current, . (C) Representative receptor neuron responses, , at two temperatures (dotted lines), as well as a receptor neuron response, , ‘constructed’ from the f-I curve in A and the transduction function in B. For each model of spike generation, the optimal transduction function, , minimizing the error between the corresponding ‘constructed’ receptor neuron response and the representative receptor neuron response (dotted line in C) was derived. (D) The statistics of temperature dependence of the optimal transduction functions, , across all models. The width of the dynamic range depended most on temperature and increased with heating for nearly all optimized transduction functions. But the temperature dependence of the saturation current and the half-maximum sound intensity (mainly when decreasing with temperature) were also found to contribute to temperature compensation. Note that the ranges marked by the whiskers cover all data (including outliers) in this plot.
Download links
A two-part list of links to download the article, or parts of the article, in various formats.
Downloads (link to download the article as PDF)
Open citations (links to open the citations from this article in various online reference manager services)
Cite this article (links to download the citations from this article in formats compatible with various reference manager tools)
Cell-intrinsic mechanisms of temperature compensation in a grasshopper sensory receptor neuron
eLife 3:e02078.
https://doi.org/10.7554/eLife.02078


