Cell autonomous regulation of hippocampal circuitry via Aph1b-γ-secretase/neuregulin 1 signalling
- VIB Center for the Biology of Disease, KU Leuven, Belgium
- Centre for Human Genetics, KU Leuven, Belgium
- Leuven Institute for Neuordegenerative Disorders (LIND), KU Leuven, Belgium
- University Hospitals Leuven, Belgium
- KU Leuven, Belgium
- Institute of Neurology, University College London, United Kingdom
Figures
Figure 1 with 1 supplement
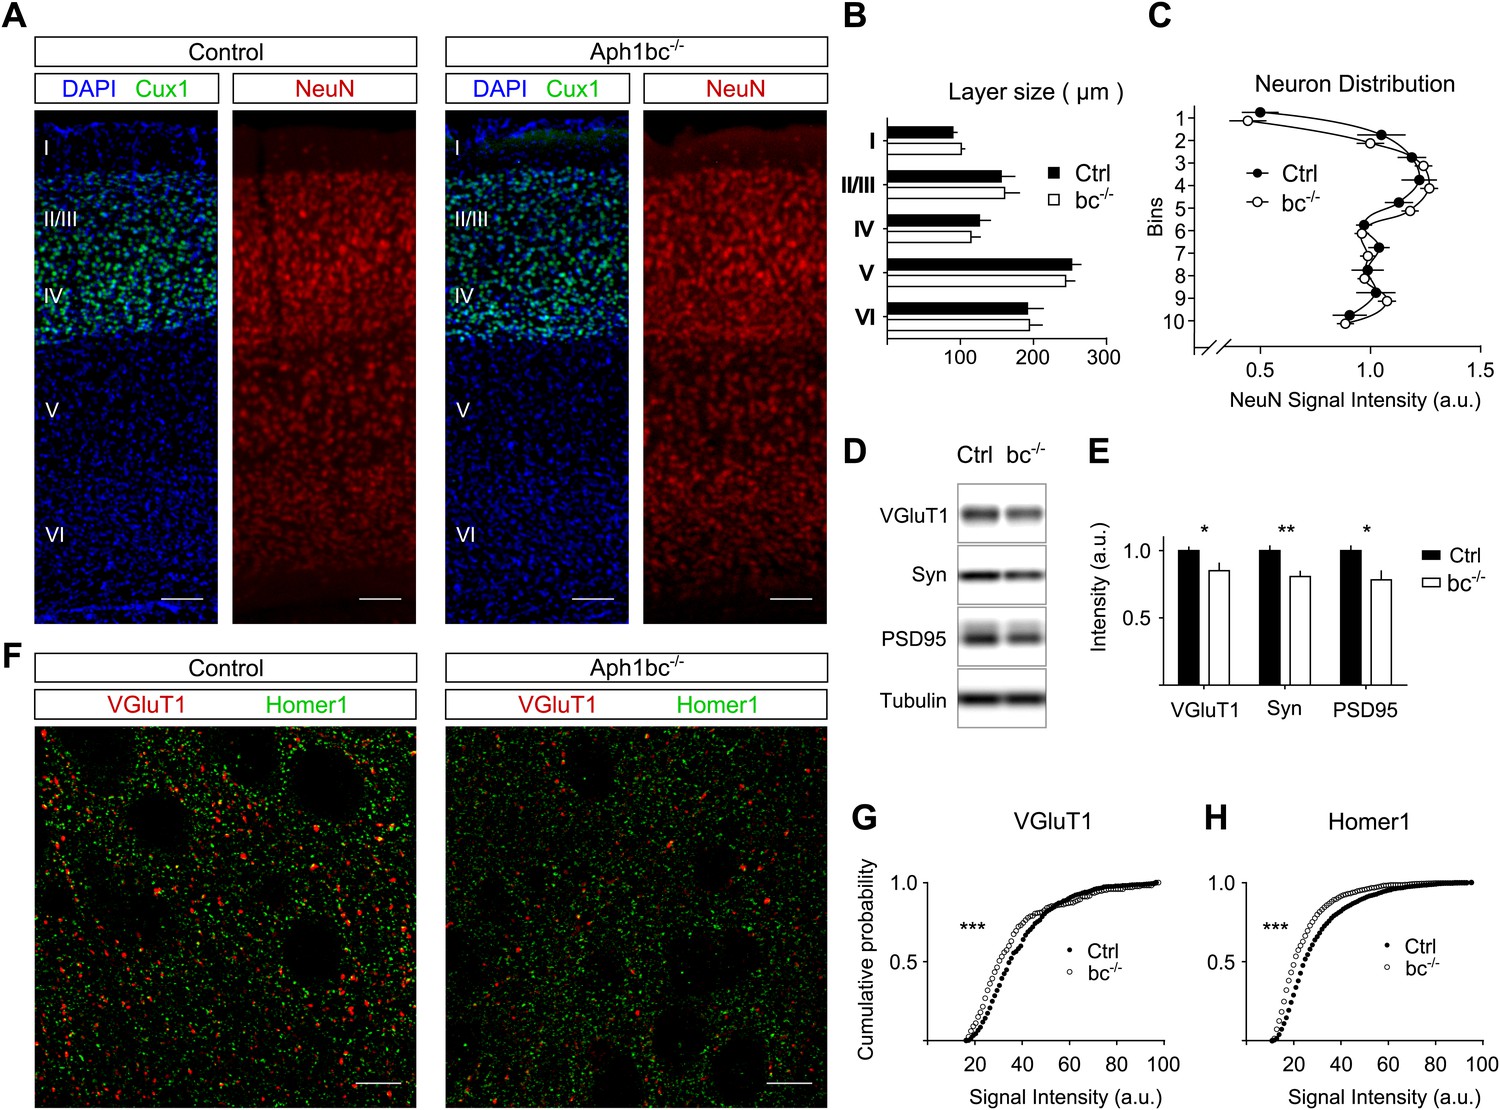
Normal cortical layer formation and altered expression of synaptic markers in Aph1bc−/− deficient mice.
(A) Representative pictures of neuronal cortices from Control and Aph1bc−/− null mice at P30 immunostained for the upper layers marker Cux1 and for the pan neuronal marker NeuN. Nuclei were stained with DAPI. Scale bars, 100 µm. (B) Quantification of cortical layers size at Bregma −1.4 mm. Ctrl: n = 4; KO: n = 3; Histogram show average ± SD, two way ANOVA. (C) Neuronal distribution, as measured by relative NeuN fluorescence intensity along bins ordered from top to bottom, was unchanged in Aph1bc−/− mutant brains at P30. n = 6 sections from three mice; Graph show means ± SD, two way ANOVA. (D and E) Western blot analysis of synaptic markers VGluT1, Synaptophysin and PSD95 in prefrontal cortex homogenates show decreased expression of these proteins in Aph1bc−/−. n = 9 replicates out of n = 3 mice per group; the histogram shows signal intensity normalized for tubulin signal, means ± SEM, *p<0.05, **p<0.01. VGluT1: Ctrl = 100 ± 3%, Aph1bc−/− = 85 ± 6%; Syn: Ctrl = 100 ± 4%, Aph1bc−/− = 80 ± 4%; PSD95: Ctrl = 100 ± 4%, Aph1bc−/− = 78 ± 7%. (F) Representative confocal pictures of layer II/III of prefrontal cortices from control and Aph1bc−/− mice at P30 immunolabelled for the excitatory presynaptic marker VGlut1 and for the excitatory postsynaptic marker Homer1. Scale bar 10 µm. (G and H) Cumulative probability of VGluT1 and Homer1 puncta intensities in control and Aph1bc−/− mice. VGlut1, n >338 puncta; Homer1, n >1160 puncta; three animals per genotype each, Komolgorov–Smirnov test, ***p<0.001.
Figure 1—figure supplement 1
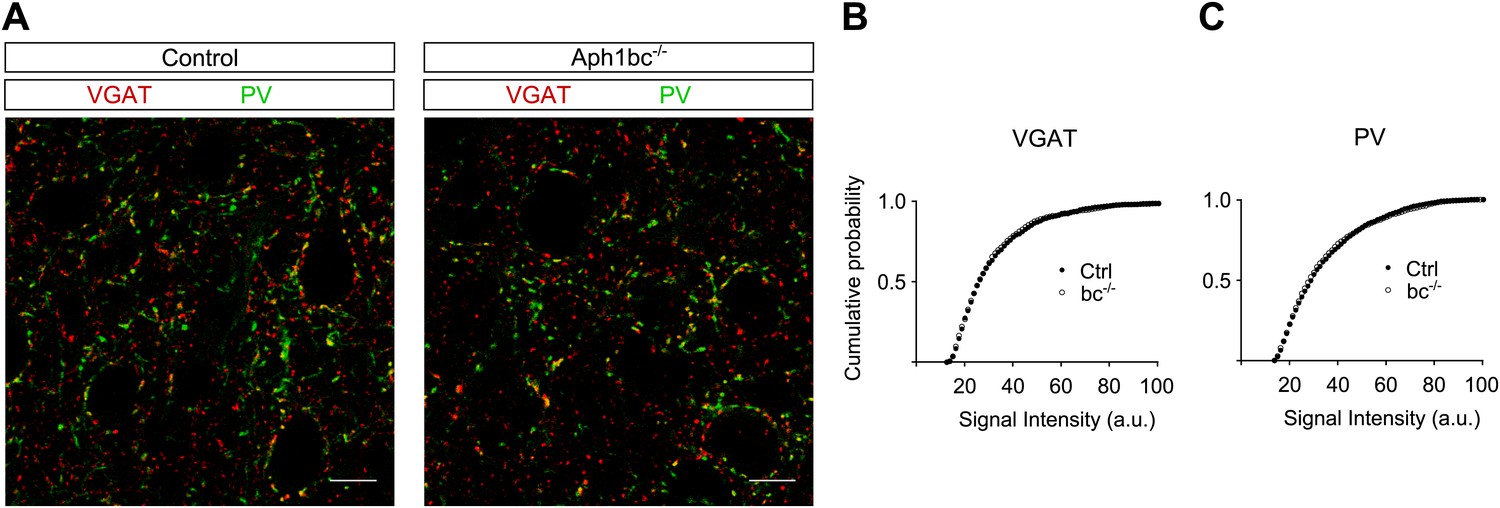
Aph1bc deletion does not affect the expression of inhibitory synaptic markers.
(A) Representative pictures of layer II/III of prefrontal cortices from control and Aph1bc−/− mice at P30 immunolabelled for inhibitory markers VGAT and PV. Scale bar 10 µm. (B and C) Cumulative probability plots of VGAT and PV puncta intensities in control and Aph1bc−/− null mice. PV, n >1352 puncta; VGAT, n >804 puncta, three animals per genotype each, Komolgorov–Smirnov test, p>0.05 for both VGAT and PV.
Figure 2

Aph1bc deletion impairs synaptic transmission and plasticity.
(A) Input-Output curves recorded in the Schaffer collaterals of the hippocampus show that basic synaptic transmission is impaired in Aph1bc+/− heterozygous and homozygous Aph1bc−/− mutant mice as compared to control littermates. Graph shows means ± SEM, RM-ANOVA for the three groups: F(2,18) = 4.163, p<0.05; Ctrl: n = 6; Aph1bc+/−: n = 7; Aph1bc−/−: n = 6. (B) Paired pulse facilitation (PPF), a presynaptic form of short term synaptic plasticity, is not significantly affected by genetic Aph1bc deletion. RM-ANOVA, p>0.05. (C) Long term potentiation elicited by three bursts of theta stimulations (black arrows) is reduced in heterozygous and homozygous Aph1bc mutant mice in comparison to control mice. The insets show representative traces from mutant and control mice. Means ± SEM, RM-ANOVA for the three groups. F(2,18) = 9.74, p=0.0014. Ctrl n = 6; Aph1bc+/− n = 7; Aph1bc−/− n = 6. (D) Representative traces from mEPSC recordings in slices from control, Aph1bc+/− and Aph1bc−/− mice plotted in (E) and (F). (E) Cumulative plot of inter-event intervals of mEPSCs in control, heterozygous and homozygous Aph1bc deficient mice. Kruskal–Wallis test followed by Dunn's multiple comparison test, **p<0.01. Median, Ctrl 1651 ms , BC+/− 1835 ms, BC−/− 1947 ms. Mean, Ctrl 2465 ms ± 56, BC+/− 2550 ms ± 58, BC−/− 2622 ms ± 56. n >1679 each out of 37 control, 36 Aph1bc+/− and 35 Aph1bc−/− neurons. (F) Cumulative probability of mEPSCs amplitude in control and mutant Aph1bc mice. Komolgorov–Smirnov test, p>0.05.
Figure 3
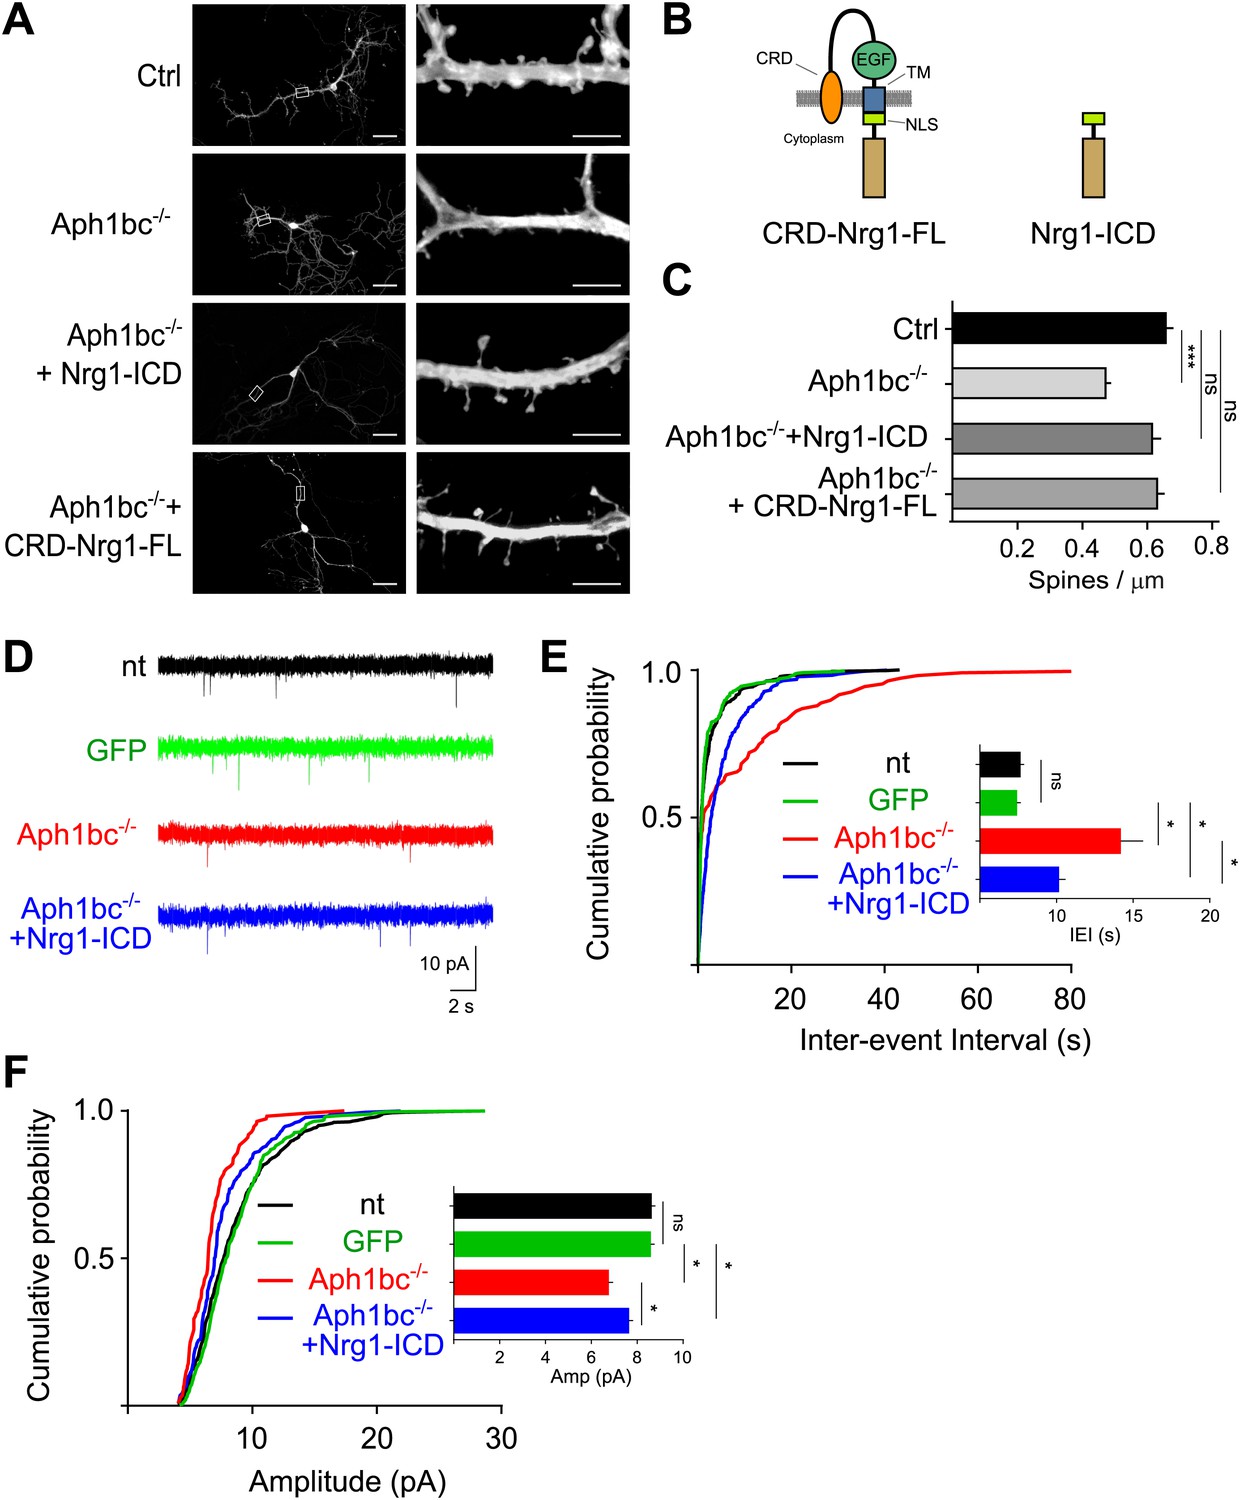
Spine formation is impaired by single cell Aph1bc-γ-secretase loss of function and is rescued by Nrg1 intracellular signalling.
(A) Representative pictures at DIV15 of cultured hippocampal from Aph1bcfl/fl conditional mutant mice transfected at DIV8 with GFP as control, GFP-ires-Cre to obtain single cell Aph1bc−/− neurons, GFP-ires-Cre and CRD-Nrg1-FL or Nrg1-ICD to restore Nrg1 intracellular signalling in Aph1bc−/− neurons. Scale bars in left column: 50 µm, right column: 5 µm. (B) The schemata show the structure of CRD-Nrg1 full length (CRD-Nrg1-FL), of Nrg1 intracellular domain (Nrg1-ICD). CRD, Cysteine Rich Domain, EGF epidermal growth factor-like domain; TM, transmembrane domain; NLS, nuclear localization signal. (C) Quantification of spine density. Selective single cell genetic deletion of Aph1bc-γ-secretase decreased spine density. Co-expression of CRD-Nrg1-FL and of Nrg1-ICD in Aph1bc−/− neurons rescued the impairment in spine formation. Means ± SEM, one-way ANOVA. ***p<0.001. Ctrl: n = 36; Aph1bc−/−: n = 36; Aph1bc−/−+CRD-Nrg1-FL: n = 38; Aph1bc−/−+Nrg1-ICD: n = 37. (D) Representative traces from mEPSC recordings shown in (E) and (F). (E) Cumulative probability of inter-event intervals of mEPSCs recorded in non-transfected and GFP positive control neurons, in Aph1bc−/− deficient neurons and in Aph1bc−/− neurons transfected with Nrg1-ICD. nt = non transfected. The inset graph shows means ± SEM. Kruskal–Wallis test followed by Dunn's multiple comparison test, ns p>0.05; *p<0.05. nt: n = 457 out of 9 neurons; GFP: n = 359 out of 6 neurons; Aph1bc−/−: n = 107 out of 7 neurons; Aph1bc−/−+Nrg1-ICD: n = 220 out of 8 neurons. (F) Cumulative probability plot of mEPSCs amplitude recorded in non-transfected or GFP positive control neurons, in Aph1bc−/− deficient neurons and in Aph1bc−/− neurons transfected with Nrg1-ICD. nt = non transfected. The inset graph shows means ± SEM, Kruskal–Wallis test followed by Dunn's multiple comparison test, ns, p>0.05; *p<0.05.
Figure 4
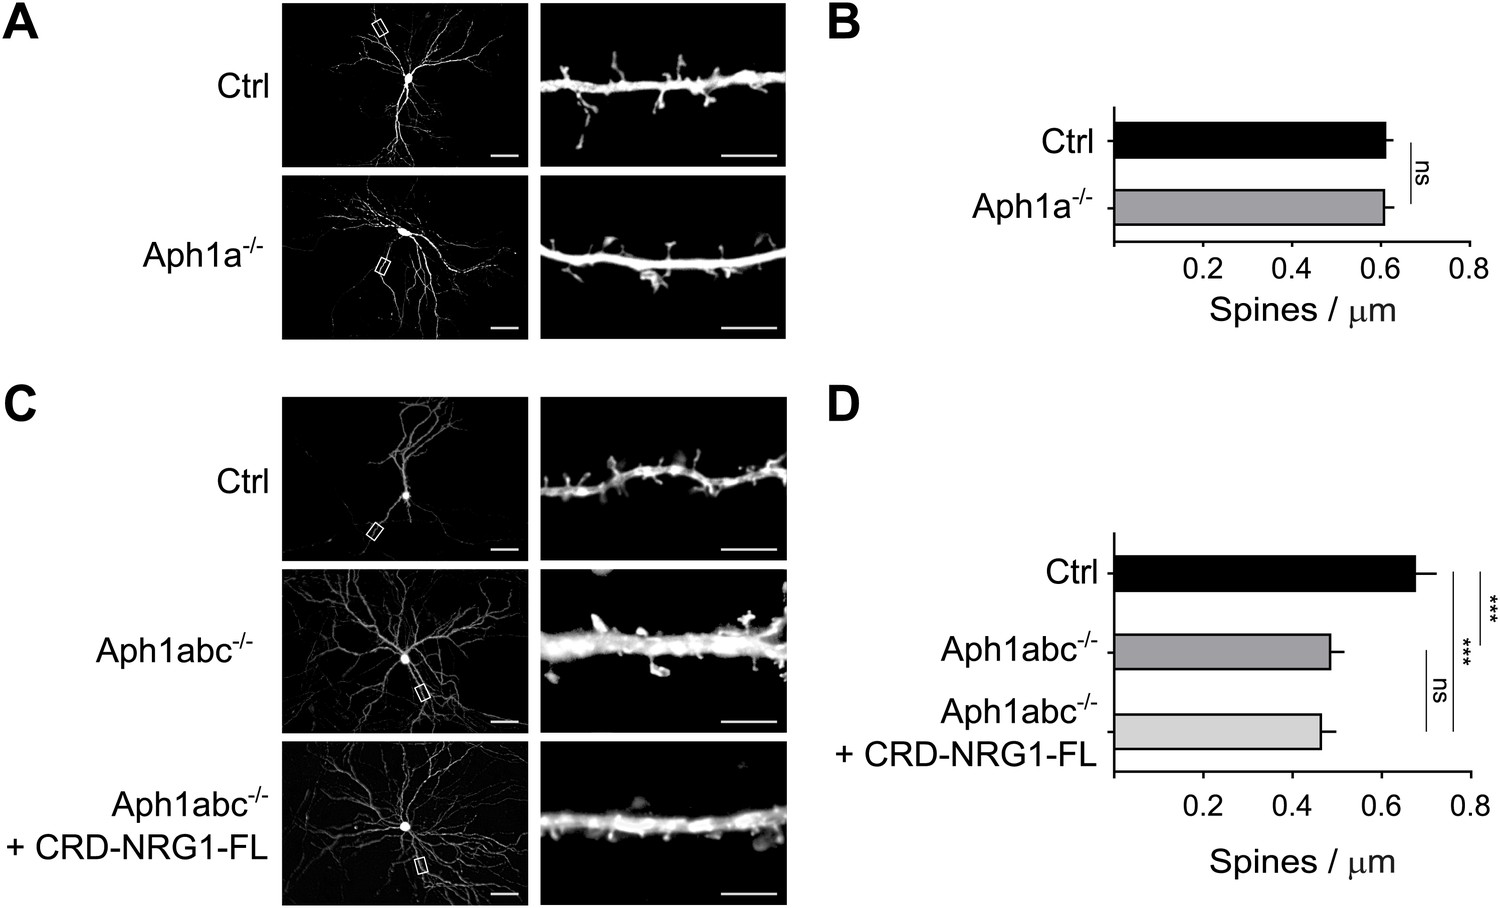
Selective function of different γ-secretase complexes in spine formation.
(A) Cultured hippocampal neurons from Aph1afl/fl conditional mutant mice were transfected at DIV8 with GFP as control or with GFP-ires-Cre to delete Aph1a and fixed at DIV15. (B) Single cell deletion of Aph1a indicates that Aph1a-γ-secretase activity is not necessary for spine formation in these experimental conditions. Means ± SEM, t test. p>0.05. Ctrl: n = 25; Aph1a−/−: n = 19. (C) Hippocampal neurons from Aph1abcfl/fl triple conditional mutant mice were transfected with GFP as control, with GFP-ires-Cre to completely abrogate γ-secretase activity in single neurons or co-transfected with GFP-ires-Cre and CRD-Nrg1-FL. (D) Complete γ-secretase loss of function by Aph1abc−/− triple deletion impaired spine formation. This phenotype could not be rescued by CRD-Nrg1-FL indicating that γ-secretase dependent Nrg1 intracellular signalling is necessary to restore spine formation. Means ± SEM, one-way ANOVA. ***p<0.001. Ctrl: n = 13; Aph1abc−/−: n = 22; Aph1bc−/− + CRD-Nrg1-FL: n = 19. Scale bars in A, C, left column: 50 µm, right column: 5 µm.
Figure 5
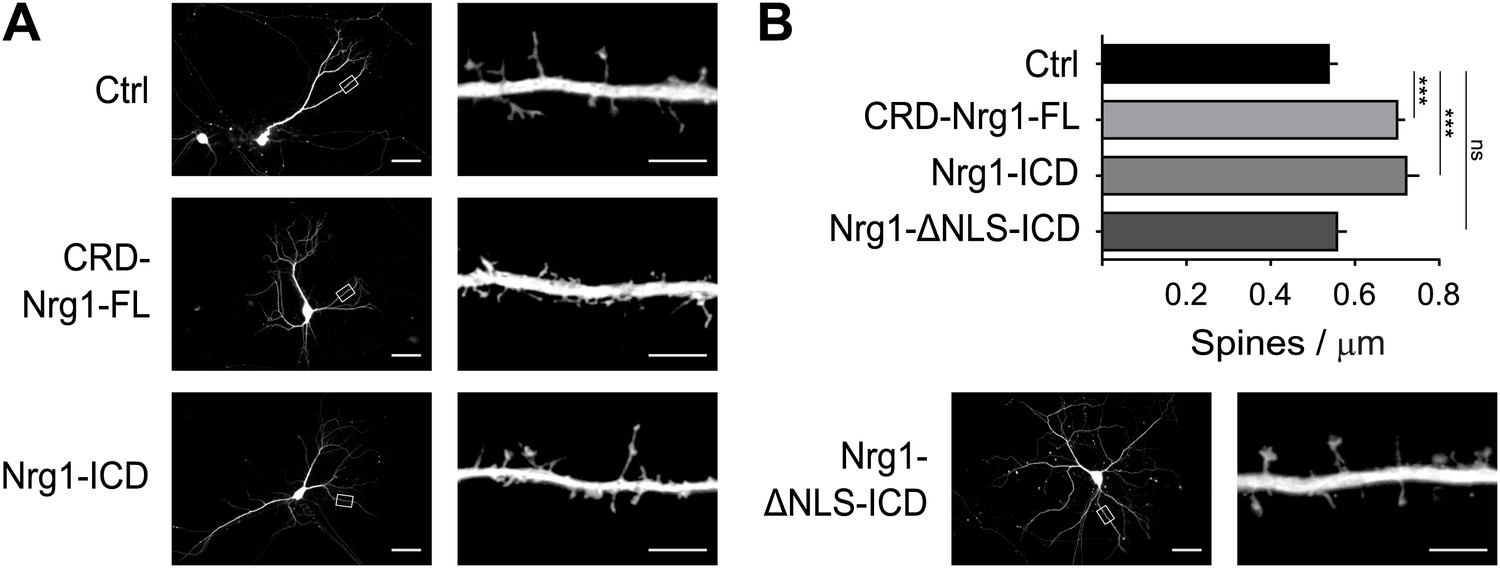
Nrg1 intracellular signalling cell-autonomously promotes spine formation in vitro.
(A) Representative pictures of cultured hippocampal neurons transfected at DIV8, at the beginning of synaptogenesis, with either GFP alone as control or GFP and the CRD-Nrg1-Fl, GFP and the Nrg1-ICD and GFP and Nrg1-ΔNLS-ICD. Neurons were fixed and analysed at DIV15. (B) Quantification of spine density in Nrg1 transfected neurons. Single cell exogenous expression of Nrg1-Fl and of Nrg1-ICD enhanced spine formation. Conversely, Nrg1-ΔNLS expression did not increase spine density indicating that nuclear localization signal of Nrg1 is required for this function. Means ± SEM, one-way ANOVA. ***p<0.001. Ctrl, n = 19; CRD-Nrg1-FL, n = 15; Nrg1-ICD, n = 16; Nrg1-ΔNLS-ICD, n = 21. Scale bars in B, left column: 50 µm, right column: 5 µm.
Figure 6
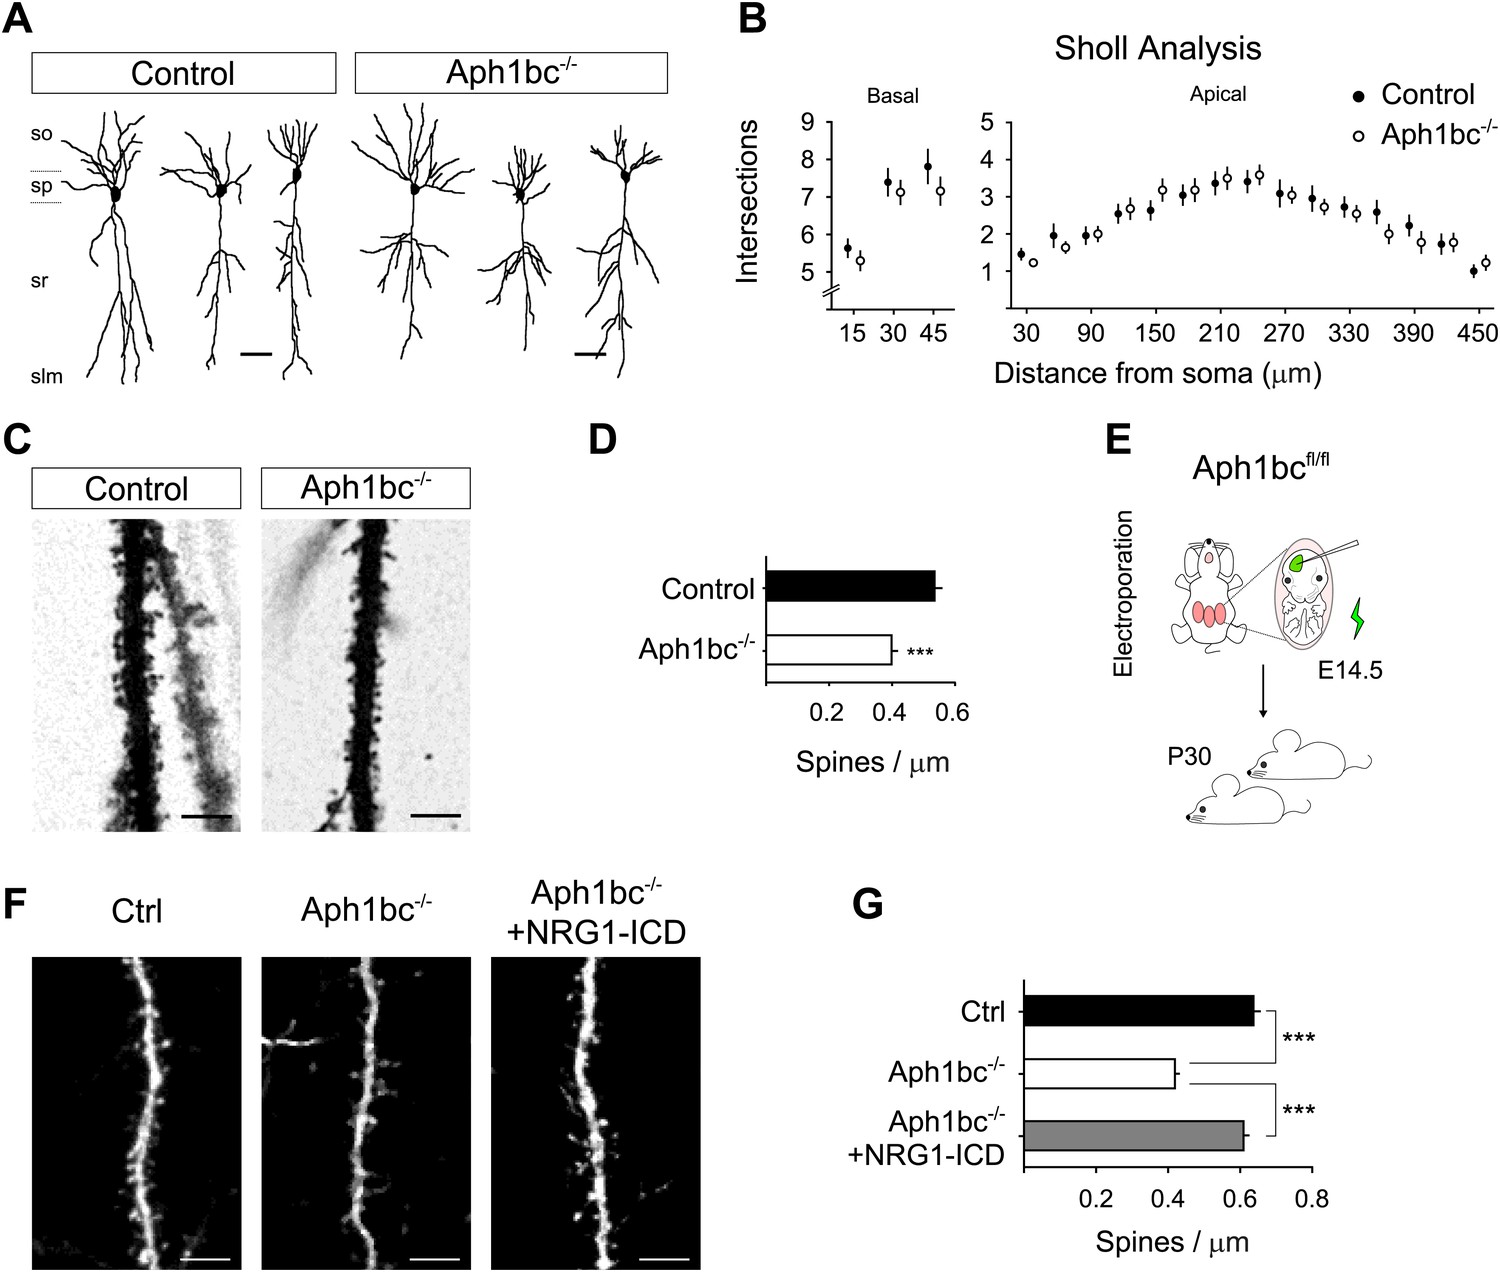
Aph1bc deletion cell autonomously disrupts spine formation which is rescued by Nrg1-ICD expression in vivo.
(A) Representative drawings of Golgi stained CA1 hippocampal neurons from control and Aph1bc−/− null brains at P30. so, stratum oriens; sp, stratum pyramidale; sr, stratum radiatum; slm, stratum lacunosum moleculare. (B) Sholl analysis of dendritic arbour of neurons from Aph1bc−/−mice did not reveal overt defects in neuronal morphology as compared to control in neither basal nor apical dendrites. Basal, means ± SEM, two-way ANOVA. p>0.05. Ctrl: n = 40; Aph1bc−/−: n = 32. Apical; Apical, means ± SEM, two-way ANOVA. p>0.05. Ctrl: n = 22; Aph1bc−/−: n = 22. (C) Representative images of apical dendrites of CA1 hippocampal neurons that receive input from Schaffer collaterals from control and Aph1bc−/− mice. (D) Histogram shows that spine density is decreased in apical dendrites of Aph1bc−/− deficient neurons. Means ± SEM, t test. p<0.001. Ctrl, n = 31; Aph1bc−/−, n = 46. (E) Schema summarizing the experimental paradigm for cell autonomous Aph1bc loss of function and rescue by Nrg1-ICD via in utero electroporation (IUE) at E14.5. (F) Basal dendrites of layer II/III cortical pyramidal neurons from Aph1bcfl/fl mutant mice electroporated at E14.5 with either GFP as control, GFP-ires-Cre alone to perform single cell Aph1bc−/− deletion or with GFP-ires-Cre and Nrg1-ICD to rescue spine formation and fixed at P30. (G) Quantification of spine density. Spine formation was impaired by single cell deletion of Aph1bc and it was rescued by expression of Nrg1-ICD construct in Aph1bc−/− neurons. Means ± SEM. One-way ANOVA. ***p<0.001. Ctrl, n = 41; Aph1bc−/−, n = 78; Aph1bc−/−+Nrg1-ICD, n = 47. Scale bar in A 50 µm, in C and F 5 µm.
Download links
A two-part list of links to download the article, or parts of the article, in various formats.
Downloads (link to download the article as PDF)
Open citations (links to open the citations from this article in various online reference manager services)
Cite this article (links to download the citations from this article in formats compatible with various reference manager tools)
Cell autonomous regulation of hippocampal circuitry via Aph1b-γ-secretase/neuregulin 1 signalling
eLife 3:e02196.
https://doi.org/10.7554/eLife.02196


