Combining growth-promoting genes leads to positive epistasis in Arabidopsis thaliana
- Vlaams Instituut voor Biotechnologie, Belgium
- Ghent University, Belgium
Figures
Figure 1 with 64 supplements
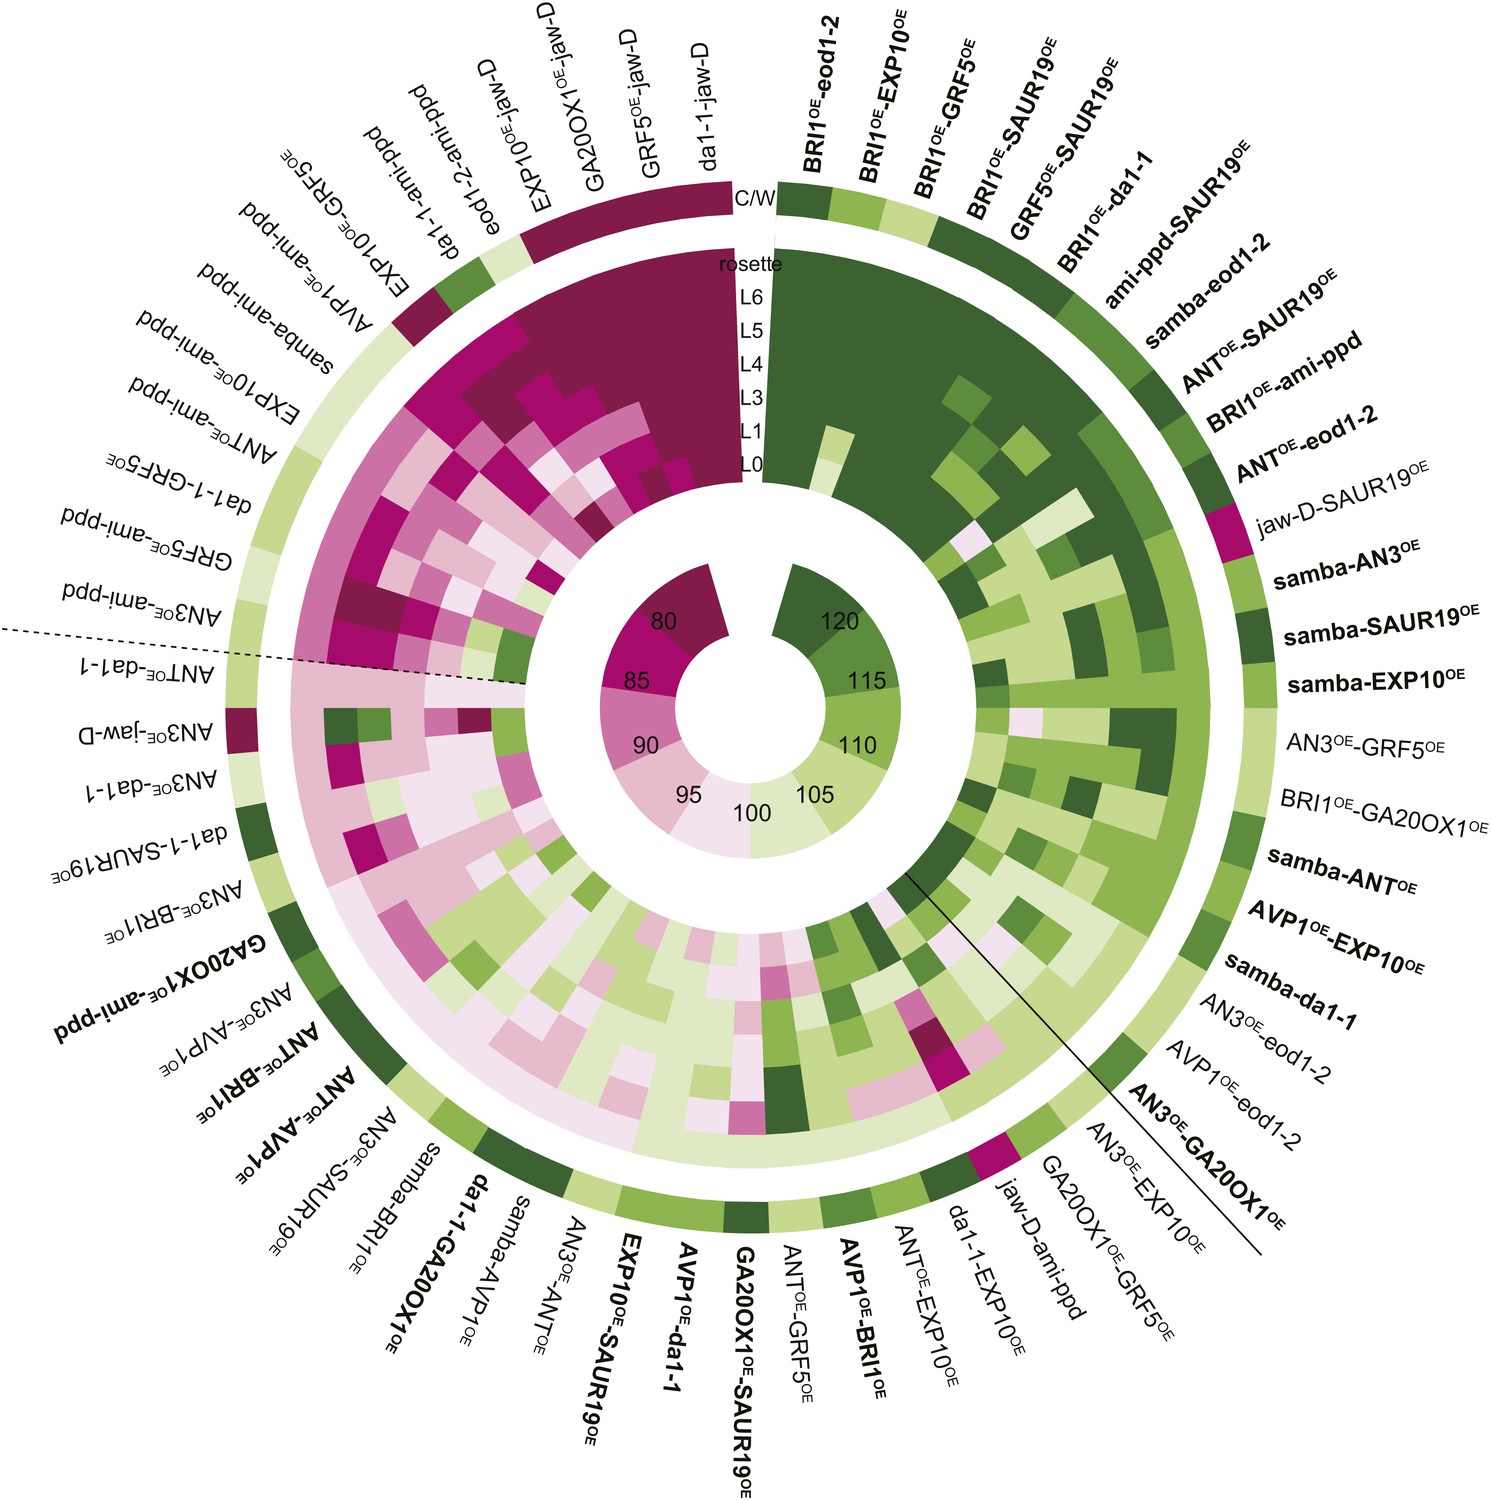
Heat map representing the effect of the binary combinations for rosette and leaf area.
The outer ring shows the percentage of the rosette size of the combinations compared to the WT (C/W). In the middle rings, percentages of the observed sizes of the cotyledons (L0) until leaf 6 (L6) and the complete rosette are shown compared to the expected if non-interacting value (EXPni). Significant differences to the rosette EXPni value (FDR <0.05) allowed identifying synergistic interactions (black line) and negative interactions (dashed line) between two transgenic lines. The inner circle shows the color code with dark pink being the lowest and deep green being the highest value. Combinations that are at least 5% larger than each of their heterozygous controls are marked in bold.
Figure 1—figure supplement 1
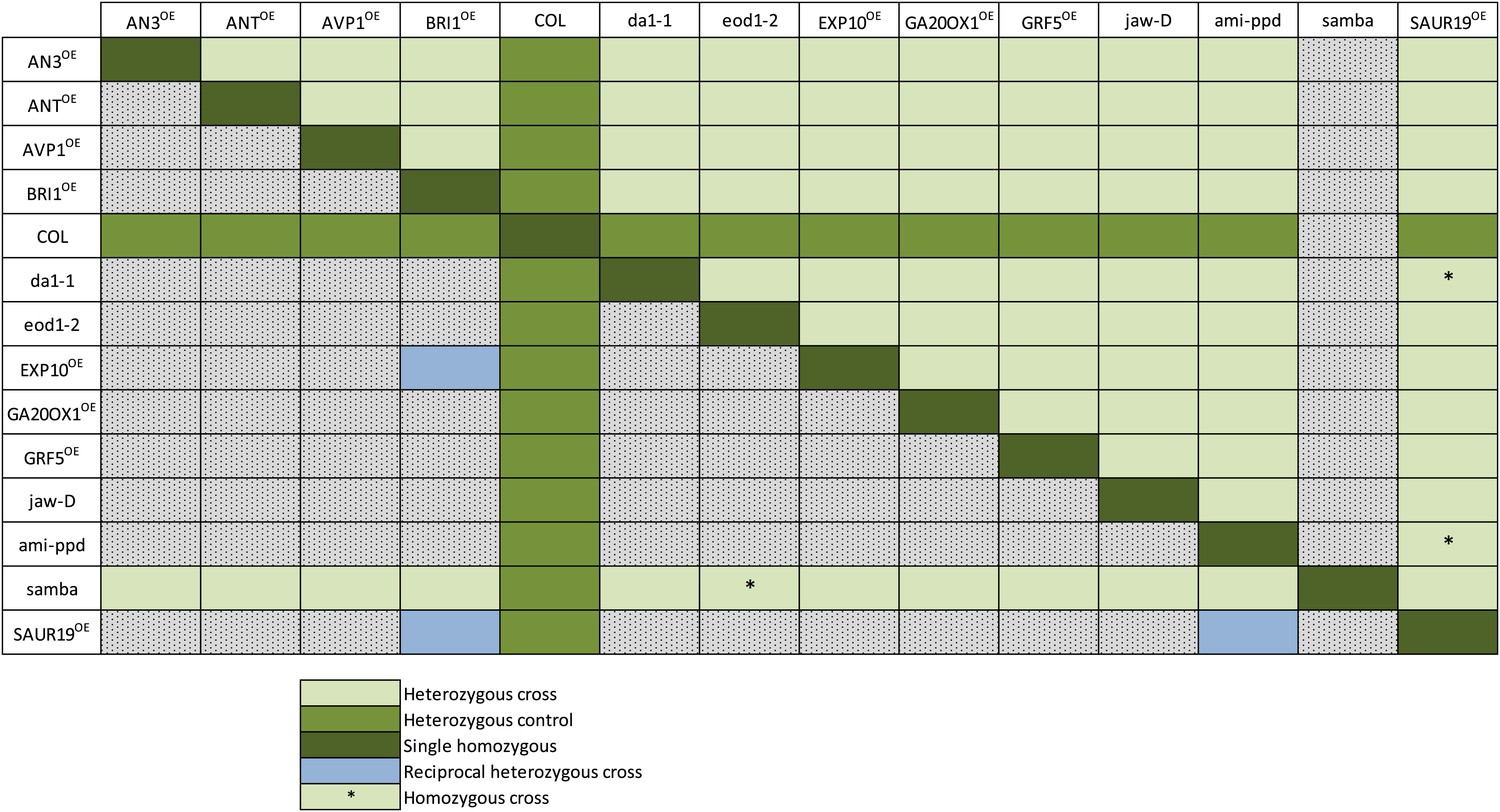
Overview of all heterozygous and homozygous combinations and their controls (Col x mutant or mutant x Col) obtained by crosses.
Horizontally, the pollen donors are shown and vertically the pollen receptors. The samba mutant plants were mostly used as a pollen receptor because they produce little pollen. The heterozygous gene combinations are shown in light green and their controls in darker green. Reciprocal heterozygous crosses are shown in blue and the homozygous combinations are indicated with an (*).
Figure 1—figure supplement 2
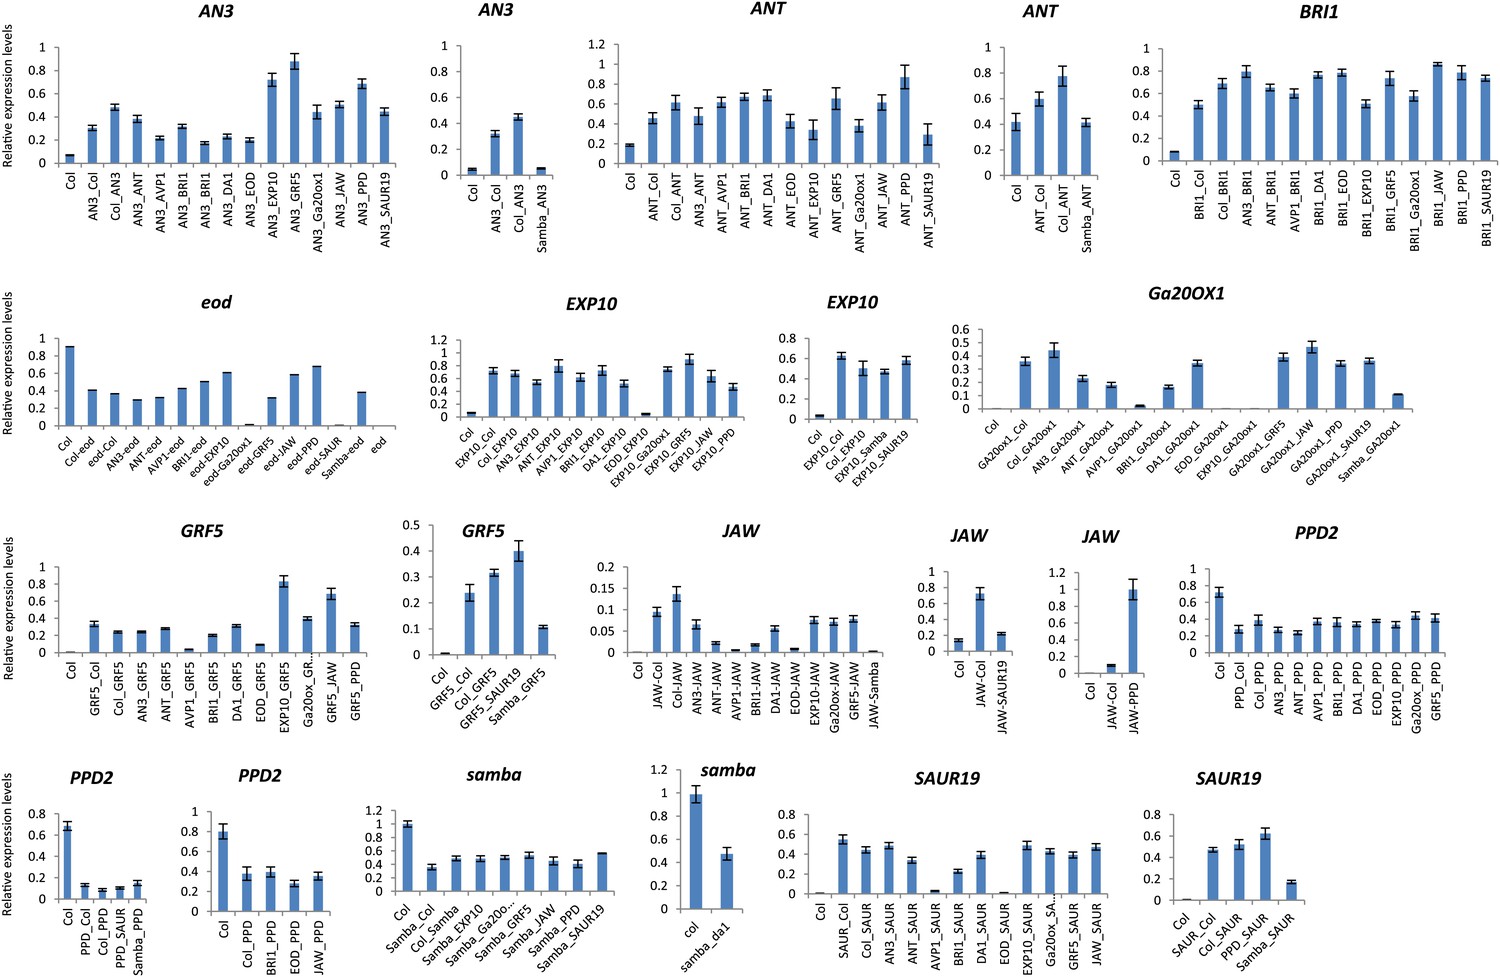
Relative gene expression levels in the heterozygous binary combinations and their controls.
Each graph represents the relative expression of a gene of interest in Col-0, the heterozygous control and the heterozygous combinations.
Figure 1—figure supplement 3
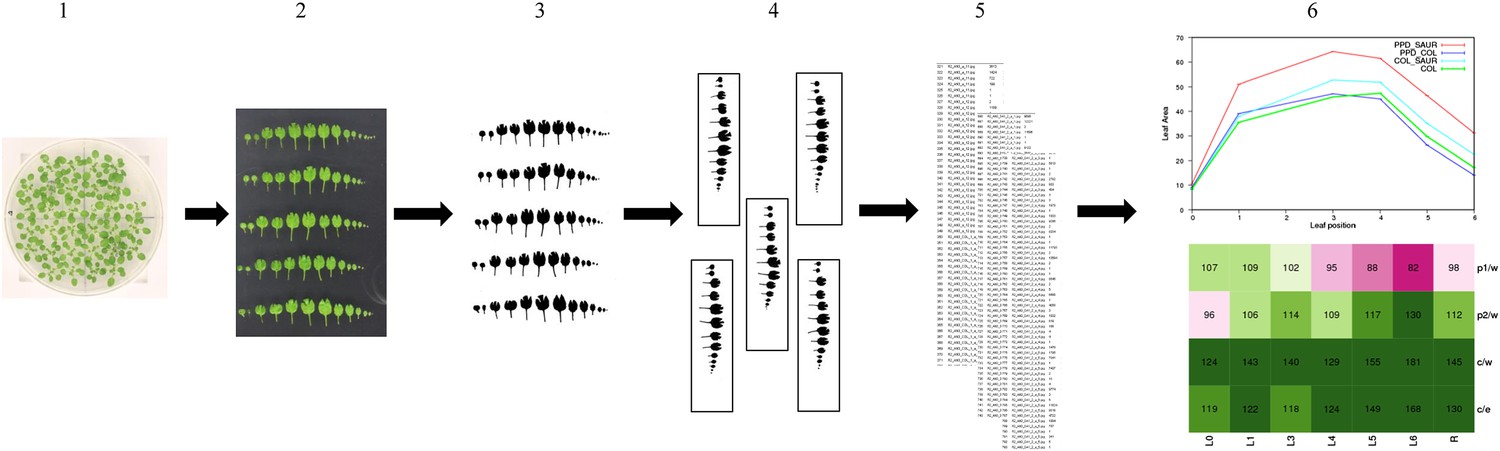
Phenotypic analysis workflow.
16 plants per genotype were grown in three independent repeats and at 21 DAS (1), leaf series were made (2) to measure the individual leaf size (5). Images of the leaf series were pre-processed (3–4) and the individual leaf area was measured (5) with ImageJ v1.45 (NIH; http://rsb.info.nih.gov/ij/). The data was analyzed using a mixed model and the effect size for the genotypes were calculated (‘Materials and methods’). Finally, these estimates of the single control lines and the double transgenics were plotted in graphs (6) and compared to the wild-type and a calculated expected if additive value in heatmaps (6).
Figure 1—figure supplement 4
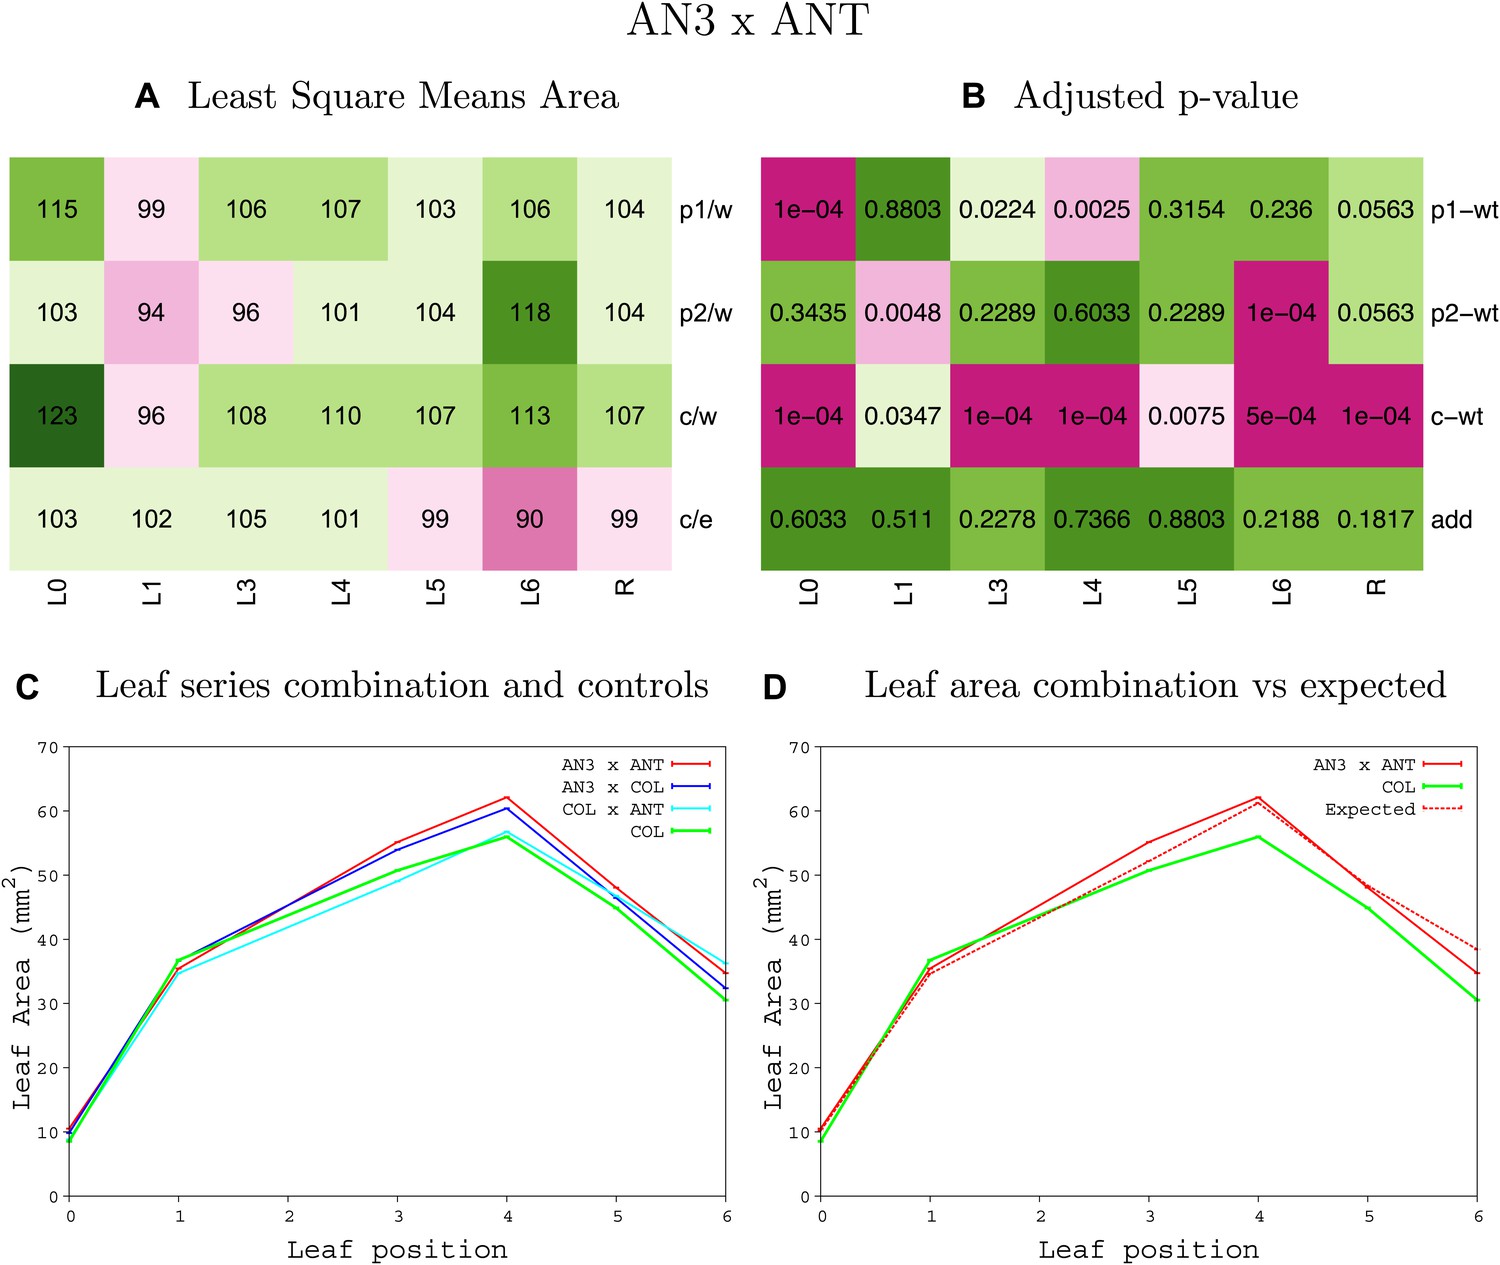
Statistical output of the phenotypic data for the heterozygous combination AN3OE-ANTOE.
Top left panel (A): p1/w, p2/w, c/w: percentage of the area to the WT (w) of parent 1 (p1), parent 2 (p2) and the combination (C) respectively. c/e: percentage of the area of the combination (C) to the expected if non-interacting value (EXPni) (e). Top right panel (B), corresponding FDRs for the percentages presented in the top left panel. The cotyledons (L0), first six leaves (L1–L6) and the rosette (R) are represented. Bottom left panel (C): graphs representing leaf areas for the WT (green), the combination (red) and both single lines (dark and light blue) in mm2. Bottom right panel: graph showing the leaf area of the combination (red) and the WT (green) compared to the calculated EXPni (dotted red).
Figure 1—figure supplement 5
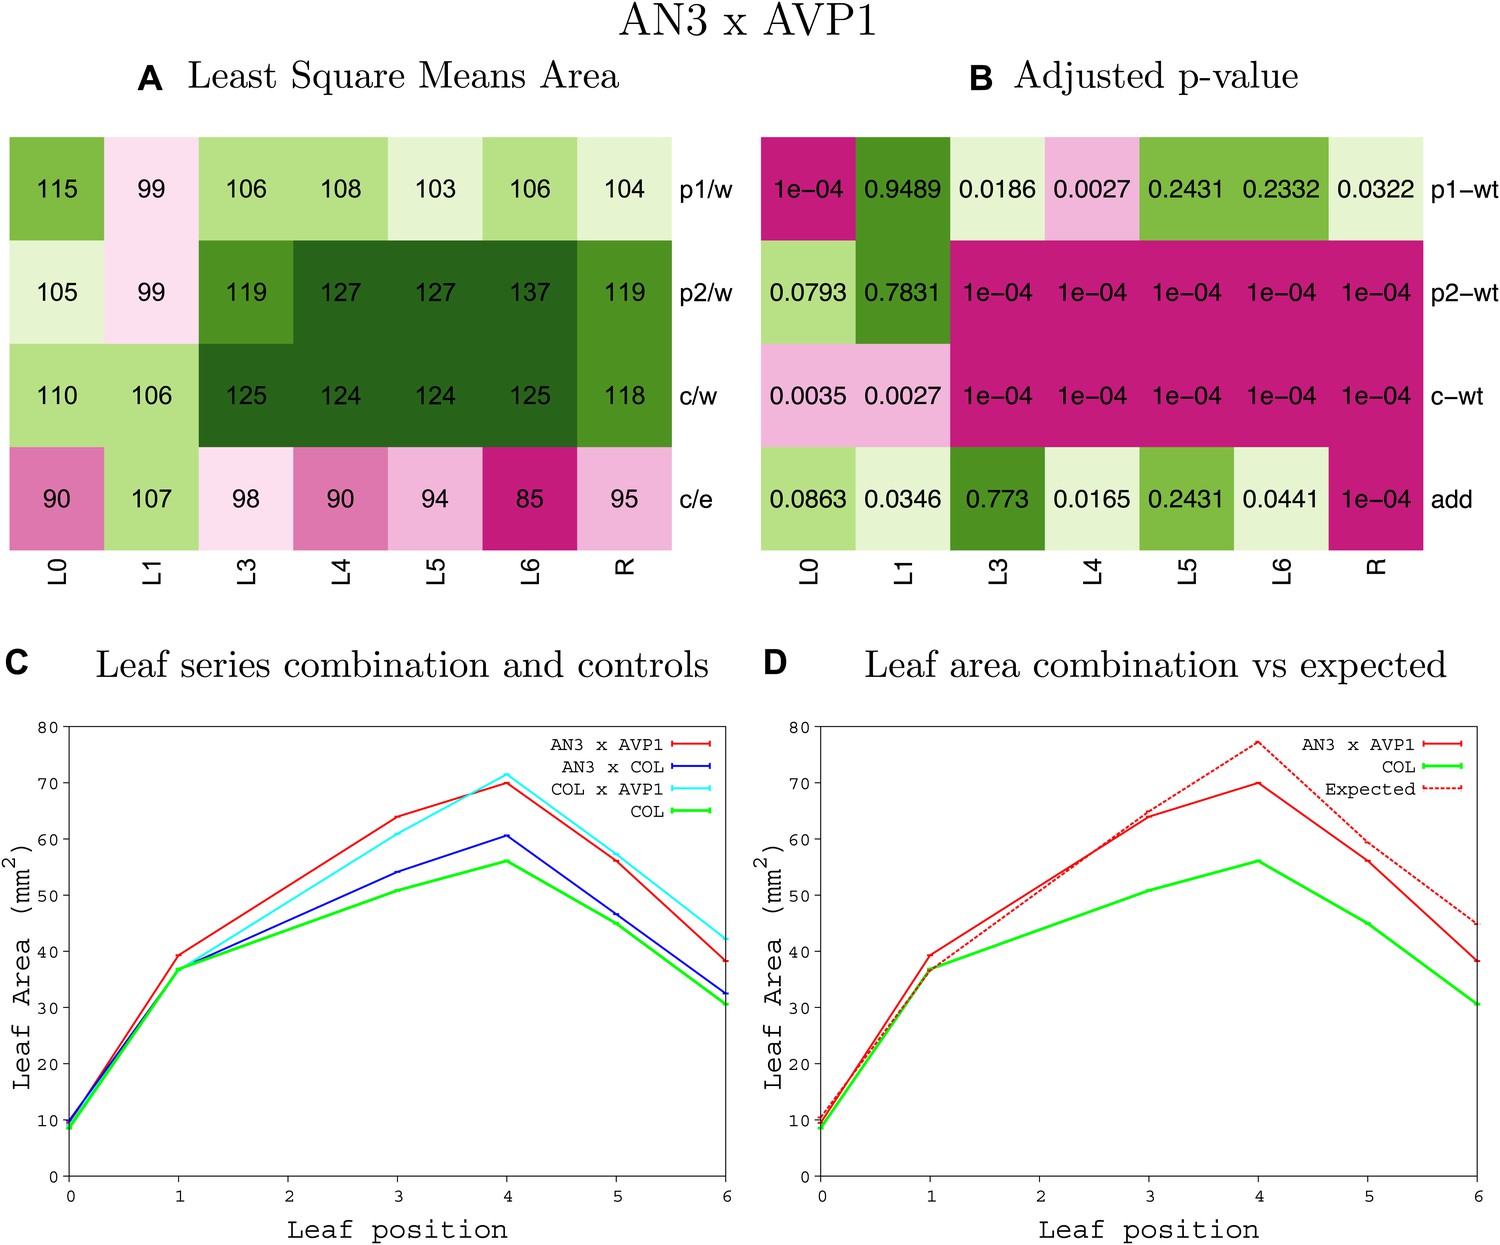
Statistical output of the phenotypic data for the heterozygous combination AN3OE-AVP1OE.
Top left panel (A): p1/w, p2/w, c/w: percentage of the area to the WT (w) of parent 1 (p1), parent 2 (p2) and the combination (C) respectively. c/e: percentage of the area of the combination (C) to the expected if non-interacting value (EXPni) (e). Top right panel (B), corresponding FDRs for the percentages presented in the top left panel. The cotyledons (L0), first six leaves (L1–L6) and the rosette (R) are represented. Bottom left panel (C): graphs representing leaf areas for the WT (green), the combination (red) and both single lines (dark and light blue) in mm2. Bottom right panel: graph showing the leaf area of the combination (red) and the WT (green) compared to the calculated EXPni (dotted red).
Figure 1—figure supplement 6
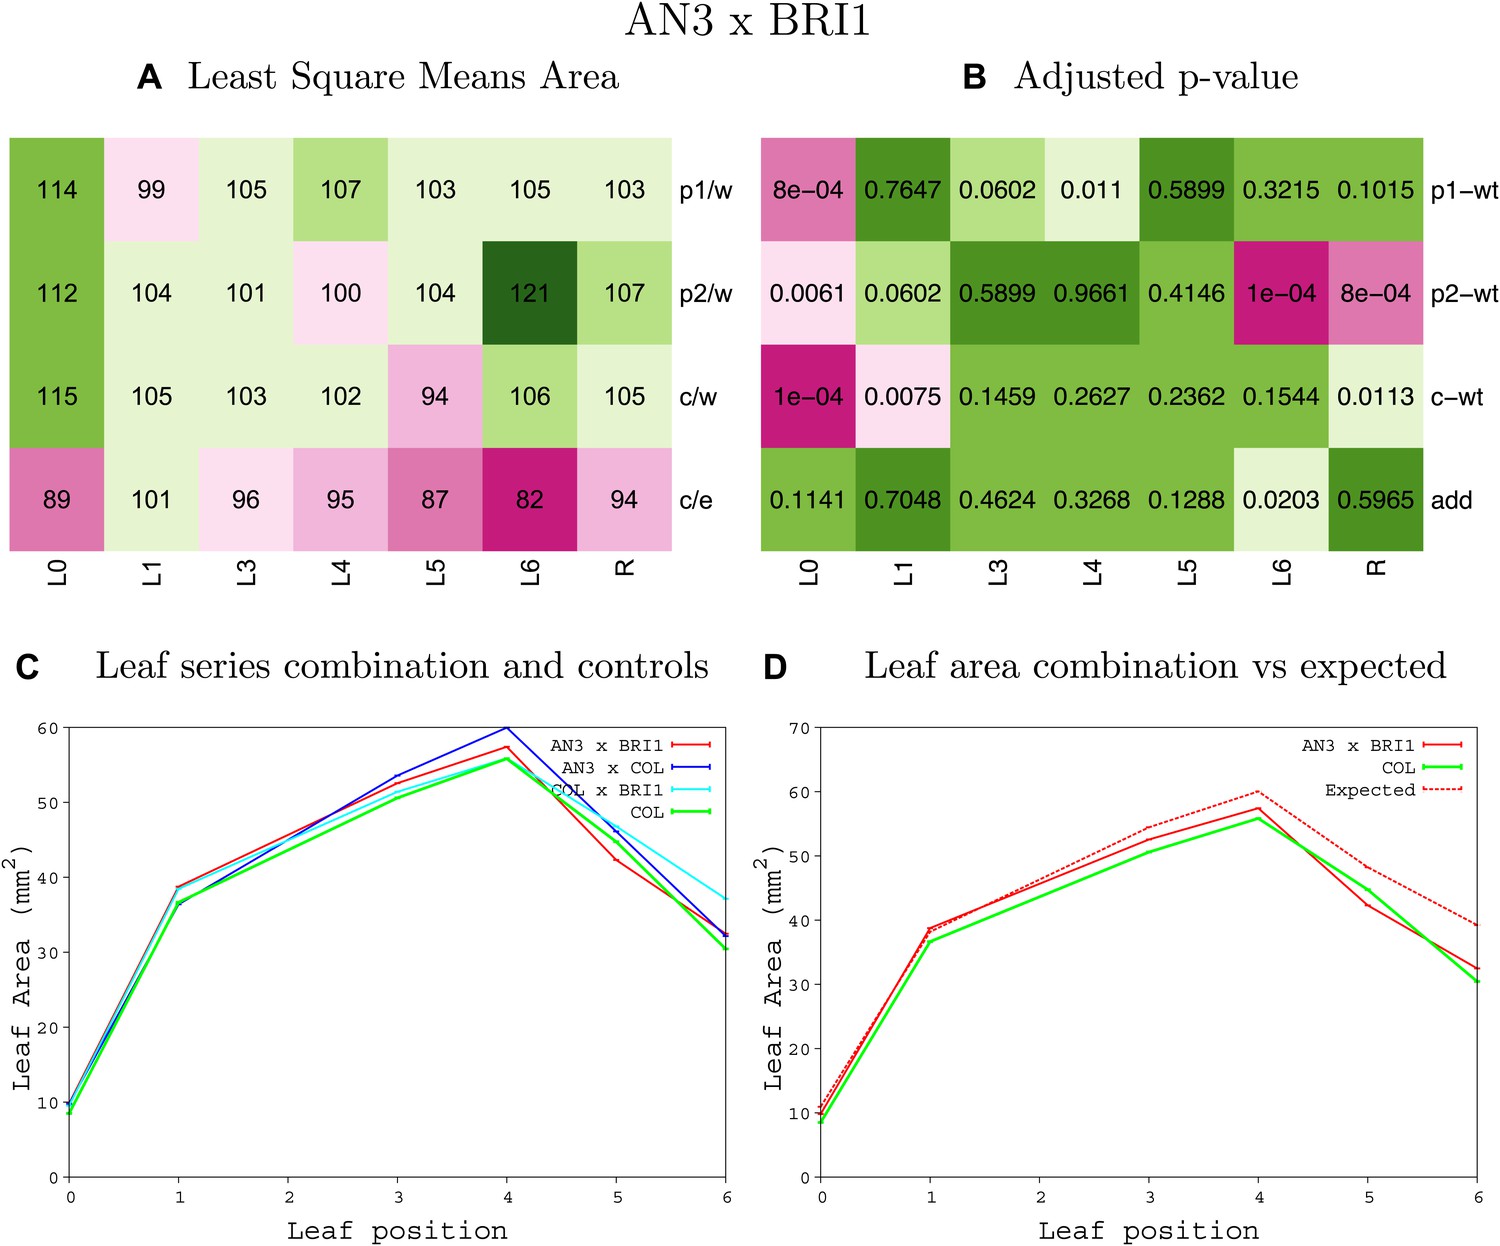
Statistical output of the phenotypic data for the heterozygous combination AN3OE-BRIOE.
Top left panel (A): p1/w, p2/w, c/w: percentage of the area to the WT (w) of parent 1 (p1), parent 2 (p2) and the combination (C) respectively. c/e: percentage of the area of the combination (C) to the expected if non-interacting value (EXPni) (e). Top right panel (B), corresponding FDRs for the percentages presented in the top left panel. The cotyledons (L0), first six leaves (L1–L6) and the rosette (R) are represented. Bottom left panel (C): graphs representing leaf areas for the WT (green), the combination (red) and both single lines (dark and light blue) in mm2. Bottom right panel: graph showing the leaf area of the combination (red) and the WT (green) compared to the calculated EXPni (dotted red).
Figure 1—figure supplement 7
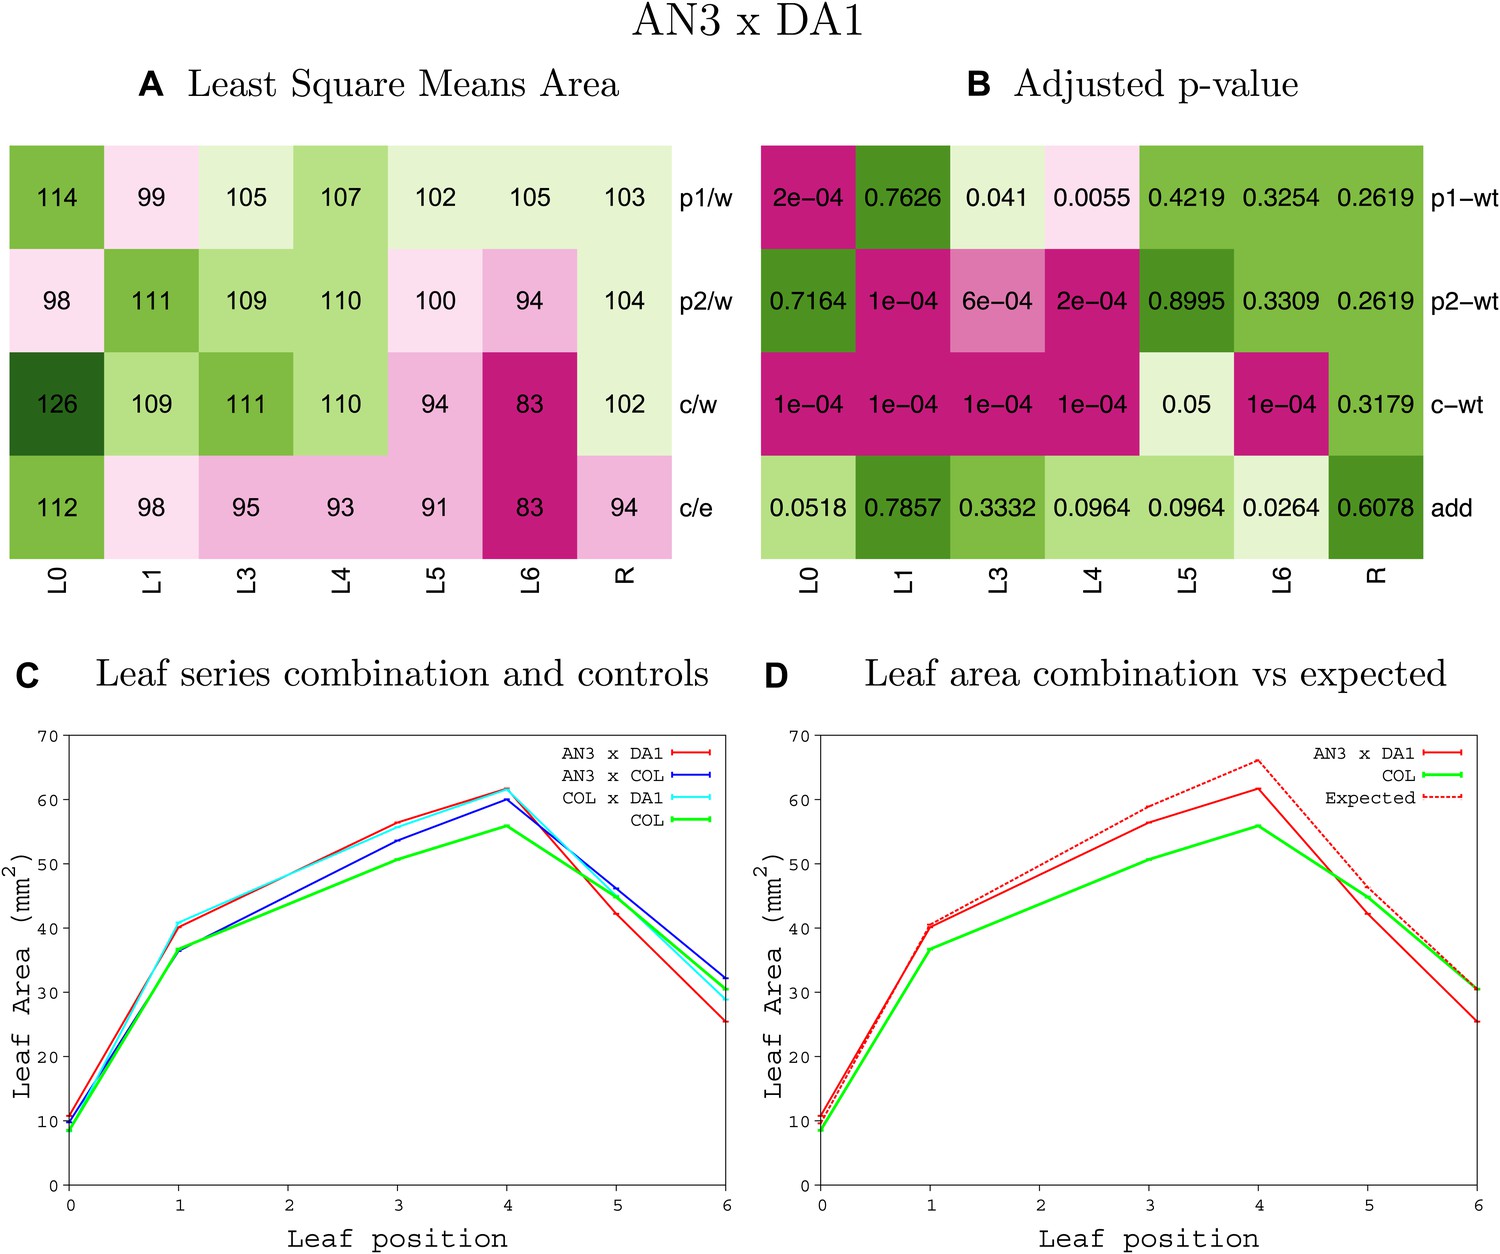
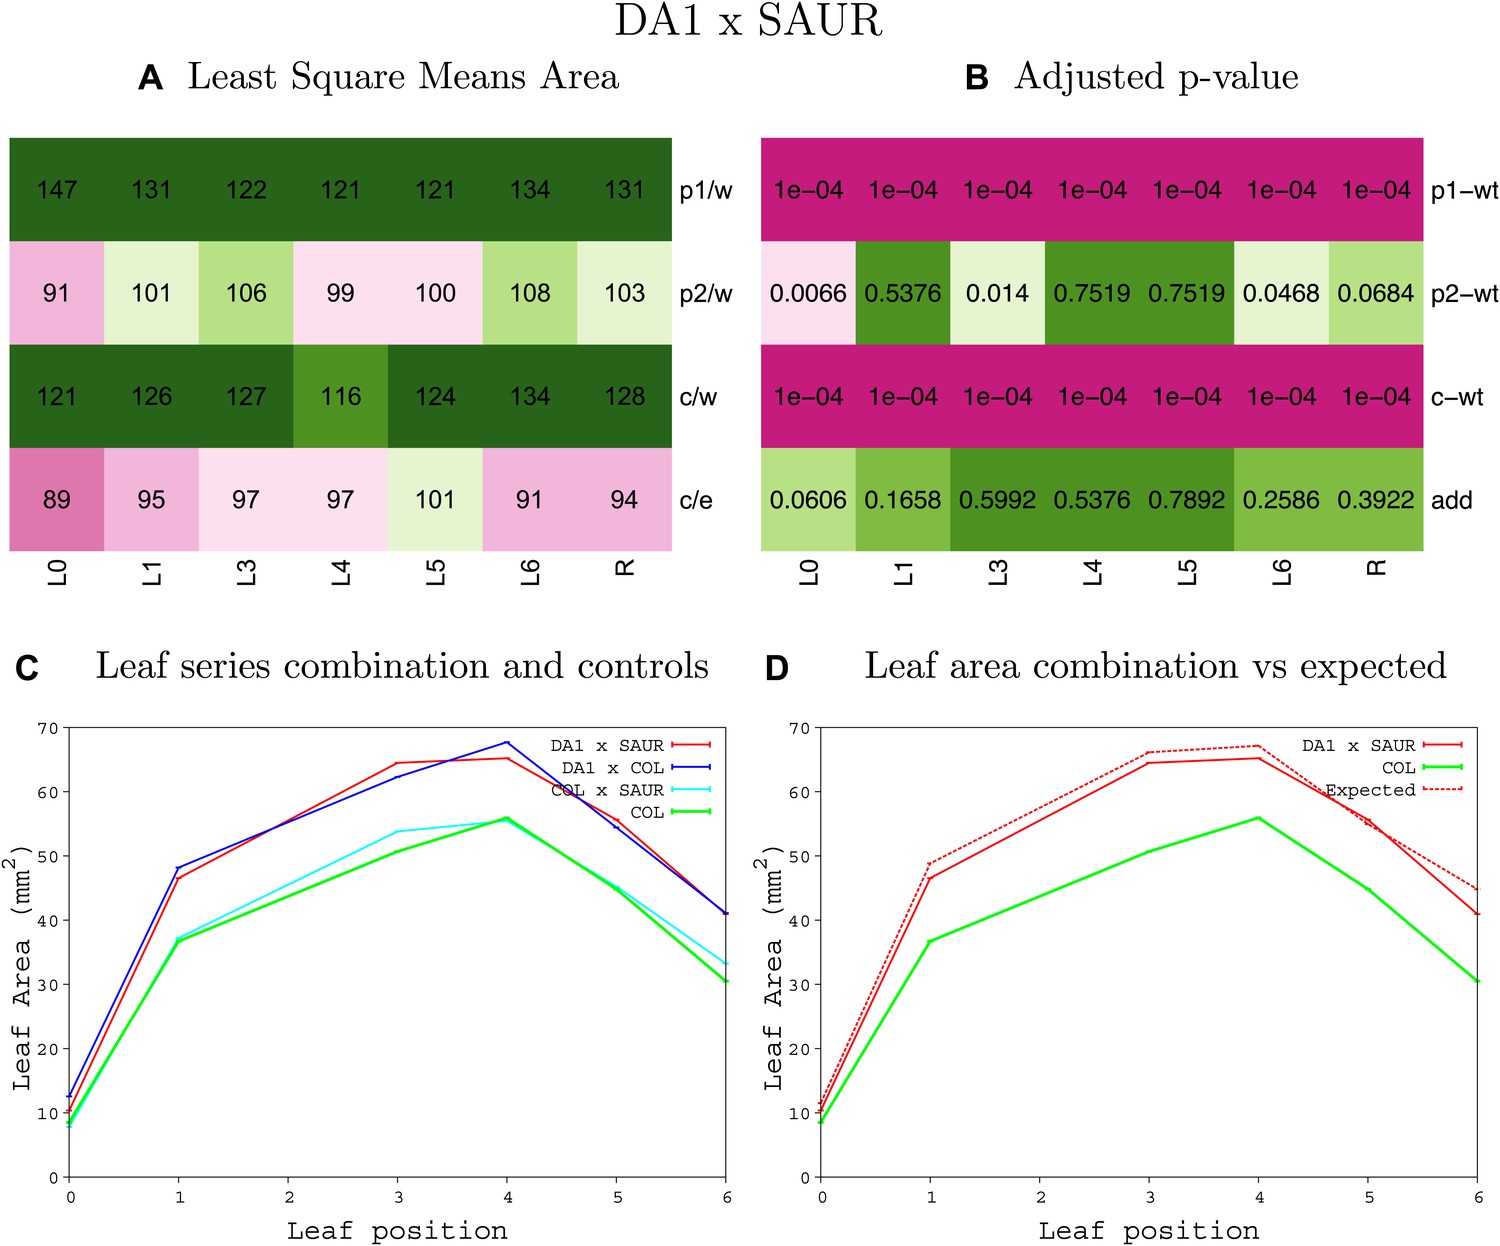
Statistical output of the phenotypic data for the heterozygous combination AN3OE-da1-1.
Top left panel (A): p1/w, p2/w, c/w: percentage of the area to the WT (w) of parent 1 (p1), parent 2 (p2) and the combination (C) respectively. c/e: percentage of the area of the combination (C) to the expected if non-interacting value (EXPni) (e). Top right panel (B), corresponding FDRs for the percentages presented in the top left panel. The cotyledons (L0), first six leaves (L1-L6) and the rosette (R) are represented. Bottom left panel (C): graphs representing leaf areas for the WT (green), the combination (red) and both single lines (dark and light blue) in mm2. Bottom right panel: graph showing the leaf area of the combination (red) and the WT (green) compared to the calculated EXPni (dotted red).
Figure 1—figure supplement 8
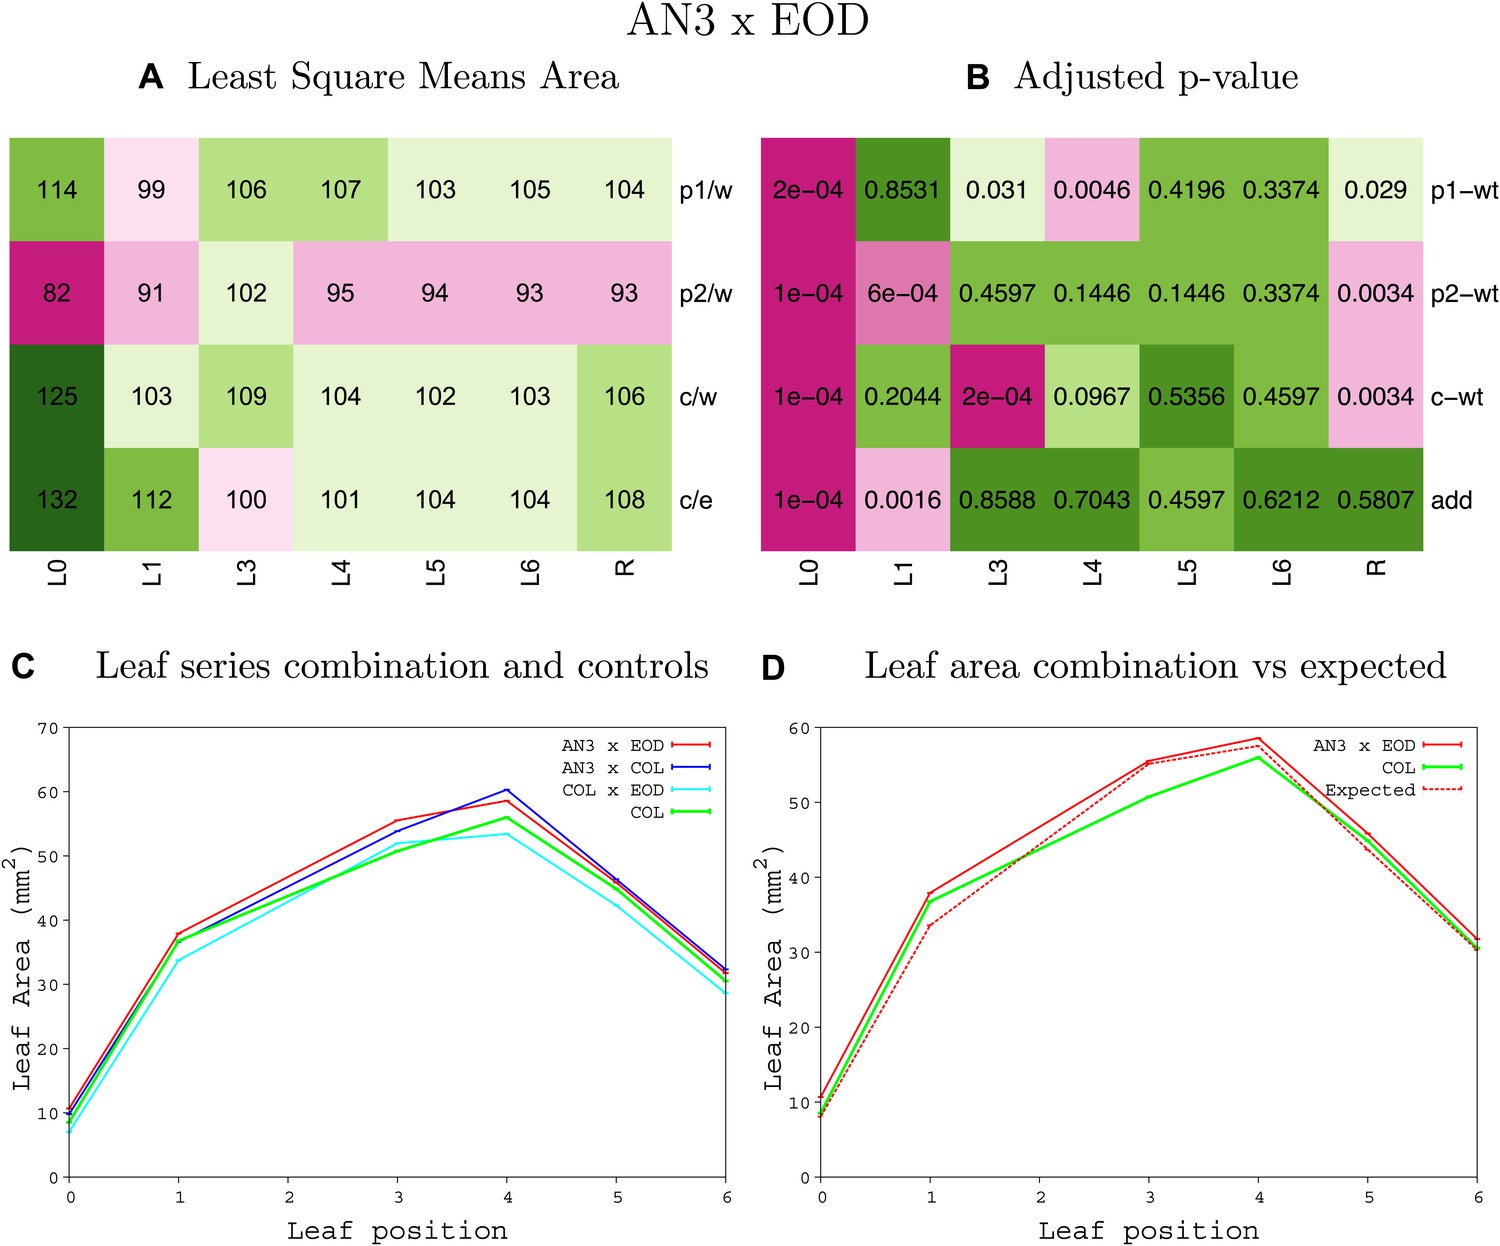
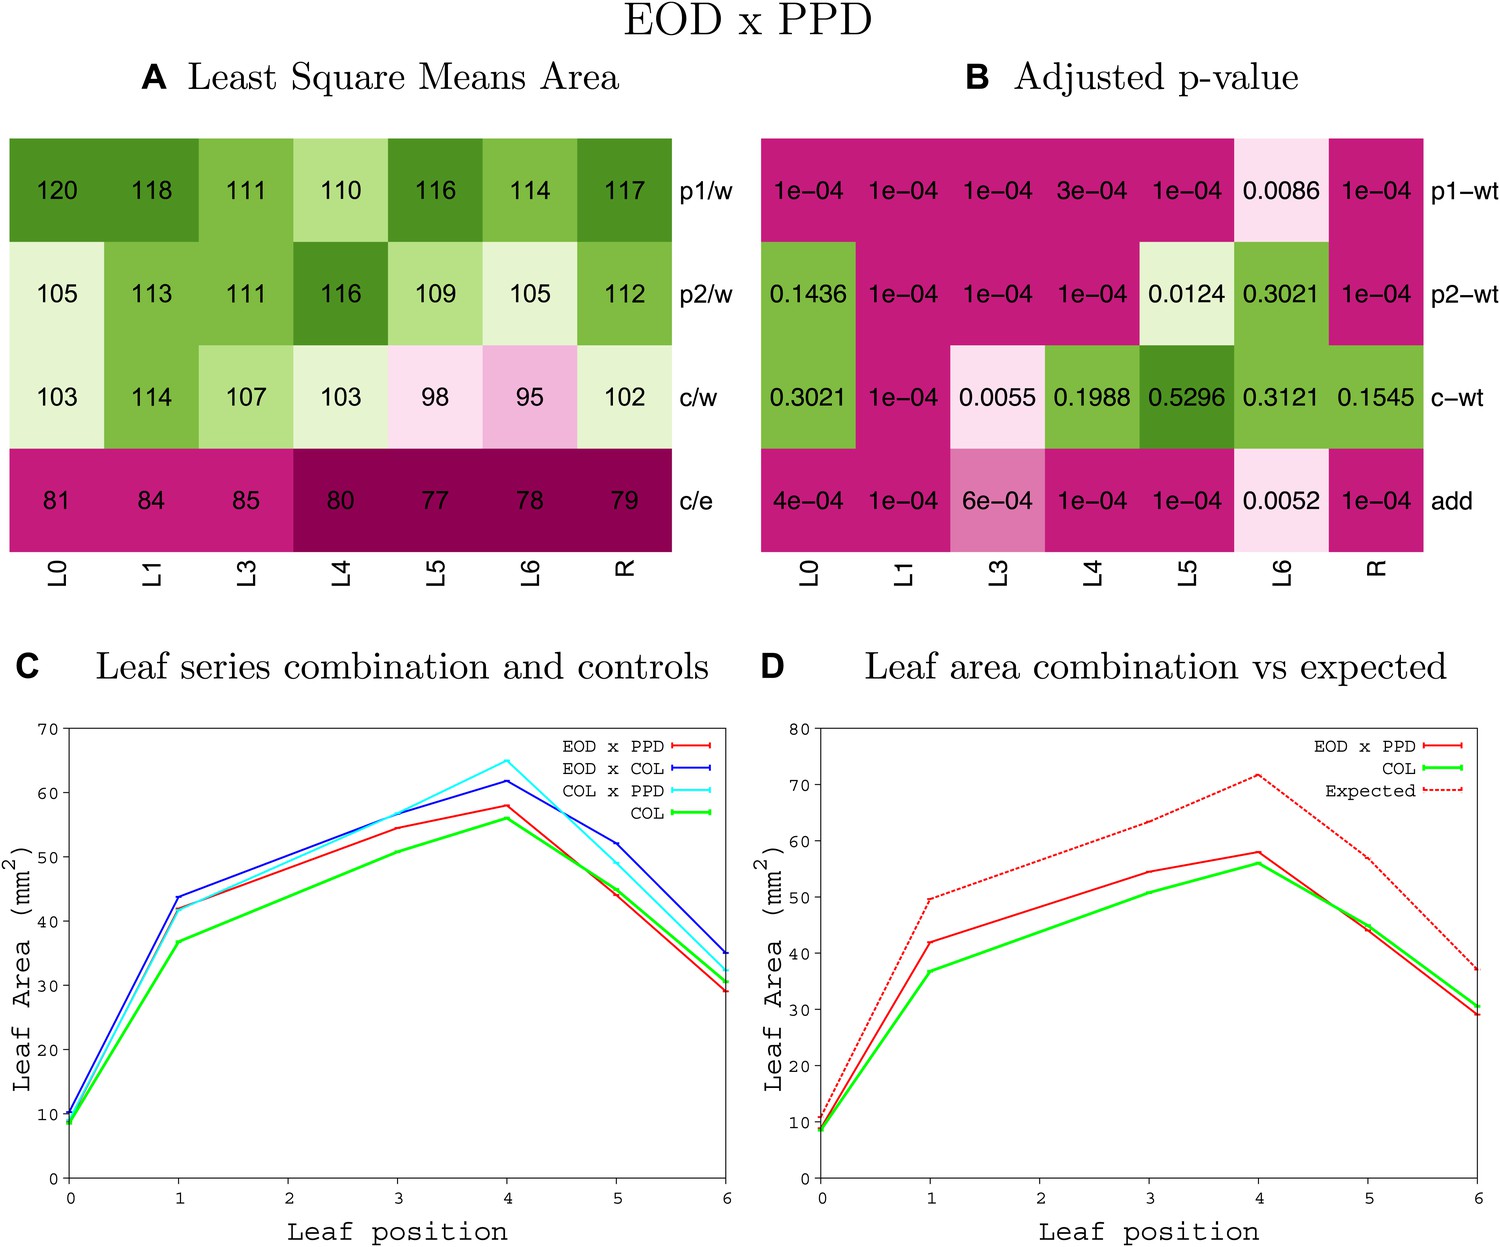
Statistical output of the phenotypic data for the heterozygous combination AN3OE-eod1-2.
Top left panel (A): p1/w, p2/w, c/w: percentage of the area to the WT (w) of parent 1 (p1), parent 2 (p2) and the combination (C) respectively. c/e: percentage of the area of the combination (C) to the expected if non-interacting value (EXPni) (e). Top right panel (B), corresponding FDRs for the percentages presented in the top left panel. The cotyledons (L0), first six leaves (L1–L6) and the rosette (R) are represented. Bottom left panel (C): graphs representing leaf areas for the WT (green), the combination (red) and both single lines (dark and light blue) in mm2. Bottom right panel: graph showing the leaf area of the combination (red) and the WT (green) compared to the calculated EXPni (dotted red).
Figure 1—figure supplement 9
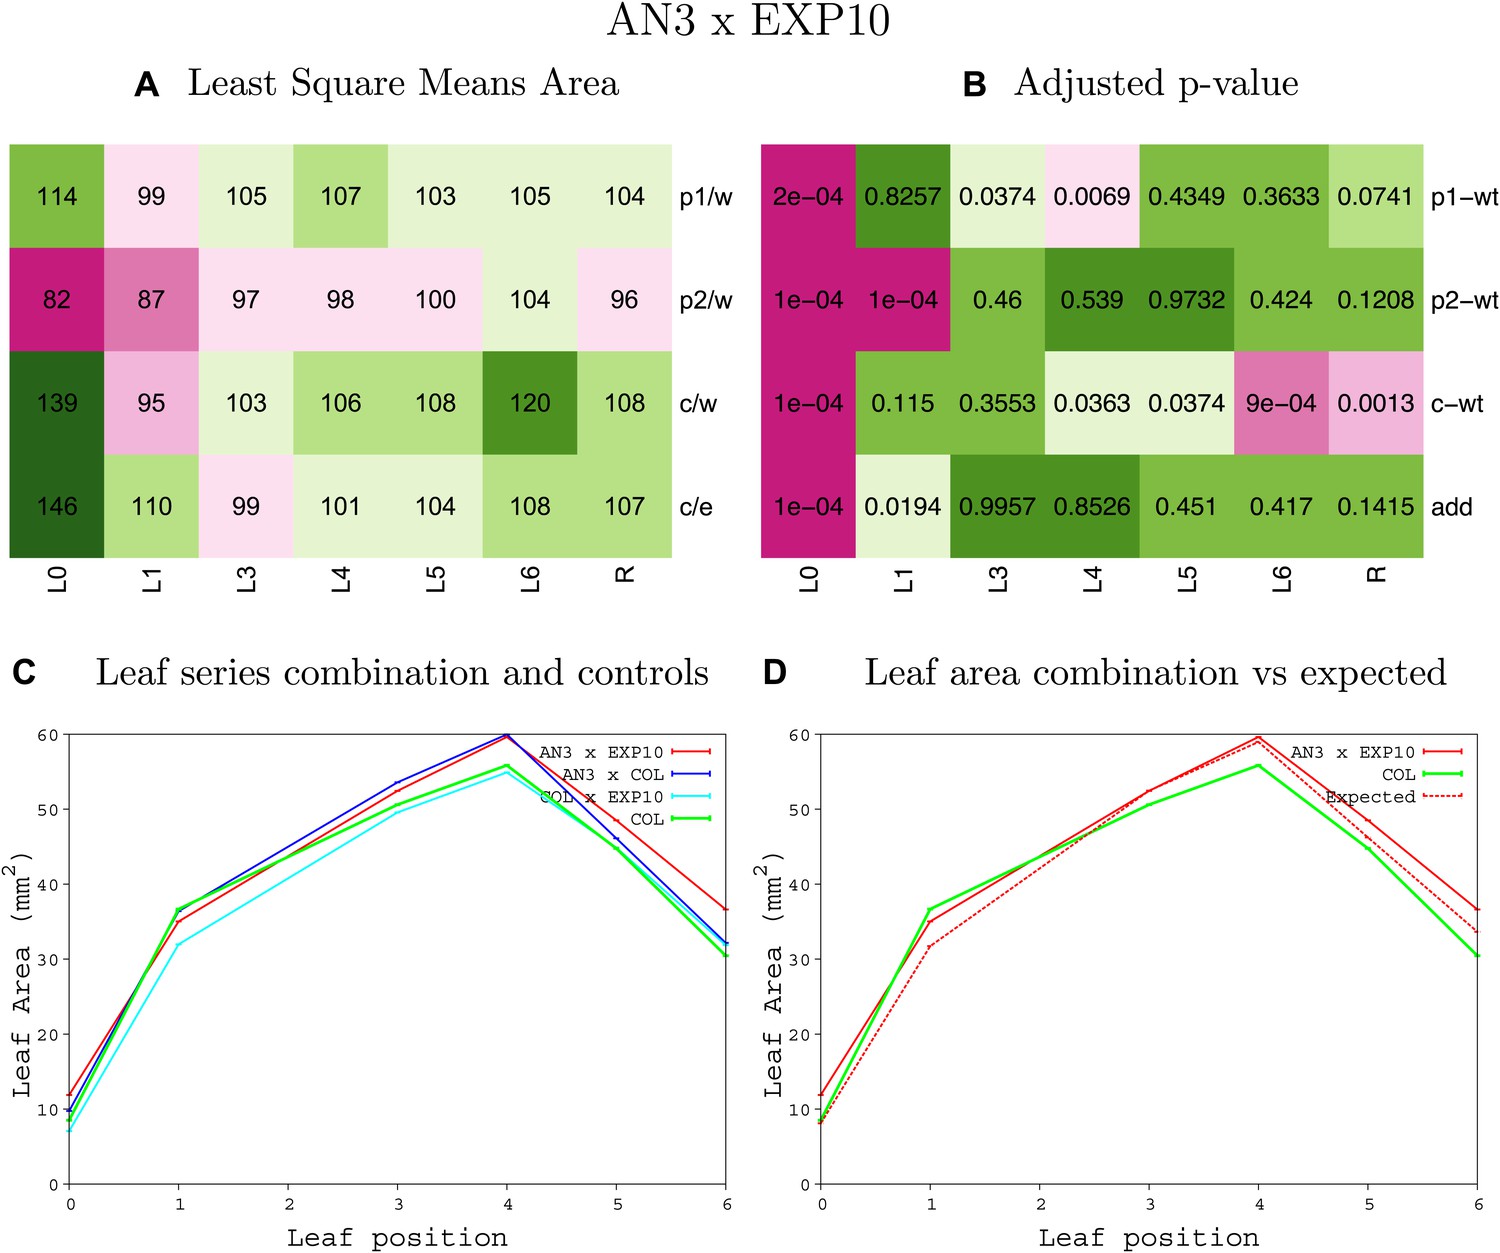
Statistical output of the phenotypic data for the heterozygous combination AN3OE-EXP10OE.
Top left panel (A): p1/w, p2/w, c/w: percentage of the area to the WT (w) of parent 1 (p1), parent 2 (p2) and the combination (C) respectively. c/e: percentage of the area of the combination (C) to the expected if non-interacting value (EXPni) (e). Top right panel (B), corresponding FDRs for the percentages presented in the top left panel. The cotyledons (L0), first six leaves (L1–L6) and the rosette (R) are represented. Bottom left panel (C): graphs representing leaf areas for the WT (green), the combination (red) and both single lines (dark and light blue) in mm2. Bottom right panel: graph showing the leaf area of the combination (red) and the WT (green) compared to the calculated EXPni (dotted red).
Figure 1—figure supplement 10
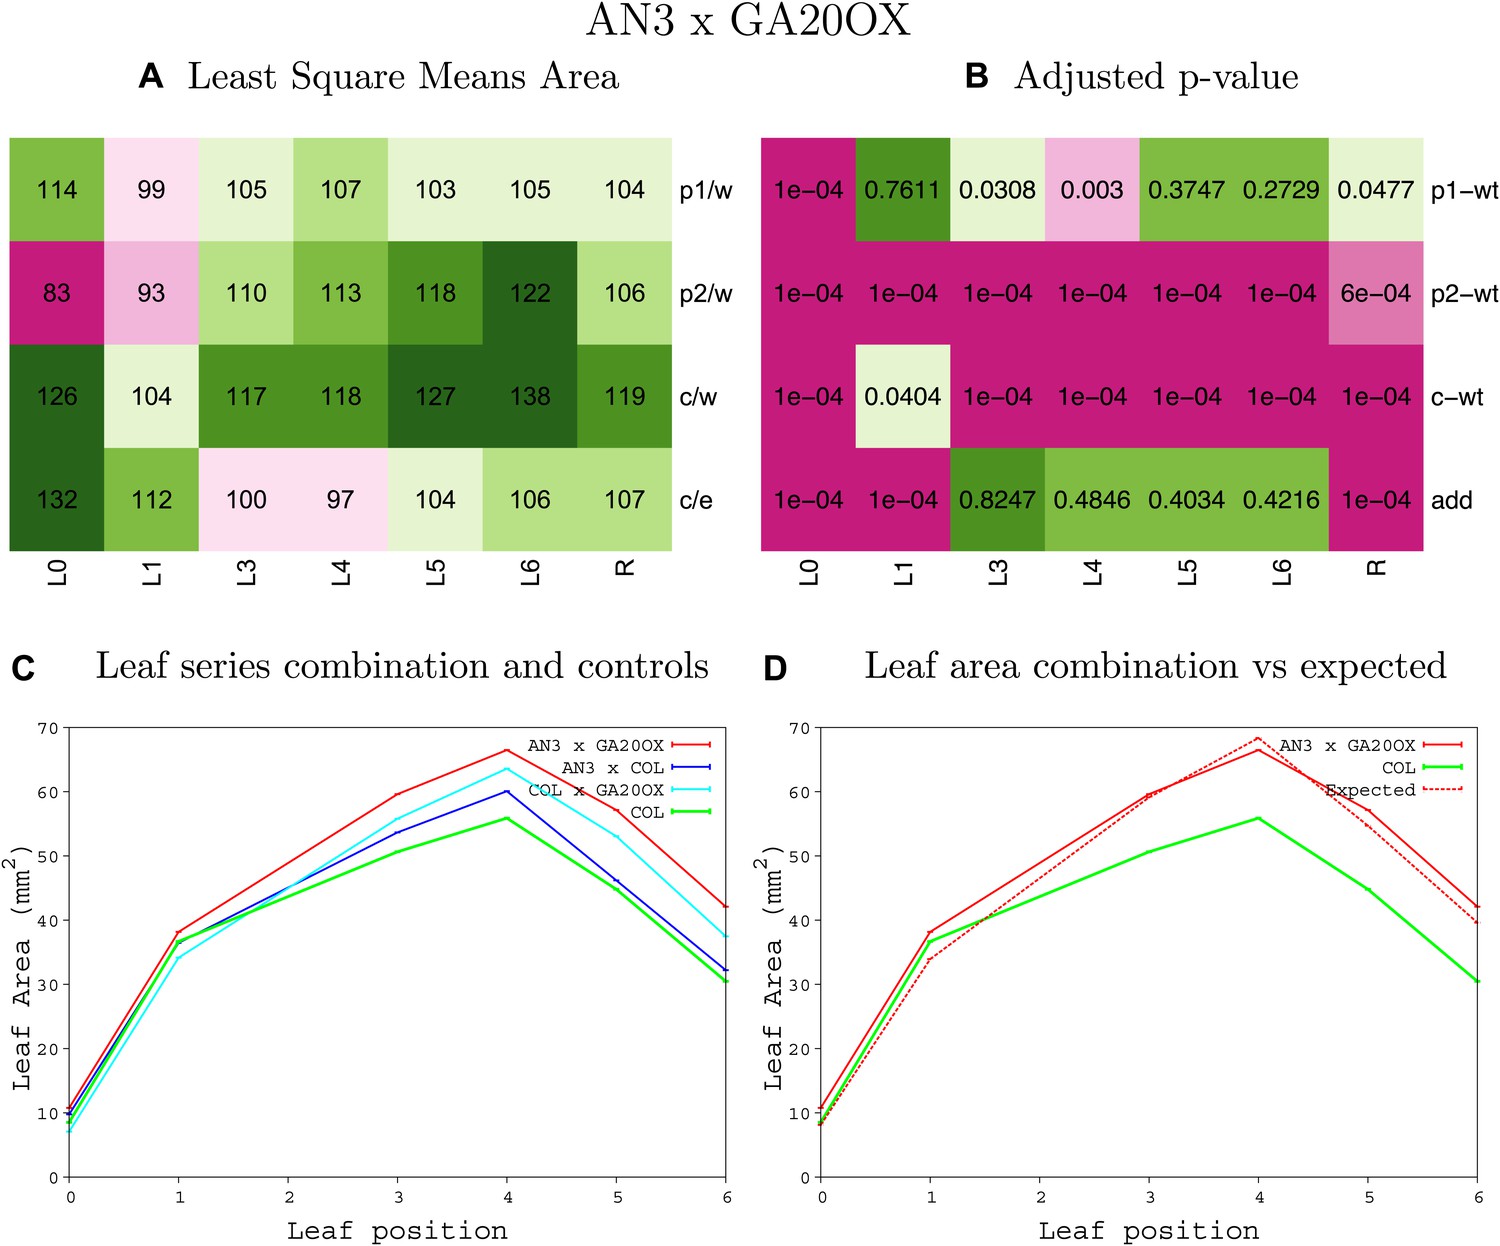
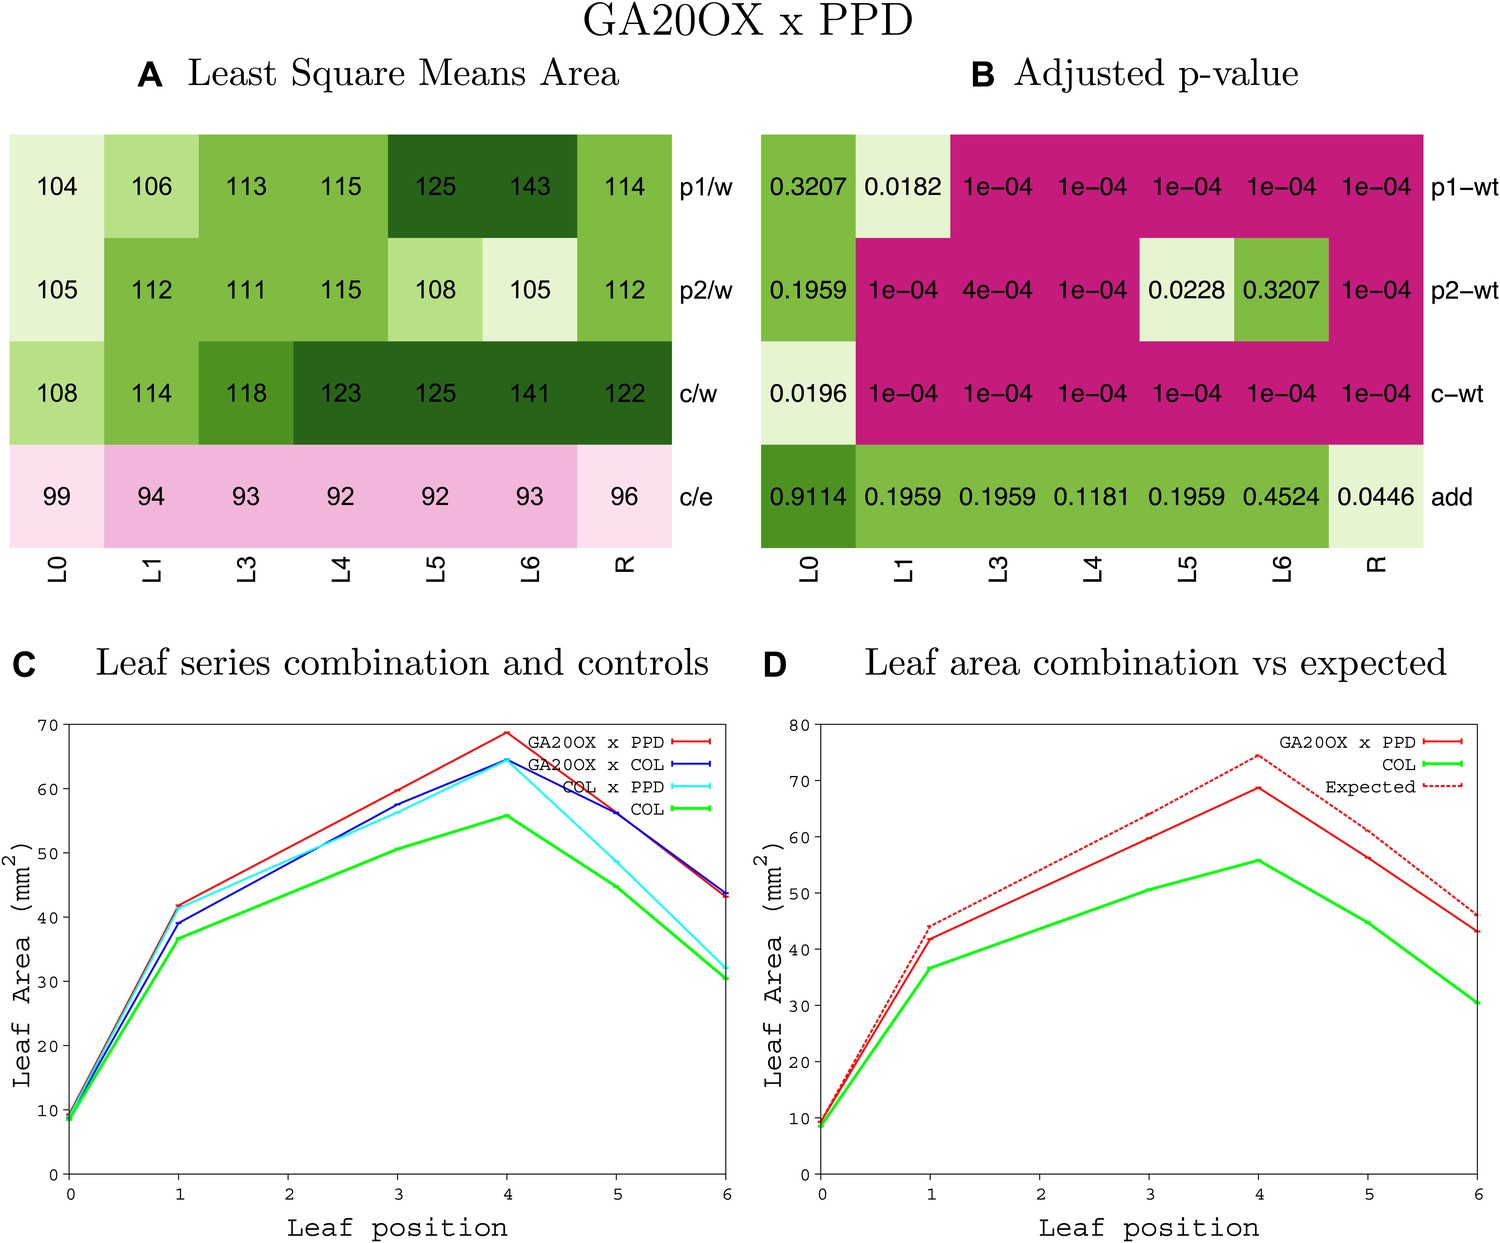
Statistical output of the phenotypic data for the heterozygous combination AN3OE-GA20OX1OE.
Top left panel (A): p1/w, p2/w, c/w: percentage of the area to the WT (w) of parent 1 (p1), parent 2 (p2) and the combination (C) respectively. c/e: percentage of the area of the combination (C) to the expected if non-interacting value (EXPni) (e). Top right panel (B), corresponding FDRs for the percentages presented in the top left panel. The cotyledons (L0), first six leaves (L1–L6) and the rosette (R) are represented. Bottom left panel (C): graphs representing leaf areas for the WT (green), the combination (red) and both single lines (dark and light blue) in mm2. Bottom right panel: graph showing the leaf area of the combination (red) and the WT (green) compared to the calculated EXPni (dotted red).
Figure 1—figure supplement 11
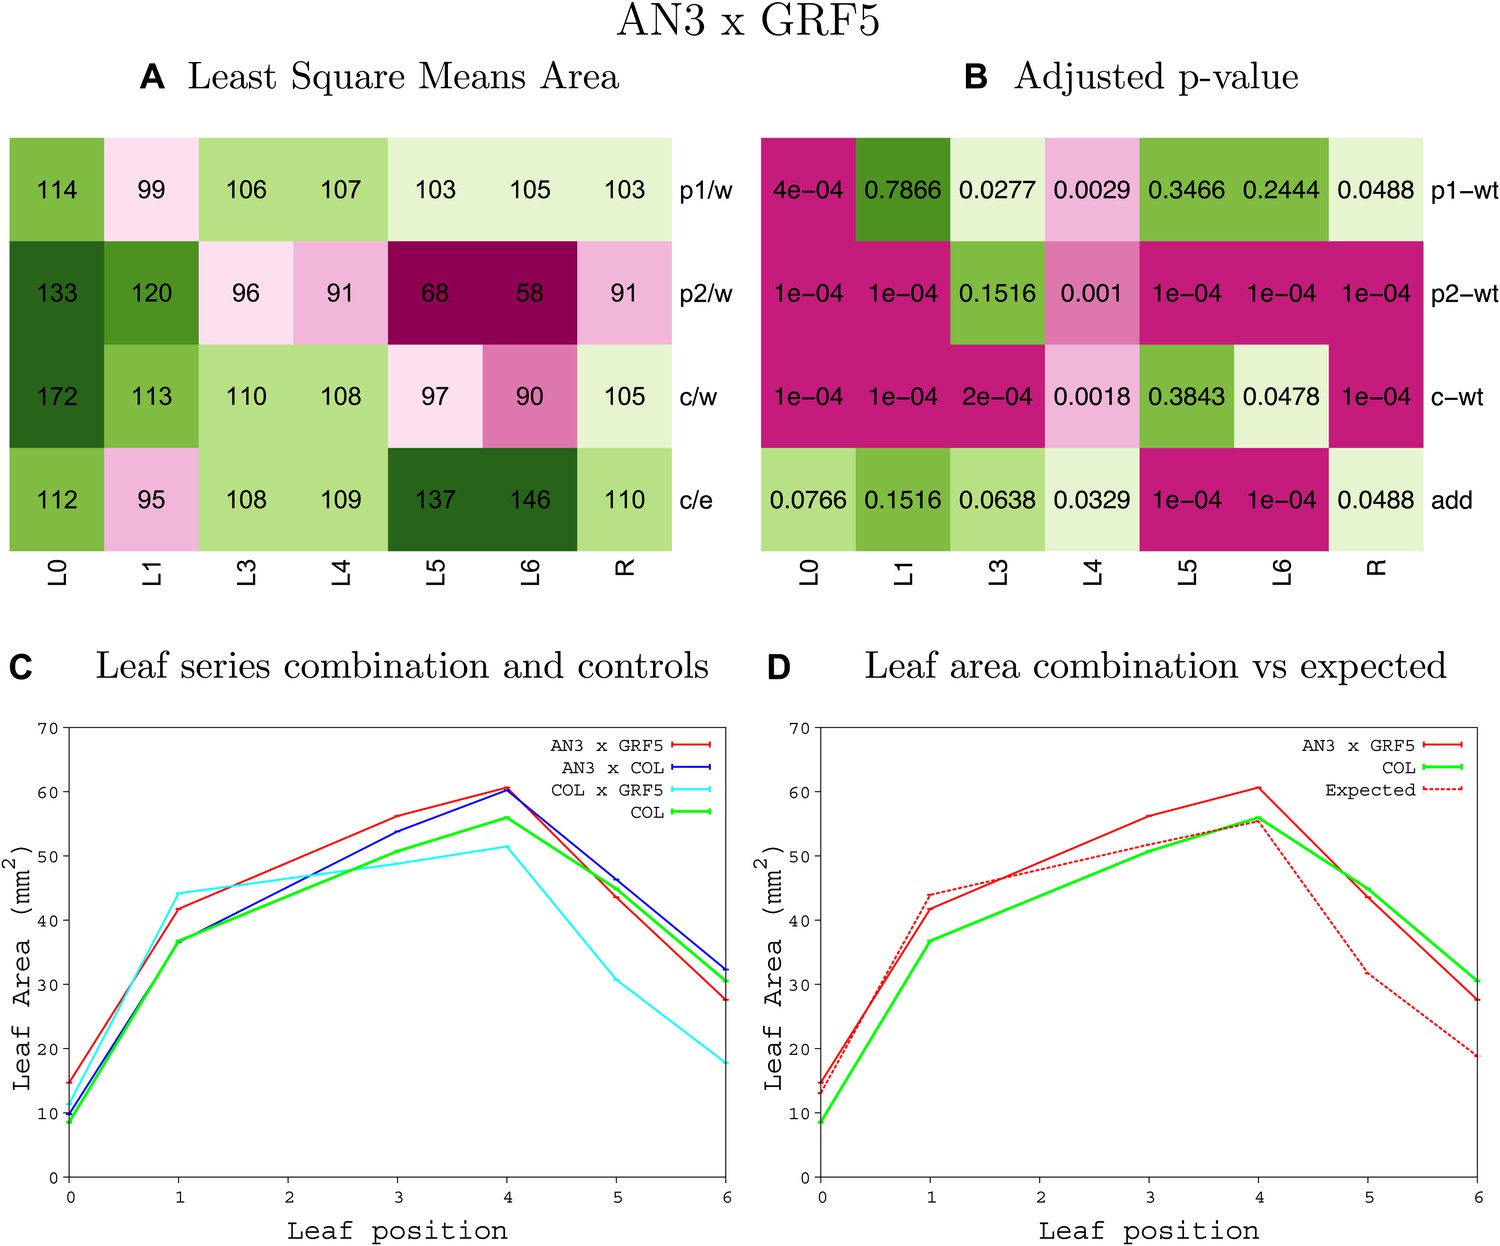
Statistical output of the phenotypic data for the heterozygous combination AN3OE-GRF5OE.
Top left panel (A): p1/w, p2/w, c/w: percentage of the area to the WT (w) of parent 1 (p1), parent 2 (p2) and the combination (C) respectively. c/e: percentage of the area of the combination (C) to the expected if non-interacting value (EXPni) (e). Top right panel (B), corresponding FDRs for the percentages presented in the top left panel. The cotyledons (L0), first six leaves (L1–L6) and the rosette (R) are represented. Bottom left panel (C): graphs representing leaf areas for the WT (green), the combination (red) and both single lines (dark and light blue) in mm2. Bottom right panel: graph showing the leaf area of the combination (red) and the WT (green) compared to the calculated EXPni (dotted red).
Figure 1—figure supplement 12
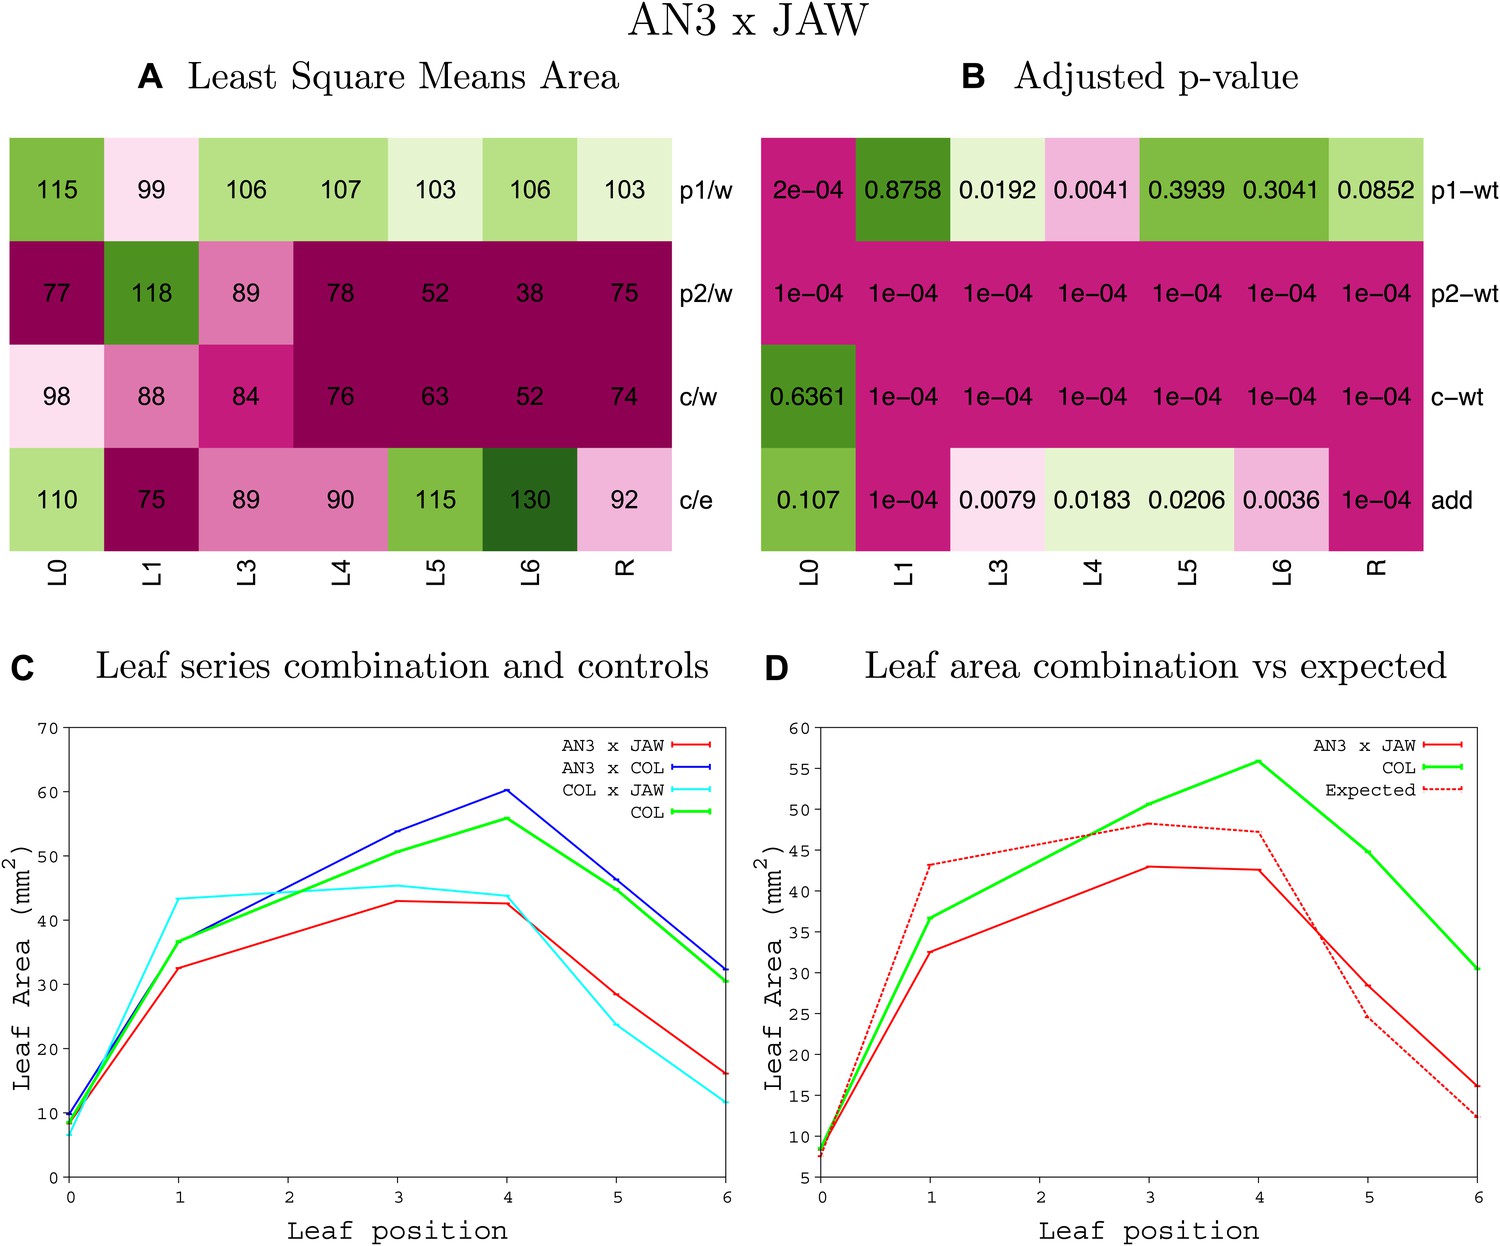
Statistical output of the phenotypic data for the heterozygous combination AN3OE-jaw-D.
Top left panel (A): p1/w, p2/w, c/w: percentage of the area to the WT (w) of parent 1 (p1), parent 2 (p2) and the combination (C) respectively. c/e: percentage of the area of the combination (C) to the expected if non-interacting value (EXPni) (e). Top right panel (B), corresponding FDRs for the percentages presented in the top left panel. The cotyledons (L0), first six leaves (L1–L6) and the rosette (R) are represented. Bottom left panel (C): graphs representing leaf areas for the WT (green), the combination (red) and both single lines (dark and light blue) in mm2. Bottom right panel: graph showing the leaf area of the combination (red) and the WT (green) compared to the calculated EXPni (dotted red).
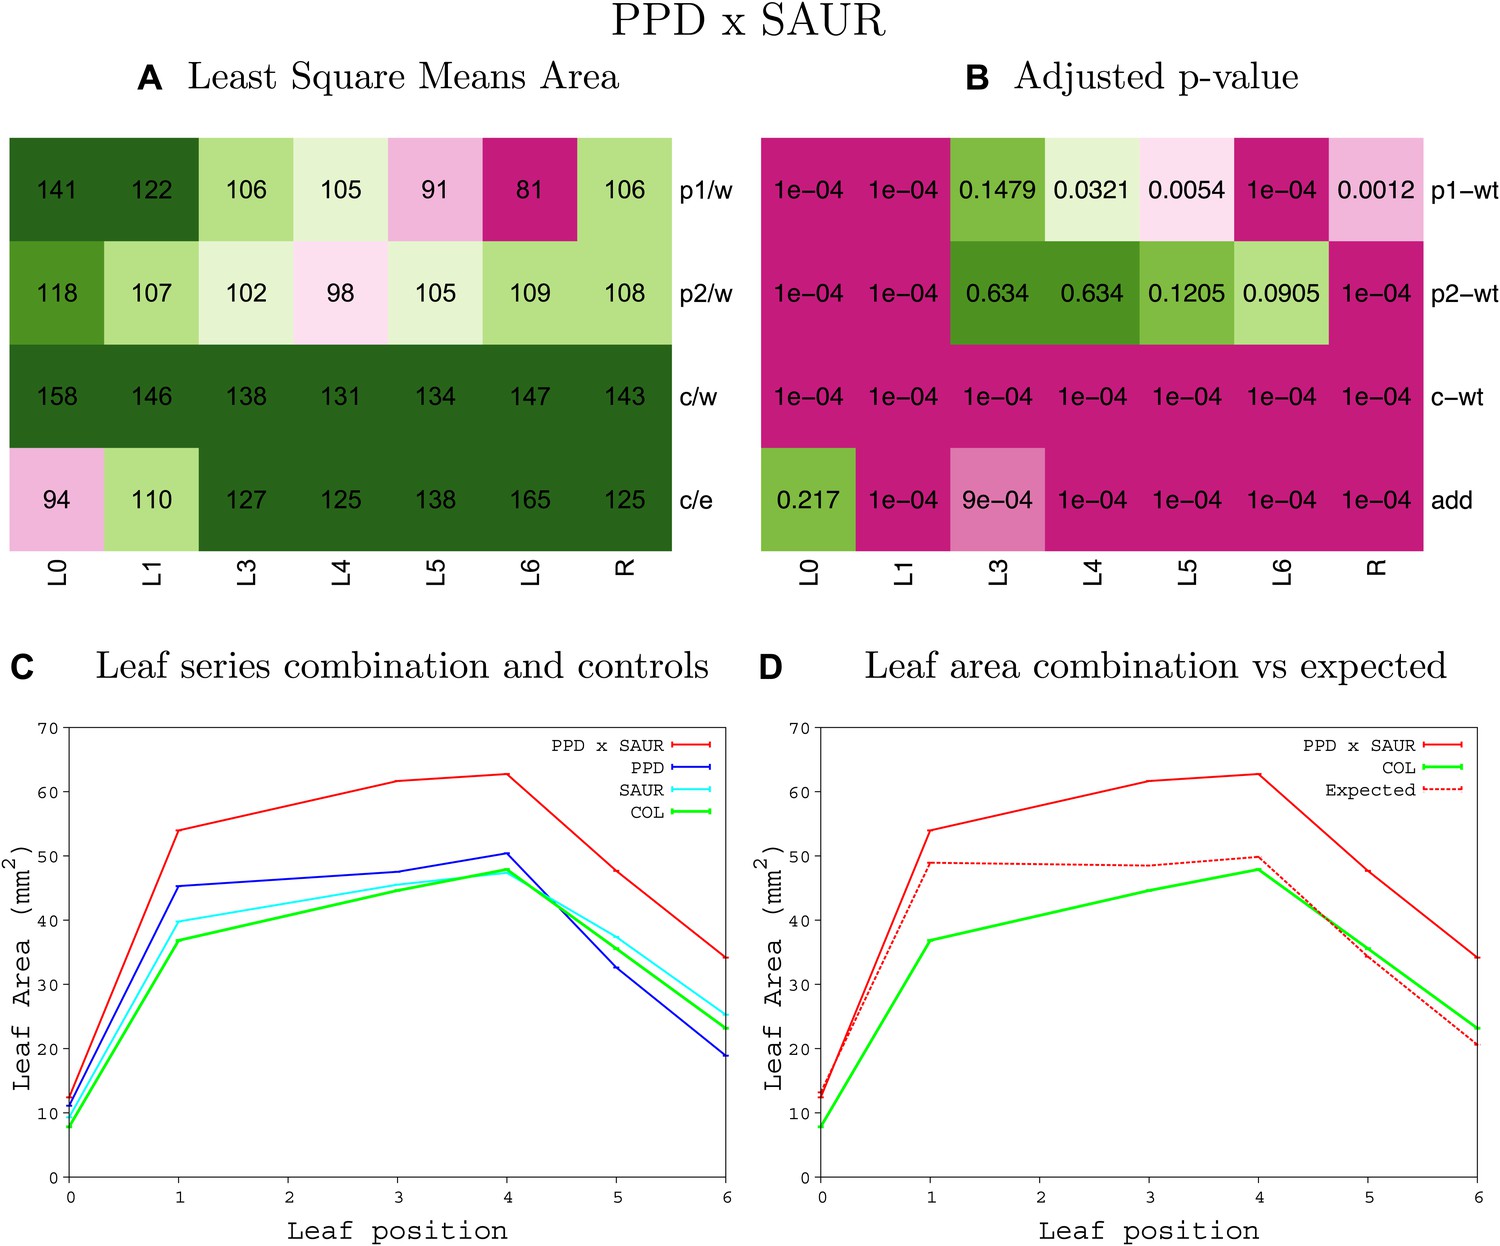
Figure 1—figure supplement 13
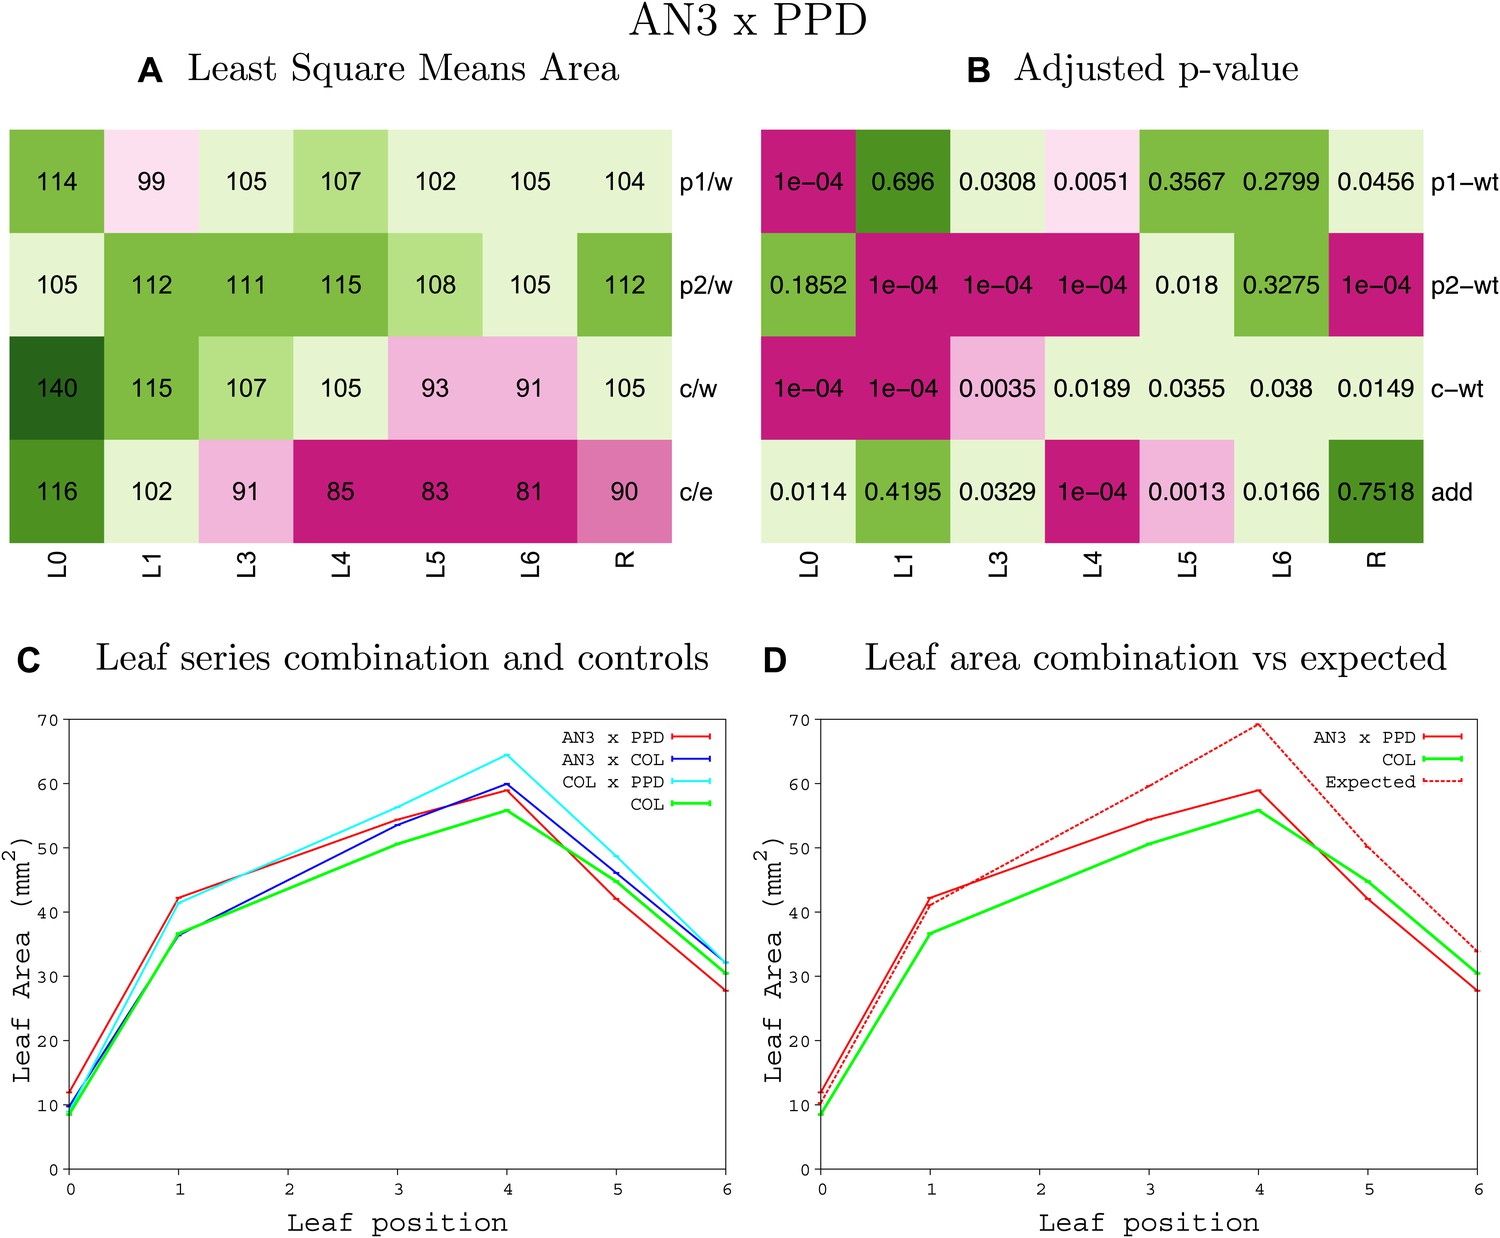
Statistical output of the phenotypic data for the heterozygous combination AN3OE-ami-ppd.
Top left panel (A): p1/w, p2/w, c/w: percentage of the area to the WT (w) of parent 1 (p1), parent 2 (p2) and the combination (C) respectively. c/e: percentage of the area of the combination (C) to the expected if non-interacting value (EXPni) (e). Top right panel (B), corresponding FDRs for the percentages presented in the top left panel. The cotyledons (L0), first six leaves (L1–L6) and the rosette (R) are represented. Bottom left panel (C): graphs representing leaf areas for the WT (green), the combination (red) and both single lines (dark and light blue) in mm2. Bottom right panel: graph showing the leaf area of the combination (red) and the WT (green) compared to the calculated EXPni (dotted red).
Figure 1—figure supplement 14
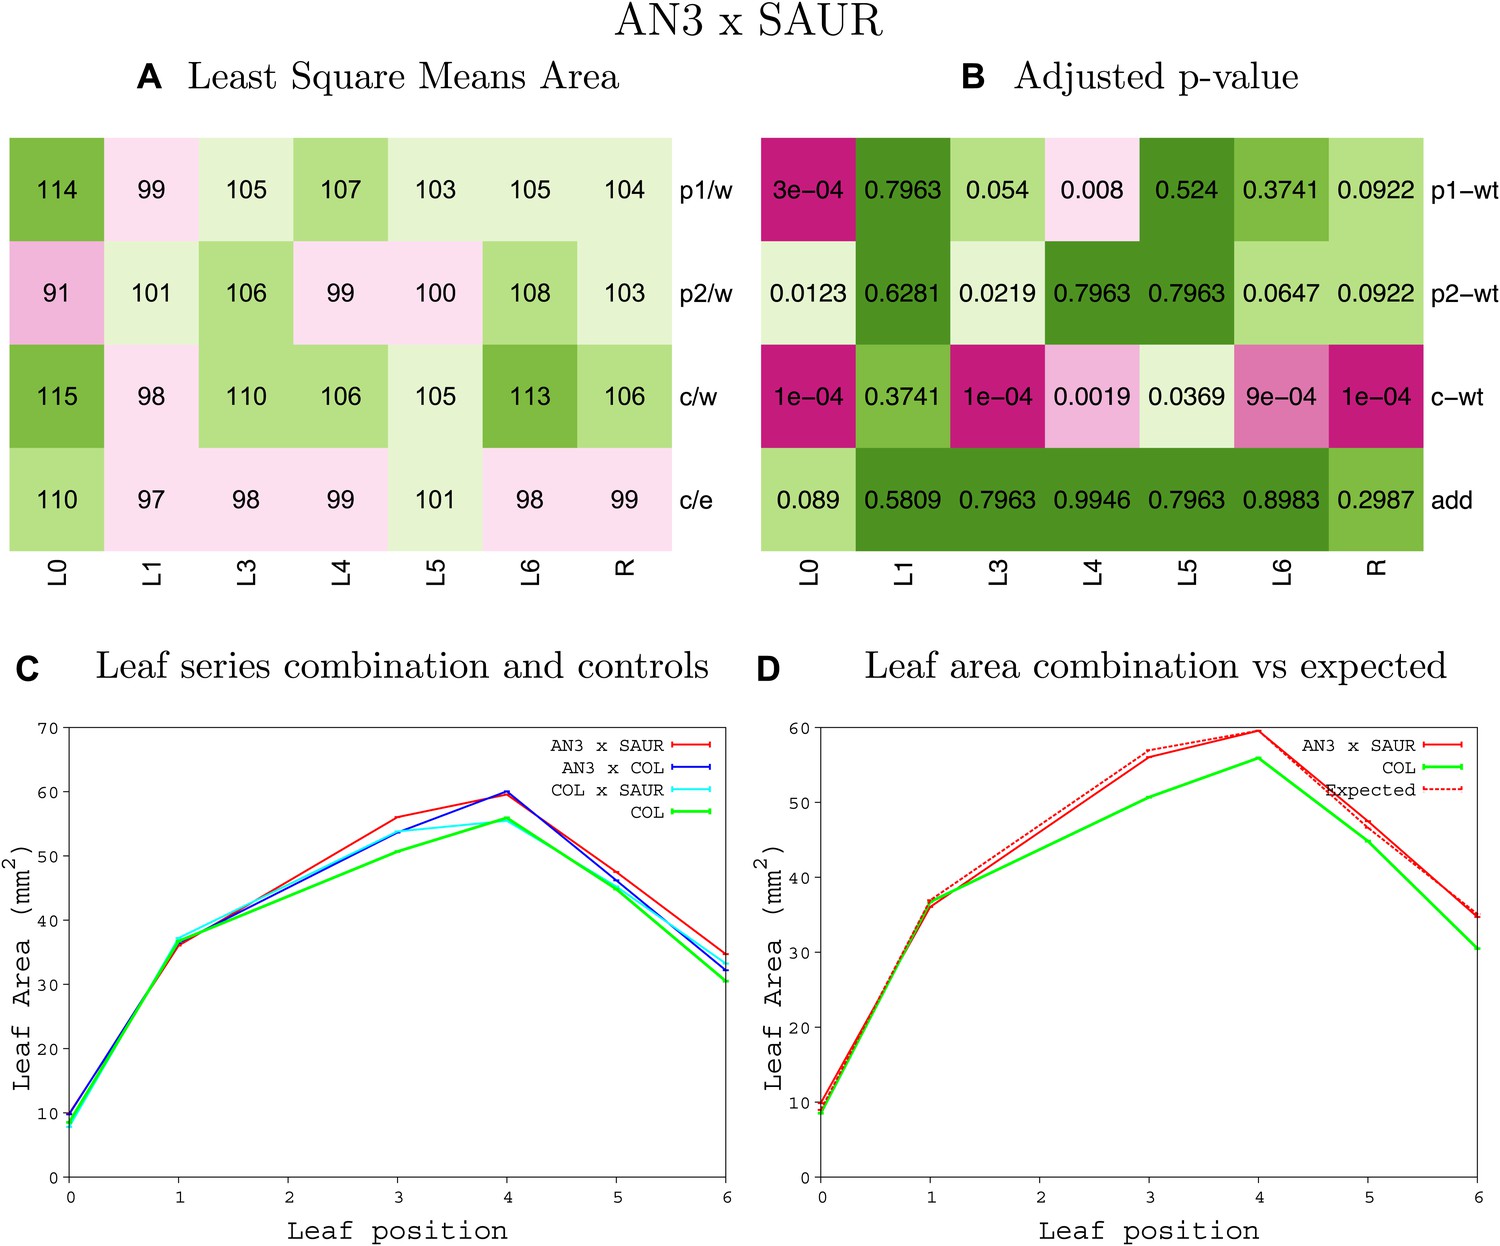
Statistical output of the phenotypic data for the heterozygous combination AN3OE-SAUR19OE.
Top left panel (A): p1/w, p2/w, c/w: percentage of the area to the WT (w) of parent 1 (p1), parent 2 (p2) and the combination (C) respectively. c/e: percentage of the area of the combination (C) to the expected if non-interacting value (EXPni) (e). Top right panel (B), corresponding FDRs for the percentages presented in the top left panel. The cotyledons (L0), first six leaves (L1–L6) and the rosette (R) are represented. Bottom left panel (C): graphs representing leaf areas for the WT (green), the combination (red) and both single lines (dark and light blue) in mm2. Bottom right panel: graph showing the leaf area of the combination (red) and the WT (green) compared to the calculated EXPni (dotted red).
Figure 1—figure supplement 15
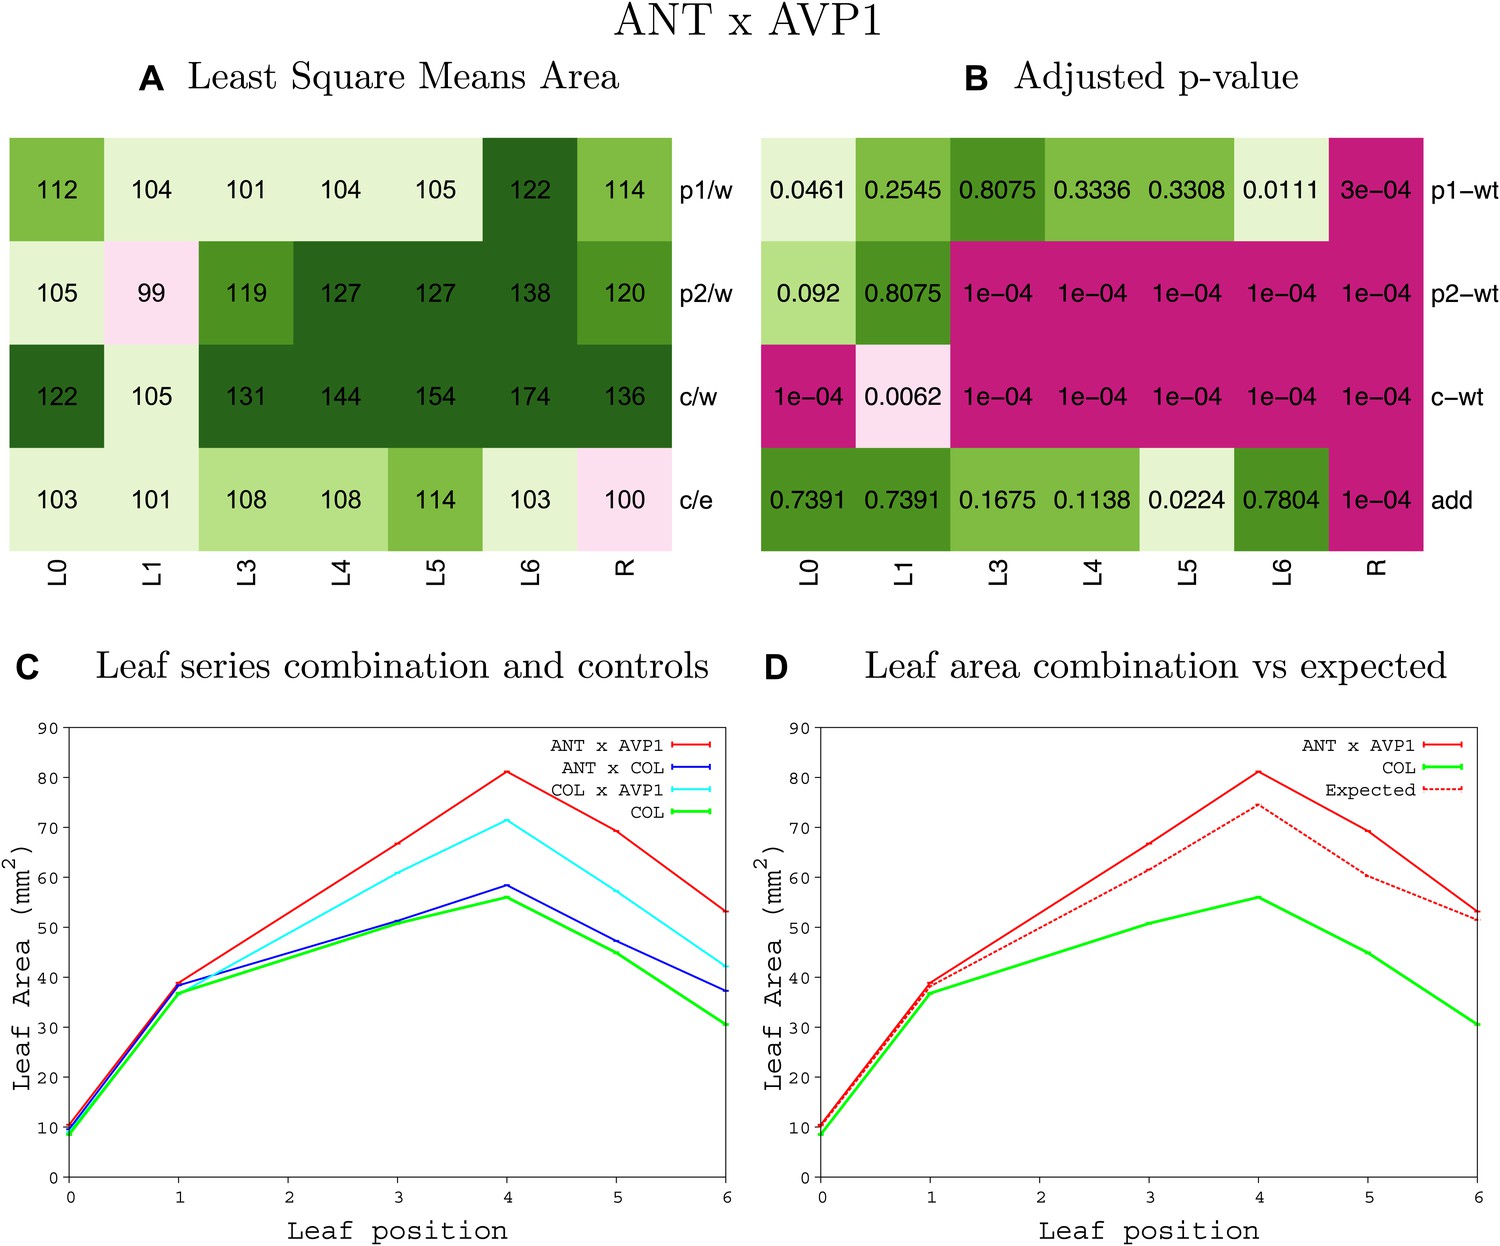
Statistical output of the phenotypic data for the heterozygous combination ANTOE-AVP1OE.
Top left panel (A): p1/w, p2/w, c/w: percentage of the area to the WT (w) of parent 1 (p1), parent 2 (p2) and the combination (C) respectively. c/e: percentage of the area of the combination (C) to the expected if non-interacting value (EXPni) (e). Top right panel (B), corresponding FDRs for the percentages presented in the top left panel. The cotyledons (L0), first six leaves (L1–L6) and the rosette (R) are represented. Bottom left panel (C): graphs representing leaf areas for the WT (green), the combination (red) and both single lines (dark and light blue) in mm2. Bottom right panel: graph showing the leaf area of the combination (red) and the WT (green) compared to the calculated EXPni (dotted red).
Figure 1—figure supplement 16
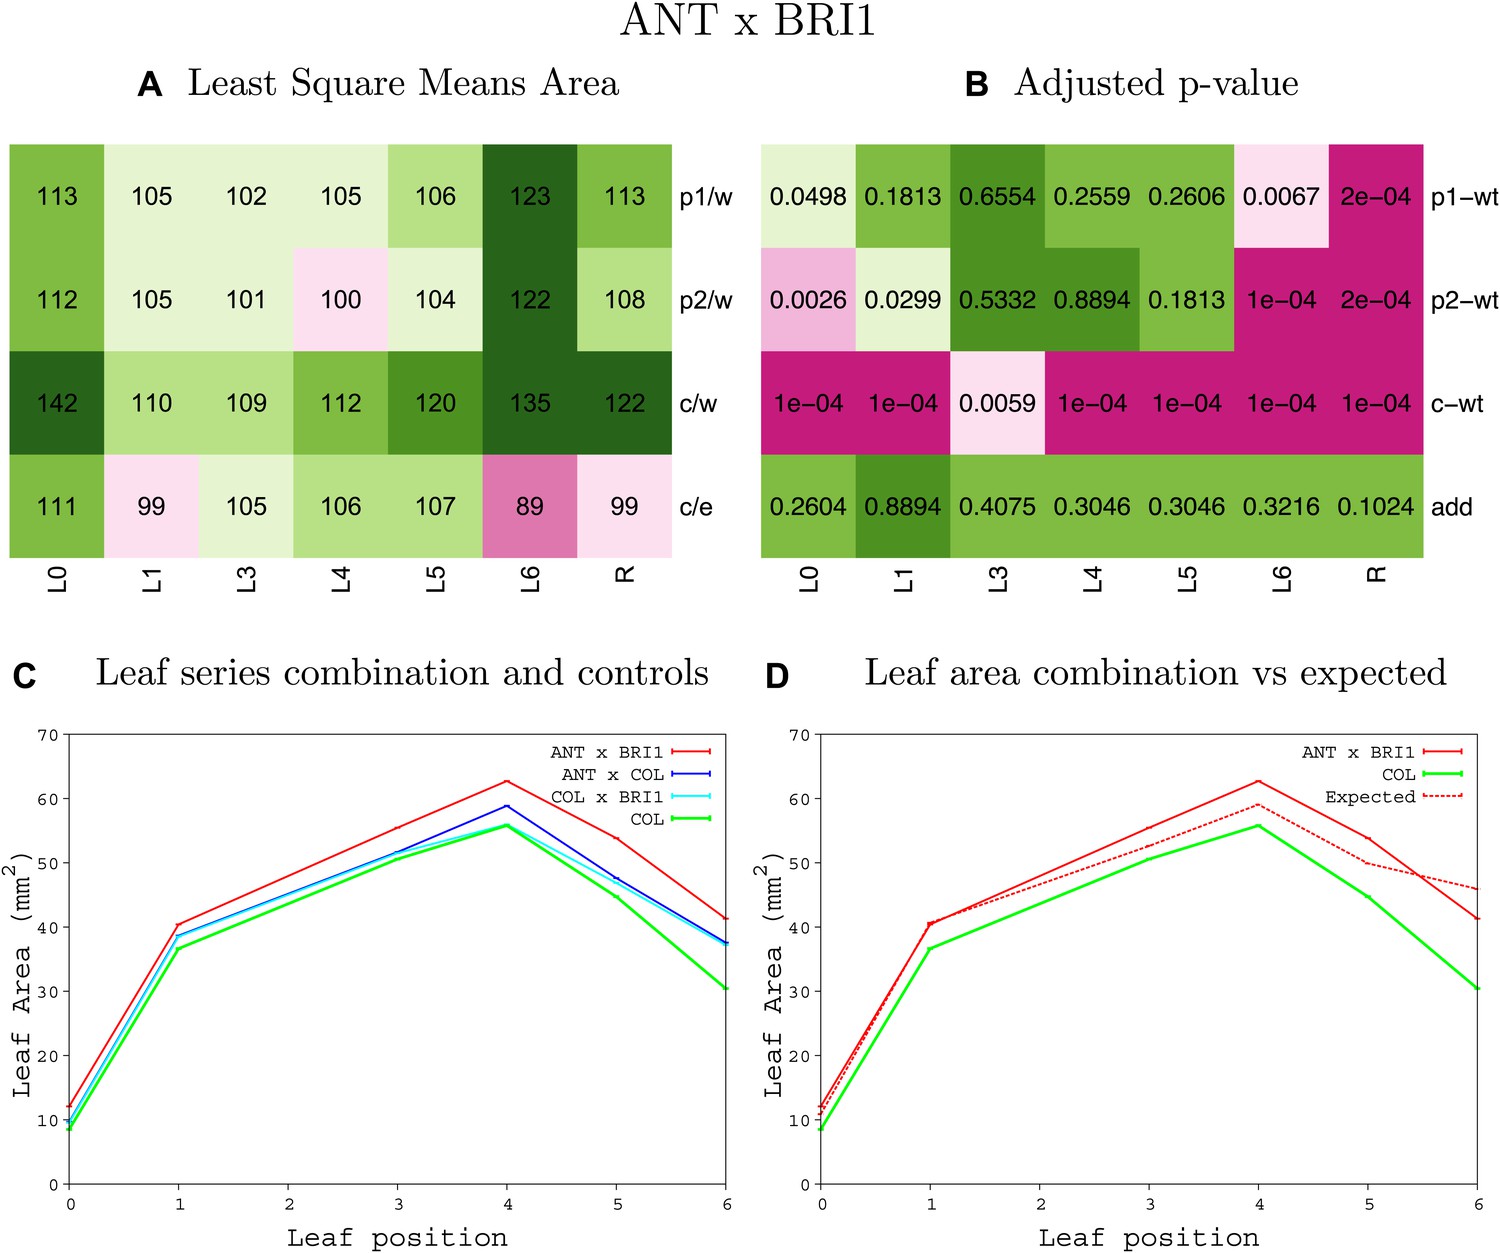
Statistical output of the phenotypic data for the heterozygous combination ANTOE-BRI1OE.
Top left panel (A): p1/w, p2/w, c/w: percentage of the area to the WT (w) of parent 1 (p1), parent 2 (p2) and the combination (C) respectively. c/e: percentage of the area of the combination (C) to the expected if non-interacting value (EXPni) (e). Top right panel (B), corresponding FDRs for the percentages presented in the top left panel. The cotyledons (L0), first six leaves (L1–L6) and the rosette (R) are represented. Bottom left panel (C): graphs representing leaf areas for the WT (green), the combination (red) and both single lines (dark and light blue) in mm2. Bottom right panel: graph showing the leaf area of the combination (red) and the WT (green) compared to the calculated EXPni (dotted red).
Figure 1—figure supplement 17
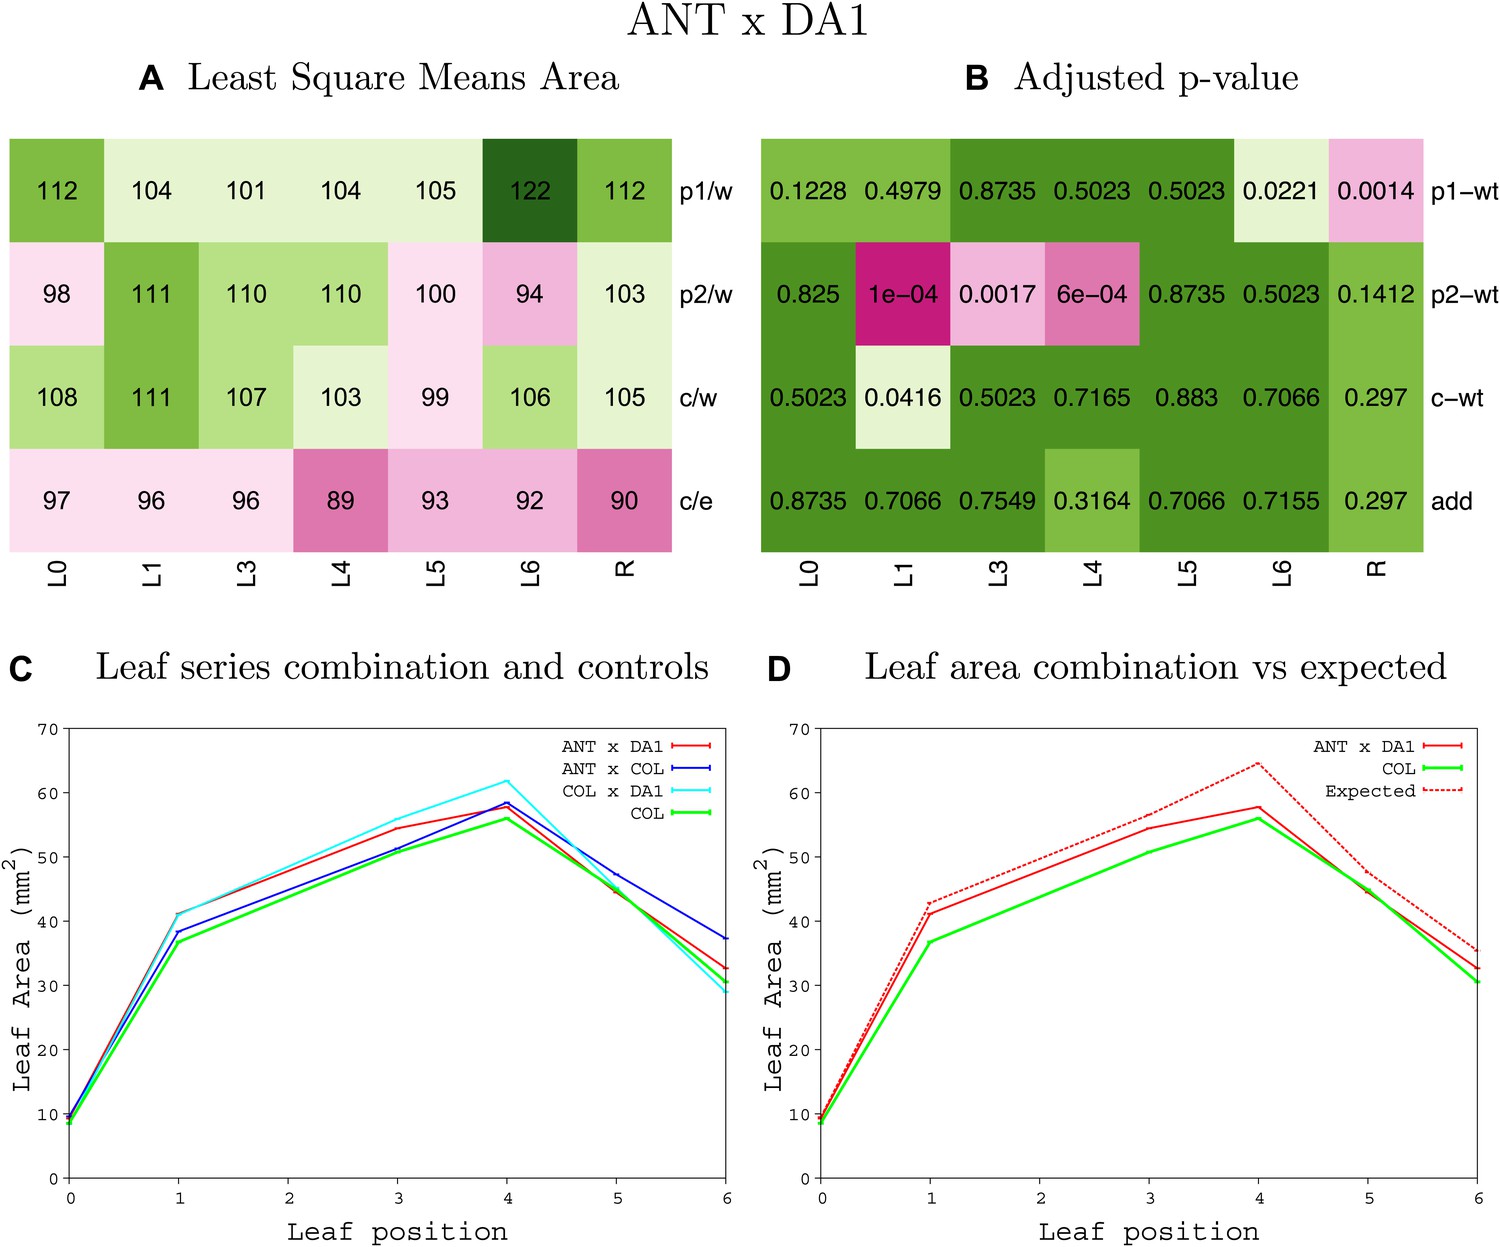
Statistical output of the phenotypic data for the heterozygous combination ANTOE-da1-1.
Top left panel (A): p1/w, p2/w, c/w: percentage of the area to the WT (w) of parent 1 (p1), parent 2 (p2) and the combination (C) respectively. c/e: percentage of the area of the combination (C) to the expected if non-interacting value (EXPni) (e). Top right panel (B), corresponding FDRs for the percentages presented in the top left panel. The cotyledons (L0), first six leaves (L1–L6) and the rosette (R) are represented. Bottom left panel (C): graphs representing leaf areas for the WT (green), the combination (red) and both single lines (dark and light blue) in mm2. Bottom right panel: graph showing the leaf area of the combination (red) and the WT (green) compared to the calculated EXPni (dotted red).
Figure 1—figure supplement 18
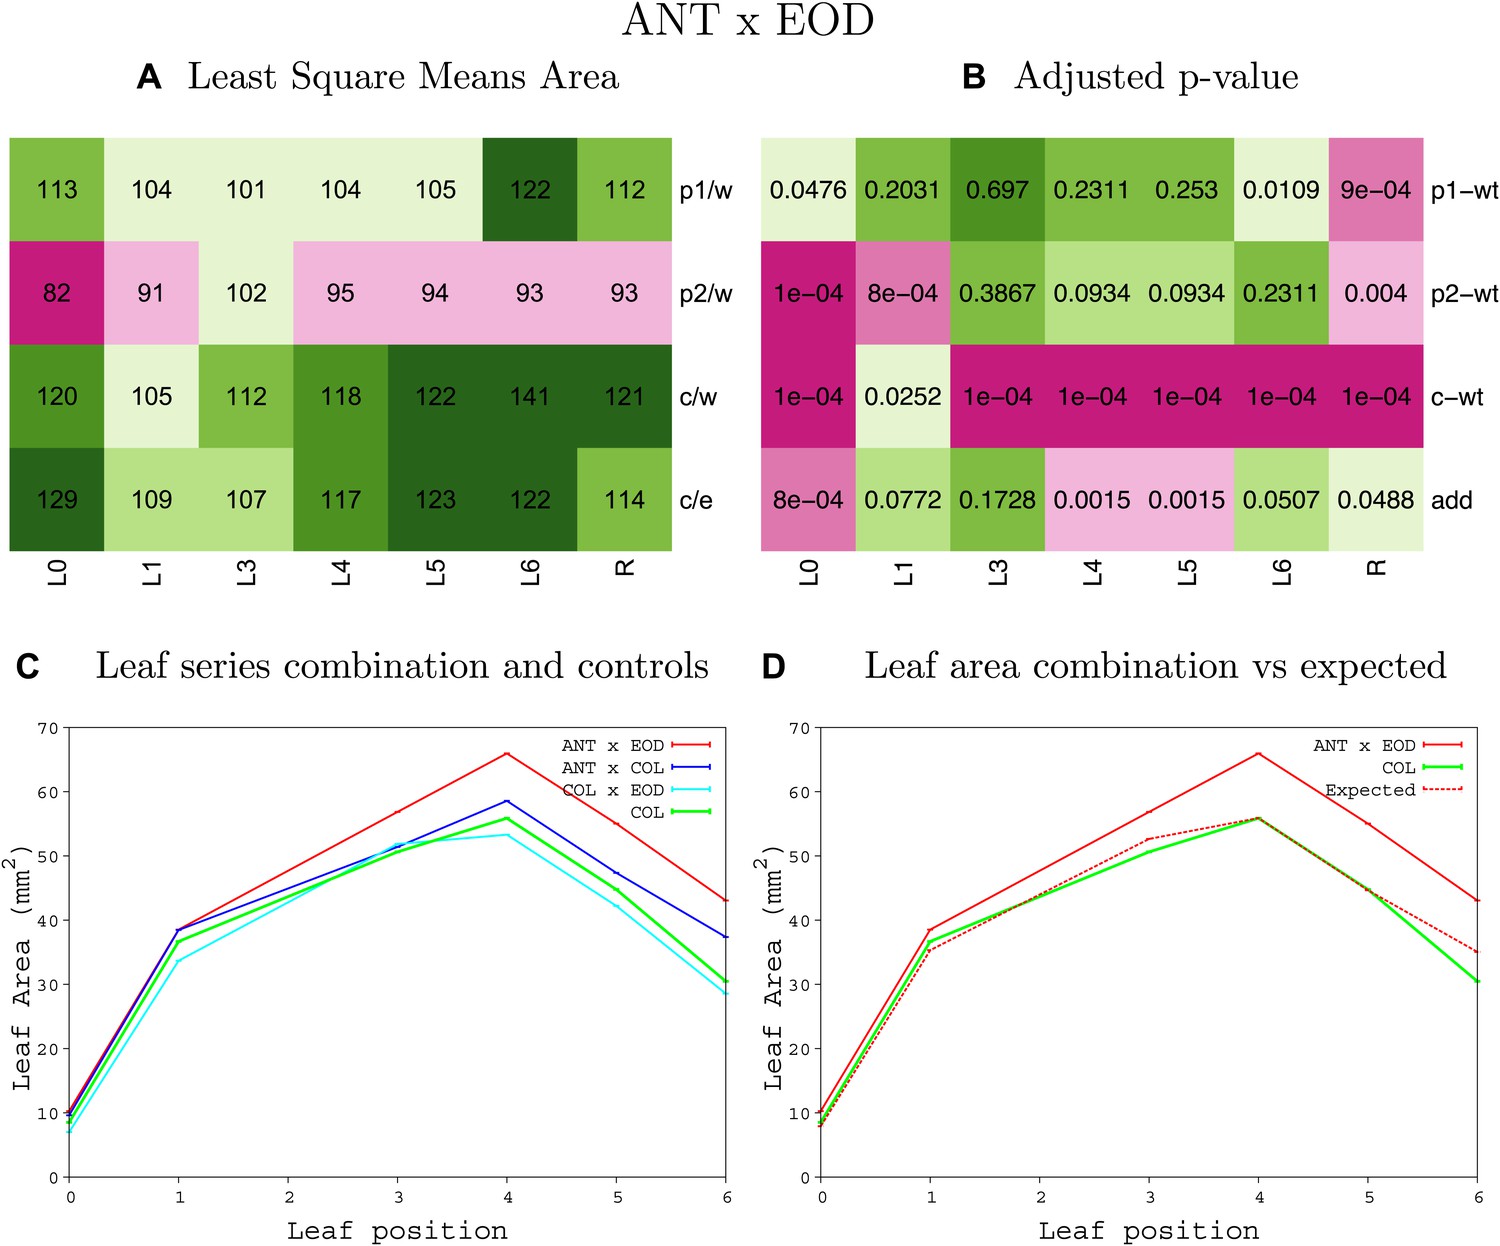
Statistical output of the phenotypic data for the heterozygous combination ANTOE-eod1-2.
Top left panel (A): p1/w, p2/w, c/w: percentage of the area to the WT (w) of parent 1 (p1), parent 2 (p2) and the combination (C) respectively. c/e: percentage of the area of the combination (C) to the expected if non-interacting value (EXPni) (e). Top right panel (B), corresponding FDRs for the percentages presented in the top left panel. The cotyledons (L0), first six leaves (L1–L6) and the rosette (R) are represented. Bottom left panel (C): graphs representing leaf areas for the WT (green), the combination (red) and both single lines (dark and light blue) in mm2. Bottom right panel: graph showing the leaf area of the combination (red) and the WT (green) compared to the calculated EXPni (dotted red).
Figure 1—figure supplement 19
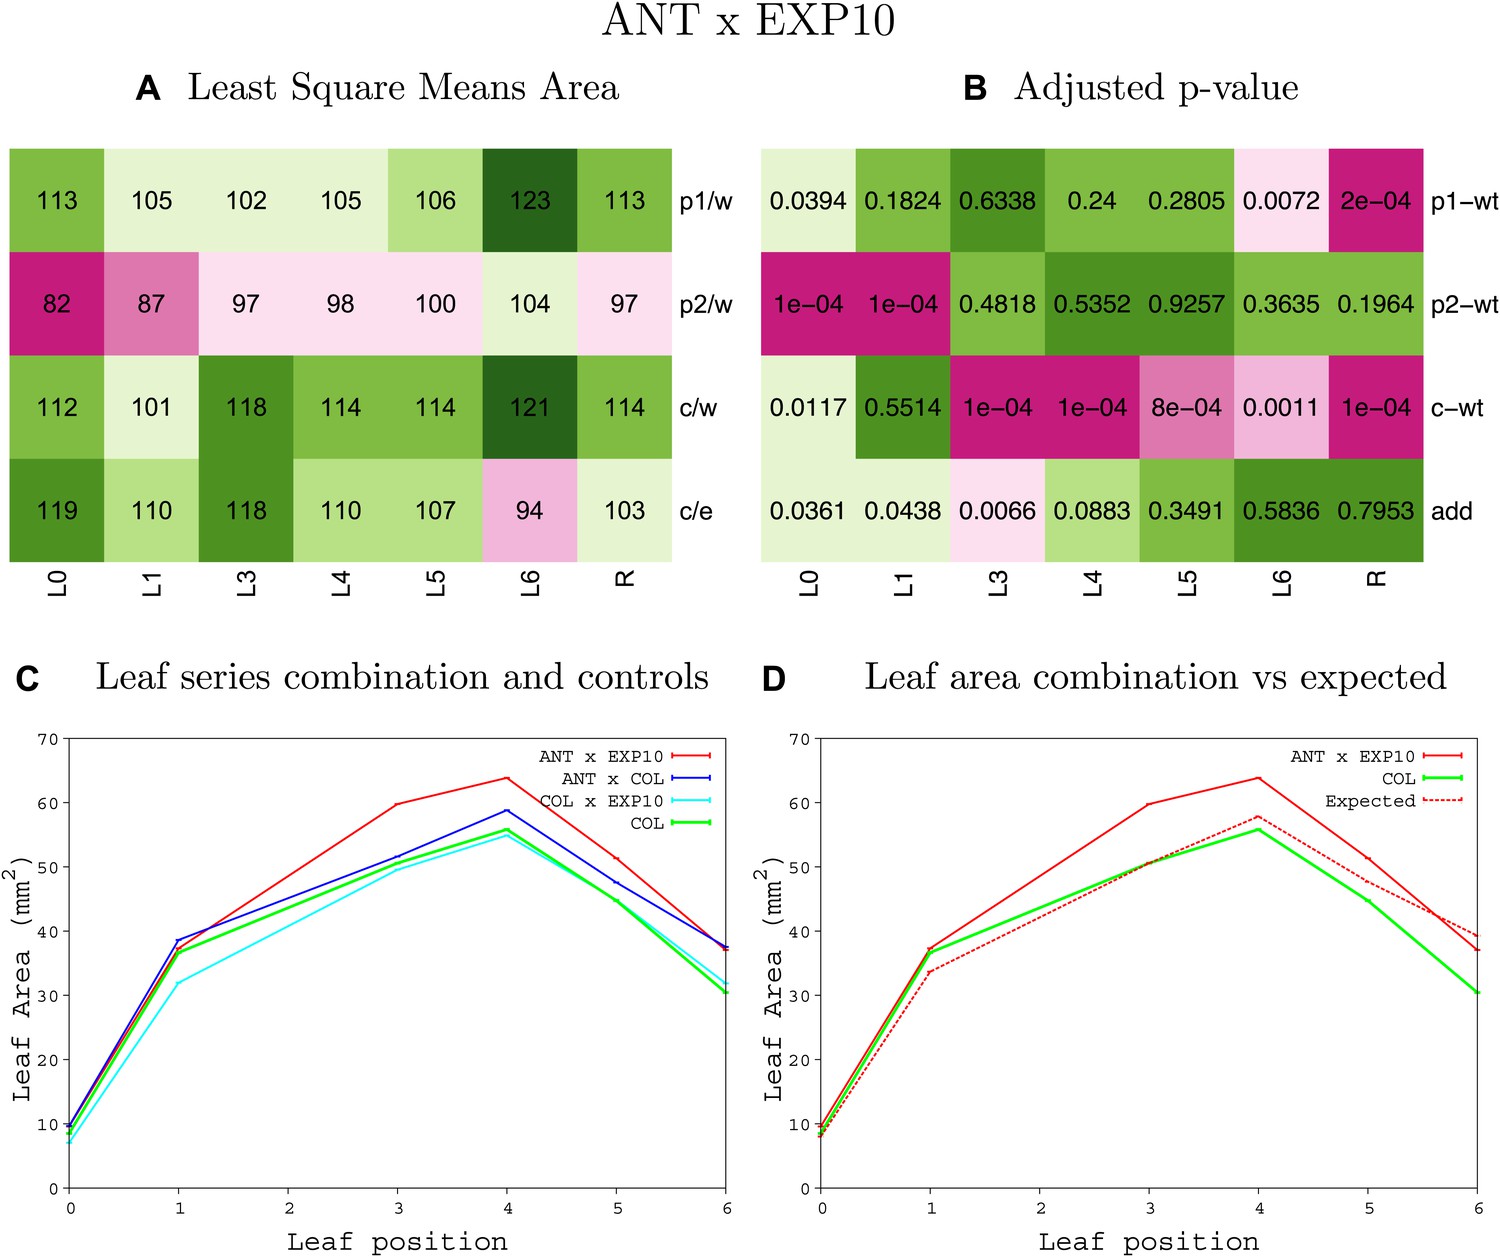
Statistical output of the phenotypic data for the heterozygous combination ANTOE-EXP10OE.
Top left panel (A): p1/w, p2/w, c/w: percentage of the area to the WT (w) of parent 1 (p1), parent 2 (p2) and the combination (C) respectively. c/e: percentage of the area of the combination (C) to the expected if non-interacting value (EXPni) (e). Top right panel (B), corresponding FDRs for the percentages presented in the top left panel. The cotyledons (L0), first six leaves (L1–L6) and the rosette (R) are represented. Bottom left panel (C): graphs representing leaf areas for the WT (green), the combination (red) and both single lines (dark and light blue) in mm2. Bottom right panel: graph showing the leaf area of the combination (red) and the WT (green) compared to the calculated EXPni (dotted red).
Figure 1—figure supplement 20
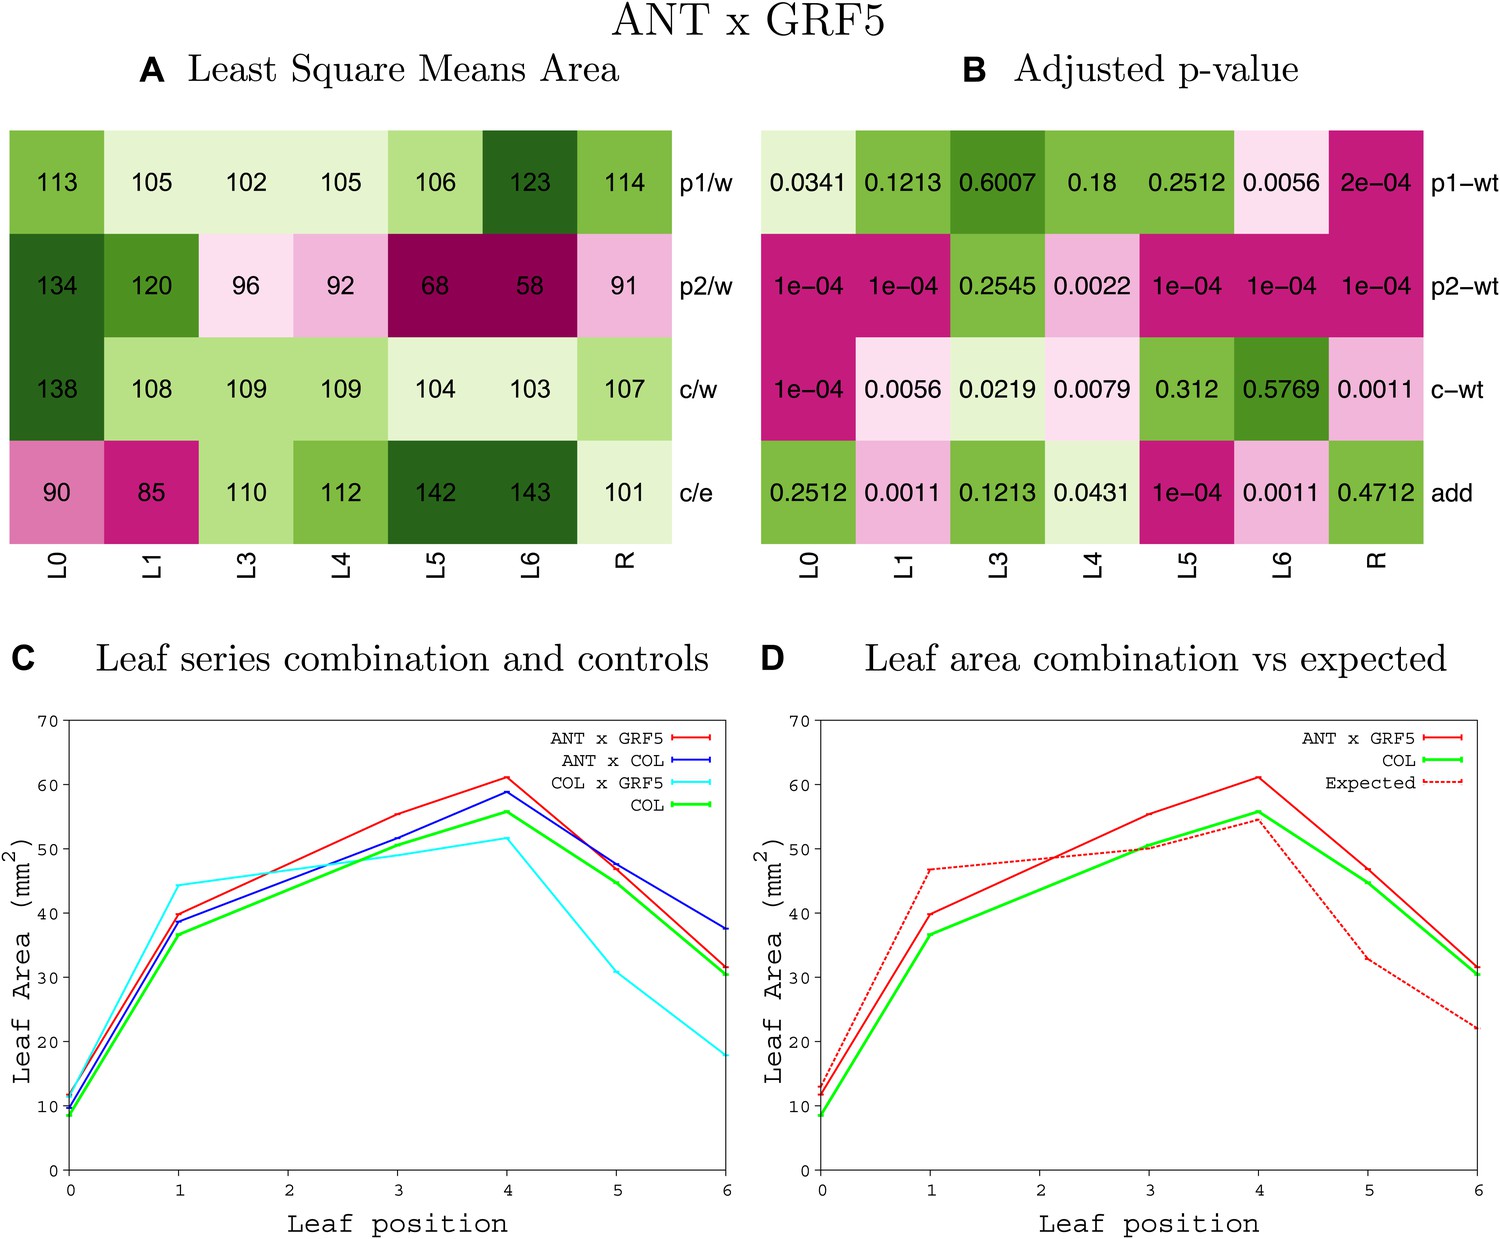
Statistical output of the phenotypic data for the heterozygous combination ANTOE-GRF5OE.
Top left panel (A): p1/w, p2/w, c/w: percentage of the area to the WT (w) of parent 1 (p1), parent 2 (p2) and the combination (C) respectively. c/e: percentage of the area of the combination (C) to the expected if non-interacting value (EXPni) (e). Top right panel (B), corresponding FDRs for the percentages presented in the top left panel. The cotyledons (L0), first six leaves (L1–L6) and the rosette (R) are represented. Bottom left panel (C): graphs representing leaf areas for the WT (green), the combination (red) and both single lines (dark and light blue) in mm2. Bottom right panel: graph showing the leaf area of the combination (red) and the WT (green) compared to the calculated EXPni (dotted red).
Figure 1—figure supplement 21
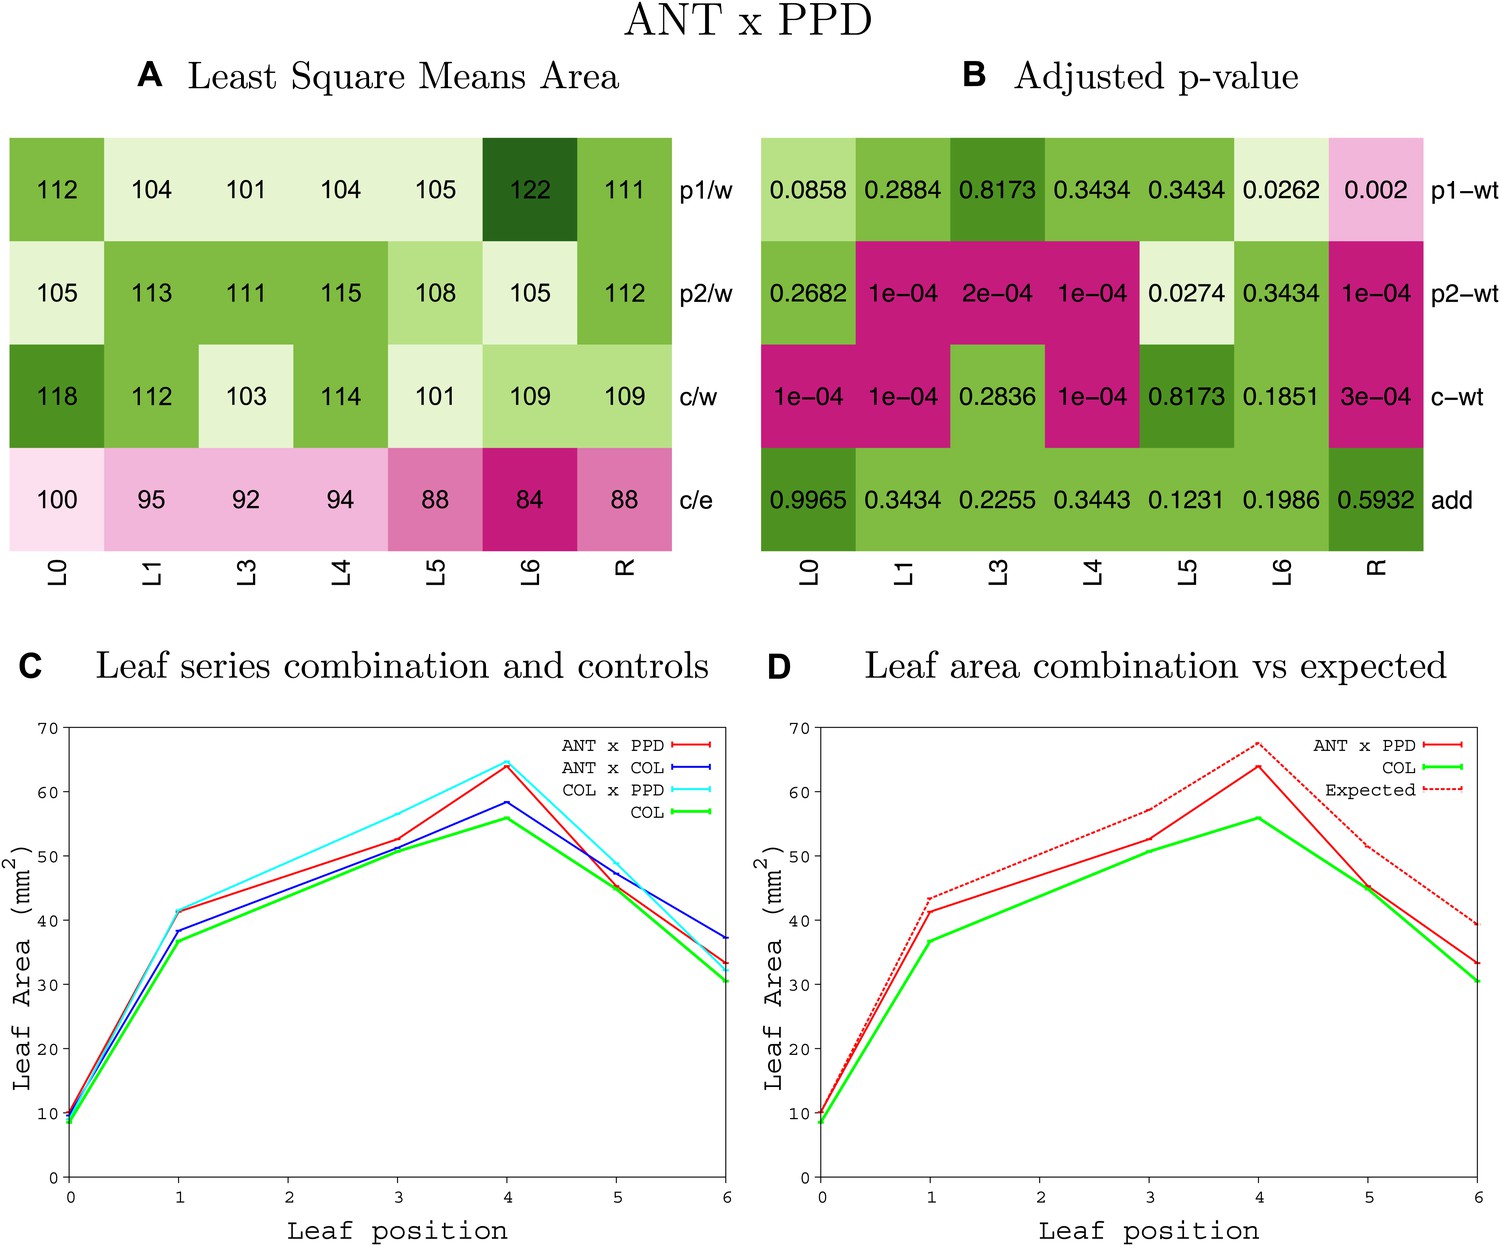
Statistical output of the phenotypic data for the heterozygous combination ANTOE-ami-ppd.
Top left panel (A): p1/w, p2/w, c/w: percentage of the area to the WT (w) of parent 1 (p1), parent 2 (p2) and the combination (C) respectively. c/e: percentage of the area of the combination (C) to the expected if non-interacting value (EXPni) (e). Top right panel (B), corresponding FDRs for the percentages presented in the top left panel. The cotyledons (L0), first six leaves (L1–L6) and the rosette (R) are represented. Bottom left panel (C): graphs representing leaf areas for the WT (green), the combination (red) and both single lines (dark and light blue) in mm2. Bottom right panel: graph showing the leaf area of the combination (red) and the WT (green) compared to the calculated EXPni (dotted red).
Figure 1—figure supplement 22
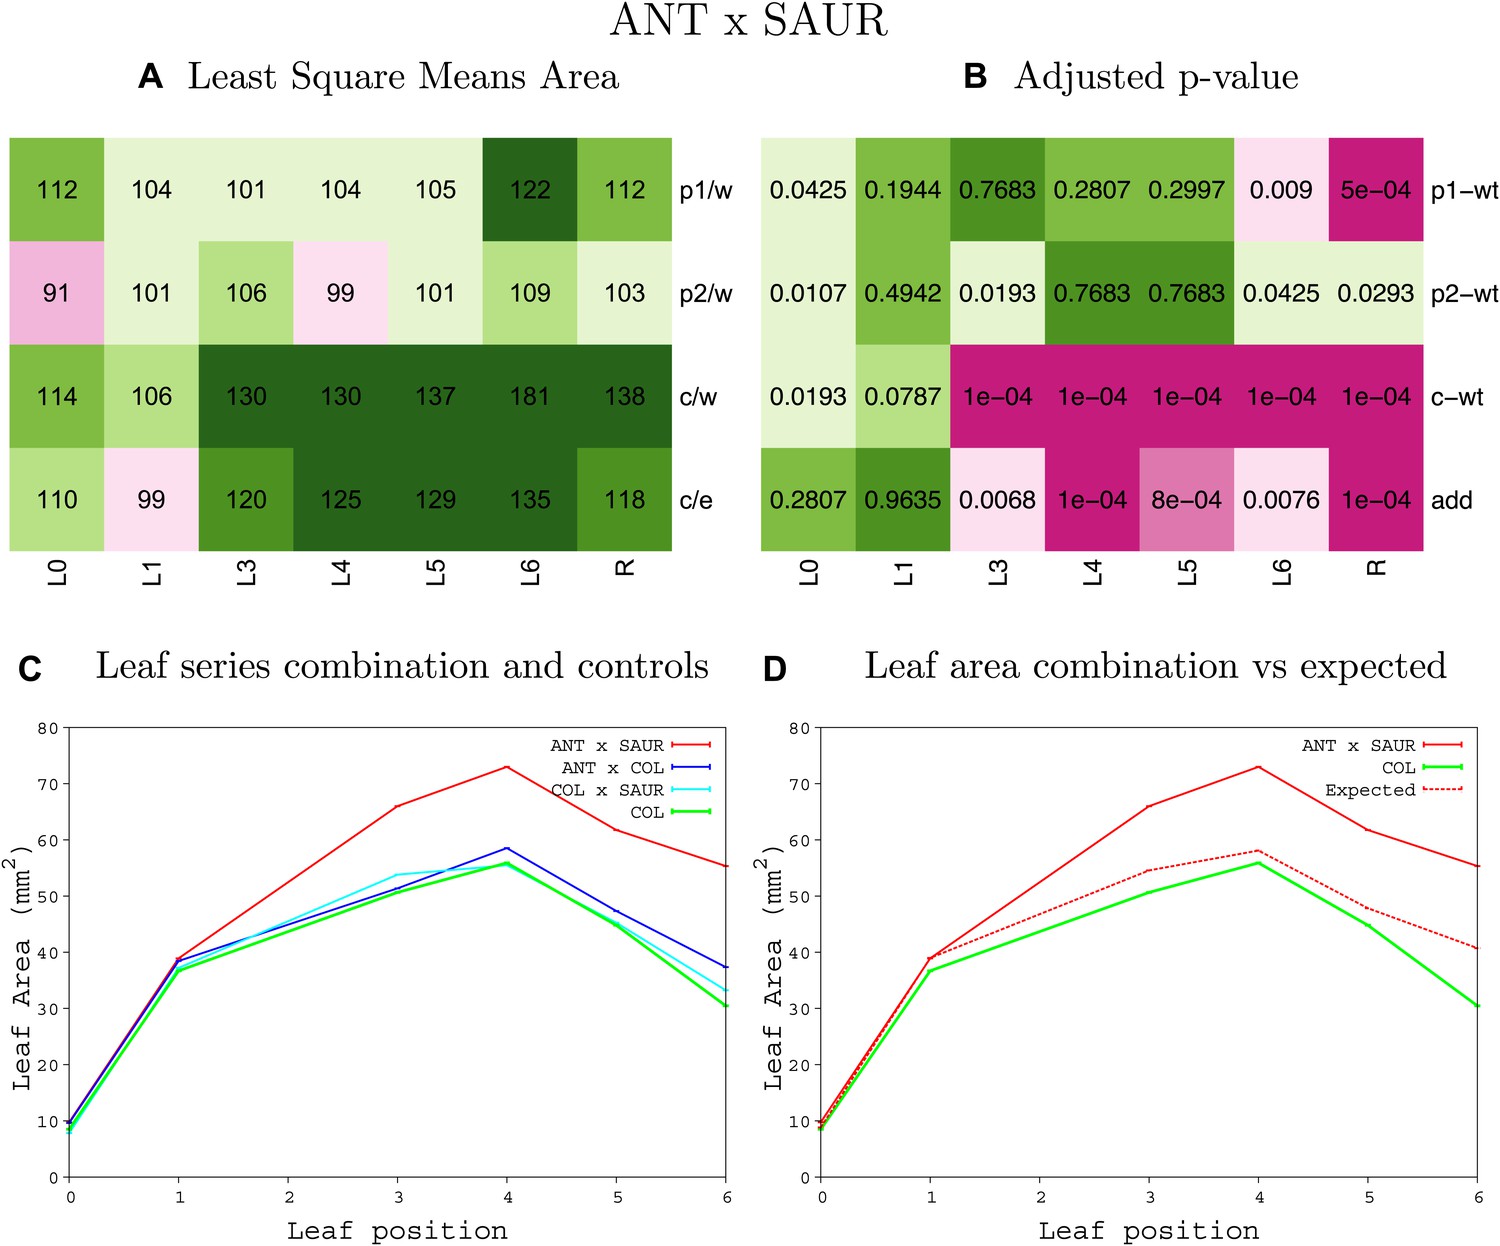
Statistical output of the phenotypic data for the heterozygous combination ANTOE-SAUR19OE.
Top left panel (A): p1/w, p2/w, c/w: percentage of the area to the WT (w) of parent 1 (p1), parent 2 (p2) and the combination (C) respectively. c/e: percentage of the area of the combination (C) to the expected if non-interacting value (EXPni) (e). Top right panel (B), corresponding FDRs for the percentages presented in the top left panel. The cotyledons (L0), first six leaves (L1–L6) and the rosette (R) are represented. Bottom left panel (C): graphs representing leaf areas for the WT (green), the combination (red) and both single lines (dark and light blue) in mm2. Bottom right panel: graph showing the leaf area of the combination (red) and the WT (green) compared to the calculated EXPni (dotted red).
Figure 1—figure supplement 23
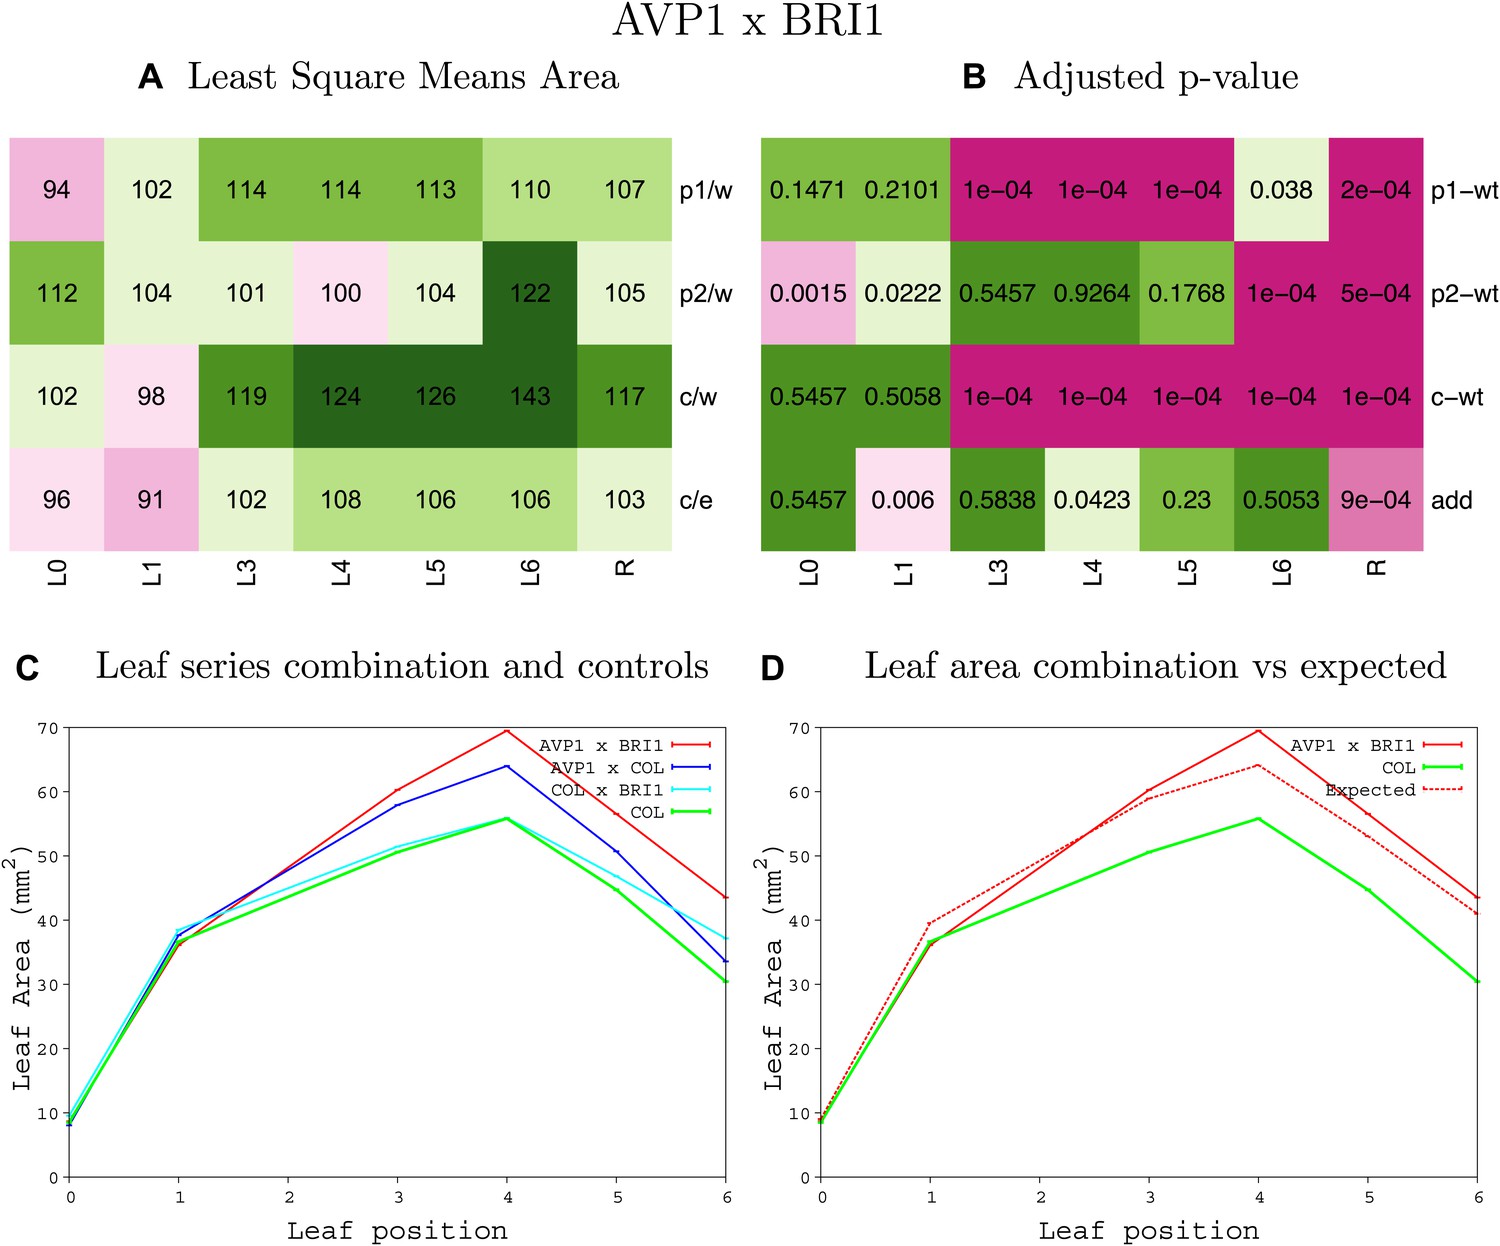
Statistical output of the phenotypic data for the heterozygous combination AVP1OE-BRI1OE.
Top left panel (A): p1/w, p2/w, c/w: percentage of the area to the WT (w) of parent 1 (p1), parent 2 (p2) and the combination (C) respectively. c/e: percentage of the area of the combination (C) to the expected if non-interacting value (EXPni) (e). Top right panel (B), corresponding FDRs for the percentages presented in the top left panel. The cotyledons (L0), first six leaves (L1–L6) and the rosette (R) are represented. Bottom left panel (C): graphs representing leaf areas for the WT (green), the combination (red) and both single lines (dark and light blue) in mm2. Bottom right panel: graph showing the leaf area of the combination (red) and the WT (green) compared to the calculated EXPni (dotted red).
Figure 1—figure supplement 24
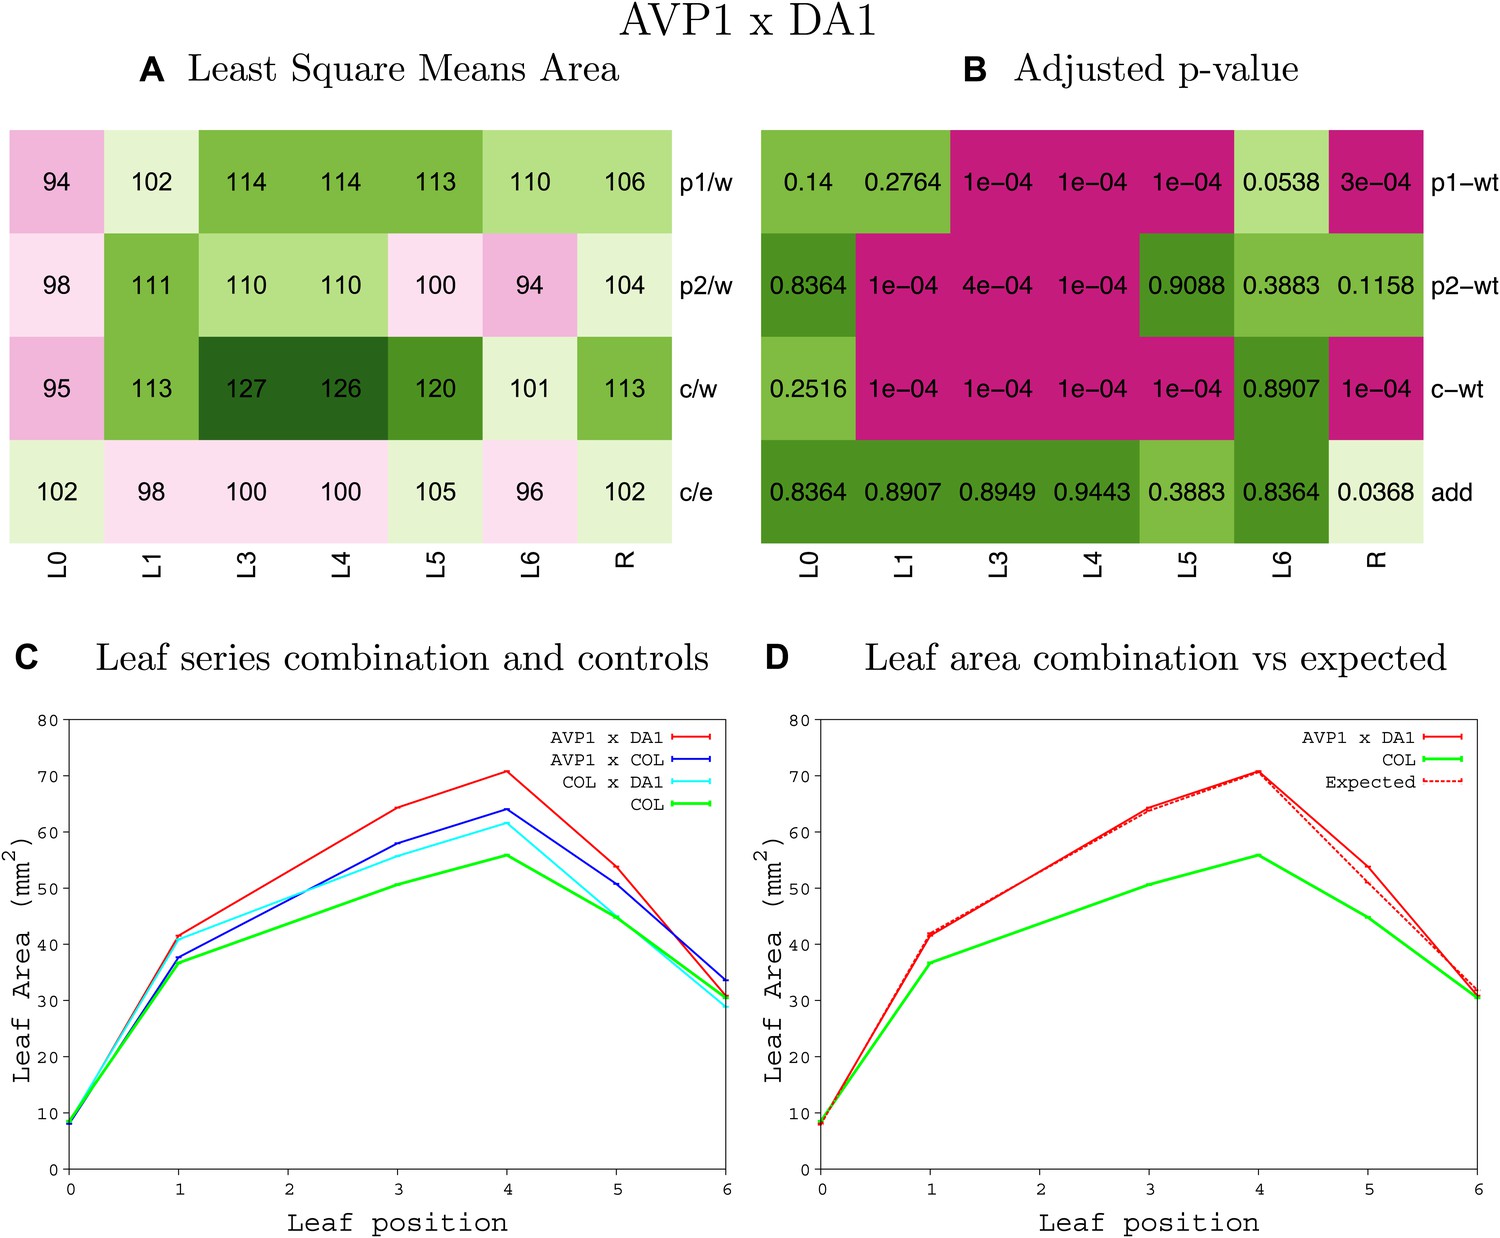
Statistical output of the phenotypic data for the heterozygous combination AVP1OE-da1-1.
Top left panel (A): p1/w, p2/w, c/w: percentage of the area to the WT (w) of parent 1 (p1), parent 2 (p2) and the combination (C) respectively. c/e: percentage of the area of the combination (C) to the expected if non-interacting value (EXPni) (e). Top right panel (B), corresponding FDRs for the percentages presented in the top left panel. The cotyledons (L0), first six leaves (L1–L6) and the rosette (R) are represented. Bottom left panel (C): graphs representing leaf areas for the WT (green), the combination (red) and both single lines (dark and light blue) in mm2. Bottom right panel: graph showing the leaf area of the combination (red) and the WT (green) compared to the calculated EXPni (dotted red).
Figure 1—figure supplement 25
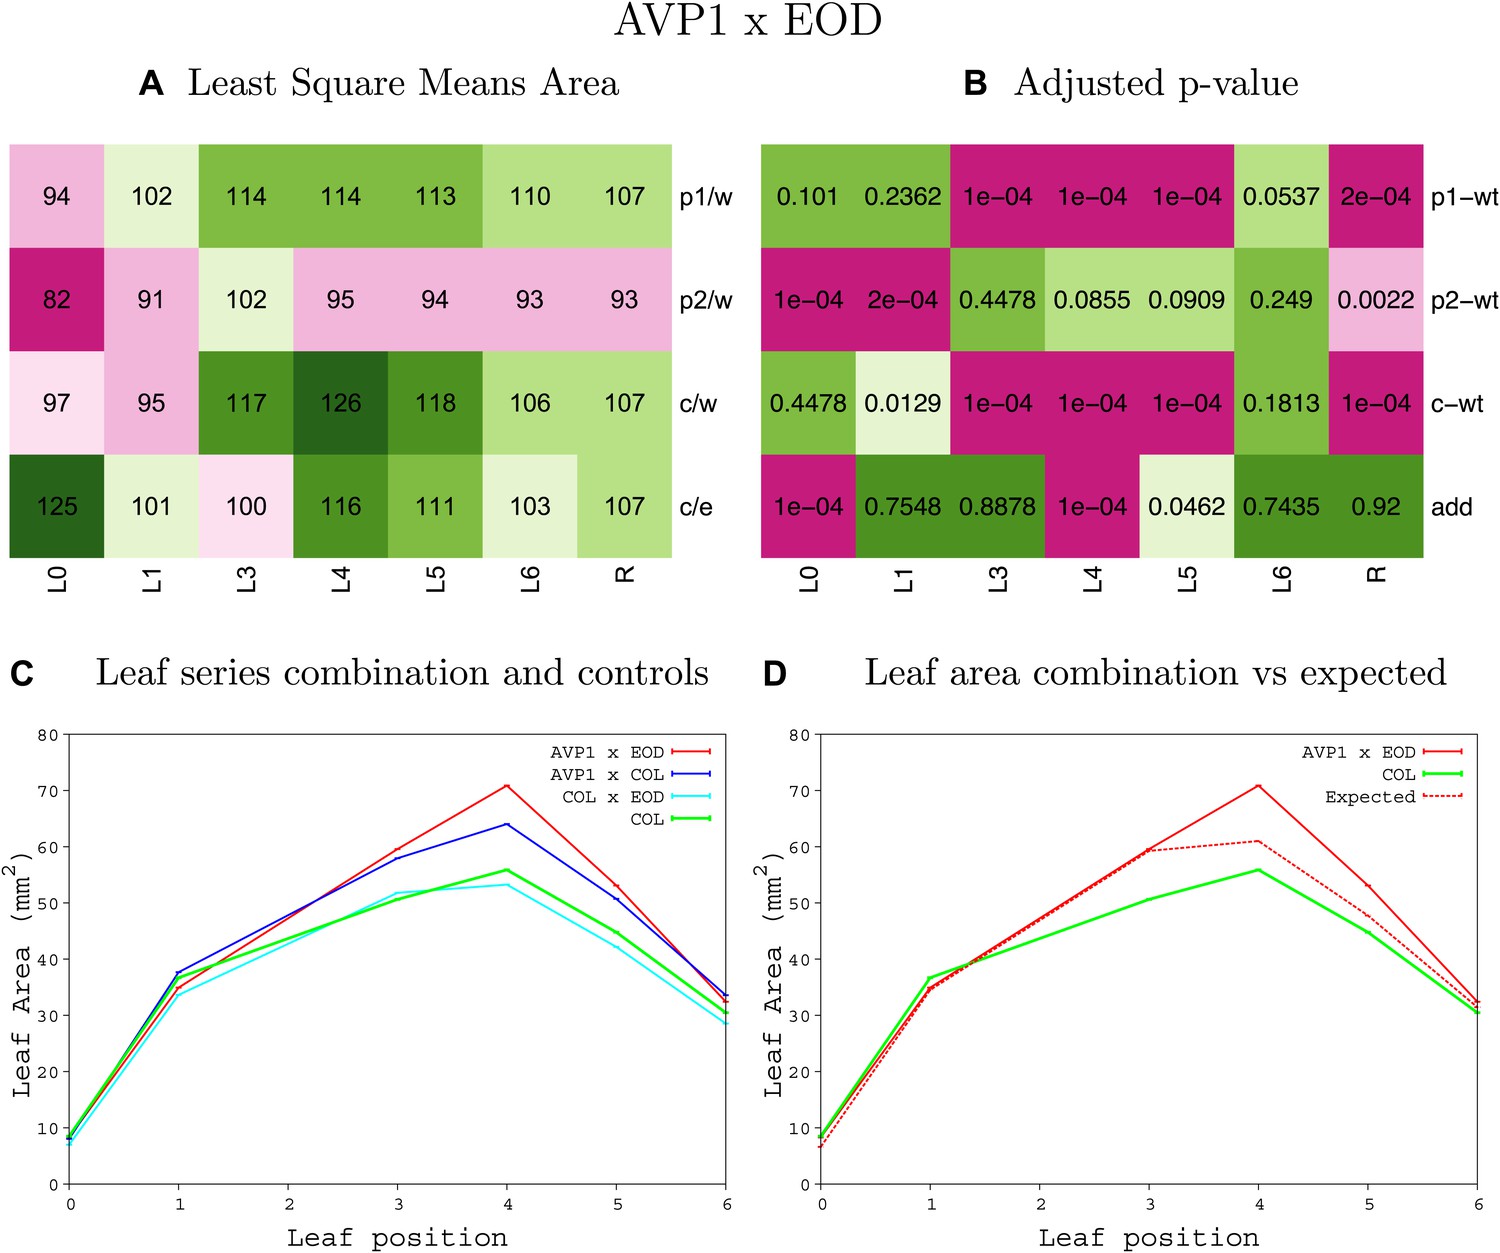
Statistical output of the phenotypic data for the heterozygous combination AVP1OE-eod1-2.
Top left panel (A): p1/w, p2/w, c/w: percentage of the area to the WT (w) of parent 1 (p1), parent 2 (p2) and the combination (C) respectively. c/e: percentage of the area of the combination (C) to the expected if non-interacting value (EXPni) (e). Top right panel (B), corresponding FDRs for the percentages presented in the top left panel. The cotyledons (L0), first six leaves (L1–L6) and the rosette (R) are represented. Bottom left panel (C): graphs representing leaf areas for the WT (green), the combination (red) and both single lines (dark and light blue) in mm2. Bottom right panel: graph showing the leaf area of the combination (red) and the WT (green) compared to the calculated EXPni (dotted red).
Figure 1—figure supplement 26
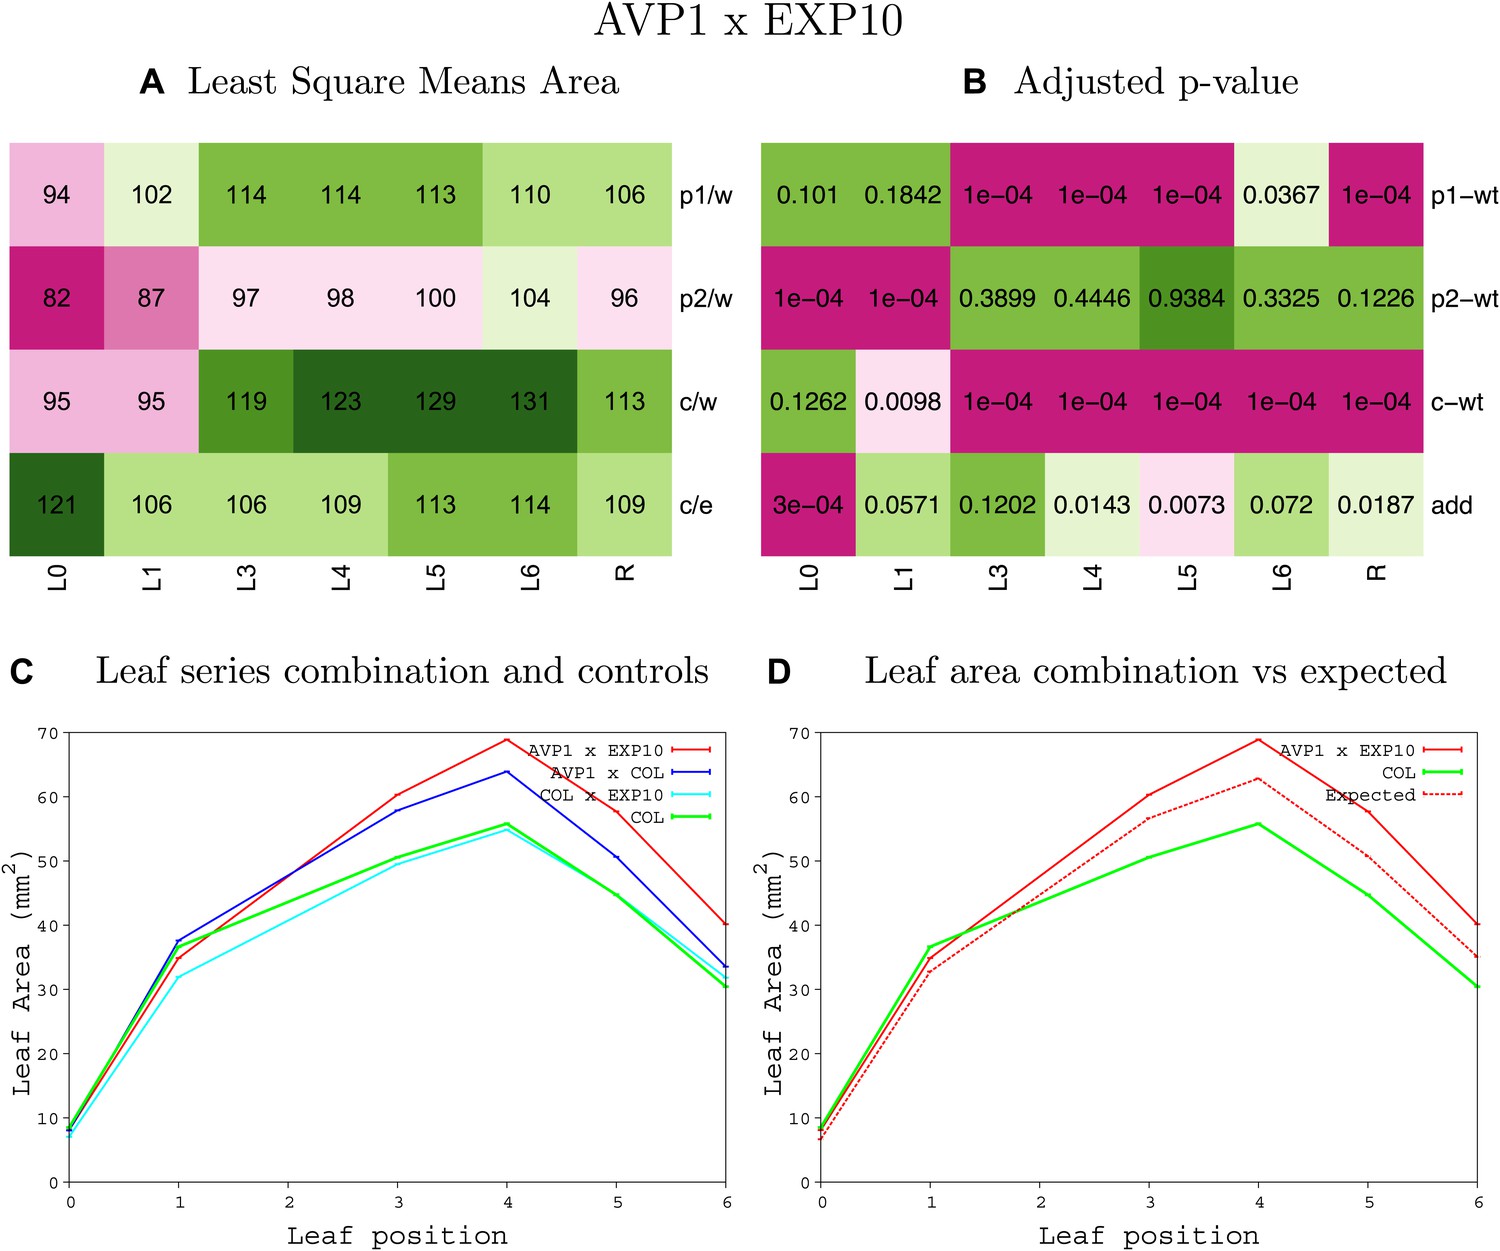
Statistical output of the phenotypic data for the heterozygous combination AVP1OE-EXP10OE.
Top left panel (A): p1/w, p2/w, c/w: percentage of the area to the WT (w) of parent 1 (p1), parent 2 (p2) and the combination (C) respectively. c/e: percentage of the area of the combination (C) to the expected if non-interacting value (EXPni) (e). Top right panel (B), corresponding FDRs for the percentages presented in the top left panel. The cotyledons (L0), first six leaves (L1–L6) and the rosette (R) are represented. Bottom left panel (C): graphs representing leaf areas for the WT (green), the combination (red) and both single lines (dark and light blue) in mm2. Bottom right panel: graph showing the leaf area of the combination (red) and the WT (green) compared to the calculated EXPni (dotted red).
Figure 1—figure supplement 27
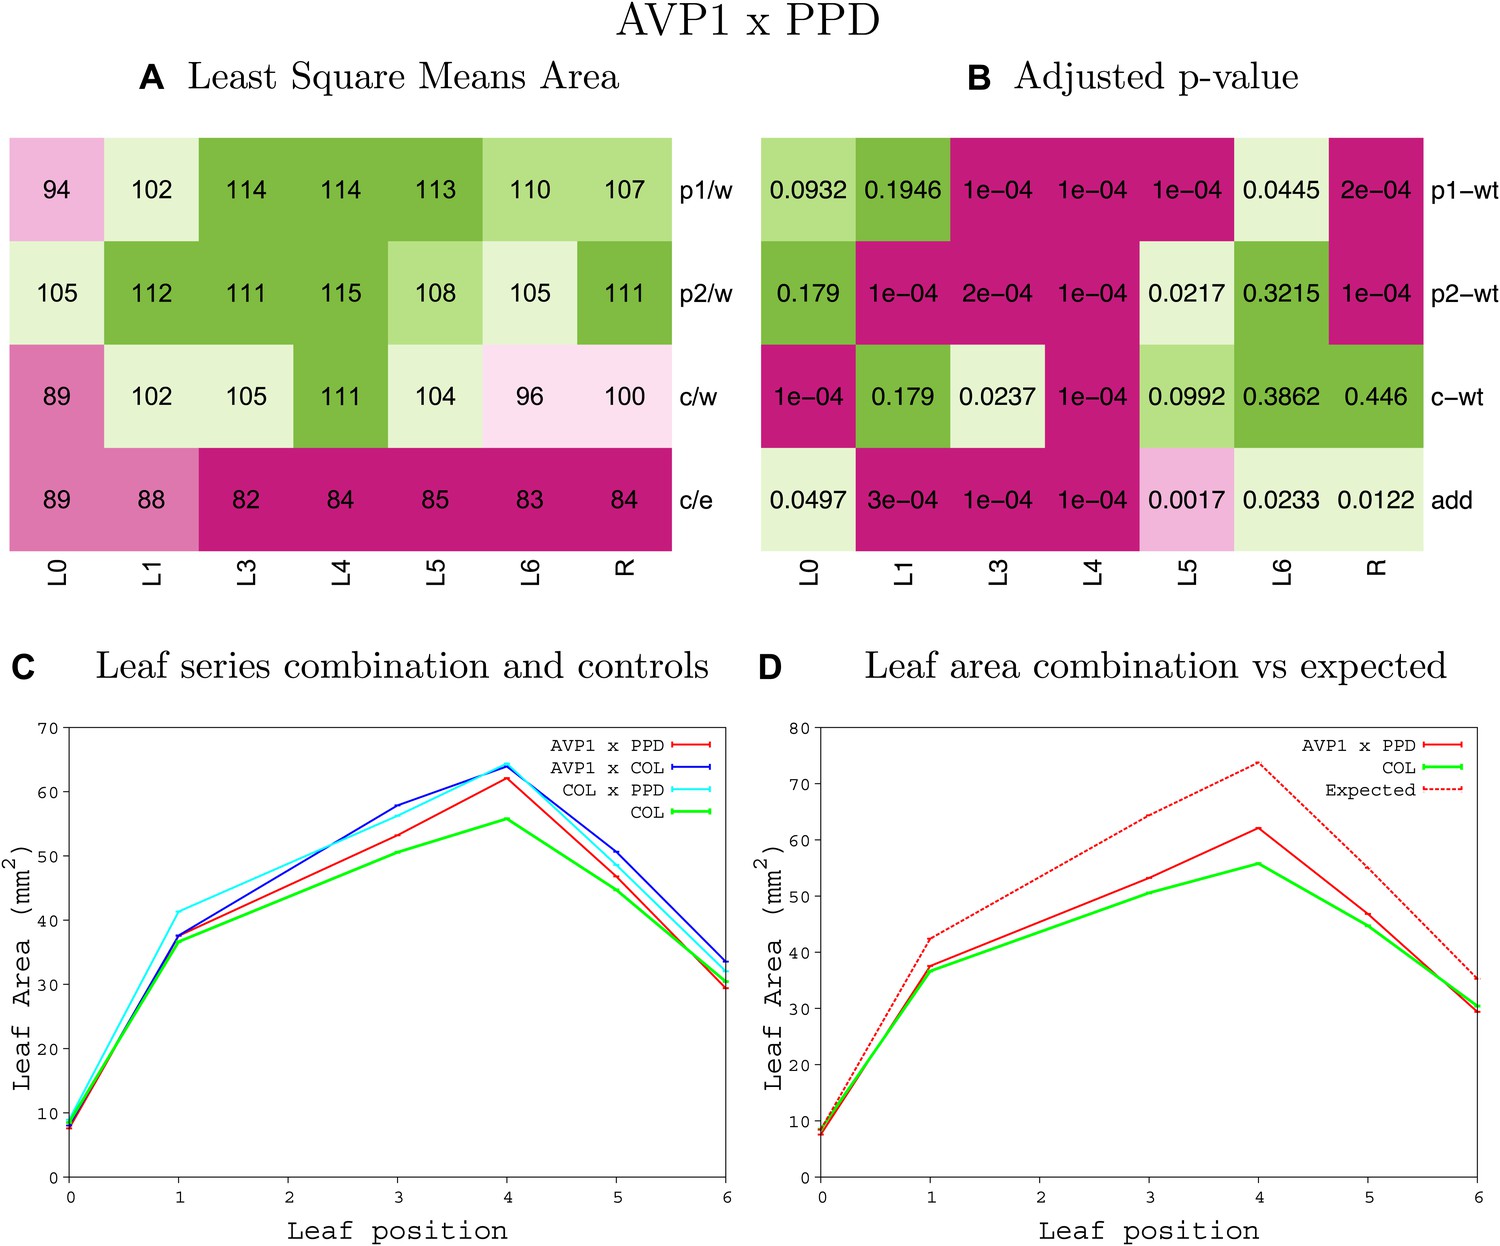
Statistical output of the phenotypic data for the heterozygous combination AVP1OE-ami-ppd.
Top left panel (A): p1/w, p2/w, c/w: percentage of the area to the WT (w) of parent 1 (p1), parent 2 (p2) and the combination (C) respectively. c/e: percentage of the area of the combination (C) to the expected if non-interacting value (EXPni) (e). Top right panel (B), corresponding FDRs for the percentages presented in the top left panel. The cotyledons (L0), first six leaves (L1–L6) and the rosette (R) are represented. Bottom left panel (C): graphs representing leaf areas for the WT (green), the combination (red) and both single lines (dark and light blue) in mm2. Bottom right panel: graph showing the leaf area of the combination (red) and the WT (green) compared to the calculated EXPni (dotted red).
Figure 1—figure supplement 28
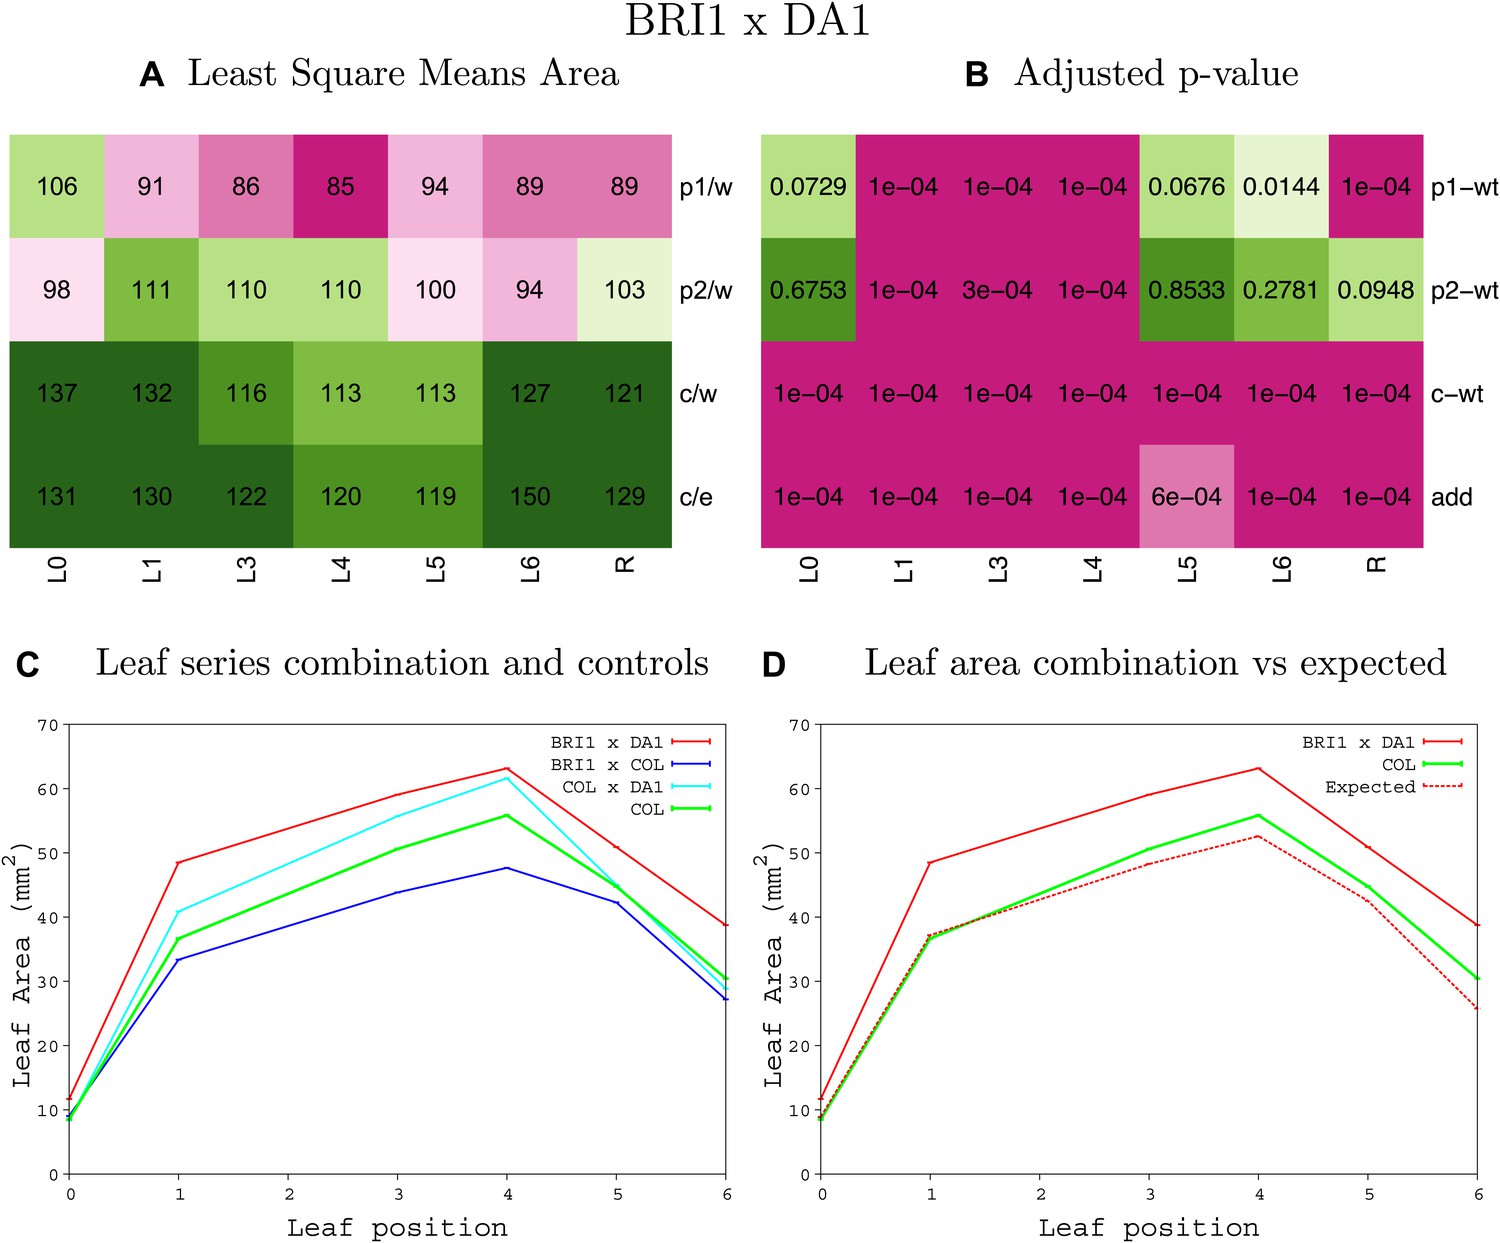
Statistical output of the phenotypic data for the heterozygous combination BRI1OE-da1-1.
Top left panel (A): p1/w, p2/w, c/w: percentage of the area to the WT (w) of parent 1 (p1), parent 2 (p2) and the combination (C) respectively. c/e: percentage of the area of the combination (C) to the expected if non-interacting value (EXPni) (e). Top right panel (B), corresponding FDRs for the percentages presented in the top left panel. The cotyledons (L0), first six leaves (L1–L6) and the rosette (R) are represented. Bottom left panel (C): graphs representing leaf areas for the WT (green), the combination (red) and both single lines (dark and light blue) in mm2. Bottom right panel: graph showing the leaf area of the combination (red) and the WT (green) compared to the calculated EXPni (dotted red).
Figure 1—figure supplement 29
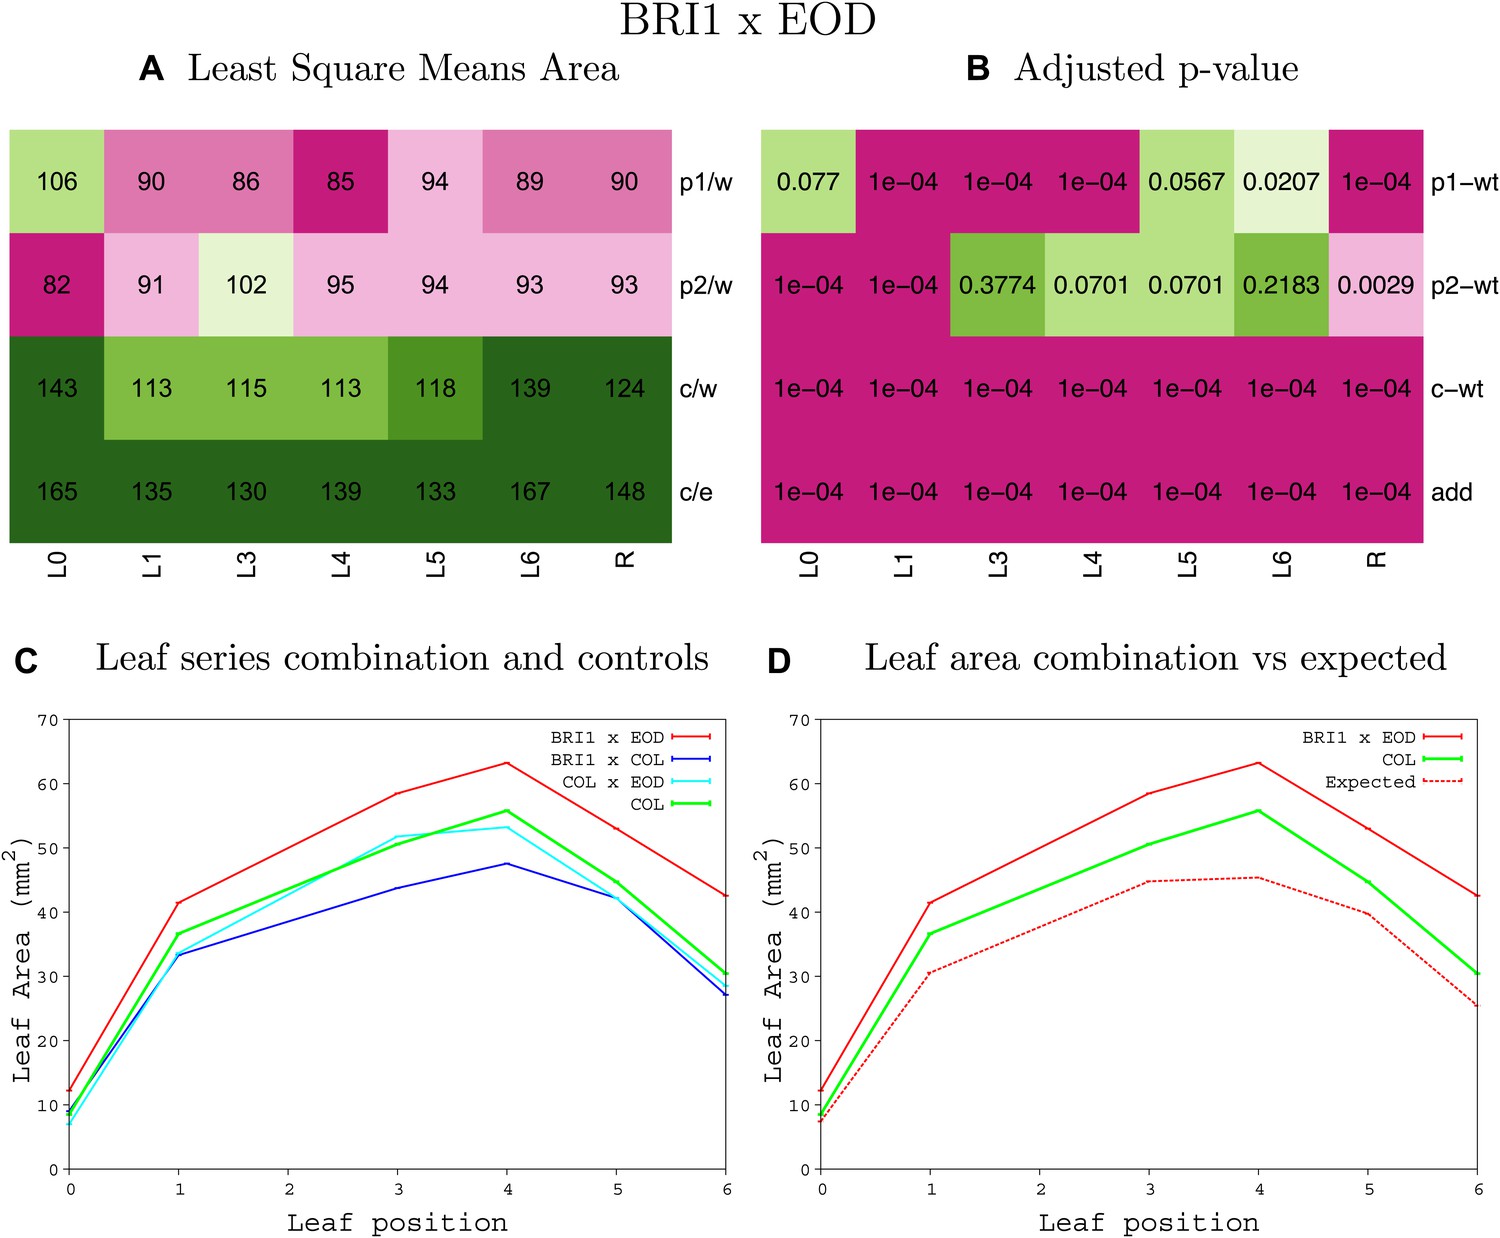
Statistical output of the phenotypic data for the heterozygous combination BRI1OE-eod1-2.
Top left panel (A): p1/w, p2/w, c/w: percentage of the area to the WT (w) of parent 1 (p1), parent 2 (p2) and the combination (C) respectively. c/e: percentage of the area of the combination (C) to the expected if non-interacting value (EXPni) (e). Top right panel (B), corresponding FDRs for the percentages presented in the top left panel. The cotyledons (L0), first six leaves (L1–L6) and the rosette (R) are represented. Bottom left panel (C): graphs representing leaf areas for the WT (green), the combination (red) and both single lines (dark and light blue) in mm2. Bottom right panel: graph showing the leaf area of the combination (red) and the WT (green) compared to the calculated EXPni (dotted red).
Figure 1—figure supplement 30
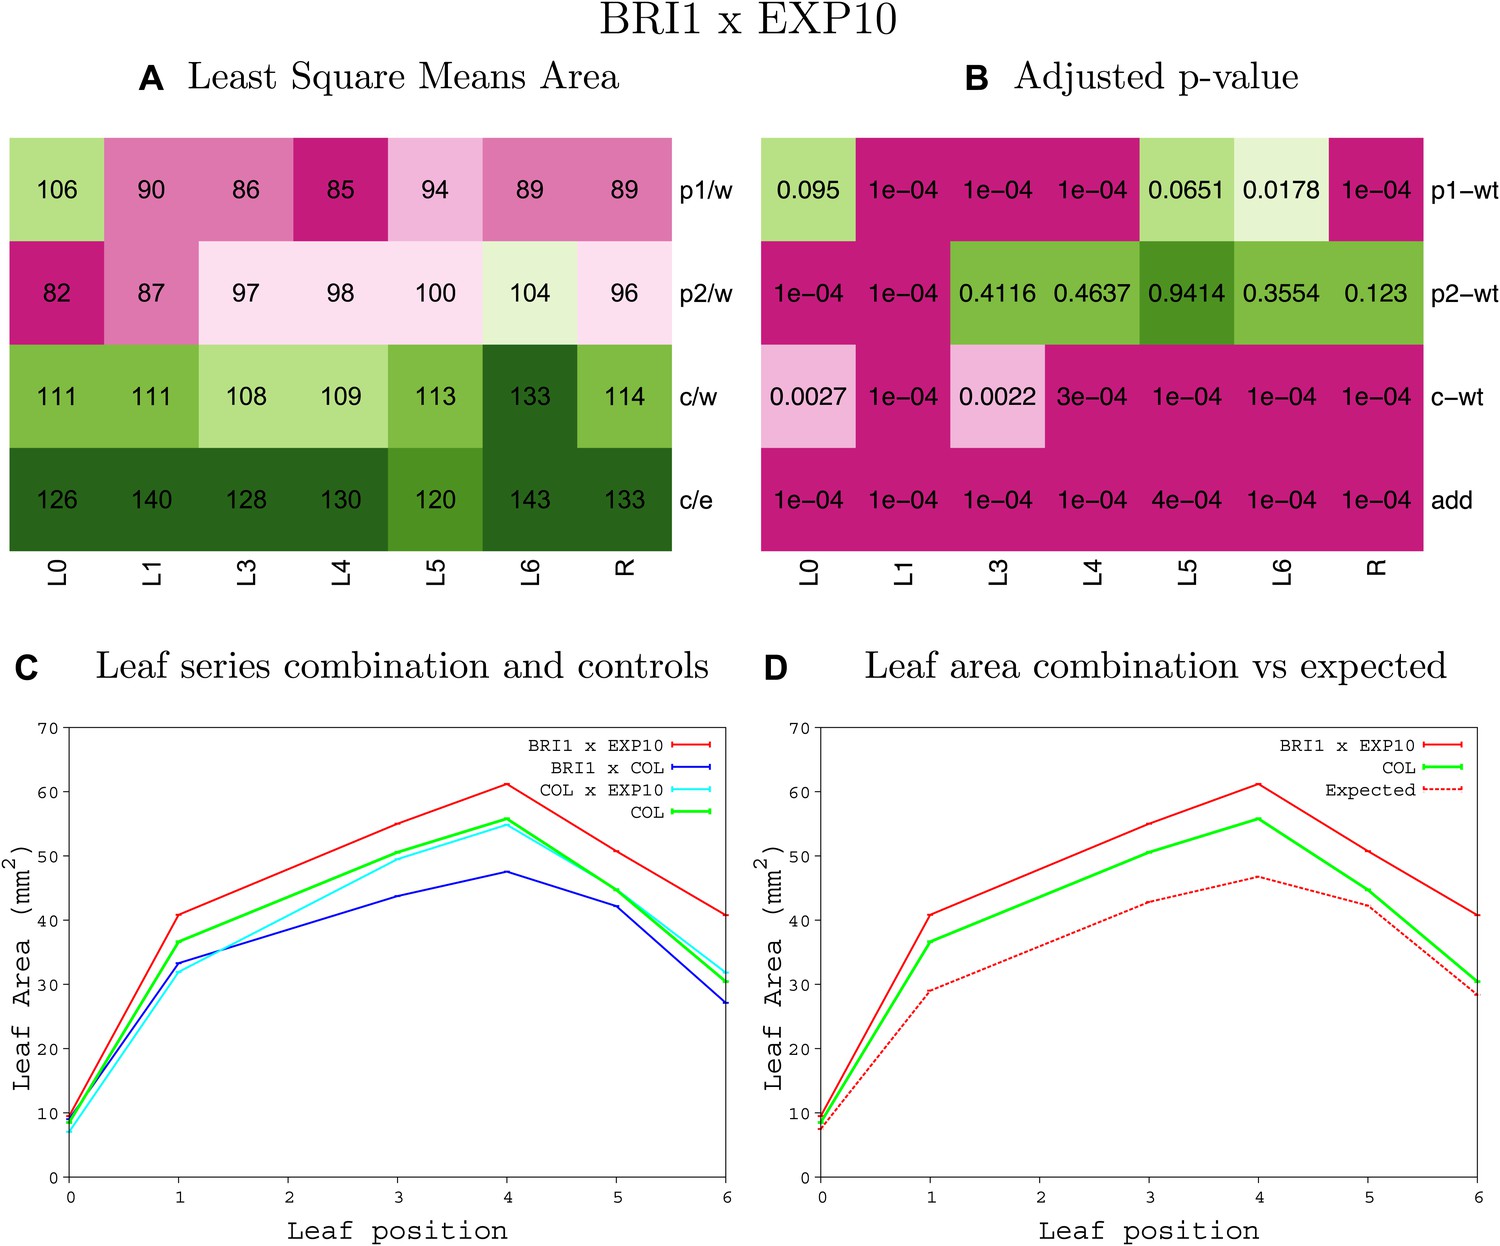
Statistical output of the phenotypic data for the heterozygous combination BRI1OE-EXP10OE.
Top left panel (A): p1/w, p2/w, c/w: percentage of the area to the WT (w) of parent 1 (p1), parent 2 (p2) and the combination (C) respectively. c/e: percentage of the area of the combination (C) to the expected if non-interacting value (EXPni) (e). Top right panel (B), corresponding FDRs for the percentages presented in the top left panel. The cotyledons (L0), first six leaves (L1–L6) and the rosette (R) are represented. Bottom left panel (C): graphs representing leaf areas for the WT (green), the combination (red) and both single lines (dark and light blue) in mm2. Bottom right panel: graph showing the leaf area of the combination (red) and the WT (green) compared to the calculated EXPni (dotted red).
Figure 1—figure supplement 31
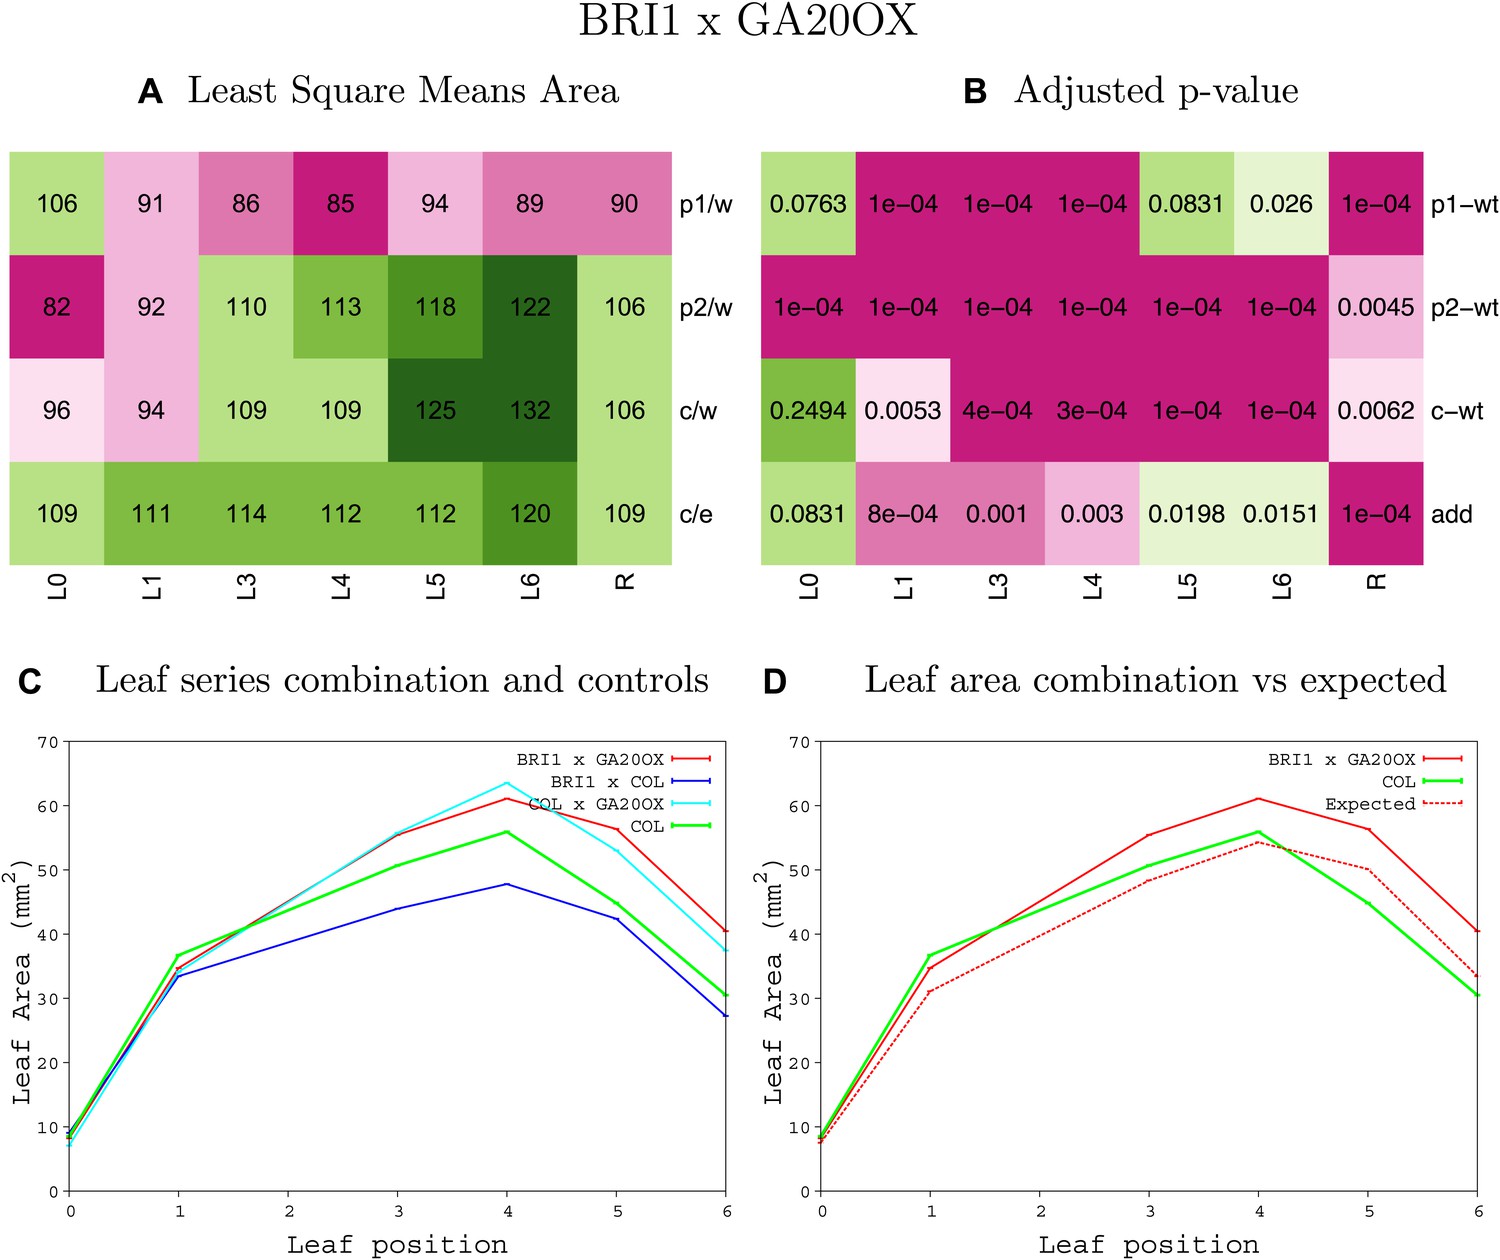
Statistical output of the phenotypic data for the heterozygous combination BRI1OE-GA20OX1OE.
Top left panel (A): p1/w, p2/w, c/w: percentage of the area to the WT (w) of parent 1 (p1), parent 2 (p2) and the combination (C) respectively. c/e: percentage of the area of the combination (C) to the expected if non-interacting value (EXPni) (e). Top right panel (B), corresponding FDRs for the percentages presented in the top left panel. The cotyledons (L0), first six leaves (L1–L6) and the rosette (R) are represented. Bottom left panel (C): graphs representing leaf areas for the WT (green), the combination (red) and both single lines (dark and light blue) in mm2. Bottom right panel: graph showing the leaf area of the combination (red) and the WT (green) compared to the calculated EXPni (dotted red).
Figure 1—figure supplement 32
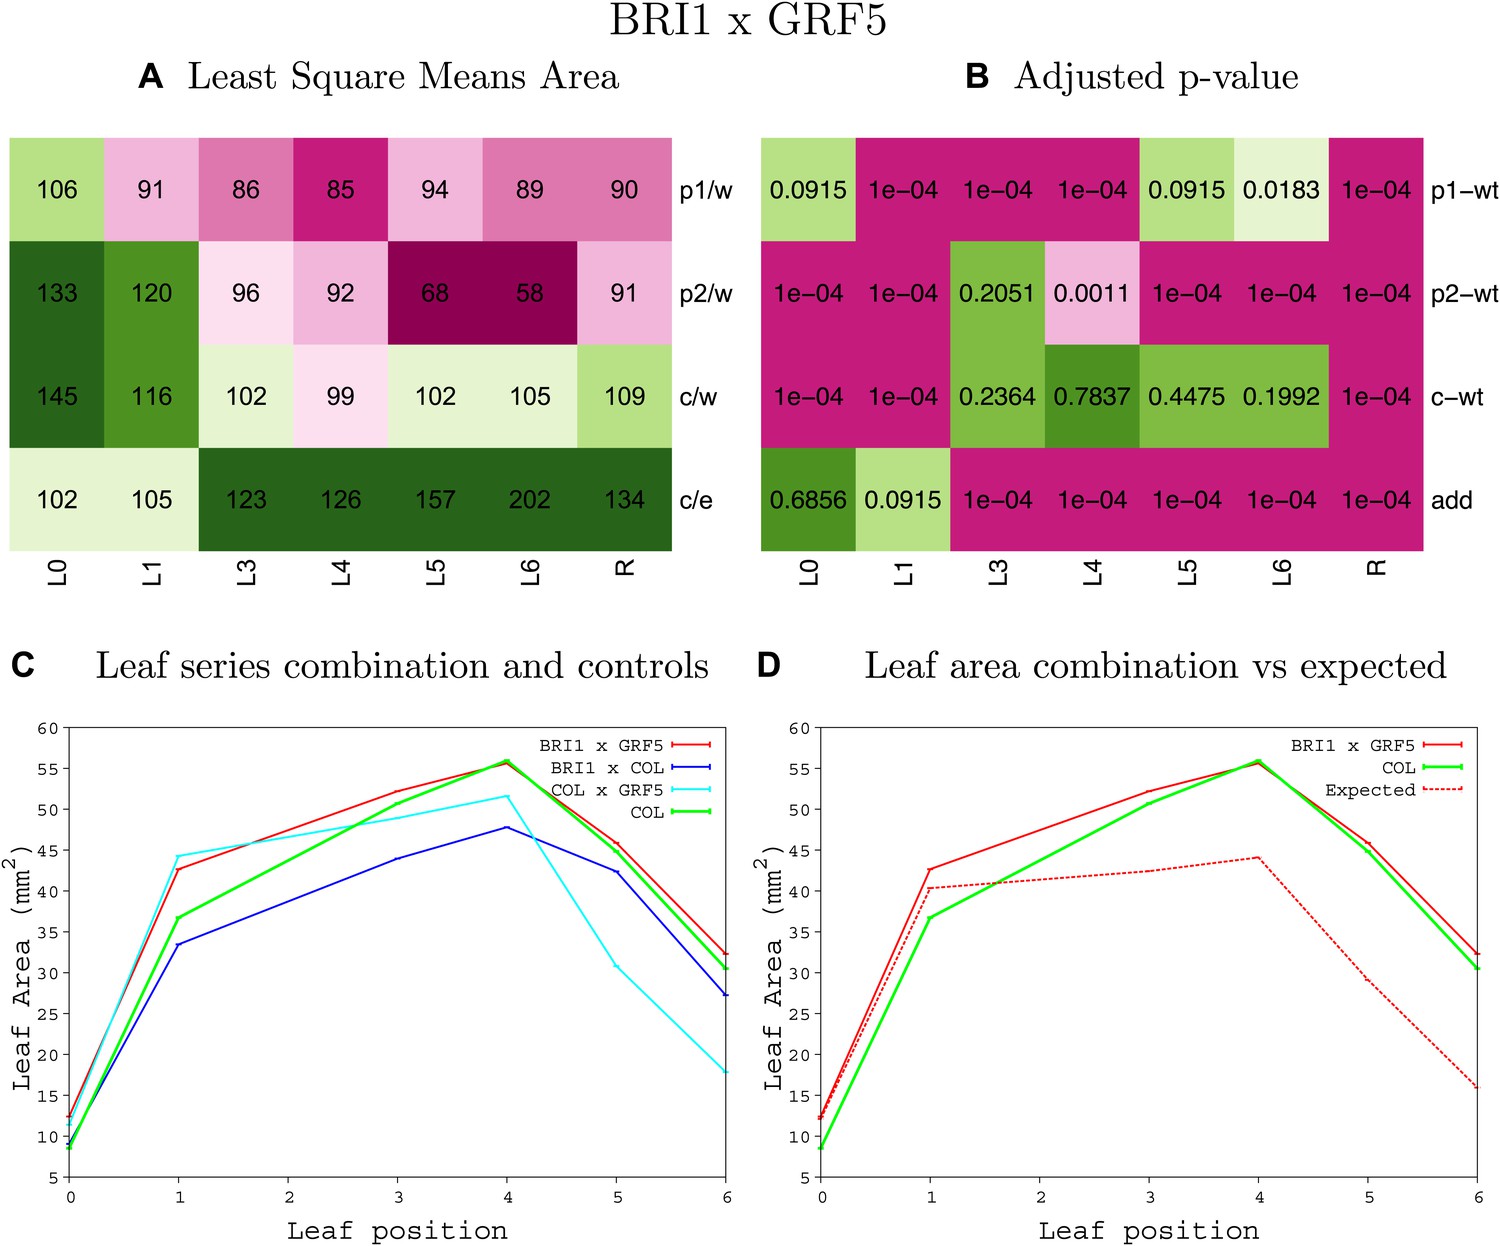
Statistical output of the phenotypic data for the heterozygous combination BRI1OE-GRF5OE.
Top left panel (A): p1/w, p2/w, c/w: percentage of the area to the WT (w) of parent 1 (p1), parent 2 (p2) and the combination (C) respectively. c/e: percentage of the area of the combination (C) to the expected if non-interacting value (EXPni) (e). Top right panel (B), corresponding FDRs for the percentages presented in the top left panel. The cotyledons (L0), first six leaves (L1–L6) and the rosette (R) are represented. Bottom left panel (C): graphs representing leaf areas for the WT (green), the combination (red) and both single lines (dark and light blue) in mm2. Bottom right panel: graph showing the leaf area of the combination (red) and the WT (green) compared to the calculated EXPni (dotted red).
Figure 1—figure supplement 33
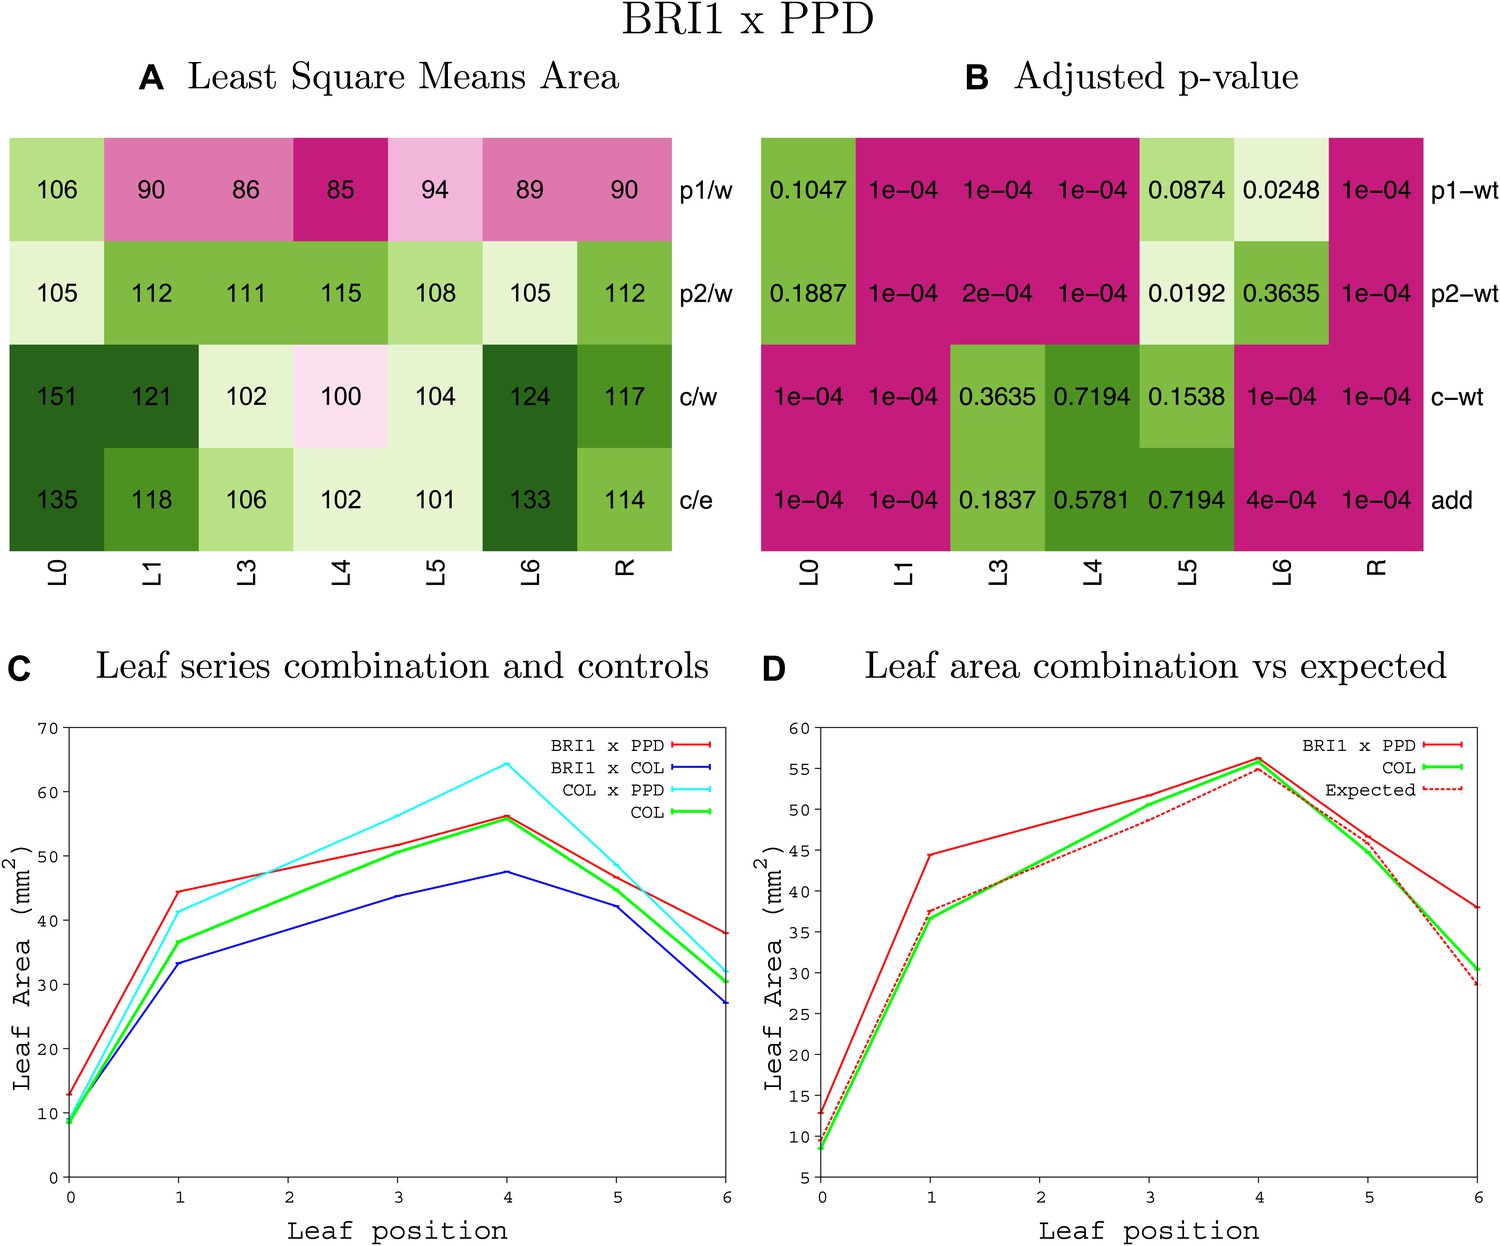
Statistical output of the phenotypic data for the heterozygous combination BRI1OE-ami-ppd.
Top left panel (A): p1/w, p2/w, c/w: percentage of the area to the WT (w) of parent 1 (p1), parent 2 (p2) and the combination (C) respectively. c/e: percentage of the area of the combination (C) to the expected if non-interacting value (EXPni) (e). Top right panel (B), corresponding FDRs for the percentages presented in the top left panel. The cotyledons (L0), first six leaves (L1–L6) and the rosette (R) are represented. Bottom left panel (C): graphs representing leaf areas for the WT (green), the combination (red) and both single lines (dark and light blue) in mm2. Bottom right panel: graph showing the leaf area of the combination (red) and the WT (green) compared to the calculated EXPni (dotted red).
Figure 1—figure supplement 34
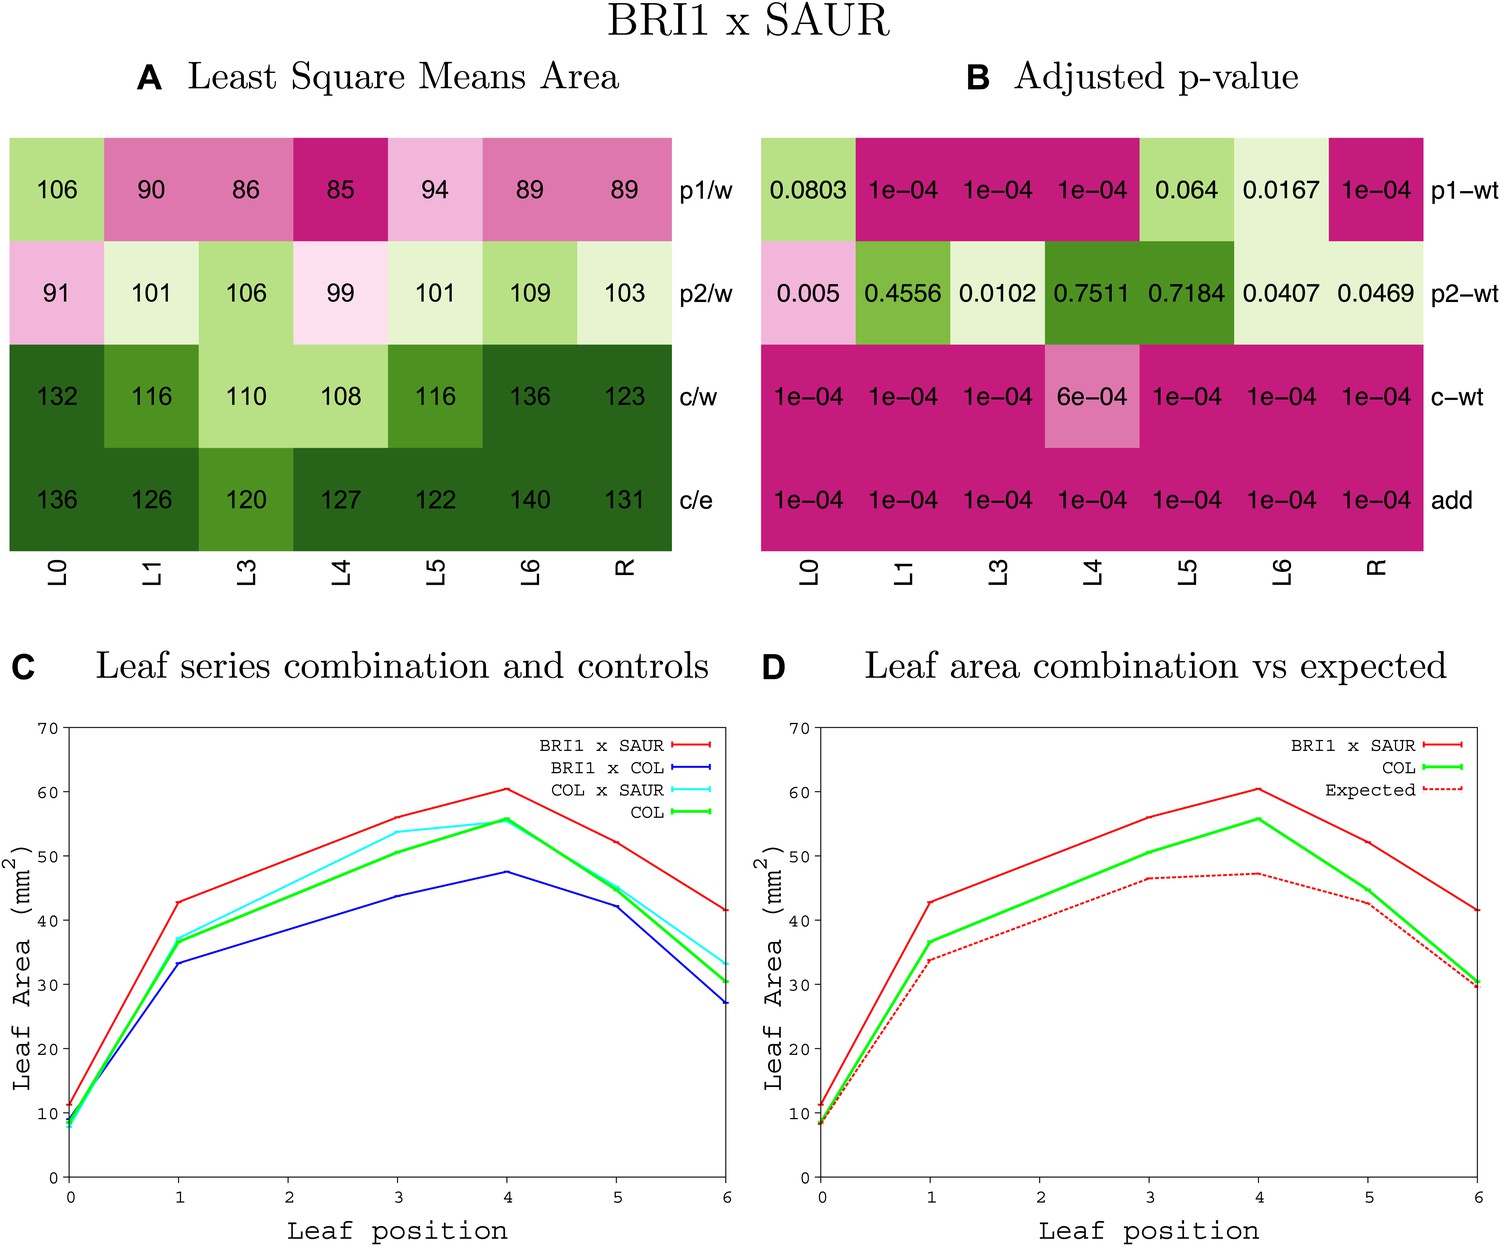
Statistical output of the phenotypic data for the heterozygous combination BRI1OE-SAUR19OE.
Top left panel (A): p1/w, p2/w, c/w: percentage of the area to the WT (w) of parent 1 (p1), parent 2 (p2) and the combination (C) respectively. c/e: percentage of the area of the combination (C) to the expected if non-interacting value (EXPni) (e). Top right panel (B), corresponding FDRs for the percentages presented in the top left panel. The cotyledons (L0), first six leaves (L1–L6) and the rosette (R) are represented. Bottom left panel (C): graphs representing leaf areas for the WT (green), the combination (red) and both single lines (dark and light blue) in mm2. Bottom right panel: graph showing the leaf area of the combination (red) and the WT (green) compared to the calculated EXPni (dotted red).
Figure 1—figure supplement 35
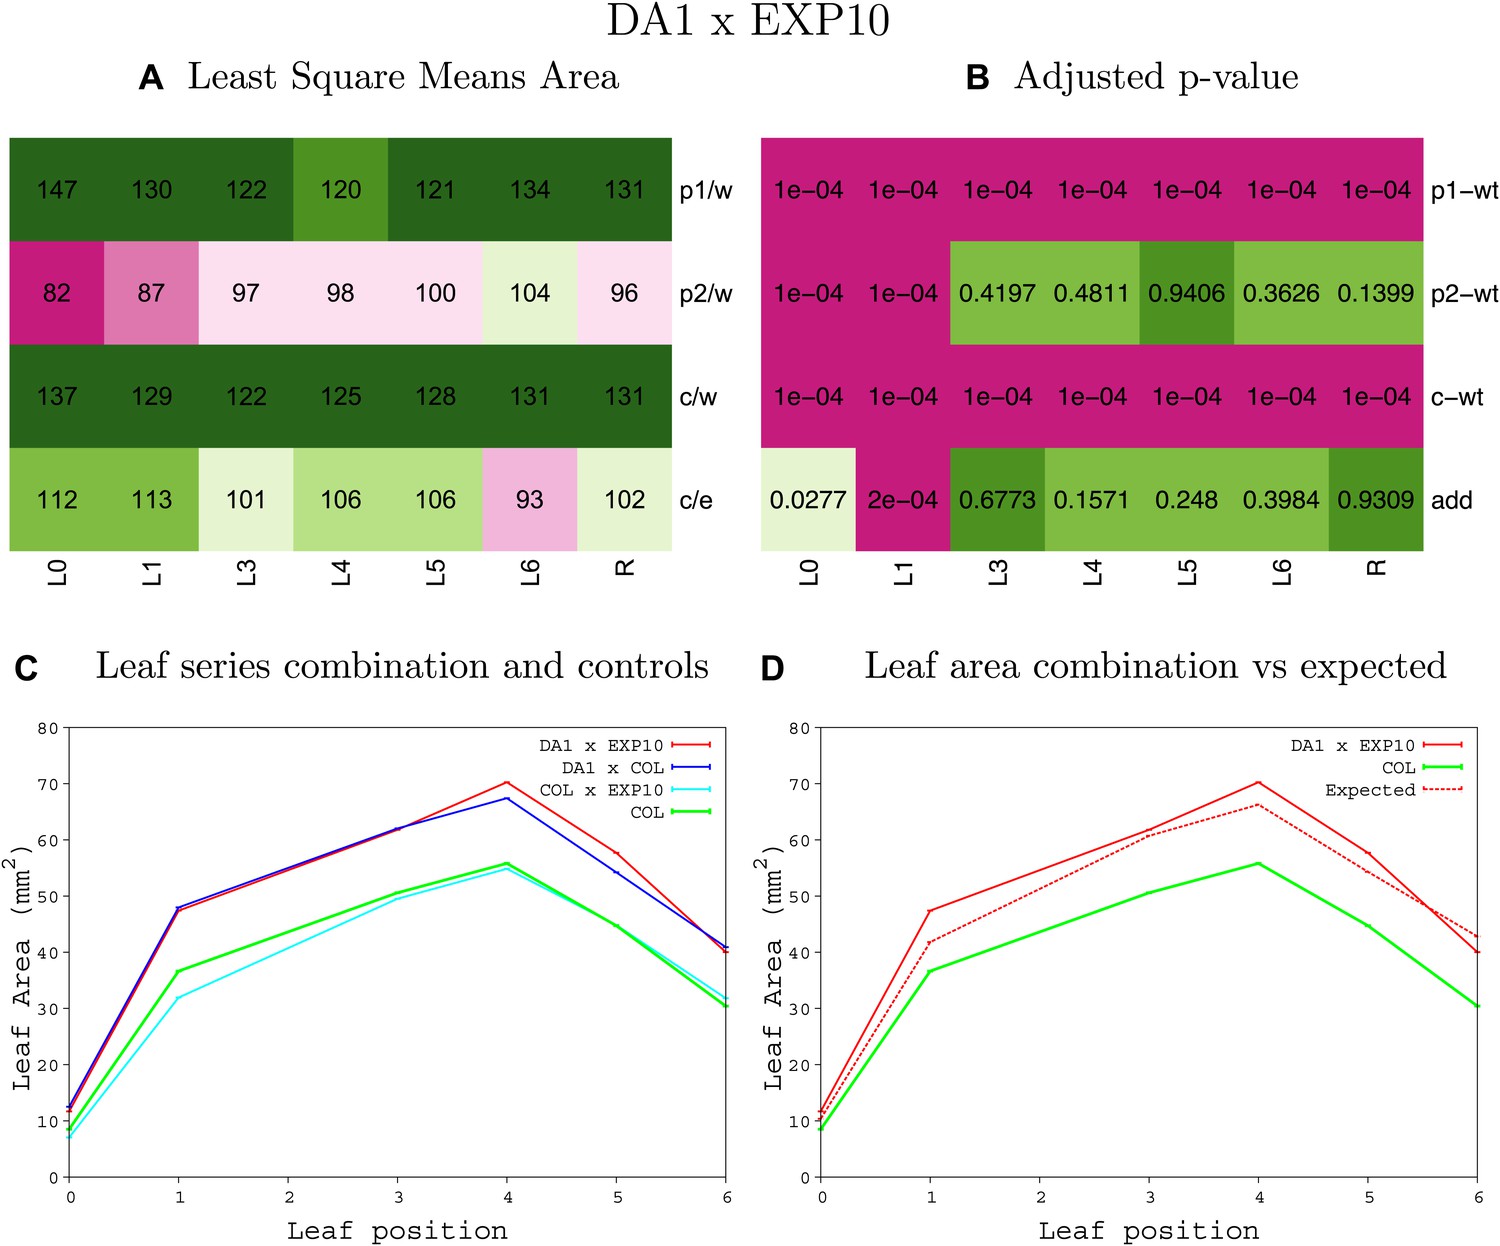
Statistical output of the phenotypic data for the heterozygous combination da1-1-EXP10OE.
Top left panel (A): p1/w, p2/w, c/w: percentage of the area to the WT (w) of parent 1 (p1), parent 2 (p2) and the combination (C) respectively. c/e: percentage of the area of the combination (C) to the expected if non-interacting value (EXPni) (e). Top right panel (B), corresponding FDRs for the percentages presented in the top left panel. The cotyledons (L0), first six leaves (L1–L6) and the rosette (R) are represented. Bottom left panel (C): graphs representing leaf areas for the WT (green), the combination (red) and both single lines (dark and light blue) in mm2. Bottom right panel: graph showing the leaf area of the combination (red) and the WT (green) compared to the calculated EXPni (dotted red).
Figure 1—figure supplement 36
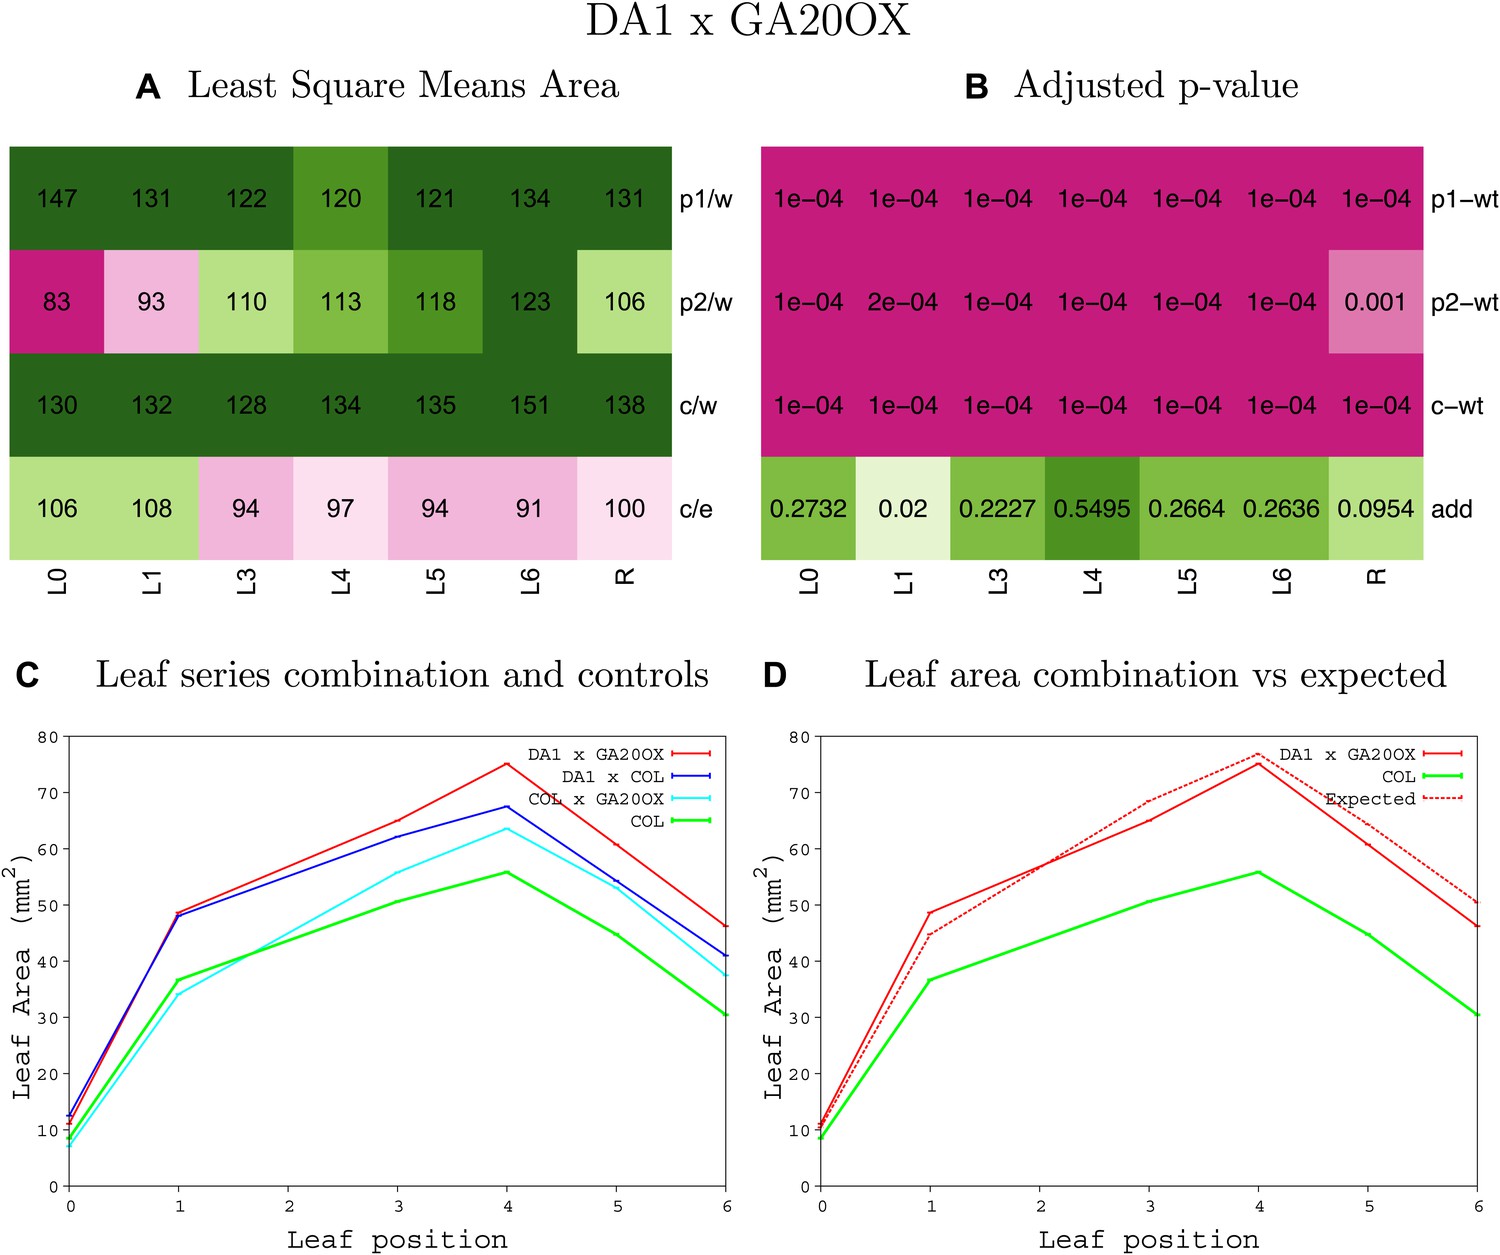
Statistical output of the phenotypic data for the heterozygous combination da1-1-GA20OX1OE.
Top left panel (A): p1/w, p2/w, c/w: percentage of the area to the WT (w) of parent 1 (p1), parent 2 (p2) and the combination (C) respectively. c/e: percentage of the area of the combination (C) to the expected if non-interacting value (EXPni) (e). Top right panel (B), corresponding FDRs for the percentages presented in the top left panel. The cotyledons (L0), first six leaves (L1–L6) and the rosette (R) are represented. Bottom left panel (C): graphs representing leaf areas for the WT (green), the combination (red) and both single lines (dark and light blue) in mm2. Bottom right panel: graph showing the leaf area of the combination (red) and the WT (green) compared to the calculated EXPni (dotted red).
Figure 1—figure supplement 37
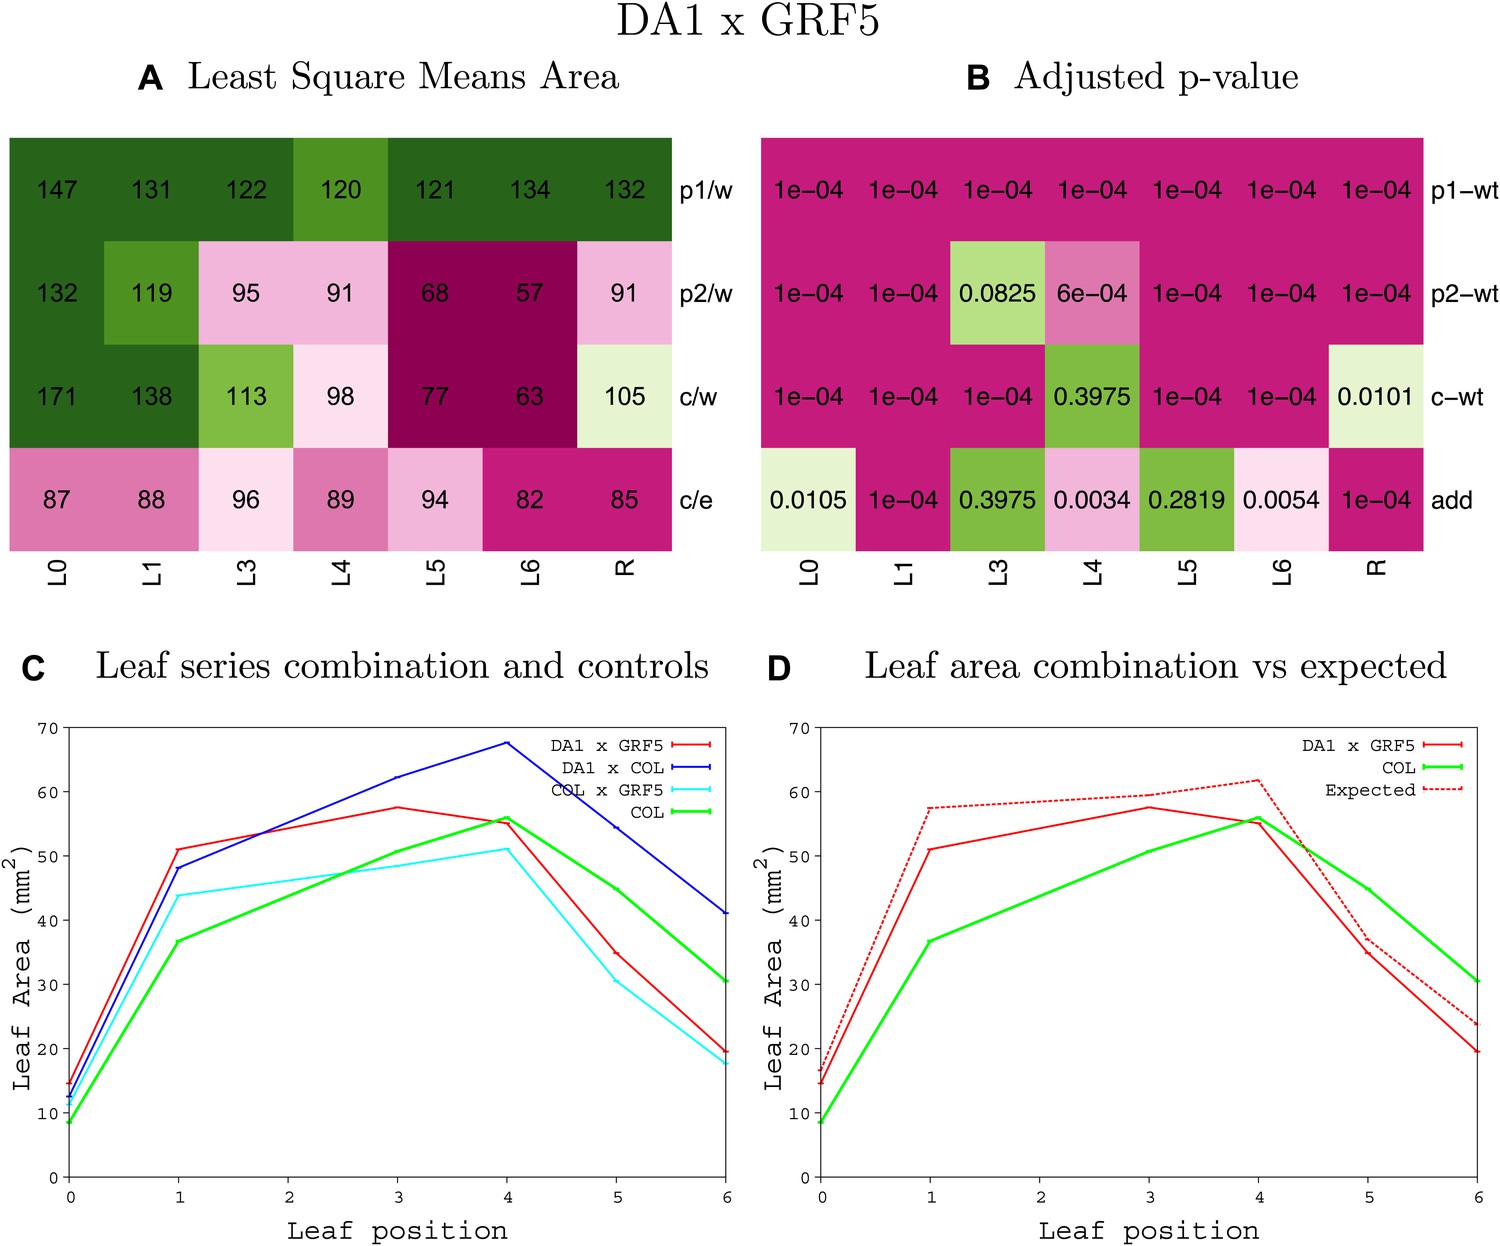
Statistical output of the phenotypic data for the heterozygous combination da1-1-GRF5OE.
Top left panel (A): p1/w, p2/w, c/w: percentage of the area to the WT (w) of parent 1 (p1), parent 2 (p2) and the combination (C) respectively. c/e: percentage of the area of the combination (C) to the expected if non-interacting value (EXPni) (e). Top right panel (B), corresponding FDRs for the percentages presented in the top left panel. The cotyledons (L0), first six leaves (L1–L6) and the rosette (R) are represented. Bottom left panel (C): graphs representing leaf areas for the WT (green), the combination (red) and both single lines (dark and light blue) in mm2. Bottom right panel: graph showing the leaf area of the combination (red) and the WT (green) compared to the calculated EXPni (dotted red).
Figure 1—figure supplement 38
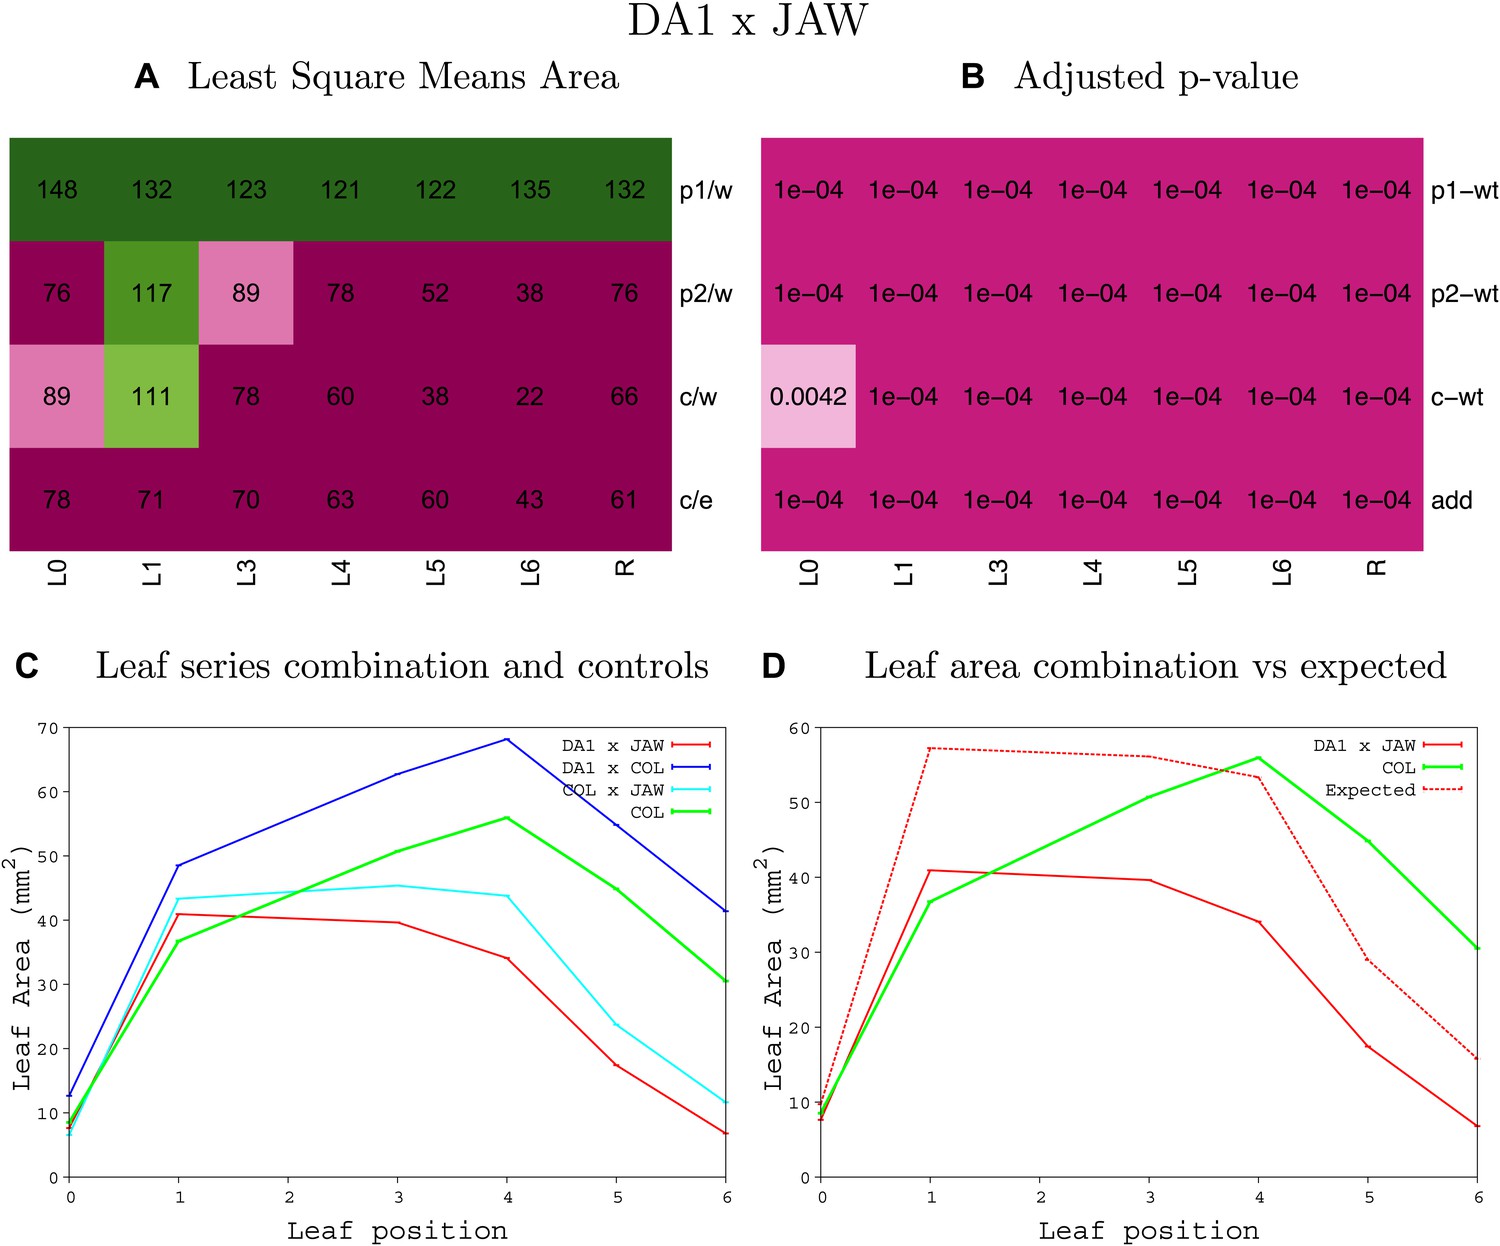
Statistical output of the phenotypic data for the heterozygous combination da1-1-jaw-D.
Top left panel (A): p1/w, p2/w, c/w: percentage of the area to the WT (w) of parent 1 (p1), parent 2 (p2) and the combination (C) respectively. c/e: percentage of the area of the combination (C) to the expected if non-interacting value (EXPni) (e). Top right panel (B), corresponding FDRs for the percentages presented in the top left panel. The cotyledons (L0), first six leaves (L1–L6) and the rosette (R) are represented. Bottom left panel (C): graphs representing leaf areas for the WT (green), the combination (red) and both single lines (dark and light blue) in mm2. Bottom right panel: graph showing the leaf area of the combination (red) and the WT (green) compared to the calculated EXPni (dotted red).
Figure 1—figure supplement 39
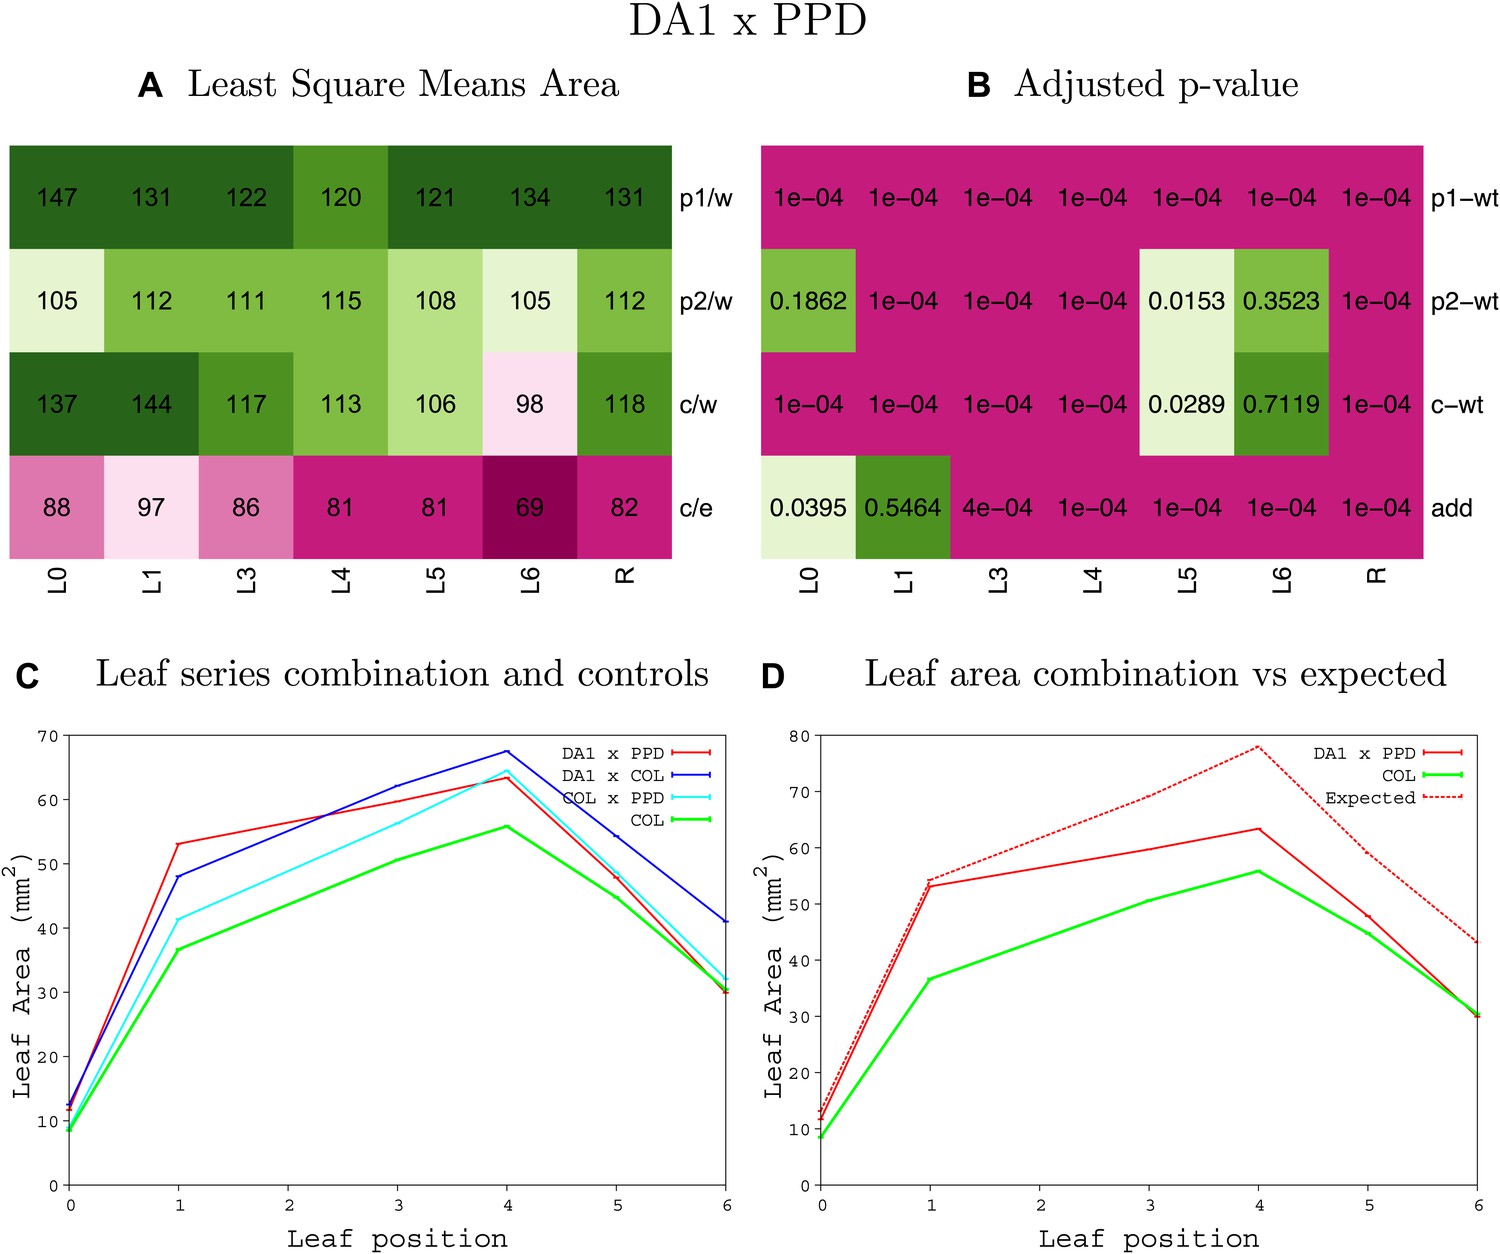
Statistical output of the phenotypic data for the heterozygous combination da1-1-ami-ppd.
Top left panel (A): p1/w, p2/w, c/w: percentage of the area to the WT (w) of parent 1 (p1), parent 2 (p2) and the combination (C) respectively. c/e: percentage of the area of the combination (C) to the expected if non-interacting value (EXPni) (e). Top right panel (B), corresponding FDRs for the percentages presented in the top left panel. The cotyledons (L0), first six leaves (L1–L6) and the rosette (R) are represented. Bottom left panel (C): graphs representing leaf areas for the WT (green), the combination (red) and both single lines (dark and light blue) in mm2. Bottom right panel: graph showing the leaf area of the combination (red) and the WT (green) compared to the calculated EXPni (dotted red).
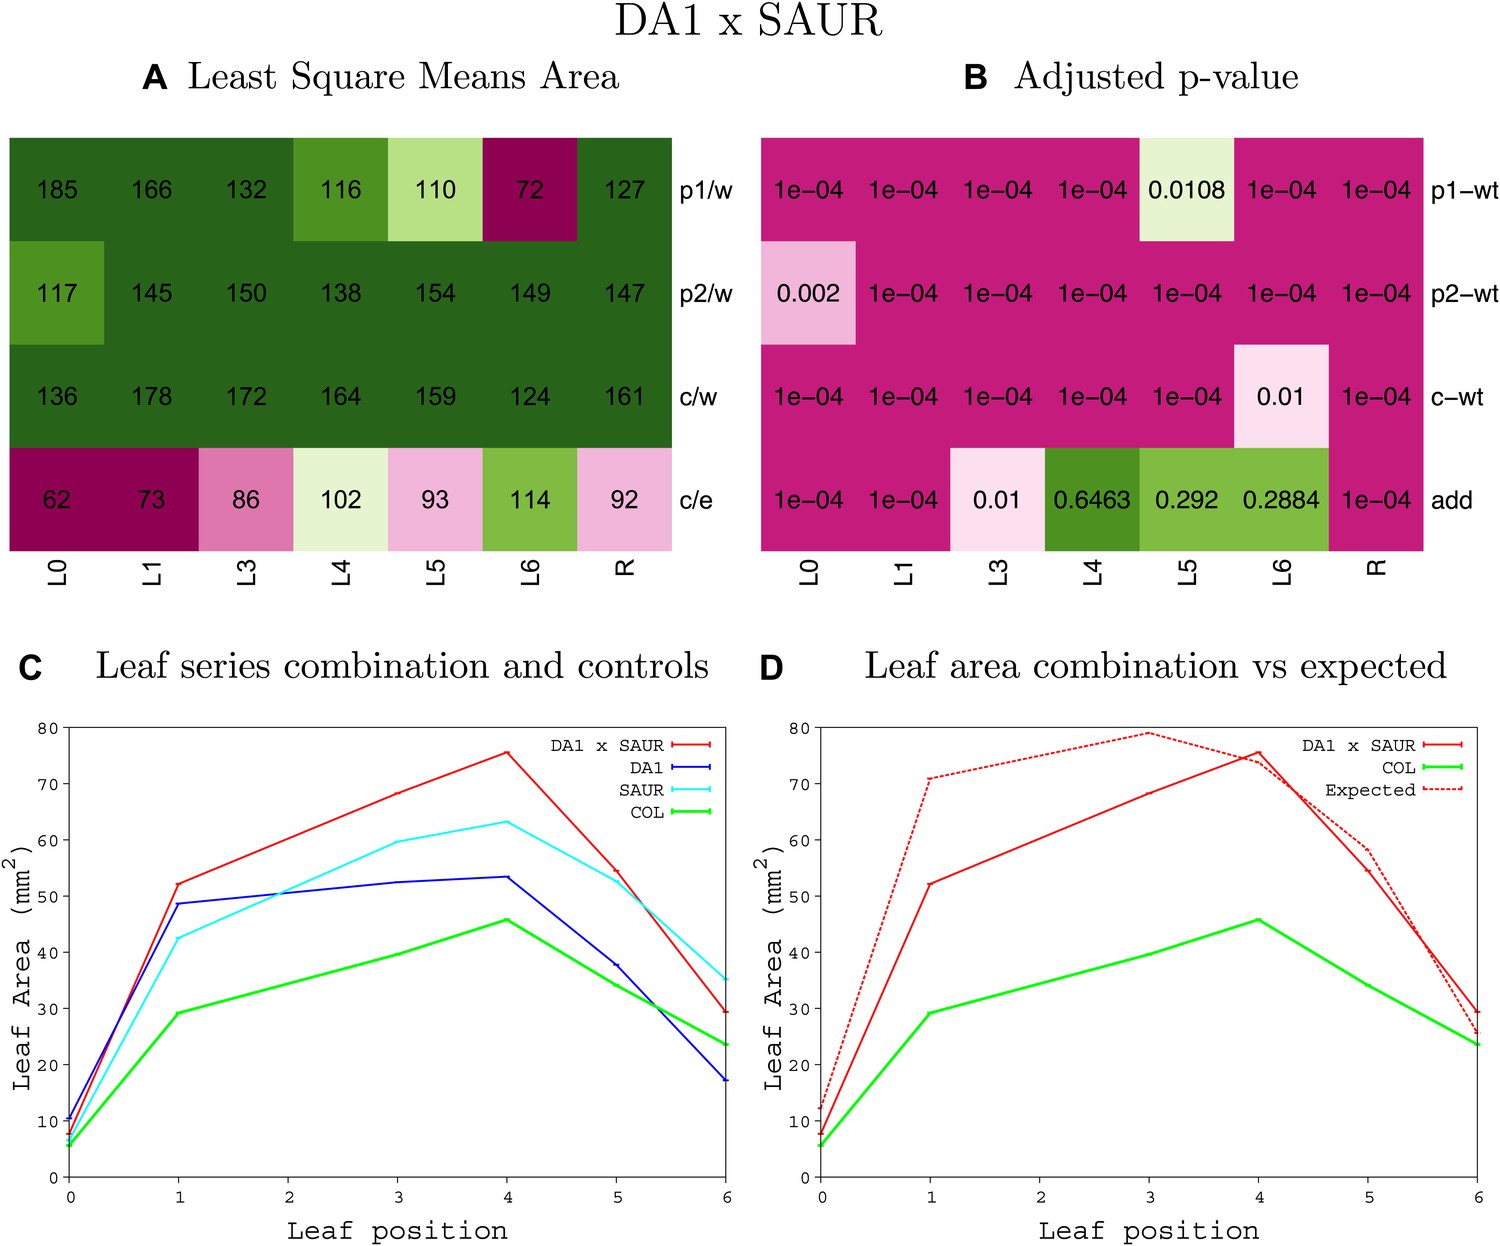
Figure 1—figure supplement 40
Statistical output of the phenotypic data for the heterozygous combination da1-1-SAUR19OE.
Top left panel (A): p1/w, p2/w, c/w: percentage of the area to the WT (w) of parent 1 (p1), parent 2 (p2) and the combination (C) respectively. c/e: percentage of the area of the combination (C) to the expected if non-interacting value (EXPni) (e). Top right panel (B), corresponding FDRs for the percentages presented in the top left panel. The cotyledons (L0), first six leaves (L1–L6) and the rosette (R) are represented. Bottom left panel (C): graphs representing leaf areas for the WT (green), the combination (red) and both single lines (dark and light blue) in mm2. Bottom right panel: graph showing the leaf area of the combination (red) and the WT (green) compared to the calculated EXPni (dotted red).
Figure 1—figure supplement 41
Statistical output of the phenotypic data for the heterozygous combination eod1-2-ami-ppd.
Top left panel (A): p1/w, p2/w, c/w: percentage of the area to the WT (w) of parent 1 (p1), parent 2 (p2) and the combination (C) respectively. c/e: percentage of the area of the combination (C) to the expected if non-interacting value (EXPni) (e). Top right panel (B), corresponding FDRs for the percentages presented in the top left panel. The cotyledons (L0), first six leaves (L1–L6) and the rosette (R) are represented. Bottom left panel (C): graphs representing leaf areas for the WT (green), the combination (red) and both single lines (dark and light blue) in mm2. Bottom right panel: graph showing the leaf area of the combination (red) and the WT (green) compared to the calculated EXPni (dotted red).
Figure 1—figure supplement 42
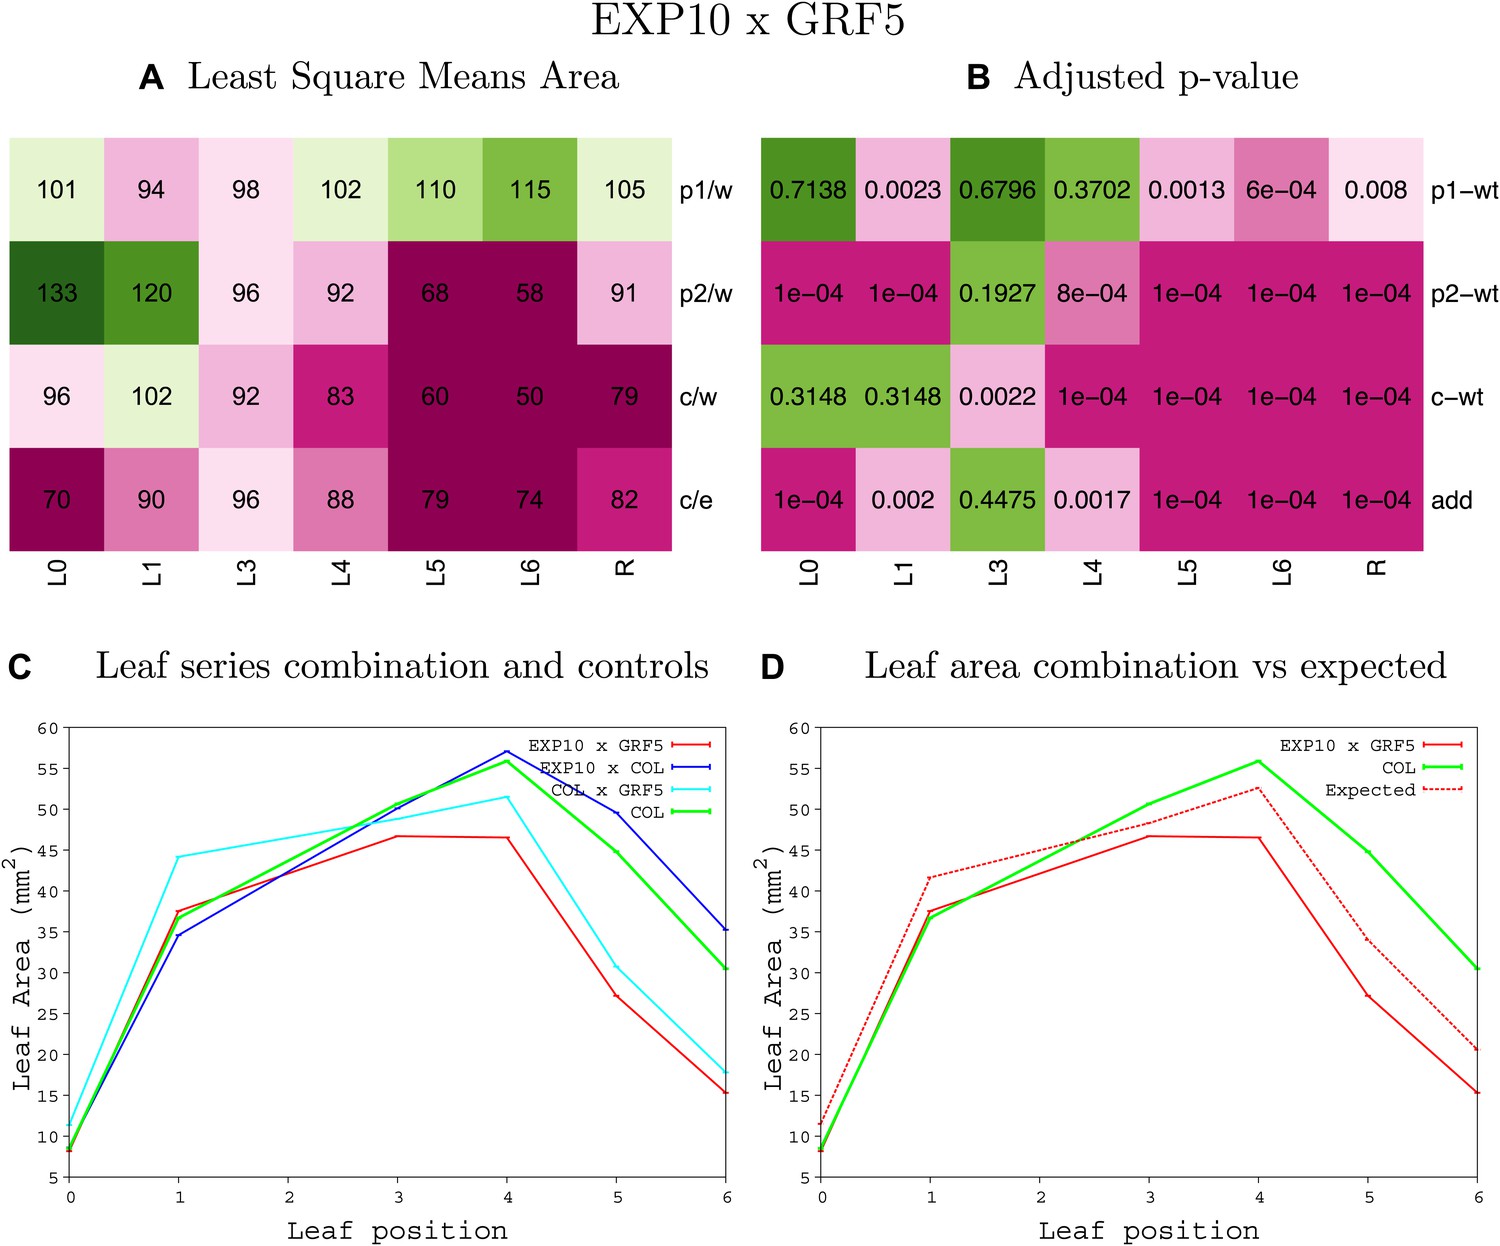
Statistical output of the phenotypic data for the heterozygous combination EXP10OE-GRF5OE.
Top left panel (A): p1/w, p2/w, c/w: percentage of the area to the WT (w) of parent 1 (p1), parent 2 (p2) and the combination (C) respectively. c/e: percentage of the area of the combination (C) to the expected if non-interacting value (EXPni) (e). Top right panel (B), corresponding FDRs for the percentages presented in the top left panel. The cotyledons (L0), first six leaves (L1–L6) and the rosette (R) are represented. Bottom left panel (C): graphs representing leaf areas for the WT (green), the combination (red) and both single lines (dark and light blue) in mm2. Bottom right panel: graph showing the leaf area of the combination (red) and the WT (green) compared to the calculated EXPni (dotted red).
Figure 1—figure supplement 43
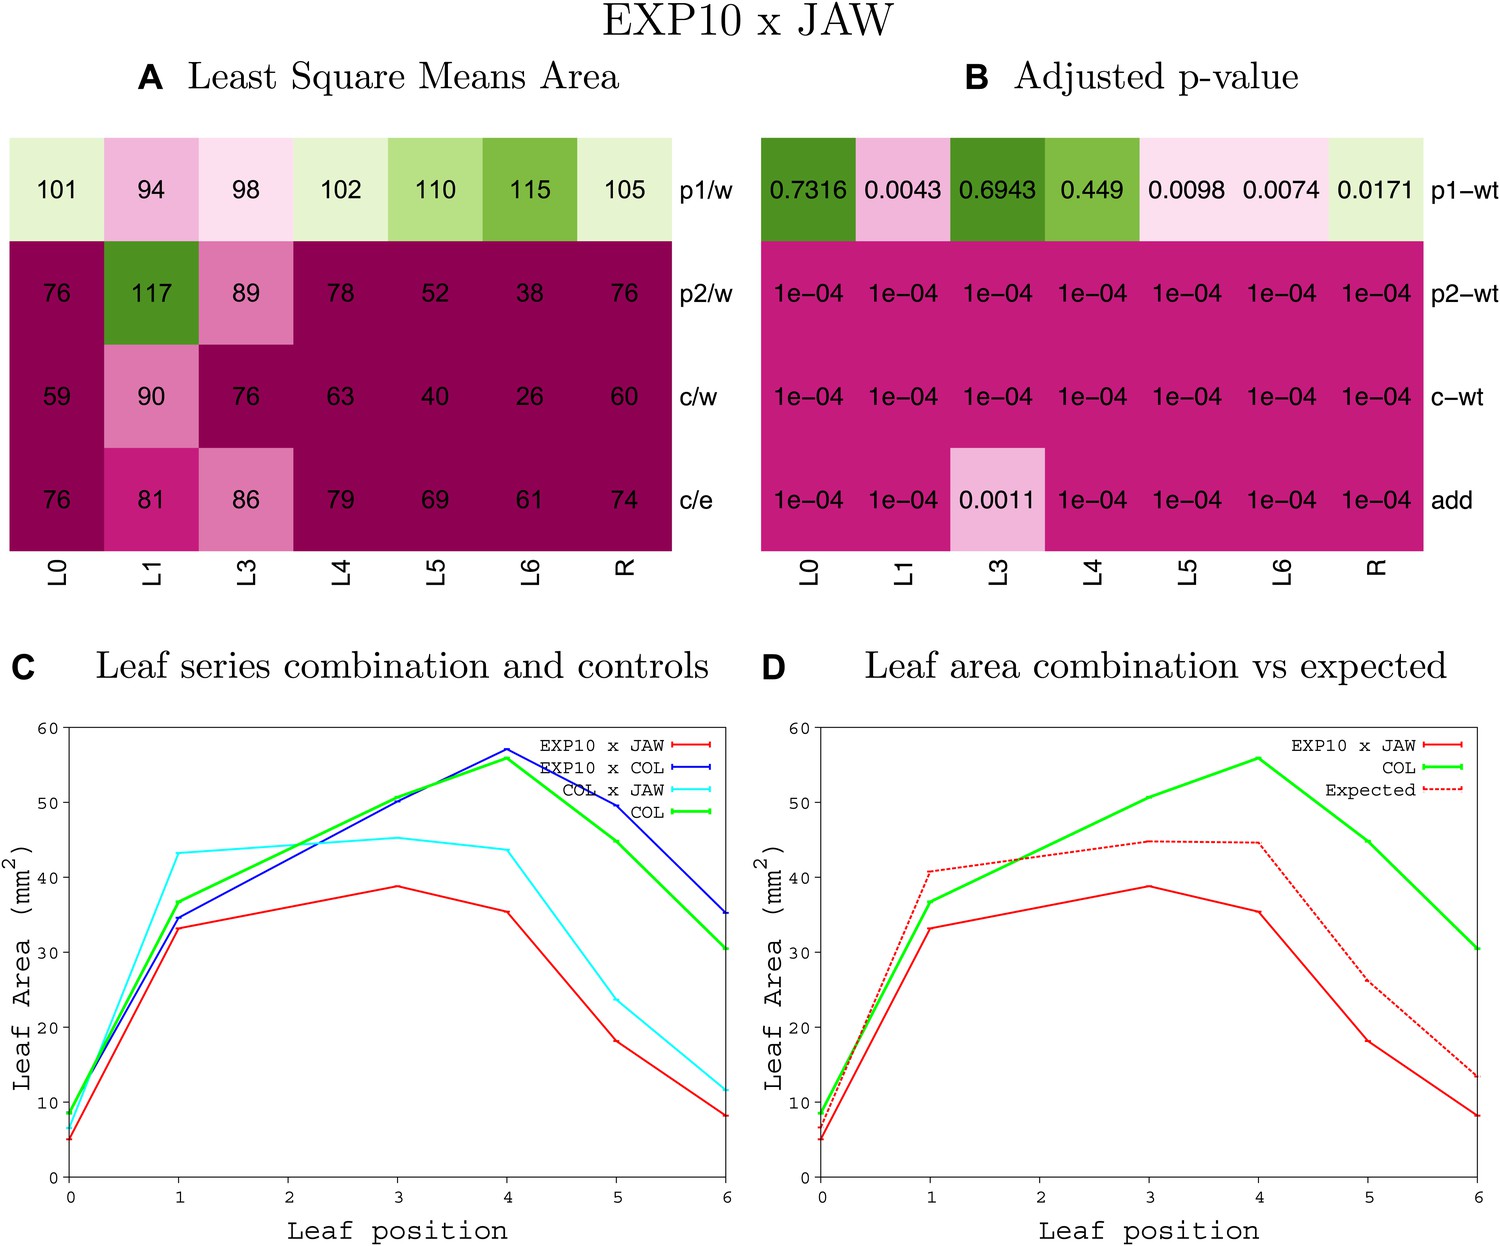
Statistical output of the phenotypic data for the heterozygous combination EXP10OE-jaw-D.
Top left panel (A): p1/w, p2/w, c/w: percentage of the area to the WT (w) of parent 1 (p1), parent 2 (p2) and the combination (C) respectively. c/e: percentage of the area of the combination (C) to the expected if non-interacting value (EXPni) (e). Top right panel (B), corresponding FDRs for the percentages presented in the top left panel. The cotyledons (L0), first six leaves (L1–L6) and the rosette (R) are represented. Bottom left panel (C): graphs representing leaf areas for the WT (green), the combination (red) and both single lines (dark and light blue) in mm2. Bottom right panel: graph showing the leaf area of the combination (red) and the WT (green) compared to the calculated EXPni (dotted red).
Figure 1—figure supplement 44
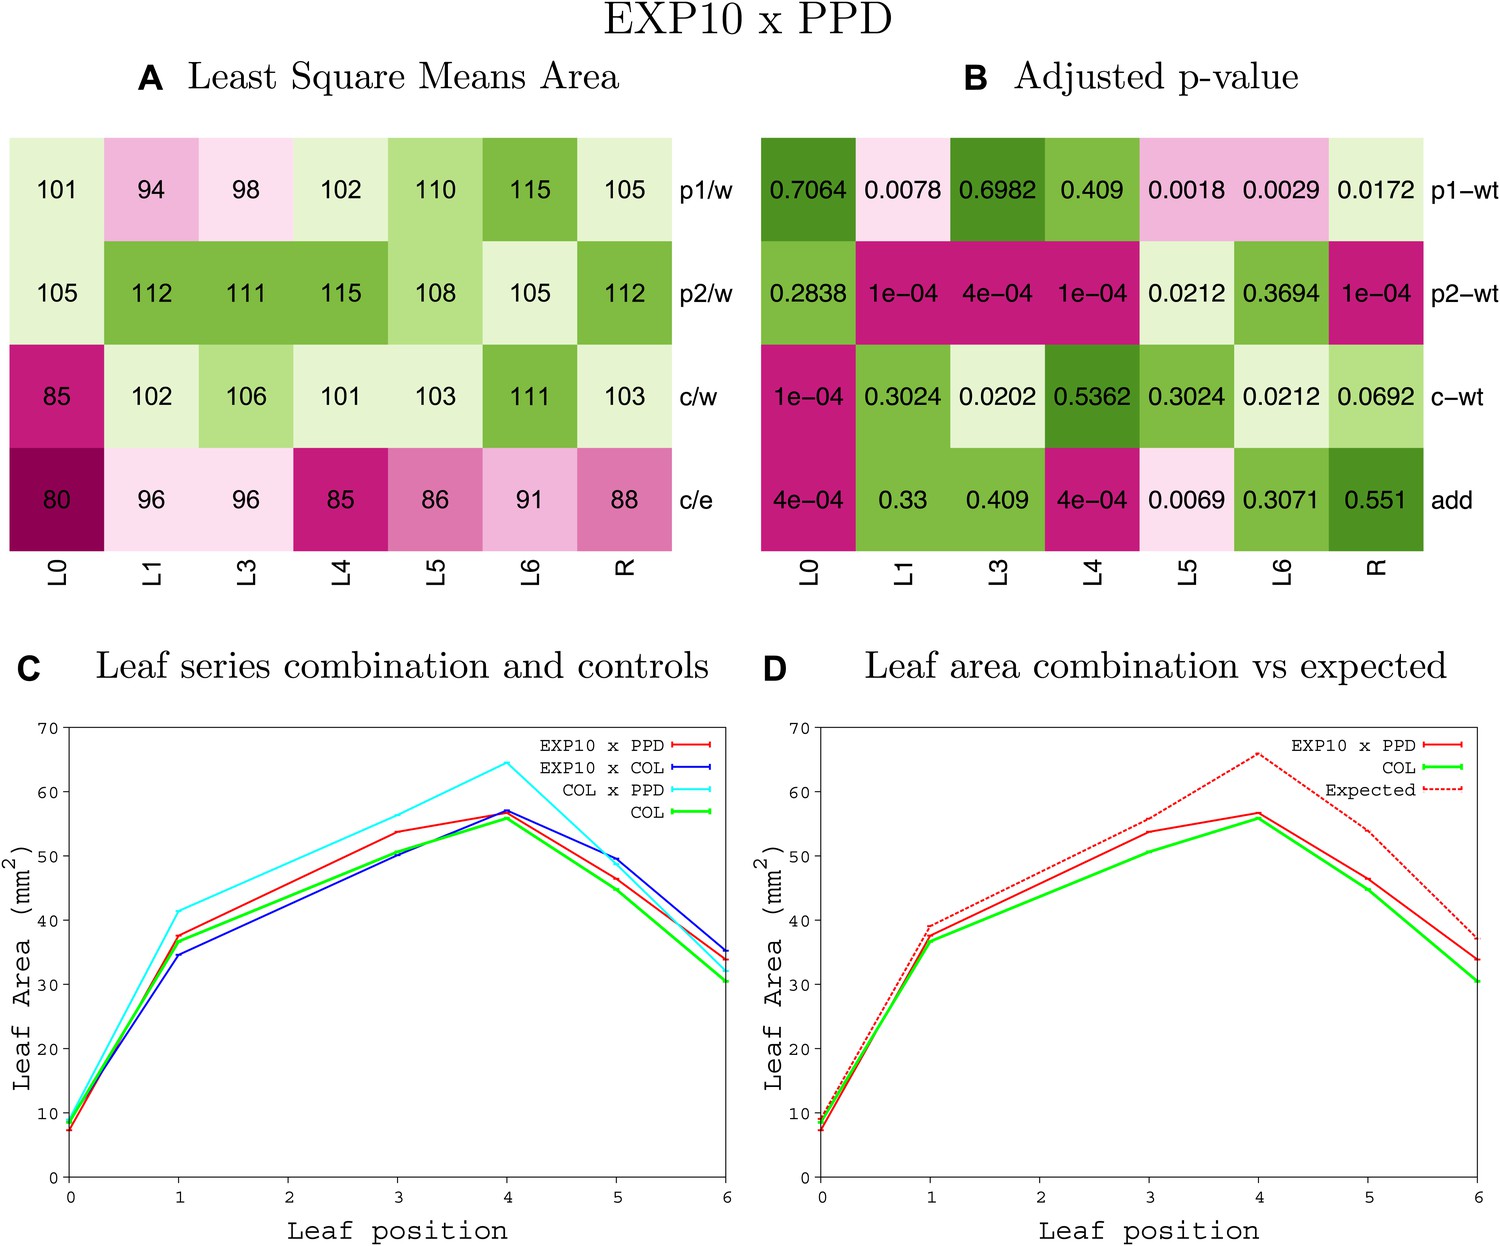
Statistical output of the phenotypic data for the heterozygous combination EXP10OE-ami-ppd.
Top left panel (A): p1/w, p2/w, c/w: percentage of the area to the WT (w) of parent 1 (p1), parent 2 (p2) and the combination (C) respectively. c/e: percentage of the area of the combination (C) to the expected if non-interacting value (EXPni) (e). Top right panel (B), corresponding FDRs for the percentages presented in the top left panel. The cotyledons (L0), first six leaves (L1–L6) and the rosette (R) are represented. Bottom left panel (C): graphs representing leaf areas for the WT (green), the combination (red) and both single lines (dark and light blue) in mm2. Bottom right panel: graph showing the leaf area of the combination (red) and the WT (green) compared to the calculated EXPni (dotted red).
Figure 1—figure supplement 45
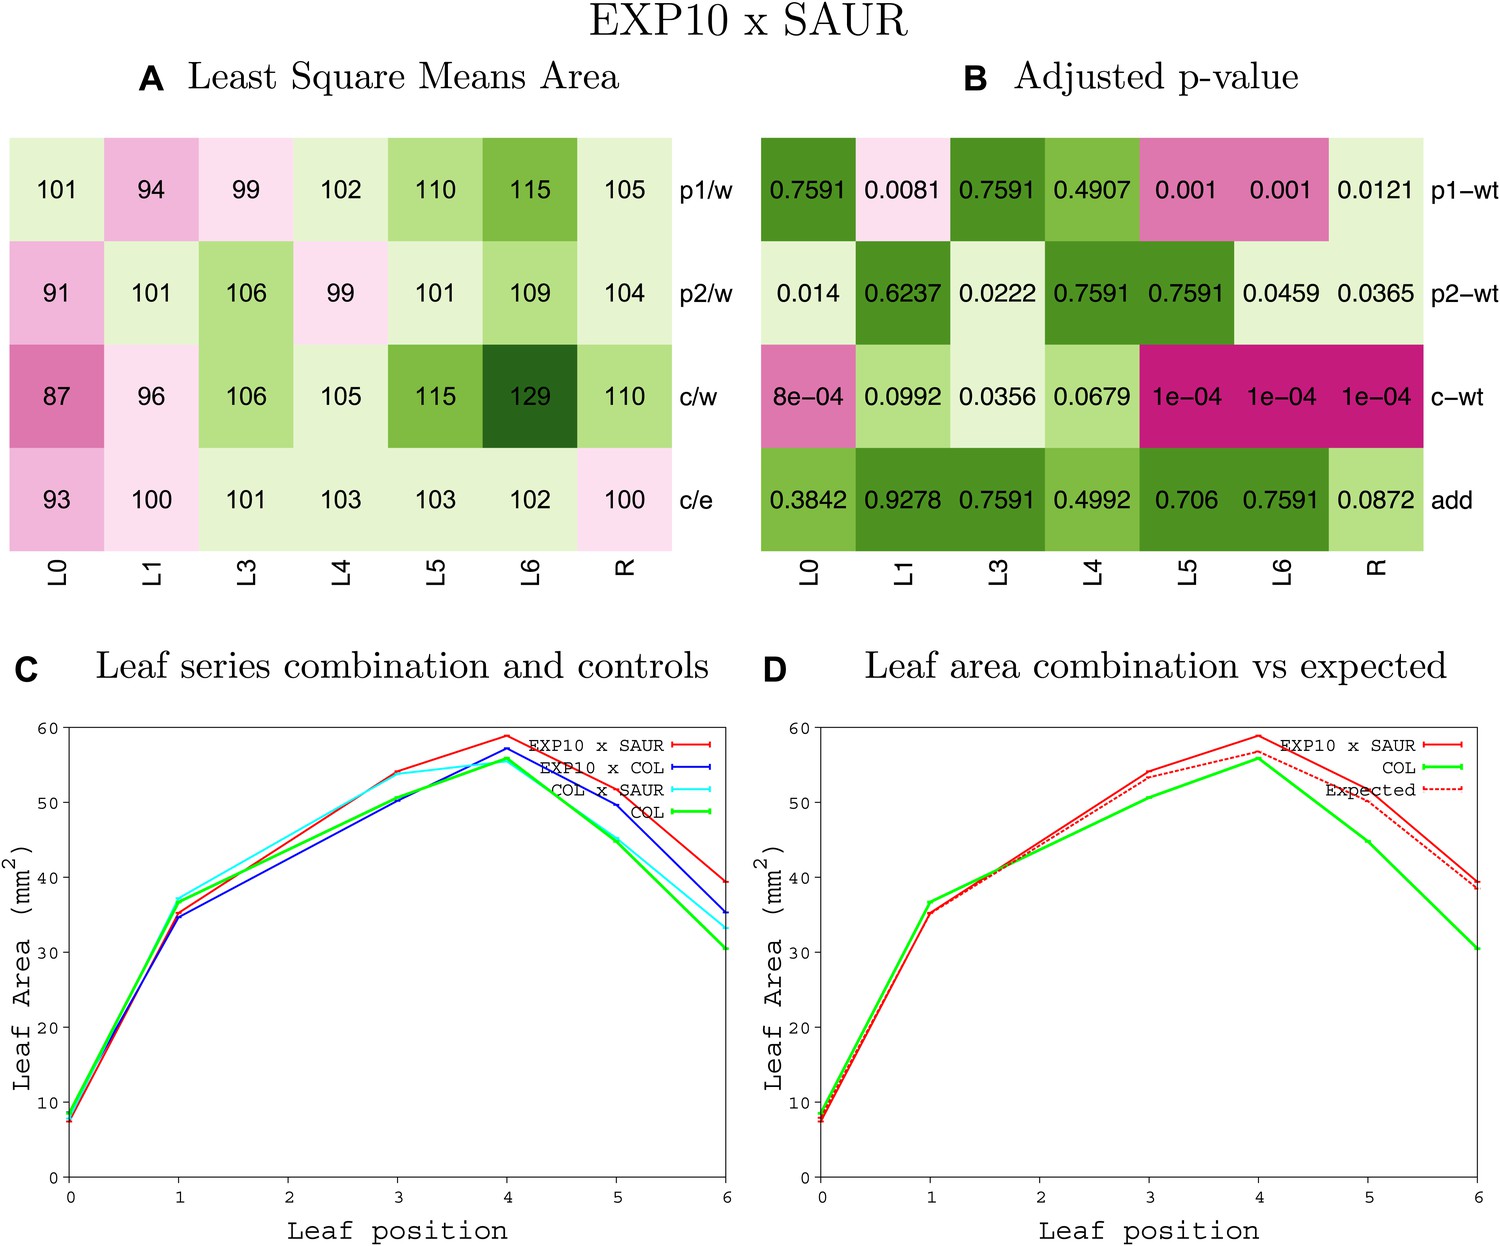
Statistical output of the phenotypic data for the heterozygous combination EXP10OE-SAUR19OE.
Top left panel (A): p1/w, p2/w, c/w: percentage of the area to the WT (w) of parent 1 (p1), parent 2 (p2) and the combination (C) respectively. c/e: percentage of the area of the combination (C) to the expected if non-interacting value (EXPni) (e). Top right panel (B), corresponding FDRs for the percentages presented in the top left panel. The cotyledons (L0), first six leaves (L1–L6) and the rosette (R) are represented. Bottom left panel (C): graphs representing leaf areas for the WT (green), the combination (red) and both single lines (dark and light blue) in mm2. Bottom right panel: graph showing the leaf area of the combination (red) and the WT (green) compared to the calculated EXPni (dotted red).
Figure 1—figure supplement 46
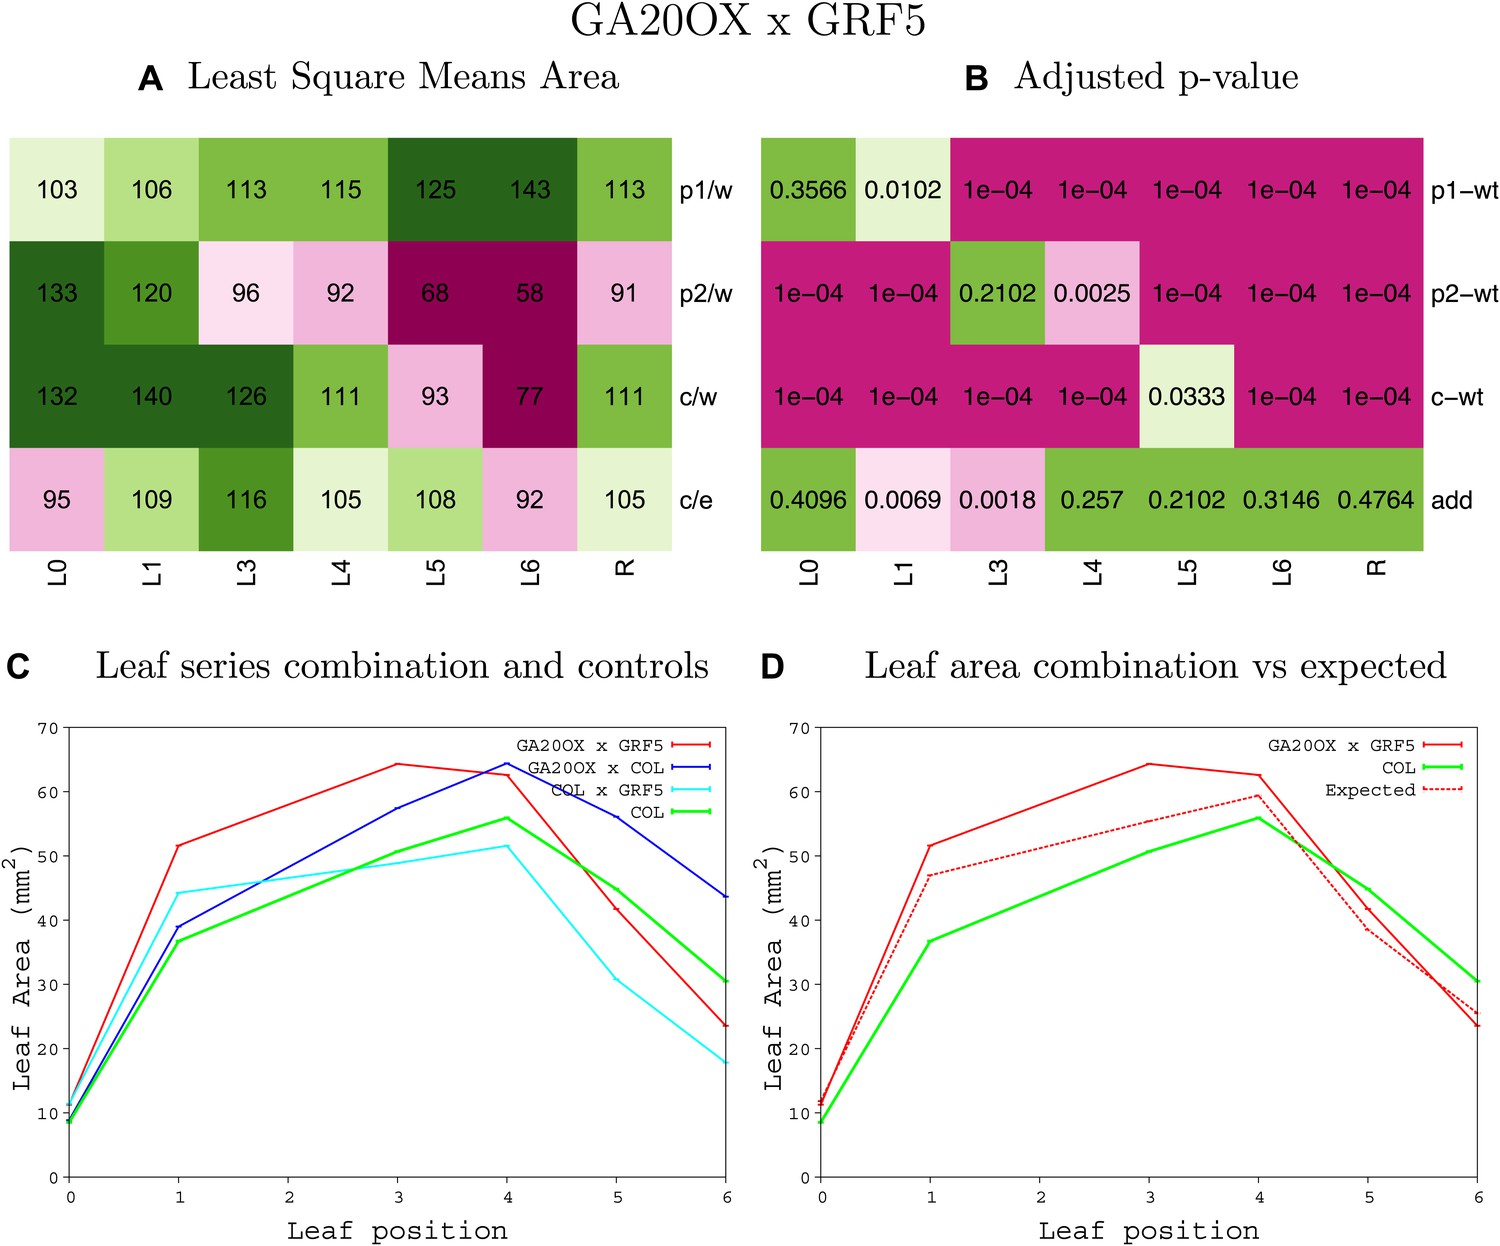
Statistical output of the phenotypic data for the heterozygous combination GA20OX1OE-GRF5OE.
Top left panel (A): p1/w, p2/w, c/w: percentage of the area to the WT (w) of parent 1 (p1), parent 2 (p2) and the combination (C) respectively. c/e: percentage of the area of the combination (C) to the expected if non-interacting value (EXPni) (e). Top right panel (B), corresponding FDRs for the percentages presented in the top left panel. The cotyledons (L0), first six leaves (L1–L6) and the rosette (R) are represented. Bottom left panel (C): graphs representing leaf areas for the WT (green), the combination (red) and both single lines (dark and light blue) in mm2. Bottom right panel: graph showing the leaf area of the combination (red) and the WT (green) compared to the calculated EXPni (dotted red).
Figure 1—figure supplement 47
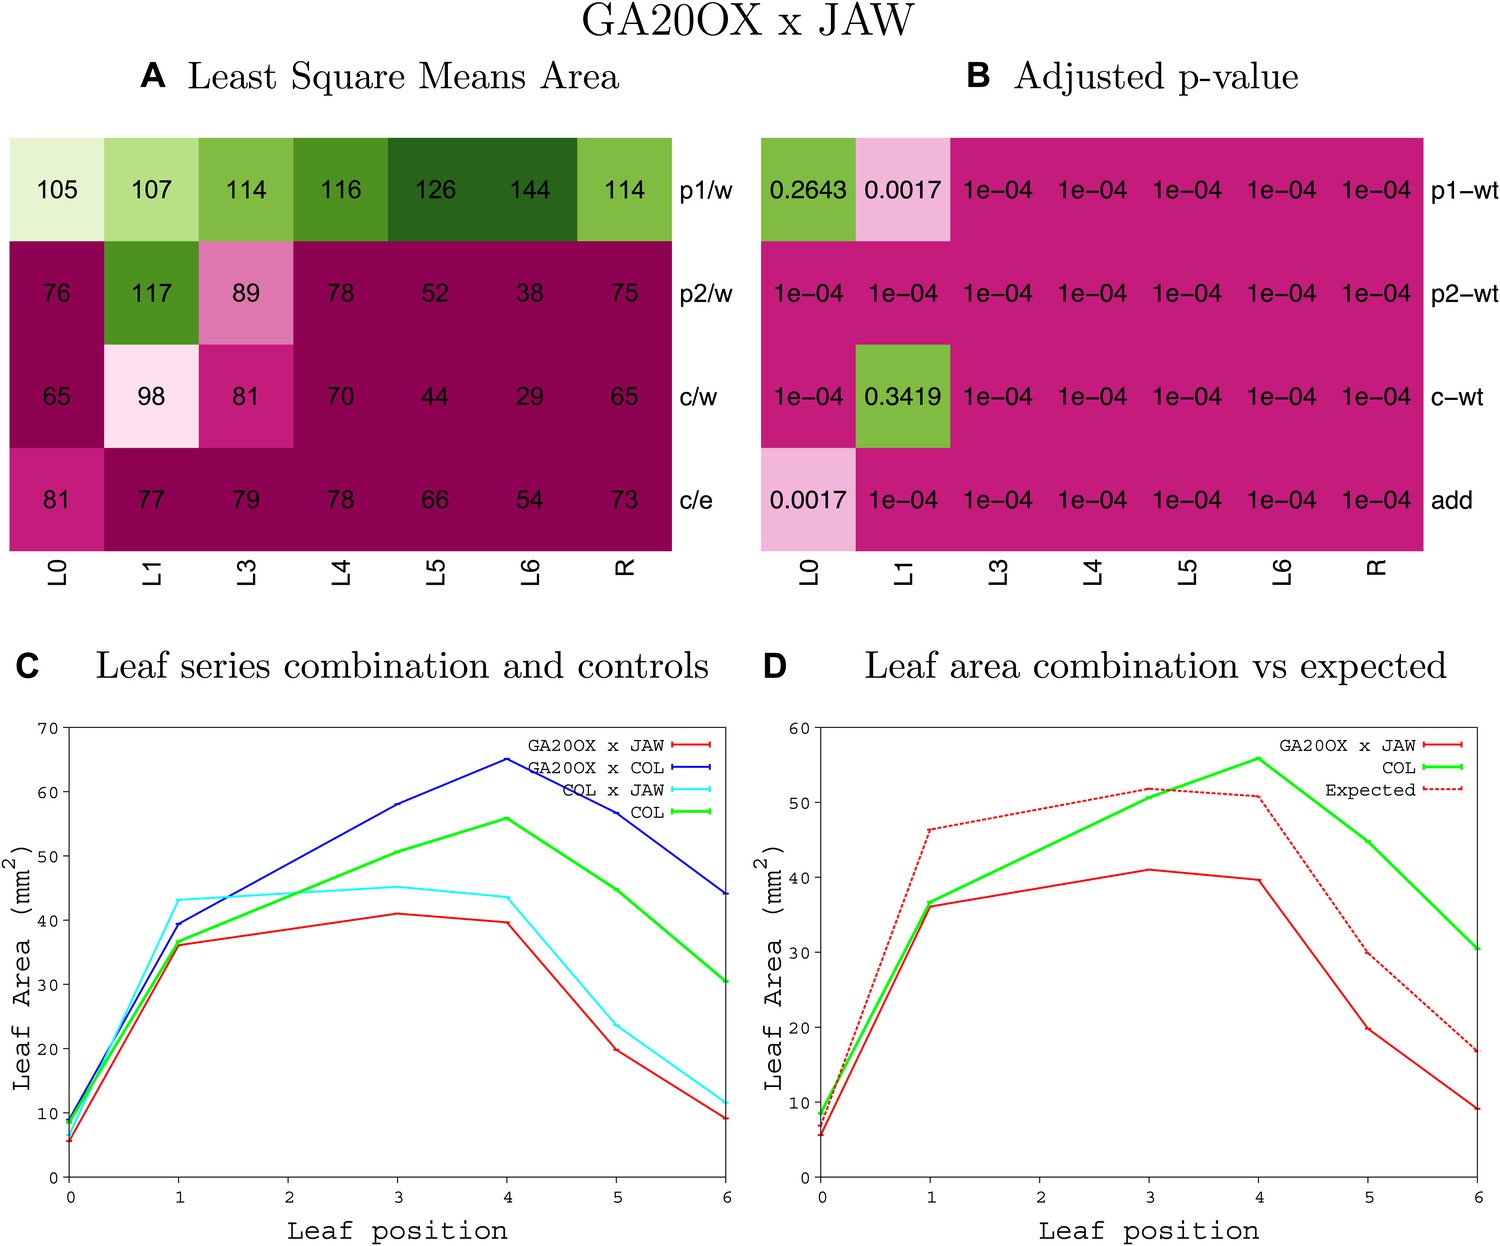
Statistical output of the phenotypic data for the heterozygous combination GA20OX1OE-jaw-D.
Top left panel (A): p1/w, p2/w, c/w: percentage of the area to the WT (w) of parent 1 (p1), parent 2 (p2) and the combination (C) respectively. c/e: percentage of the area of the combination (C) to the expected if non-interacting value (EXPni) (e). Top right panel (B), corresponding FDRs for the percentages presented in the top left panel. The cotyledons (L0), first six leaves (L1–L6) and the rosette (R) are represented. Bottom left panel (C): graphs representing leaf areas for the WT (green), the combination (red) and both single lines (dark and light blue) in mm2. Bottom right panel: graph showing the leaf area of the combination (red) and the WT (green) compared to the calculated EXPni (dotted red).
Figure 1—figure supplement 48
Statistical output of the phenotypic data for the heterozygous combination GA20OX1OE-ami-ppd.
Top left panel (A): p1/w, p2/w, c/w: percentage of the area to the WT (w) of parent 1 (p1), parent 2 (p2) and the combination (C) respectively. c/e: percentage of the area of the combination (C) to the expected if non-interacting value (EXPni) (e). Top right panel (B), corresponding FDRs for the percentages presented in the top left panel. The cotyledons (L0), first six leaves (L1–L6) and the rosette (R) are represented. Bottom left panel (C): graphs representing leaf areas for the WT (green), the combination (red) and both single lines (dark and light blue) in mm2. Bottom right panel: graph showing the leaf area of the combination (red) and the WT (green) compared to the calculated EXPni (dotted red).
Figure 1—figure supplement 49
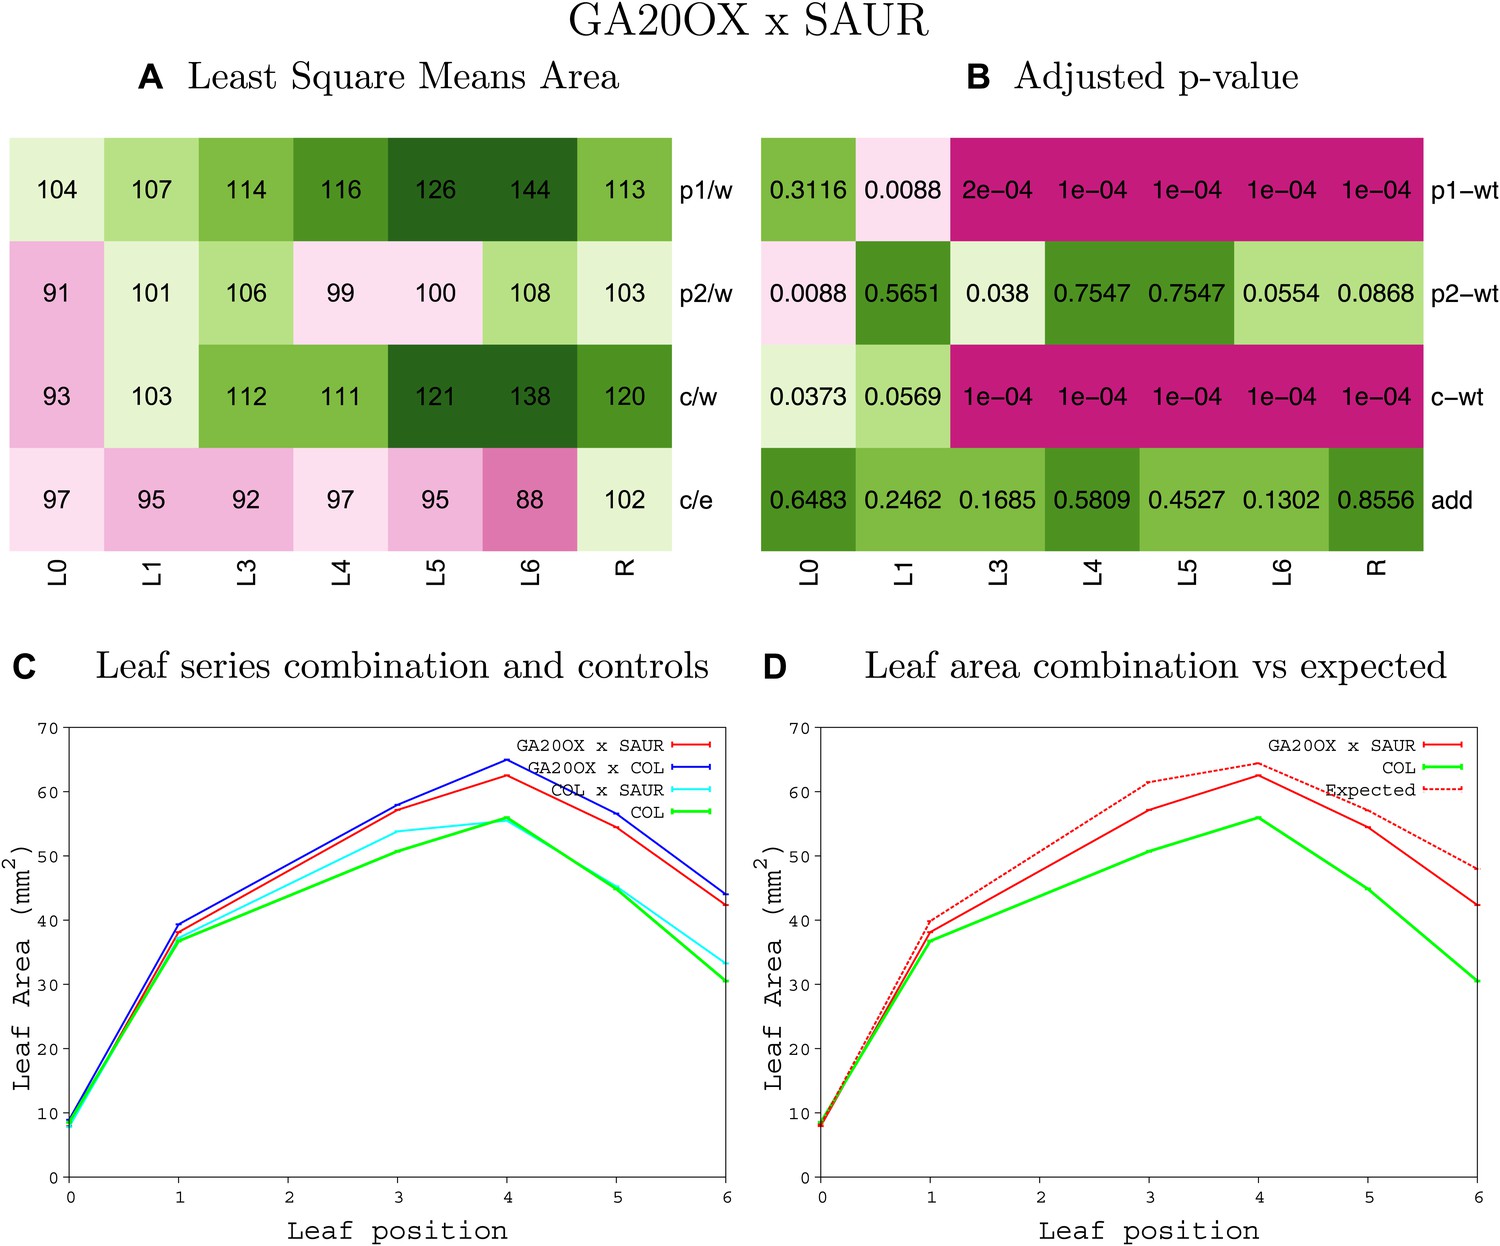
Statistical output of the phenotypic data for the heterozygous combination GA20OX1OE-SAUR19OE.
Top left panel (A): p1/w, p2/w, c/w: percentage of the area to the WT (w) of parent 1 (p1), parent 2 (p2) and the combination (C) respectively. c/e: percentage of the area of the combination (C) to the expected if non-interacting value (EXPni) (e). Top right panel (B), corresponding FDRs for the percentages presented in the top left panel. The cotyledons (L0), first six leaves (L1–L6) and the rosette (R) are represented. Bottom left panel (C): graphs representing leaf areas for the WT (green), the combination (red) and both single lines (dark and light blue) in mm2. Bottom right panel: graph showing the leaf area of the combination (red) and the WT (green) compared to the calculated EXPni (dotted red).
Figure 1—figure supplement 50
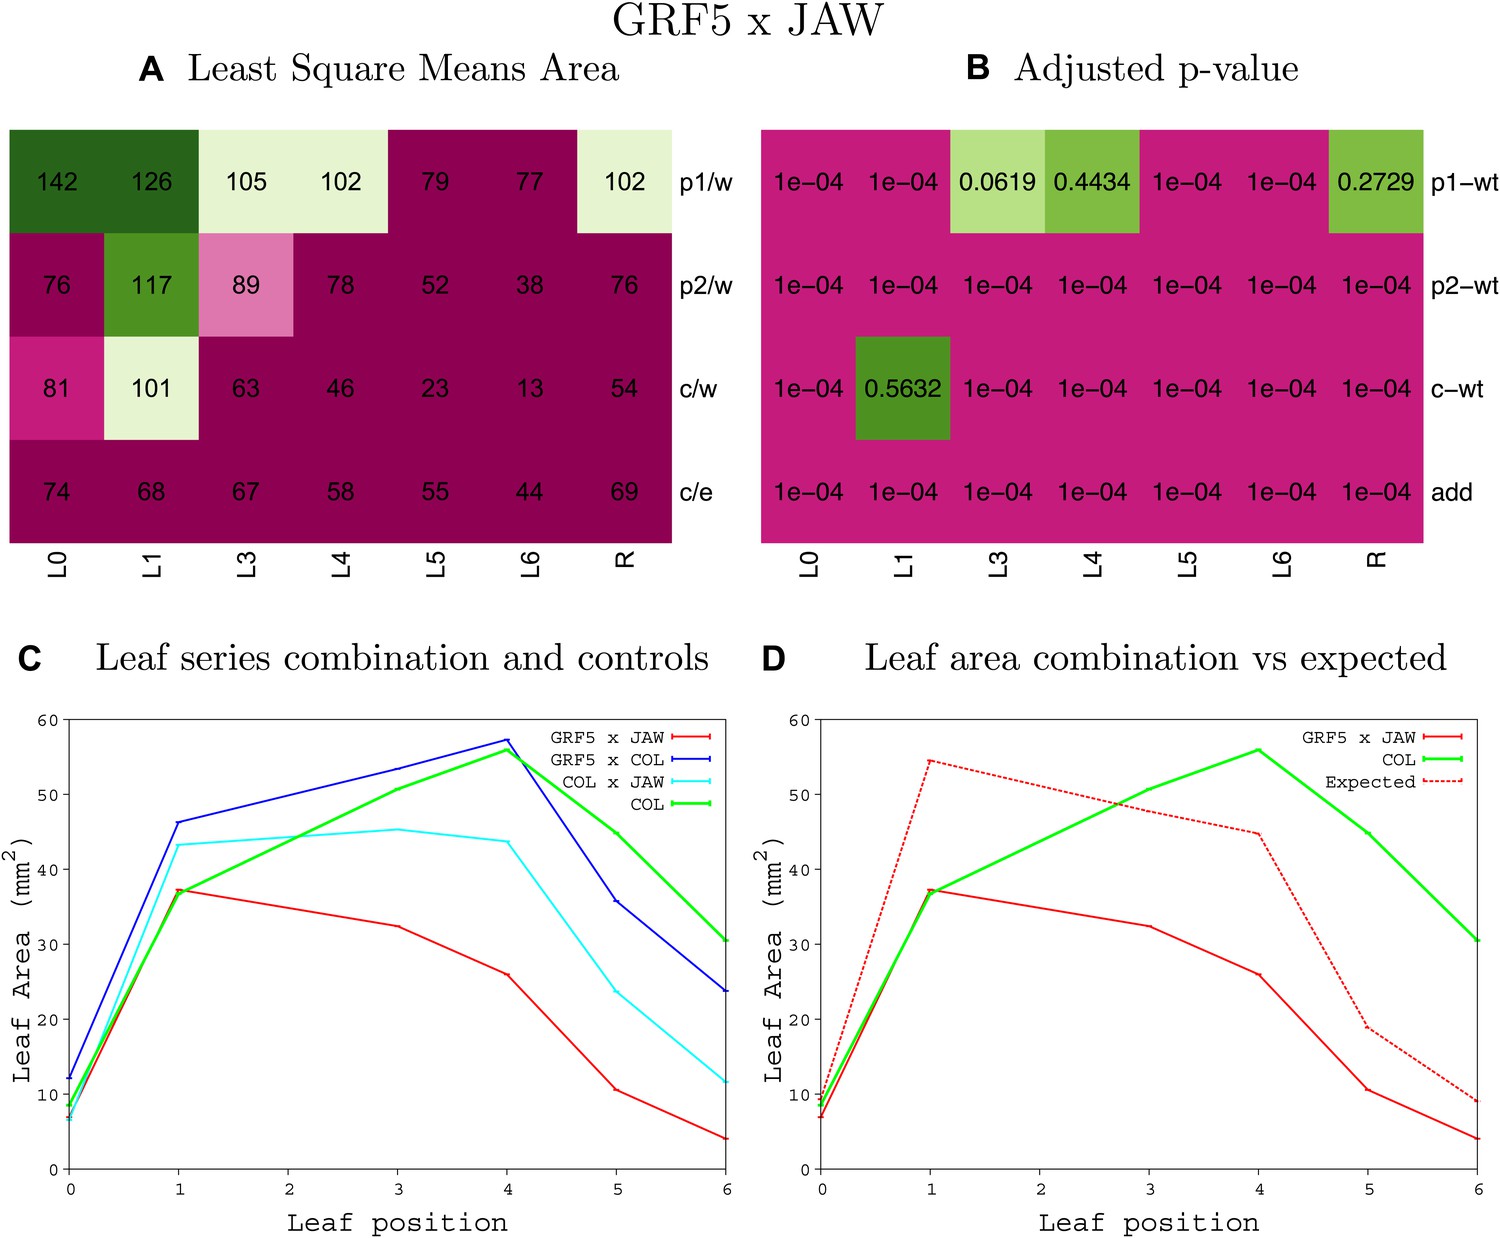
Statistical output of the phenotypic data for the heterozygous combination GRF5OE-jaw-D.
Top left panel (A): p1/w, p2/w, c/w: percentage of the area to the WT (w) of parent 1 (p1), parent 2 (p2) and the combination (C) respectively. c/e: percentage of the area of the combination (C) to the expected if non-interacting value (EXPni) (e). Top right panel (B), corresponding FDRs for the percentages presented in the top left panel. The cotyledons (L0), first six leaves (L1–L6) and the rosette (R) are represented. Bottom left panel (C): graphs representing leaf areas for the WT (green), the combination (red) and both single lines (dark and light blue) in mm2. Bottom right panel: graph showing the leaf area of the combination (red) and the WT (green) compared to the calculated EXPni (dotted red).
Figure 1—figure supplement 51
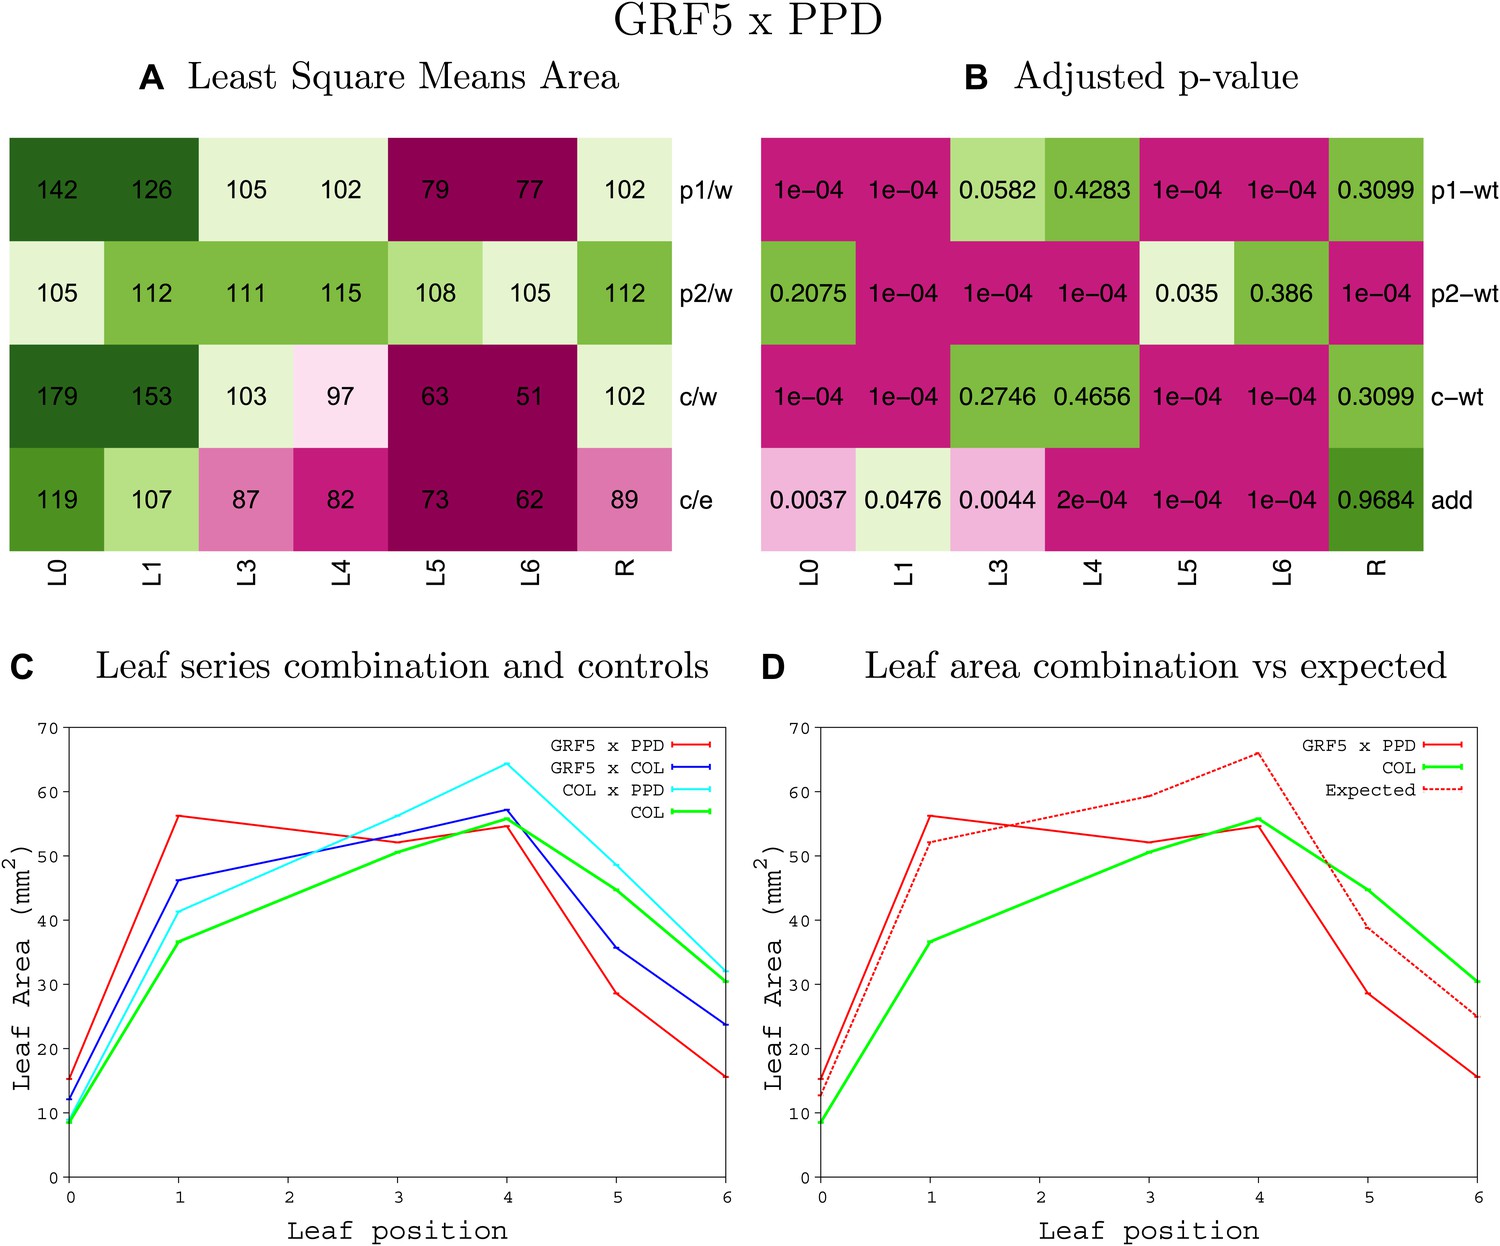
Statistical output of the phenotypic data for the heterozygous combination GRF5OE-ami-ppd.
Top left panel (A): p1/w, p2/w, c/w: percentage of the area to the WT (w) of parent 1 (p1), parent 2 (p2) and the combination (C) respectively. c/e: percentage of the area of the combination (C) to the expected if non-interacting value (EXPni) (e). Top right panel (B), corresponding FDRs for the percentages presented in the top left panel. The cotyledons (L0), first six leaves (L1–L6) and the rosette (R) are represented. Bottom left panel (C): graphs representing leaf areas for the WT (green), the combination (red) and both single lines (dark and light blue) in mm2. Bottom right panel: graph showing the leaf area of the combination (red) and the WT (green) compared to the calculated EXPni (dotted red).
Figure 1—figure supplement 52
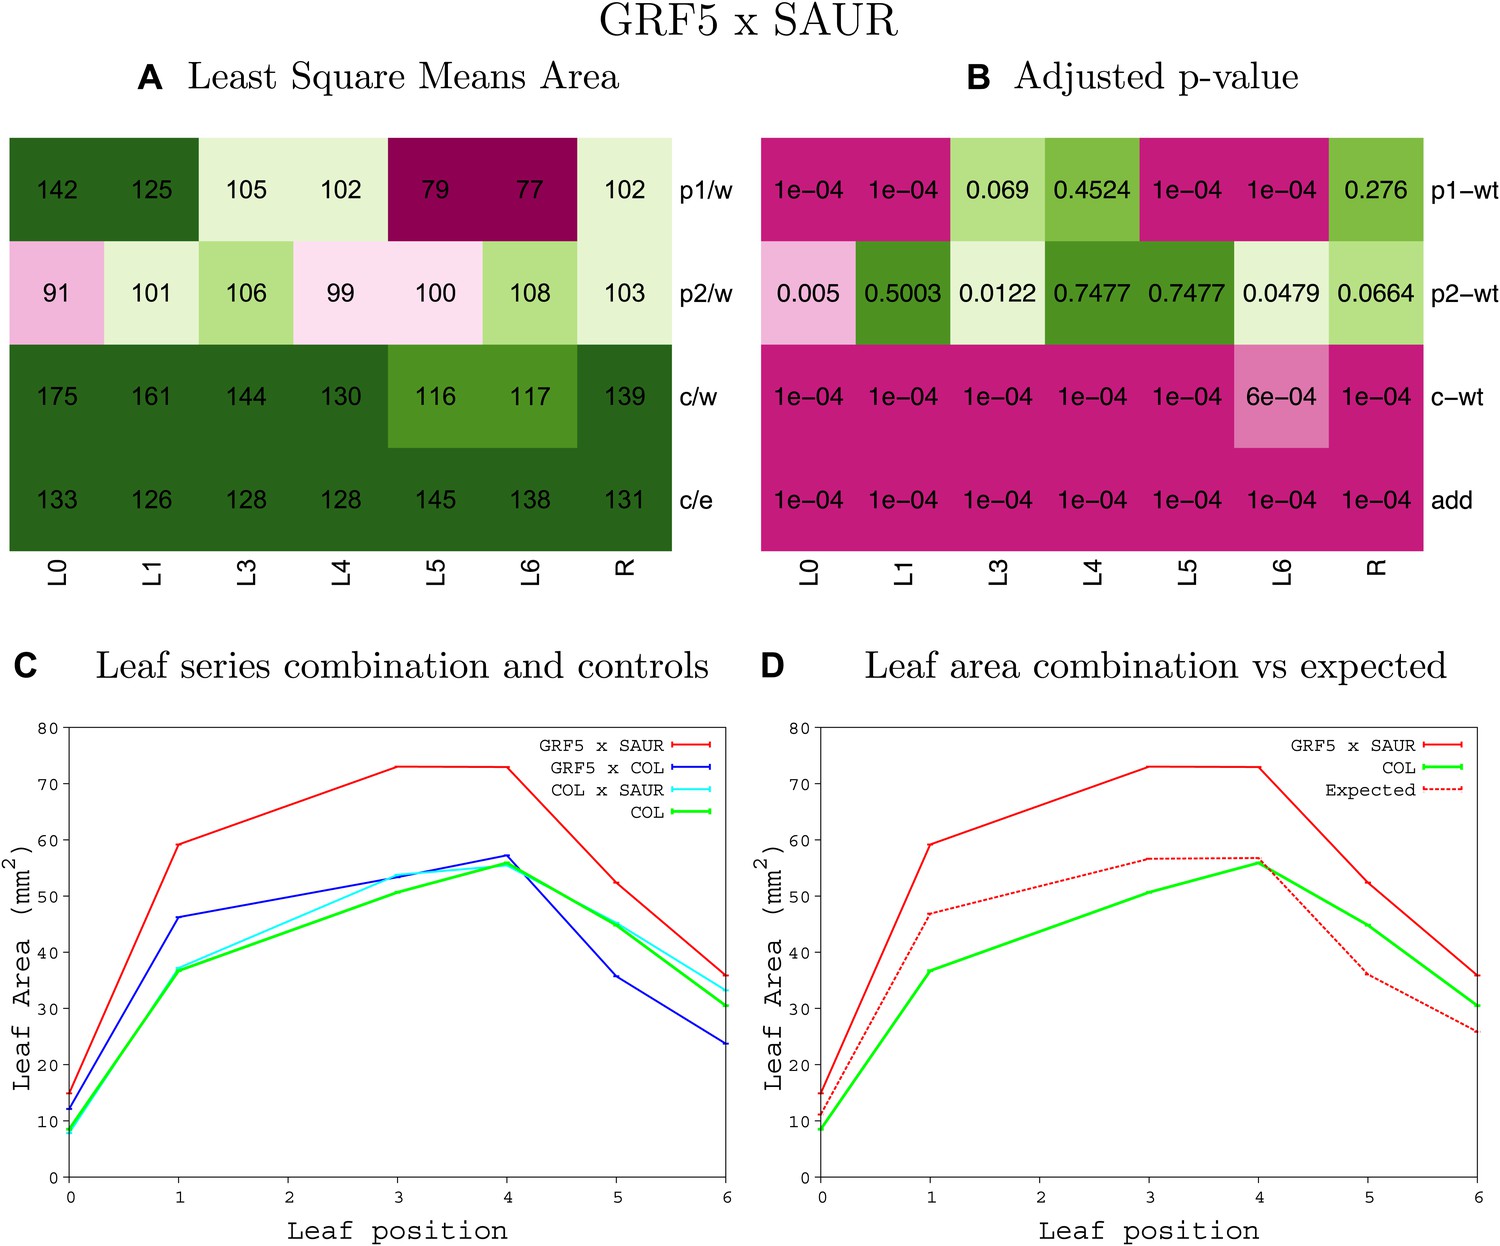
Statistical output of the phenotypic data for the heterozygous combination GRF5OE-SAUR19OE.
Top left panel (A): p1/w, p2/w, c/w: percentage of the area to the WT (w) of parent 1 (p1), parent 2 (p2) and the combination (C) respectively. c/e: percentage of the area of the combination (C) to the expected if non-interacting value (EXPni) (e). Top right panel (B), corresponding FDRs for the percentages presented in the top left panel. The cotyledons (L0), first six leaves (L1–L6) and the rosette (R) are represented. Bottom left panel (C): graphs representing leaf areas for the WT (green), the combination (red) and both single lines (dark and light blue) in mm2. Bottom right panel: graph showing the leaf area of the combination (red) and the WT (green) compared to the calculated EXPni (dotted red).
Figure 1—figure supplement 53
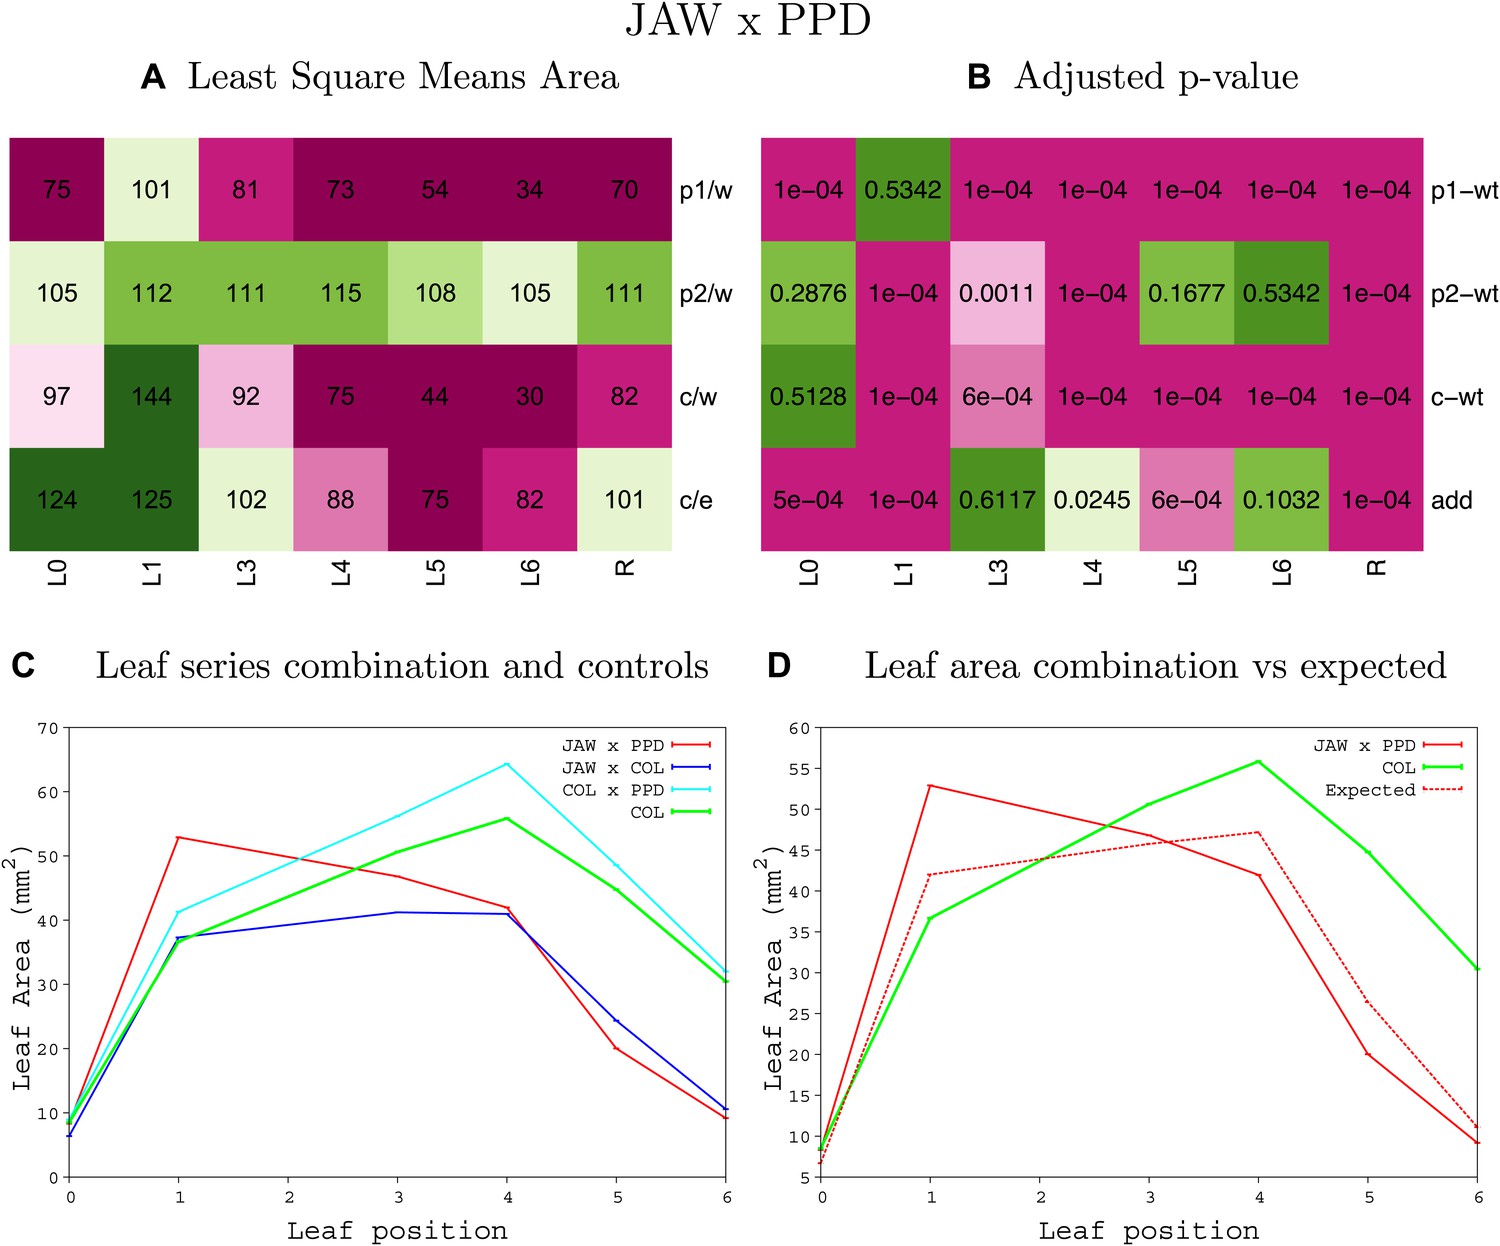
Statistical output of the phenotypic data for the heterozygous combination jaw-D-ami-ppd.
Top left panel (A): p1/w, p2/w, c/w: percentage of the area to the WT (w) of parent 1 (p1), parent 2 (p2) and the combination (C) respectively. c/e: percentage of the area of the combination (C) to the expected if non-interacting value (EXPni) (e). Top right panel (B), corresponding FDRs for the percentages presented in the top left panel. The cotyledons (L0), first six leaves (L1–L6) and the rosette (R) are represented. Bottom left panel (C): graphs representing leaf areas for the WT (green), the combination (red) and both single lines (dark and light blue) in mm2. Bottom right panel: graph showing the leaf area of the combination (red) and the WT (green) compared to the calculated EXPni (dotted red).
Figure 1—figure supplement 54
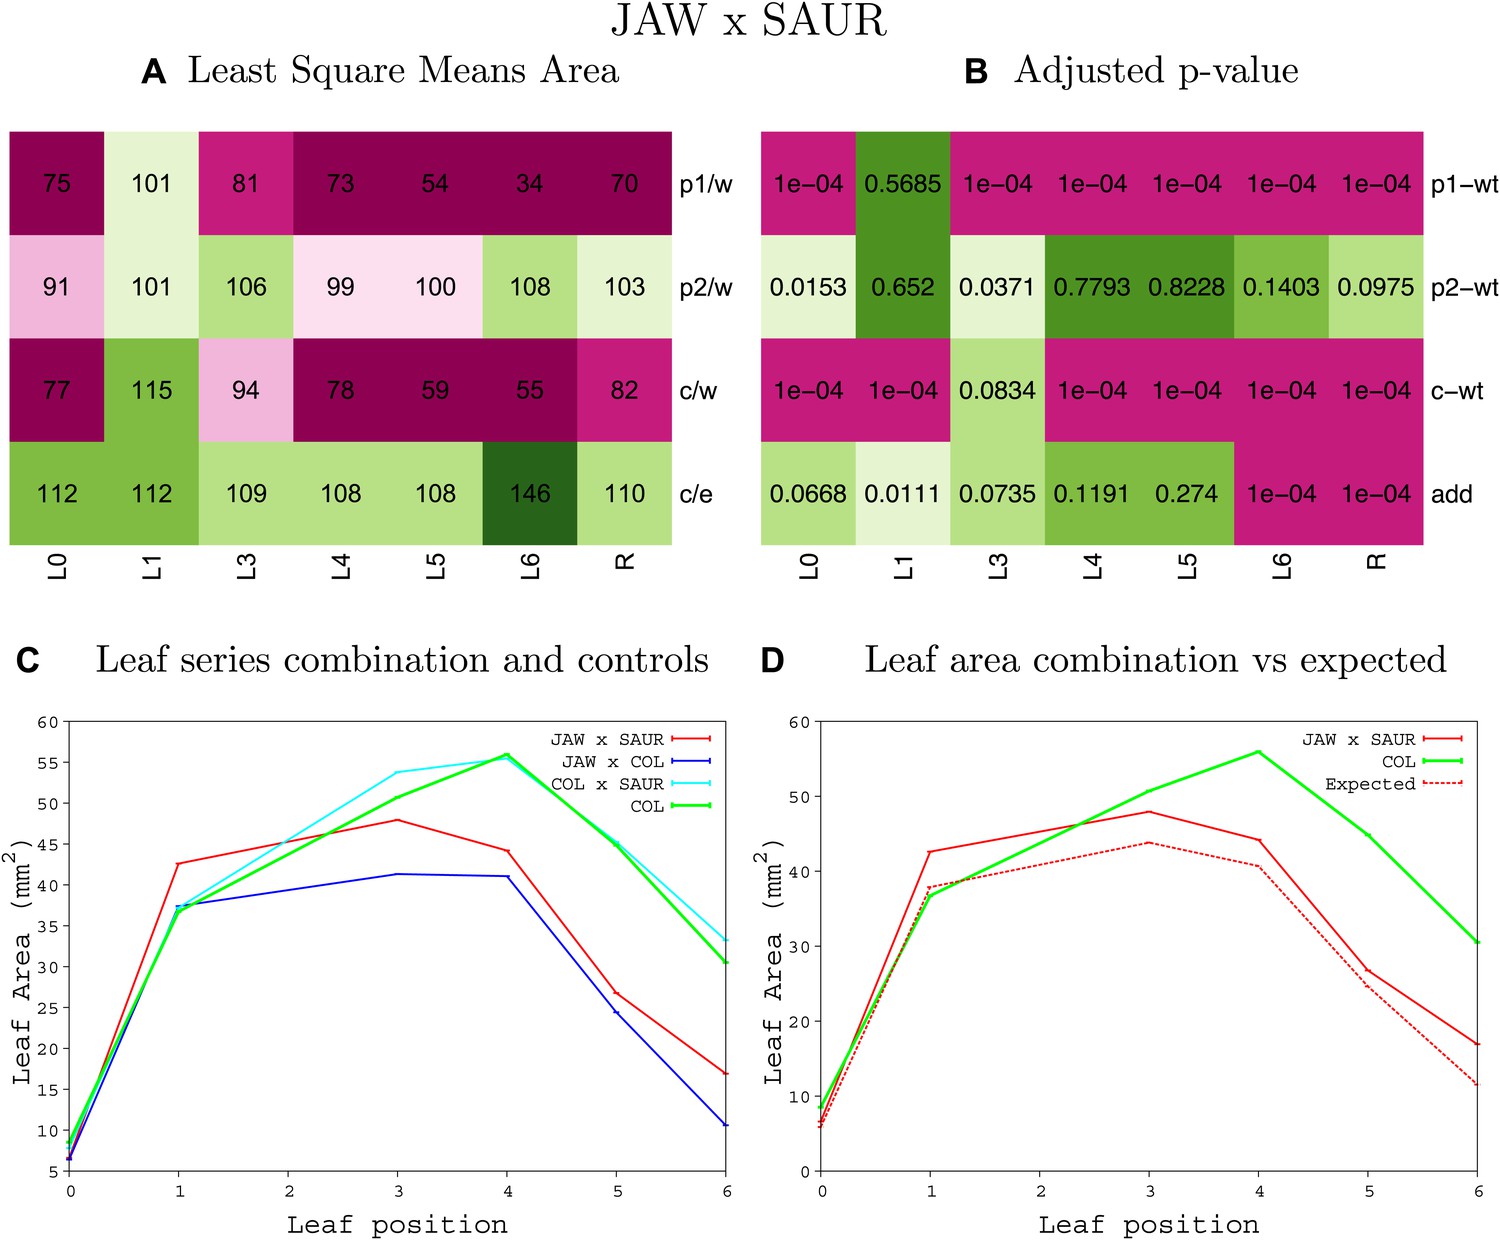
Statistical output of the phenotypic data for the heterozygous combination jaw-D -SAUR19OE.
Top left panel (A): p1/w, p2/w, c/w: percentage of the area to the WT (w) of parent 1 (p1), parent 2 (p2) and the combination (C) respectively. c/e: percentage of the area of the combination (C) to the expected if non-interacting value (EXPni) (e). Top right panel (B), corresponding FDRs for the percentages presented in the top left panel. The cotyledons (L0), first six leaves (L1–L6) and the rosette (R) are represented. Bottom left panel (C): graphs representing leaf areas for the WT (green), the combination (red) and both single lines (dark and light blue) in mm2. Bottom right panel: graph showing the leaf area of the combination (red) and the WT (green) compared to the calculated EXPni (dotted red).
Figure 1—figure supplement 55
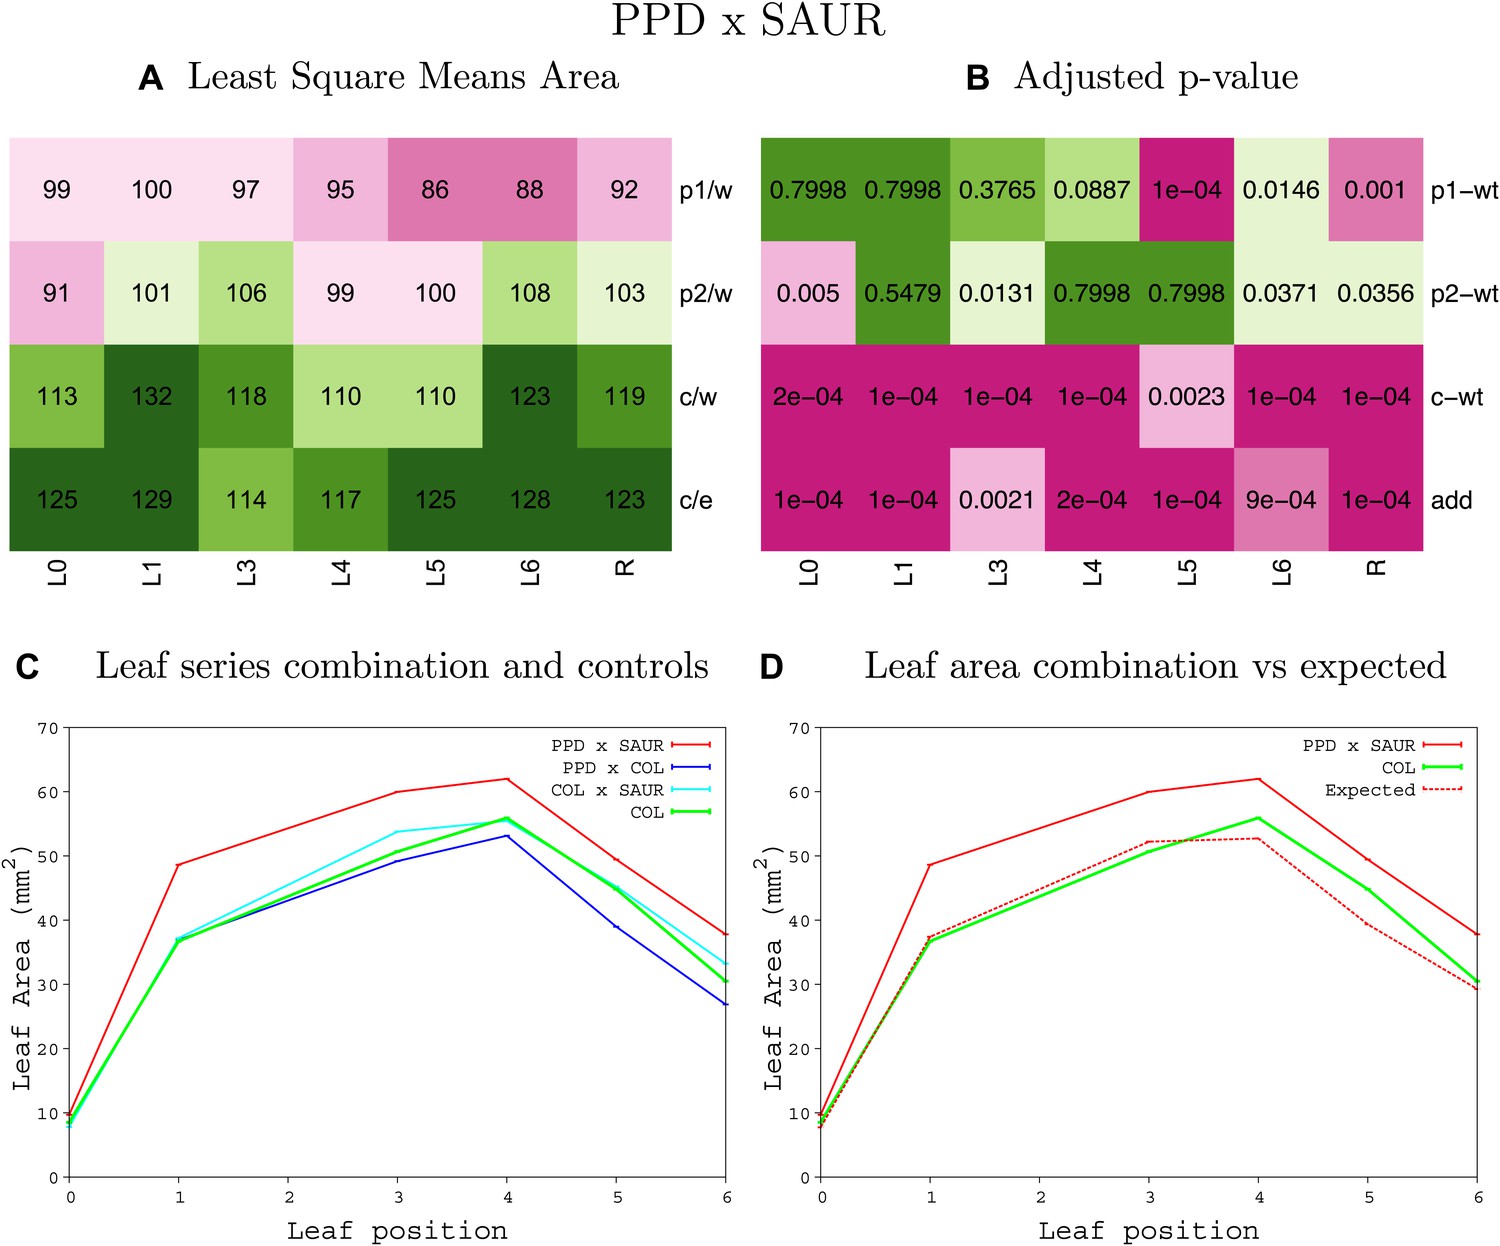
Statistical output of the phenotypic data for the heterozygous combination ami-ppd -SAUR19OE.
Top left panel (A): p1/w, p2/w, c/w: percentage of the area to the WT (w) of parent 1 (p1), parent 2 (p2) and the combination (C) respectively. c/e: percentage of the area of the combination (C) to the expected if non-interacting value (EXPni) (e). Top right panel (B), corresponding FDRs for the percentages presented in the top left panel. The cotyledons (L0), first six leaves (L1–L6) and the rosette (R) are represented. Bottom left panel (C): graphs representing leaf areas for the WT (green), the combination (red) and both single lines (dark and light blue) in mm2. Bottom right panel: graph showing the leaf area of the combination (red) and the WT (green) compared to the calculated EXPni (dotted red).
Figure 1—figure supplement 56
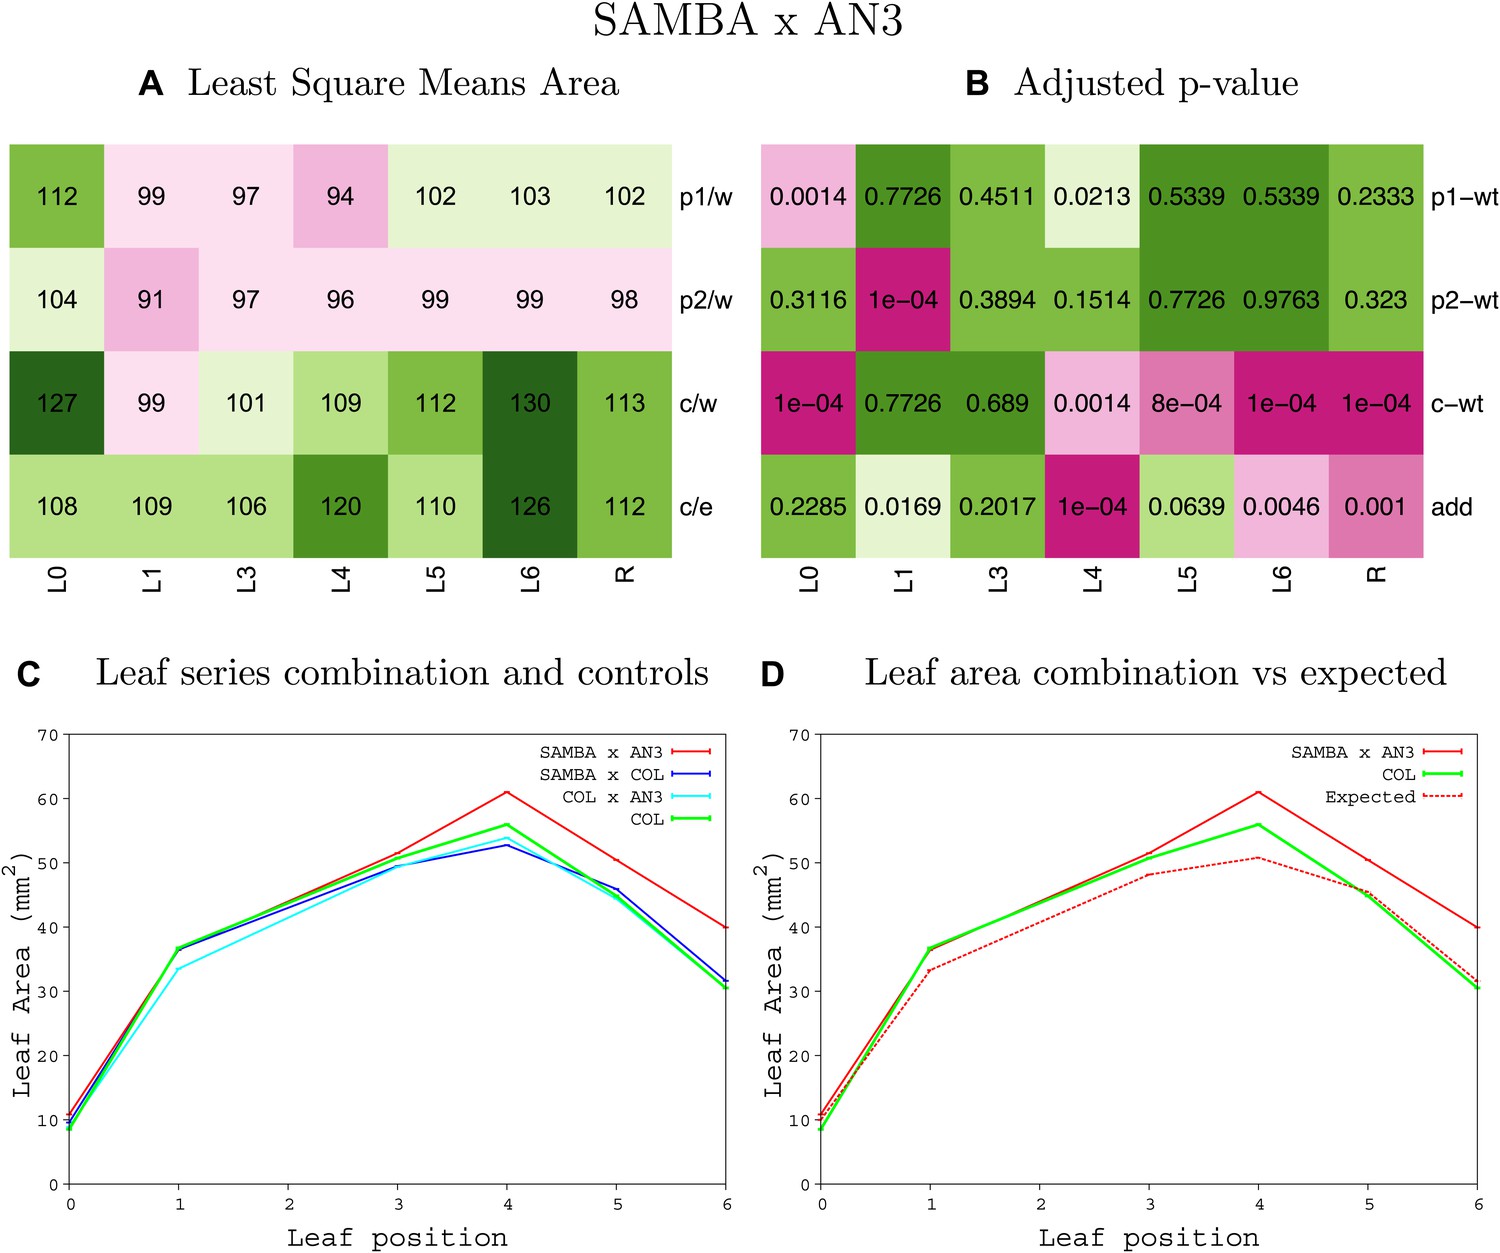
Statistical output of the phenotypic data for the heterozygous combination samba–AN3OE.
Top left panel (A): p1/w, p2/w, c/w: percentage of the area to the WT (w) of parent 1 (p1), parent 2 (p2) and the combination (C) respectively. c/e: percentage of the area of the combination (C) to the expected if non-interacting value (EXPni) (e). Top right panel (B), corresponding FDRs for the percentages presented in the top left panel. The cotyledons (L0), first six leaves (L1–L6) and the rosette (R) are represented. Bottom left panel (C): graphs representing leaf areas for the WT (green), the combination (red) and both single lines (dark and light blue) in mm2. Bottom right panel: graph showing the leaf area of the combination (red) and the WT (green) compared to the calculated EXPni (dotted red).
Figure 1—figure supplement 57
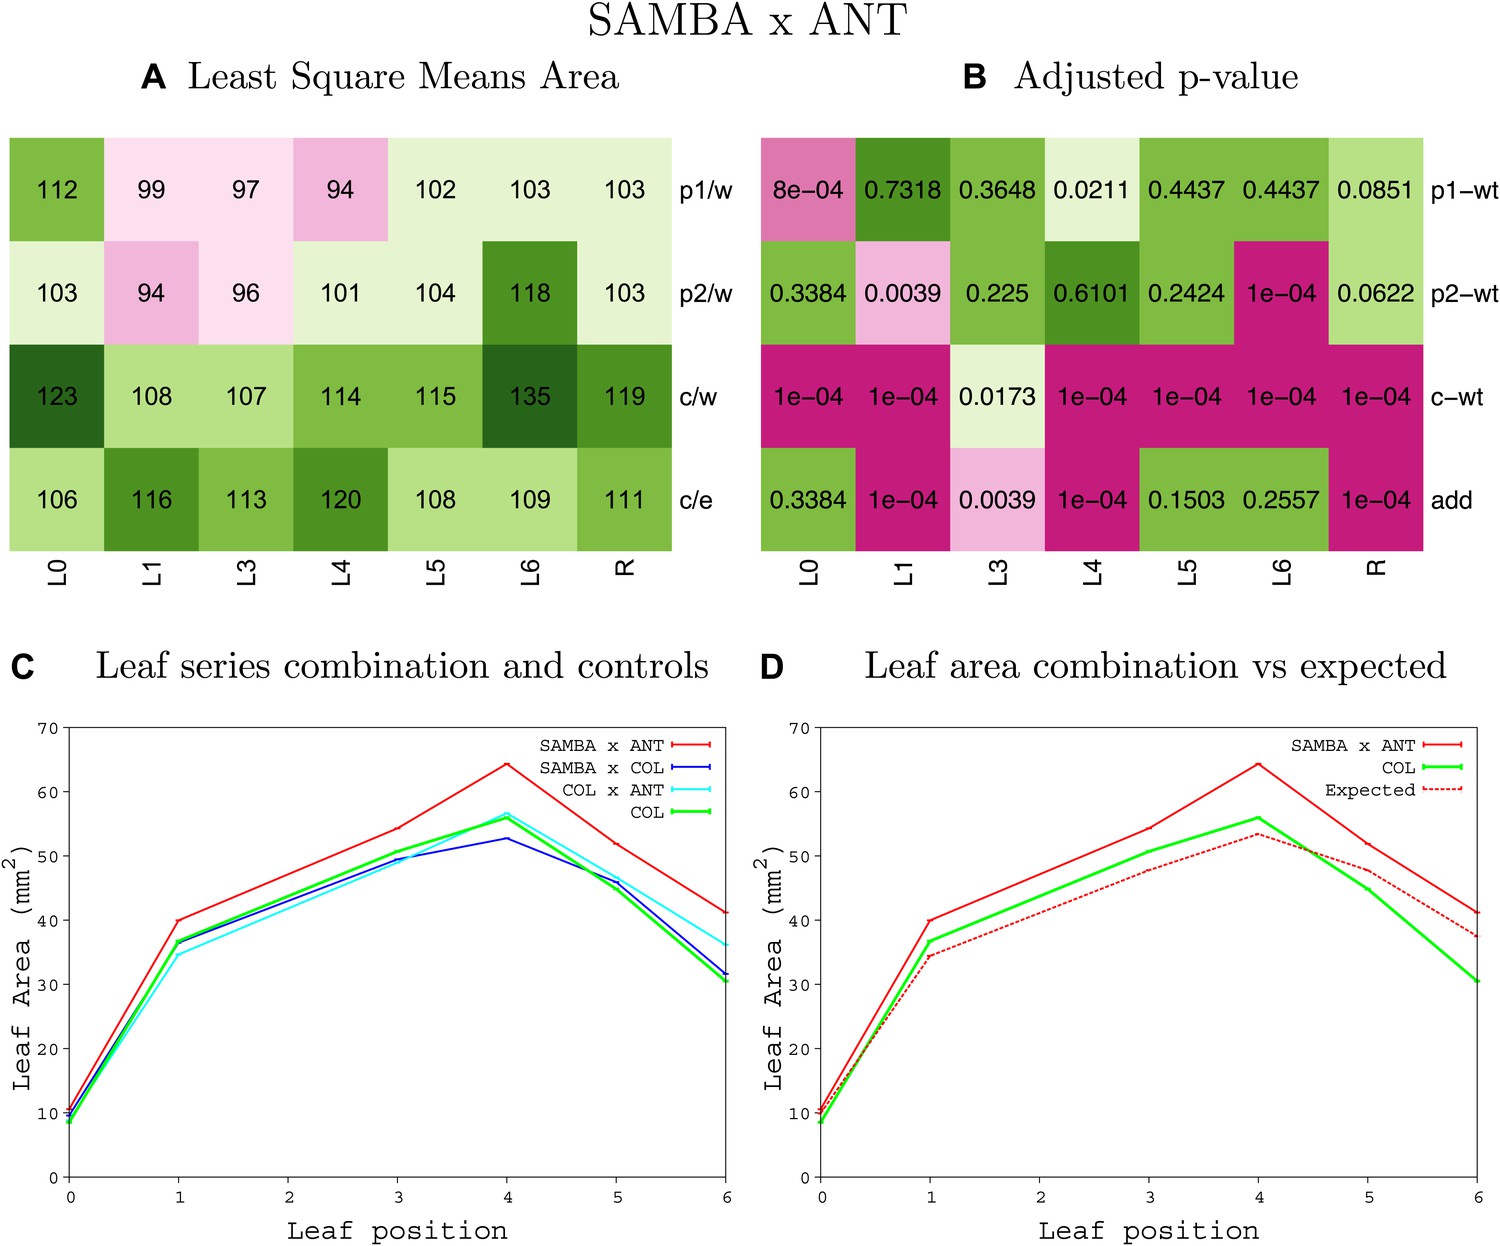
Statistical output of the phenotypic data for the heterozygous combination samba -ANTOE.
Top left panel (A): p1/w, p2/w, c/w: percentage of the area to the WT (w) of parent 1 (p1), parent 2 (p2) and the combination (C) respectively. c/e: percentage of the area of the combination (C) to the expected if non-interacting value (EXPni) (e). Top right panel (B), corresponding FDRs for the percentages presented in the top left panel. The cotyledons (L0), first six leaves (L1–L6) and the rosette (R) are represented. Bottom left panel (C): graphs representing leaf areas for the WT (green), the combination (red) and both single lines (dark and light blue) in mm2. Bottom right panel: graph showing the leaf area of the combination (red) and the WT (green) compared to the calculated EXPni (dotted red).
Figure 1—figure supplement 58
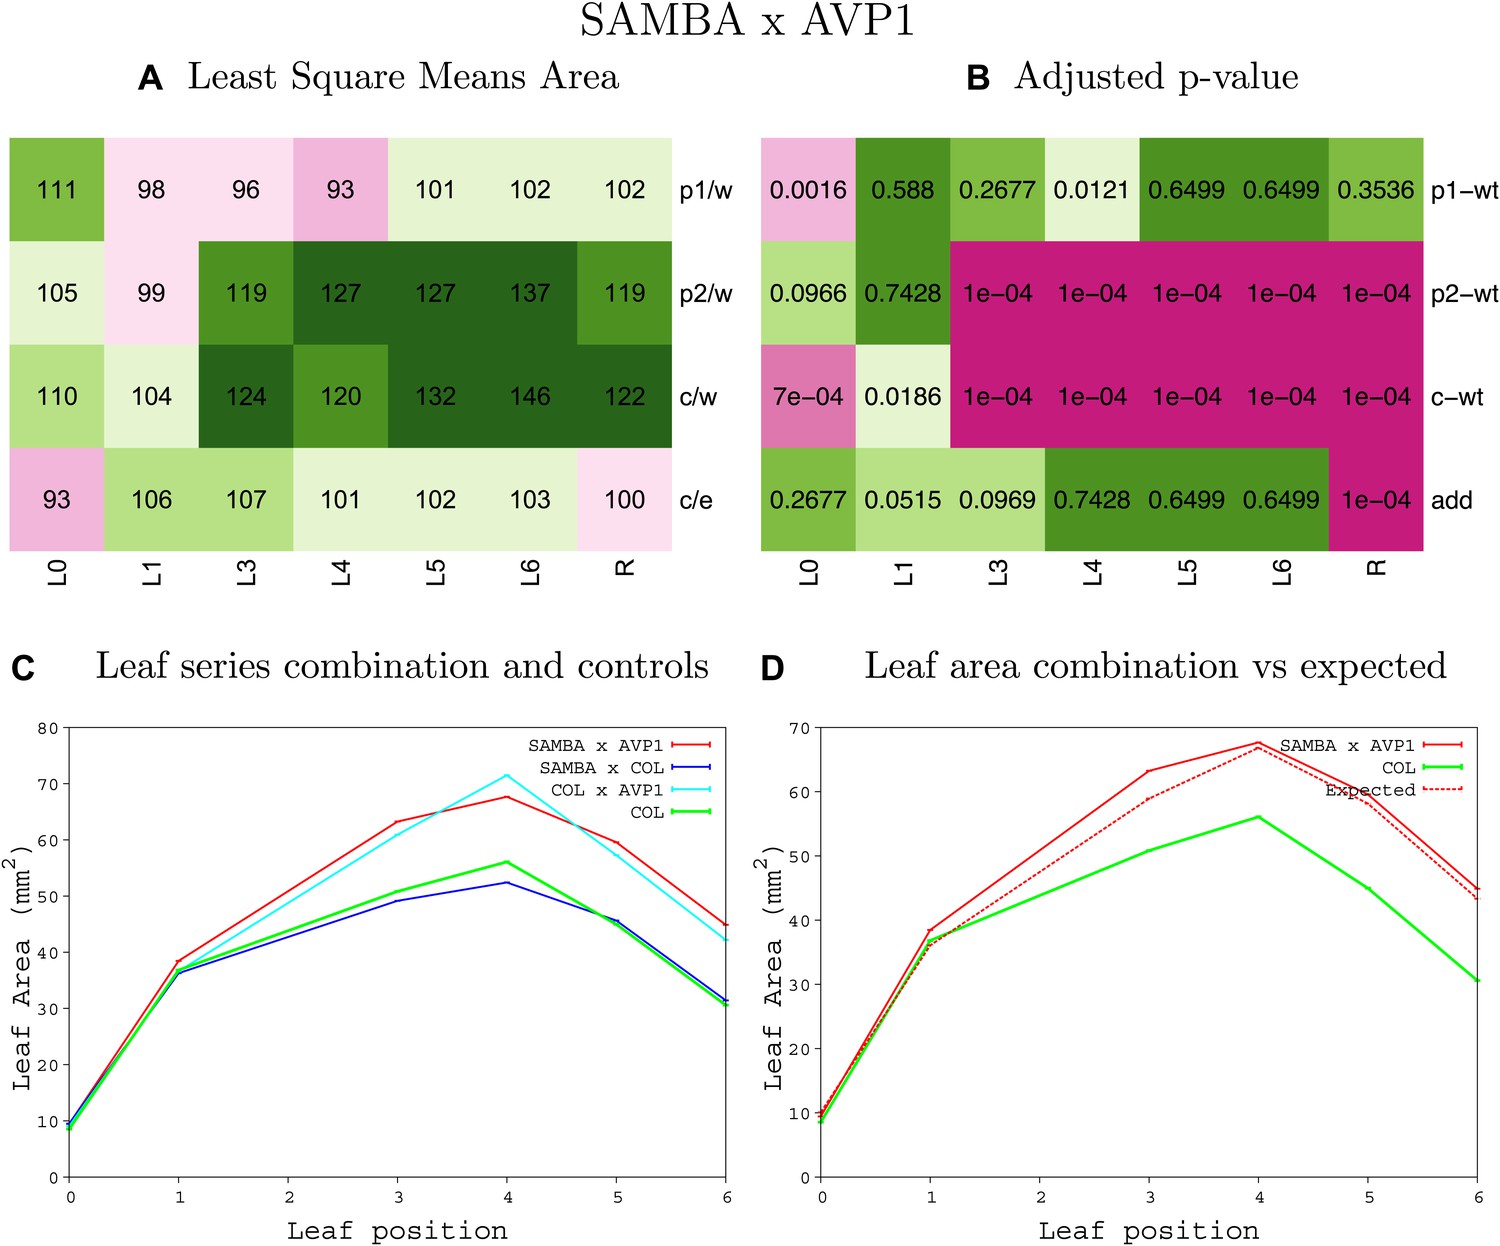
Statistical output of the phenotypic data for the heterozygous combination samba -AVP1OE.
Top left panel (A): p1/w, p2/w, c/w: percentage of the area to the WT (w) of parent 1 (p1), parent 2 (p2) and the combination (C) respectively. c/e: percentage of the area of the combination (C) to the expected if non-interacting value (EXPni) (e). Top right panel (B), corresponding FDRs for the percentages presented in the top left panel. The cotyledons (L0), first six leaves (L1–L6) and the rosette (R) are represented. Bottom left panel (C): graphs representing leaf areas for the WT (green), the combination (red) and both single lines (dark and light blue) in mm2. Bottom right panel: graph showing the leaf area of the combination (red) and the WT (green) compared to the calculated EXPni (dotted red).
Figure 1—figure supplement 59
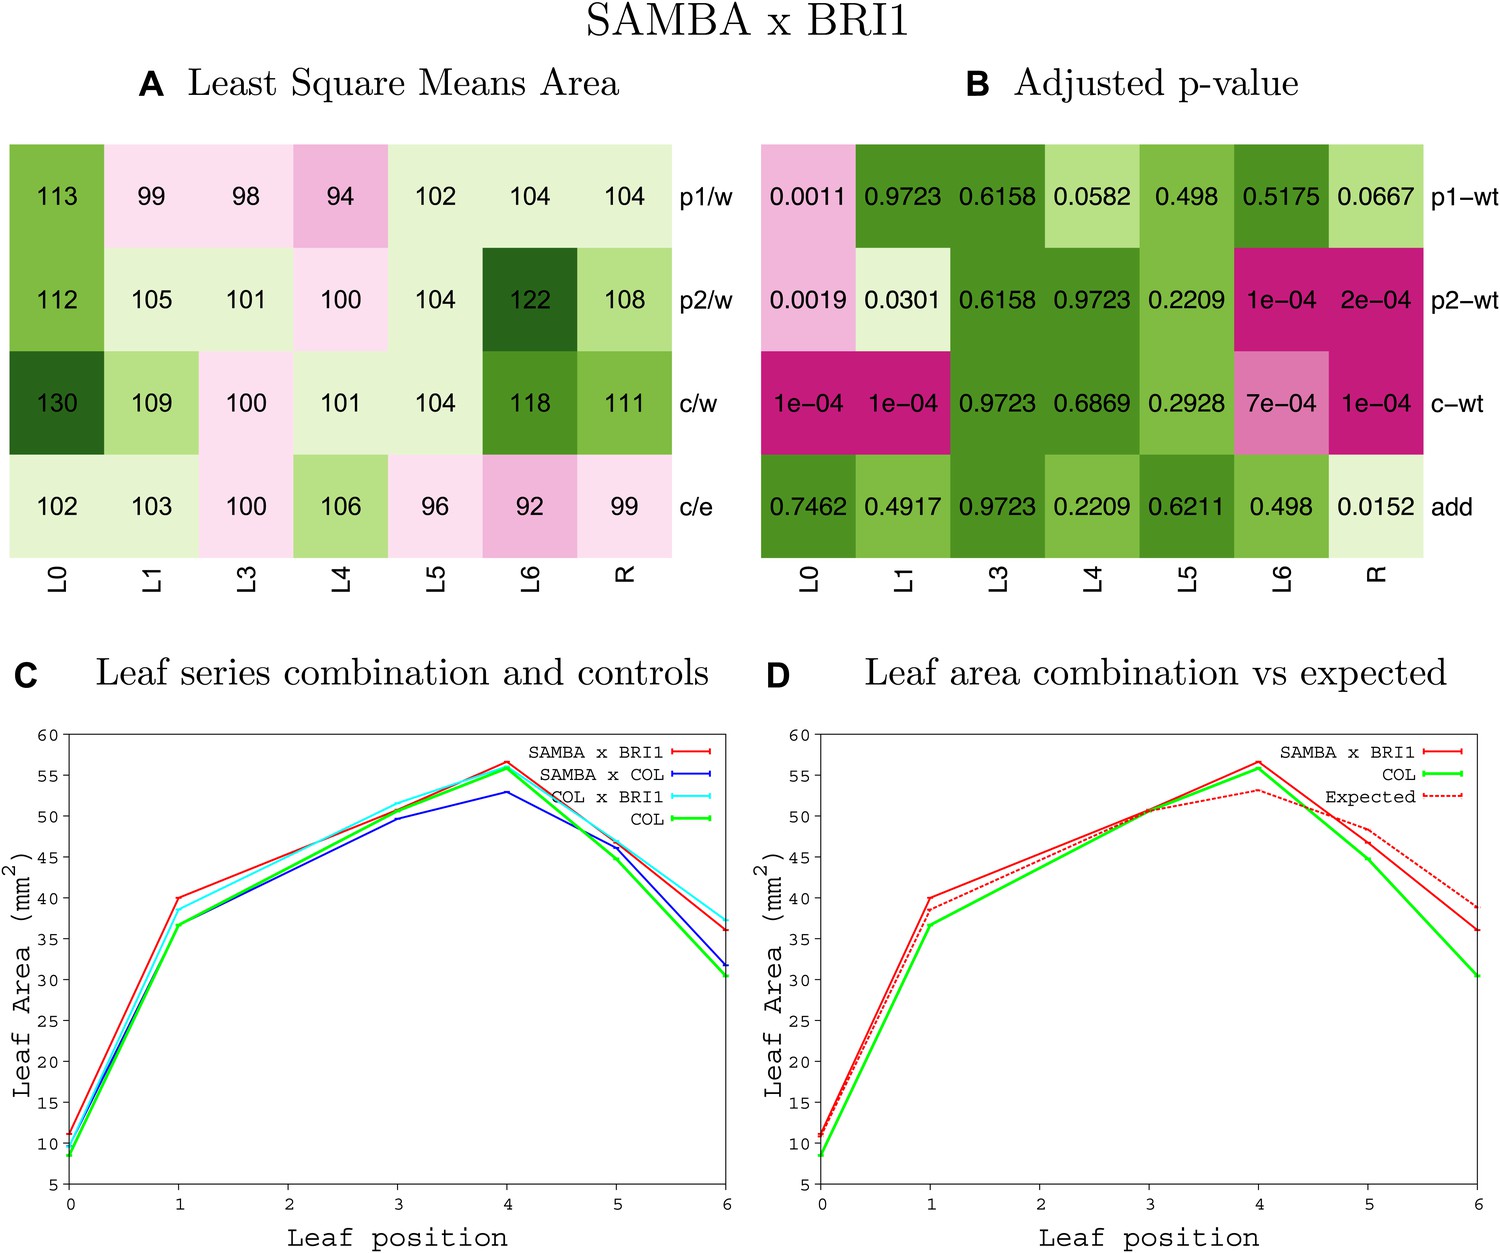
Statistical output of the phenotypic data for the heterozygous combination samba -BRIOE.
Top left panel (A): p1/w, p2/w, c/w: percentage of the area to the WT (w) of parent 1 (p1), parent 2 (p2) and the combination (C) respectively. c/e: percentage of the area of the combination (C) to the expected if non-interacting value (EXPni) (e). Top right panel (B), corresponding FDRs for the percentages presented in the top left panel. The cotyledons (L0), first six leaves (L1–L6) and the rosette (R) are represented. Bottom left panel (C): graphs representing leaf areas for the WT (green), the combination (red) and both single lines (dark and light blue) in mm2. Bottom right panel: graph showing the leaf area of the combination (red) and the WT (green) compared to the calculated EXPni (dotted red).
Figure 1—figure supplement 60
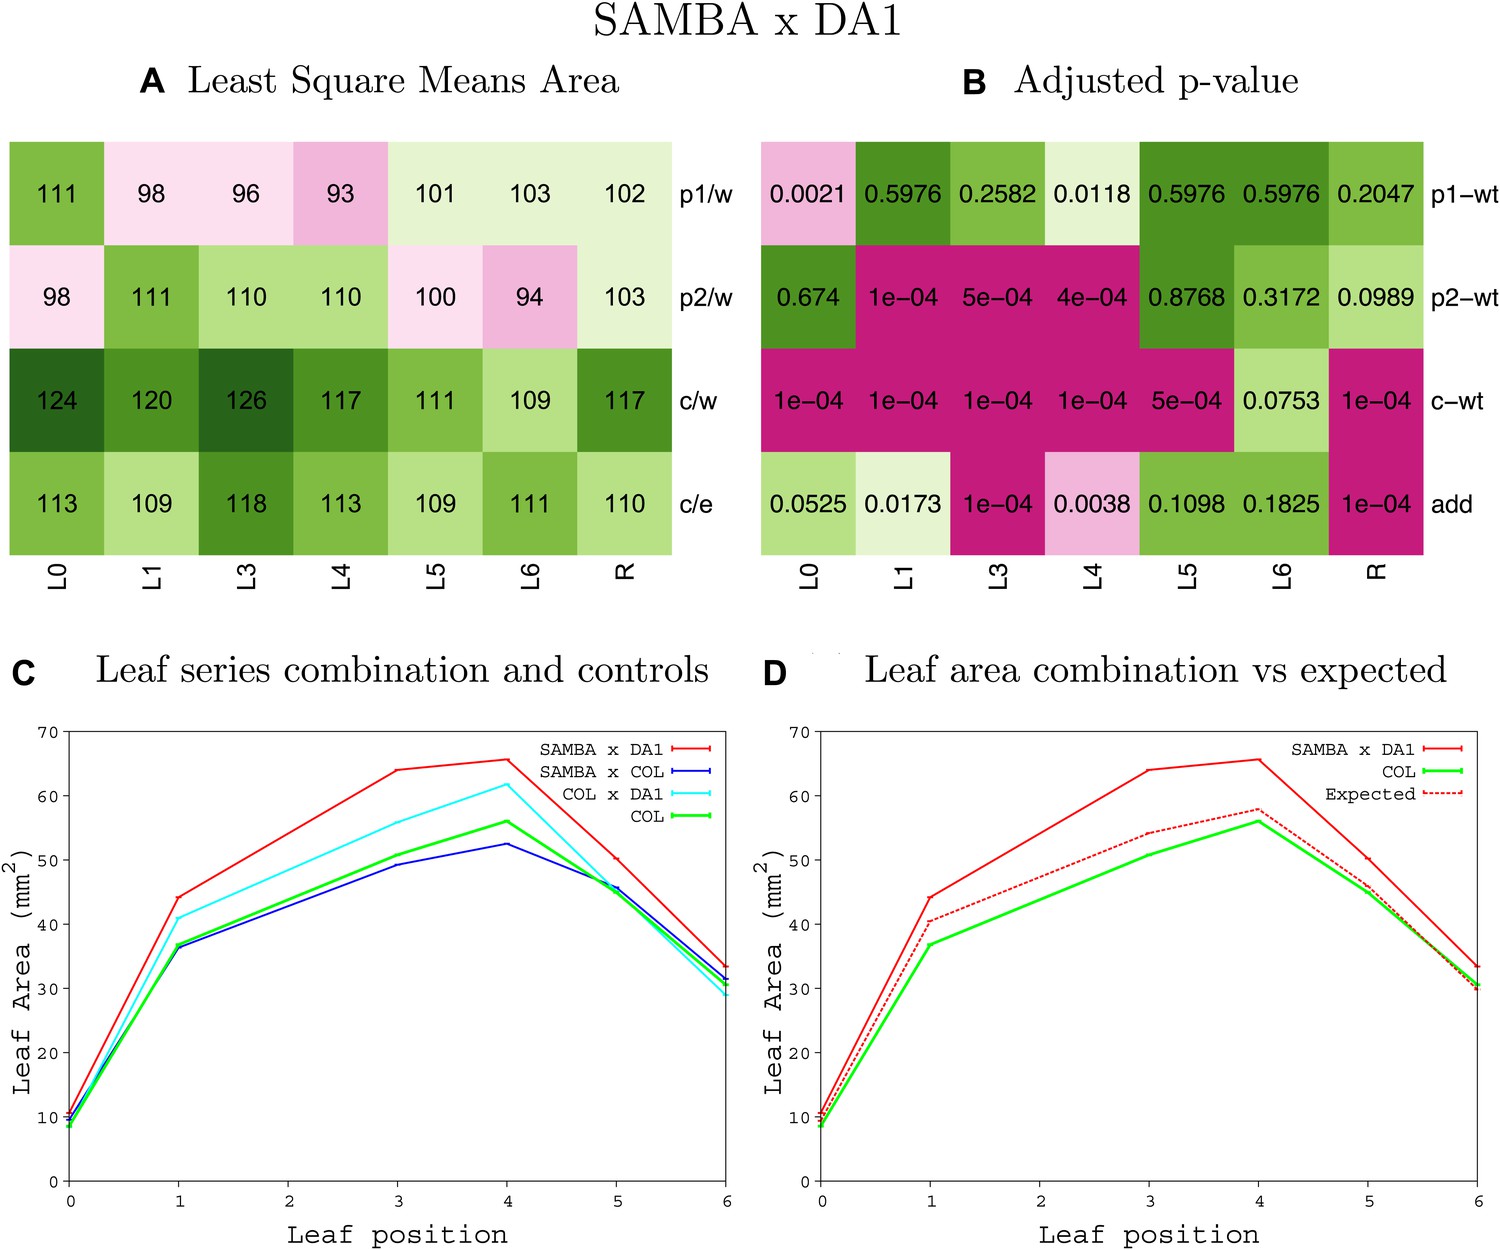
Statistical output of the phenotypic data for the heterozygous combination samba -da1-1.
Top left panel (A): p1/w, p2/w, c/w: percentage of the area to the WT (w) of parent 1 (p1), parent 2 (p2) and the combination (C) respectively. c/e: percentage of the area of the combination (C) to the expected if non-interacting value (EXPni) (e). Top right panel (B), corresponding FDRs for the percentages presented in the top left panel. The cotyledons (L0), first six leaves (L1–L6) and the rosette (R) are represented. Bottom left panel (C): graphs representing leaf areas for the WT (green), the combination (red) and both single lines (dark and light blue) in mm2. Bottom right panel: graph showing the leaf area of the combination (red) and the WT (green) compared to the calculated EXPni (dotted red).
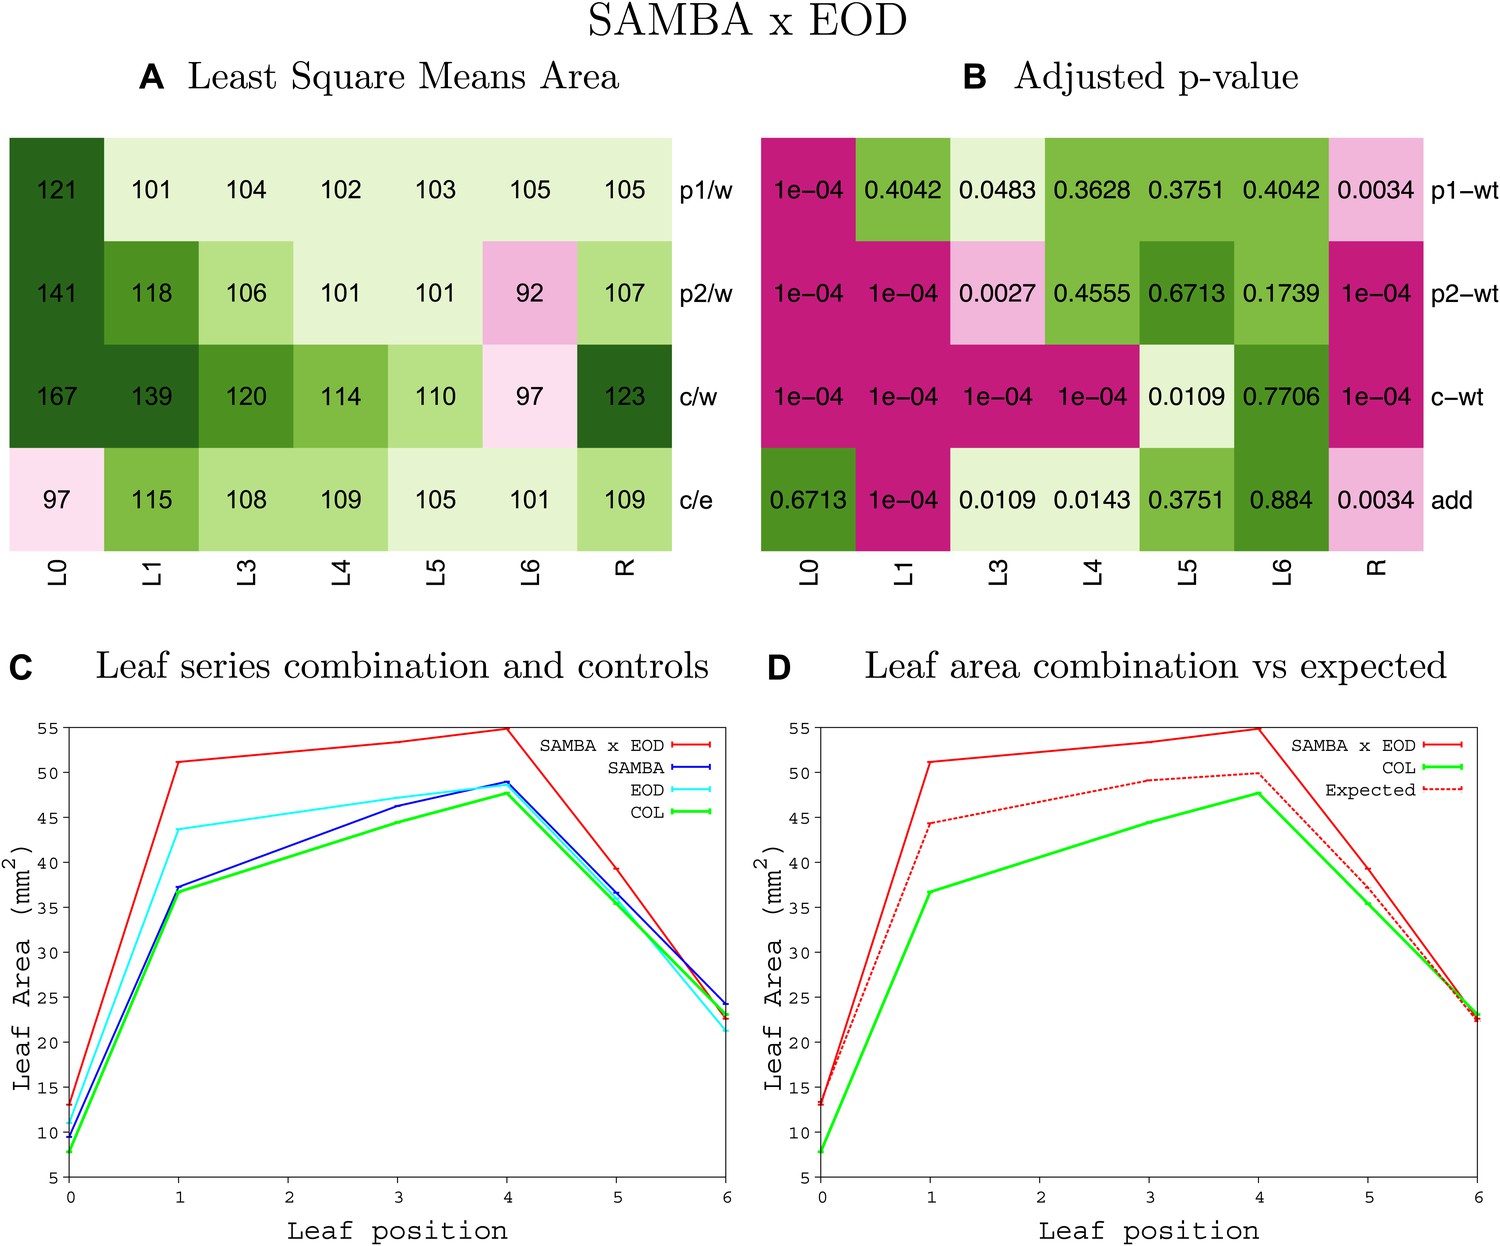
Figure 1—figure supplement 61
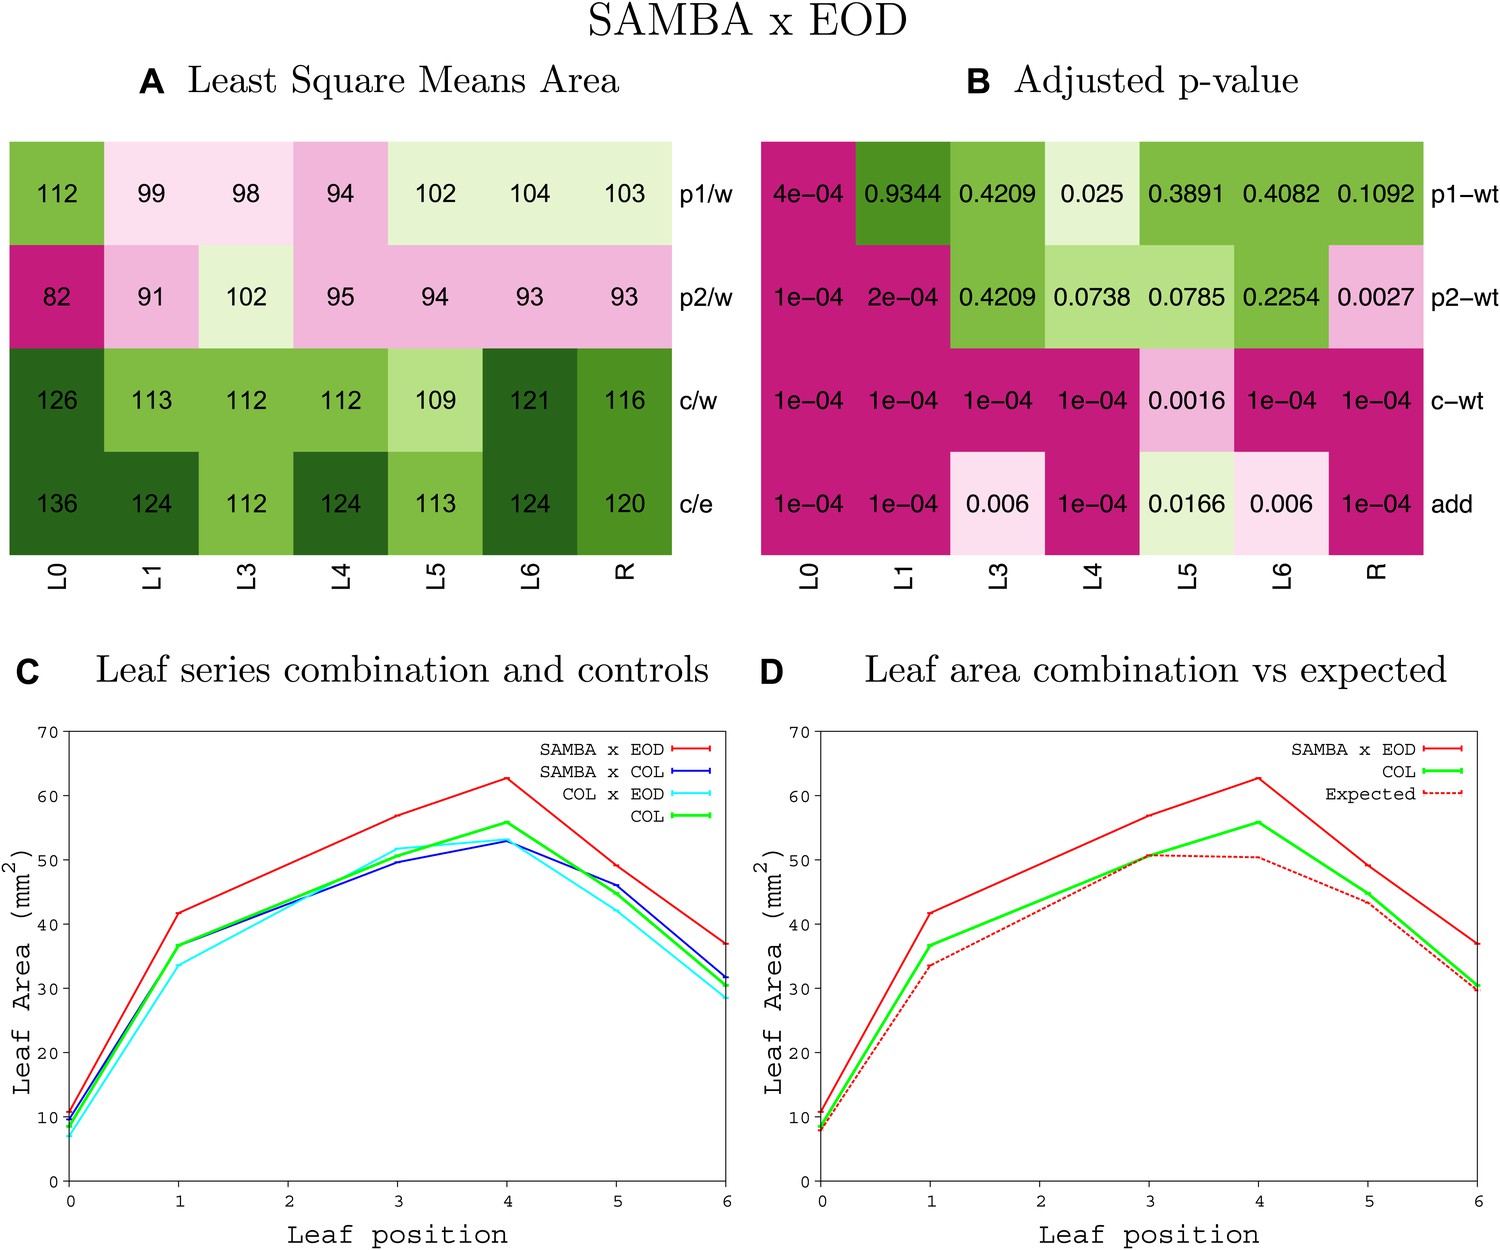
Statistical output of the phenotypic data for the heterozygous combination samba-eod1-2.
Top left panel (A): p1/w, p2/w, c/w: percentage of the area to the WT (w) of parent 1 (p1), parent 2 (p2) and the combination (C) respectively. c/e: percentage of the area of the combination (C) to the expected if non-interacting value (EXPni) (e). Top right panel (B), corresponding FDRs for the percentages presented in the top left panel. The cotyledons (L0), first six leaves (L1–L6) and the rosette (R) are represented. Bottom left panel (C): graphs representing leaf areas for the WT (green), the combination (red) and both single lines (dark and light blue) in mm2. Bottom right panel: graph showing the leaf area of the combination (red) and the WT (green) compared to the calculated EXPni (dotted red).
Figure 1—figure supplement 62
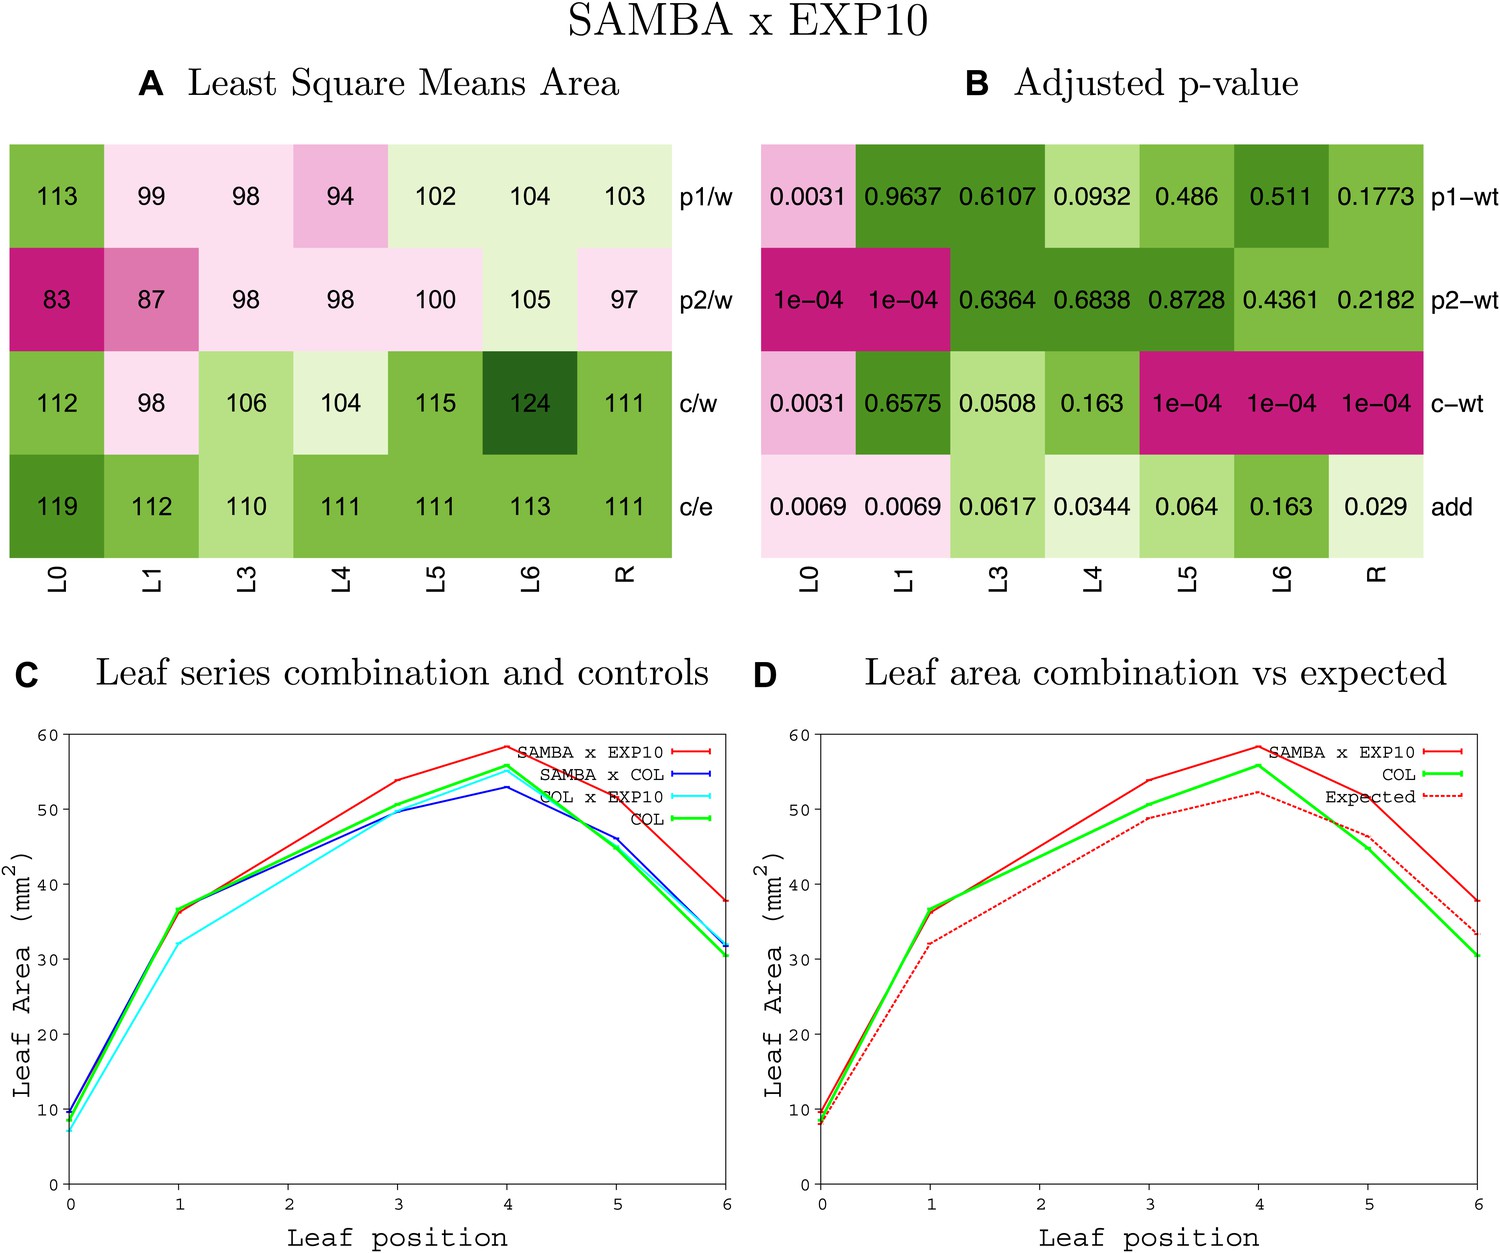
Statistical output of the phenotypic data for the heterozygous combination samba -EXP10OE.
Top left panel (A): p1/w, p2/w, c/w: percentage of the area to the WT (w) of parent 1 (p1), parent 2 (p2) and the combination (C) respectively. c/e: percentage of the area of the combination (C) to the expected if non-interacting value (EXPni) (e). Top right panel (B), corresponding FDRs for the percentages presented in the top left panel. The cotyledons (L0), first six leaves (L1–L6) and the rosette (R) are represented. Bottom left panel (C): graphs representing leaf areas for the WT (green), the combination (red) and both single lines (dark and light blue) in mm2. Bottom right panel: graph showing the leaf area of the combination (red) and the WT (green) compared to the calculated EXPni (dotted red).
Figure 1—figure supplement 63
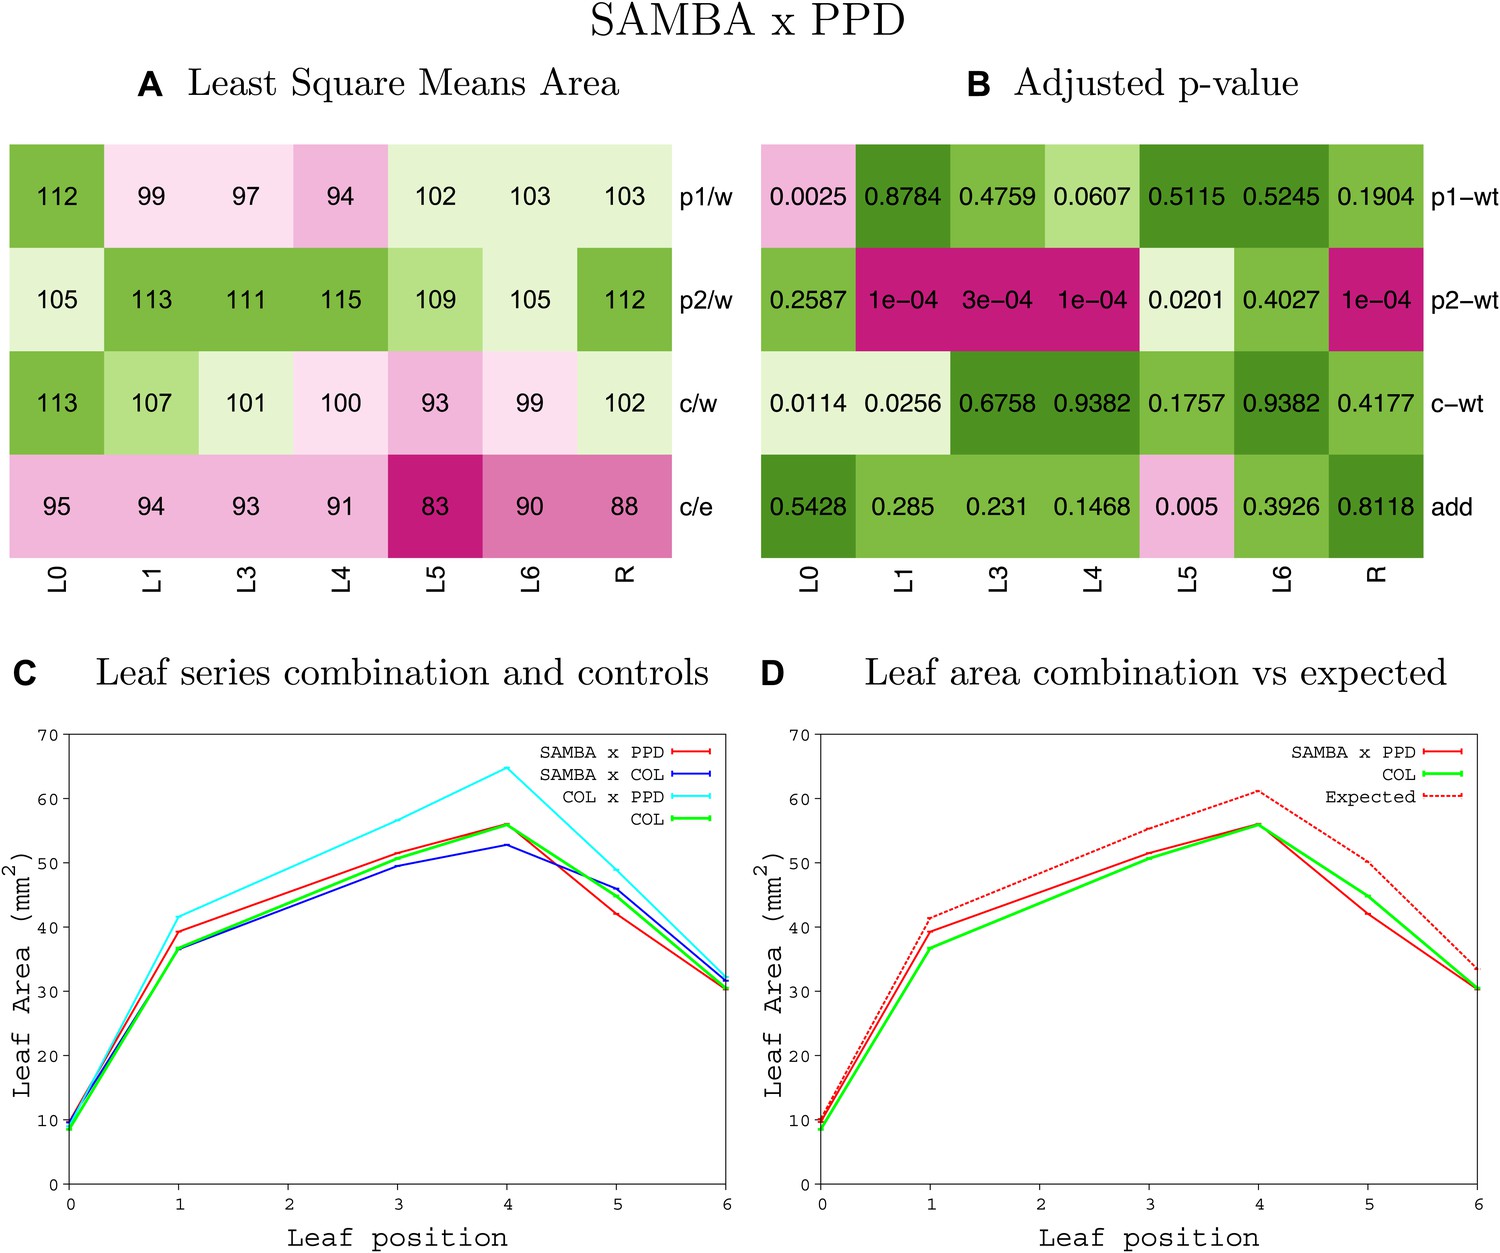
Statistical output of the phenotypic data for the heterozygous combination samba -ami-ppd.
Top left panel (A): p1/w, p2/w, c/w: percentage of the area to the WT (w) of parent 1 (p1), parent 2 (p2) and the combination (C) respectively. c/e: percentage of the area of the combination (C) to the expected if non-interacting value (EXPni) (e). Top right panel (B), corresponding FDRs for the percentages presented in the top left panel. The cotyledons (L0), first six leaves (L1–L6) and the rosette (R) are represented. Bottom left panel (C): graphs representing leaf areas for the WT (green), the combination (red) and both single lines (dark and light blue) in mm2. Bottom right panel: graph showing the leaf area of the combination (red) and the WT (green) compared to the calculated EXPni (dotted red).
Figure 1—figure supplement 64
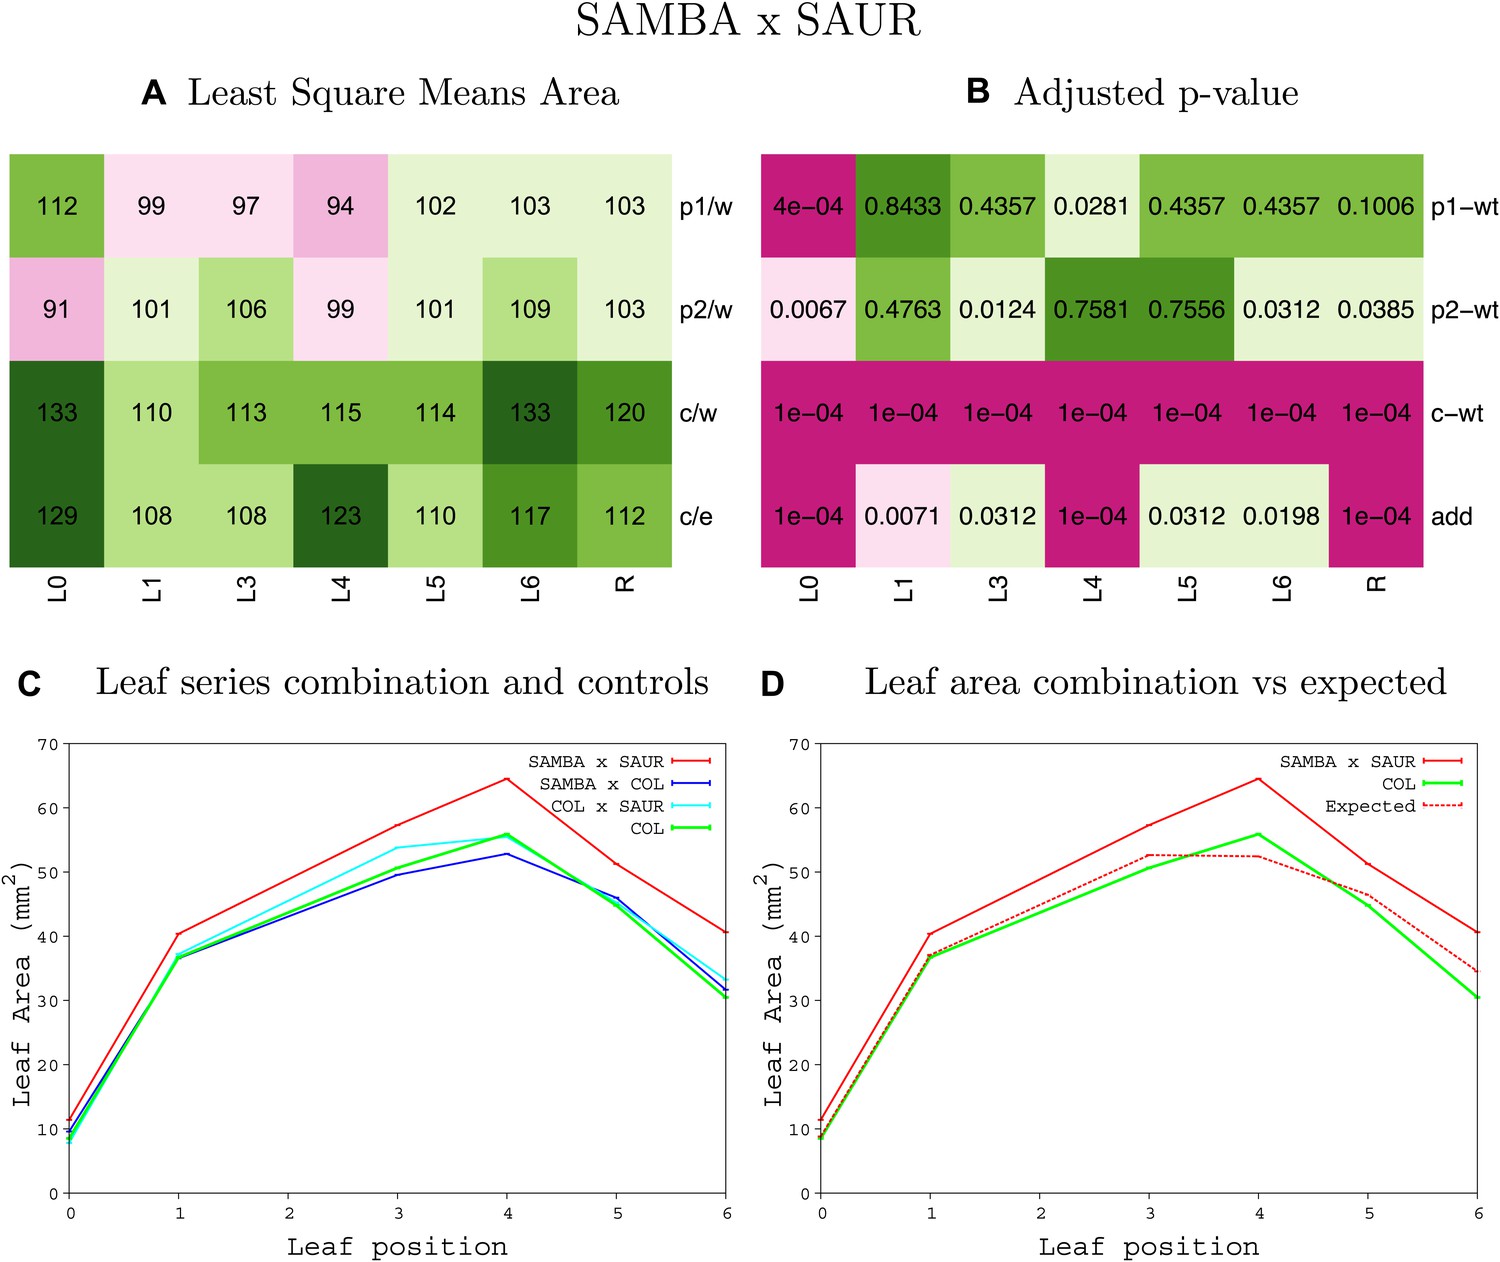
Statistical output of the phenotypic data for the heterozygous combination samba-SAUR19OE.
Top left panel (A): p1/w, p2/w, c/w: percentage of the area to the WT (w) of parent 1 (p1), parent 2 (p2) and the combination (C) respectively. c/e: percentage of the area of the combination (C) to the expected if non-interacting value (EXPni) (e). Top right panel (B), corresponding FDRs for the percentages presented in the top left panel. The cotyledons (L0), first six leaves (L1–L6) and the rosette (R) are represented. Bottom left panel (C): graphs representing leaf areas for the WT (green), the combination (red) and both single lines (dark and light blue) in mm2. Bottom right panel: graph showing the leaf area of the combination (red) and the WT (green) compared to the calculated EXPni (dotted red).
Figure 2 with 2 supplements
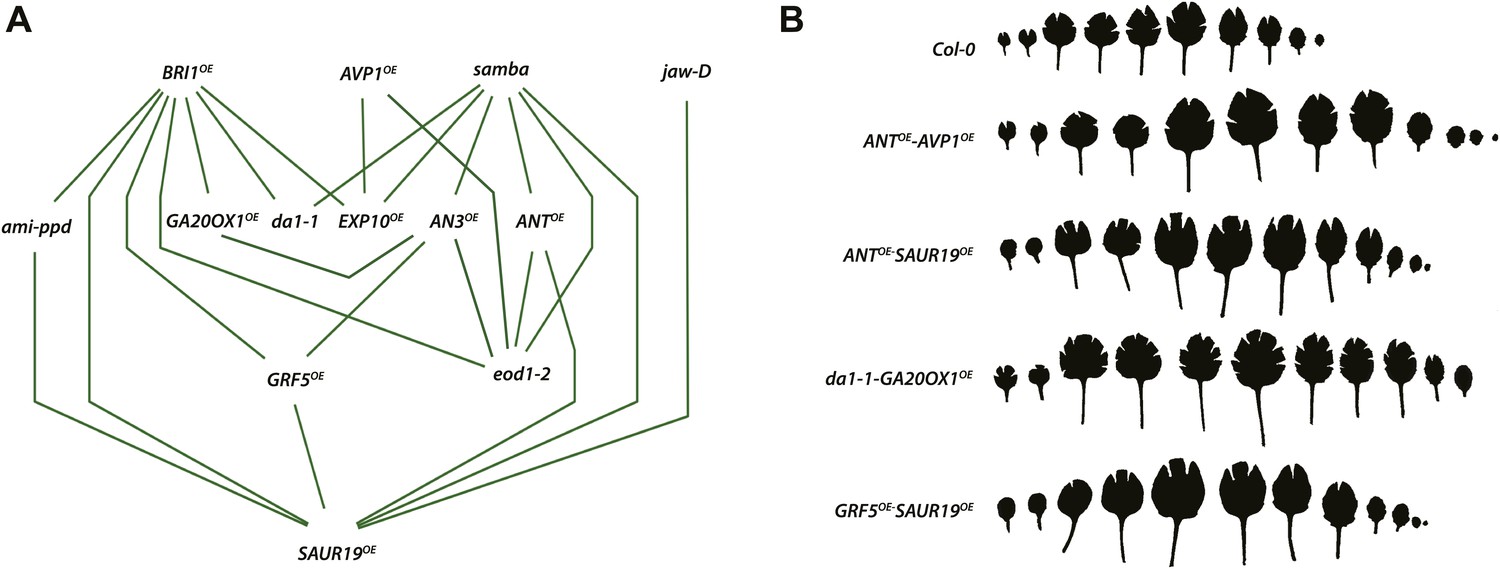
Network representing the combinations showing positive epistasis on total rosette area and leaf series of gene combinations with a large effect on leaf size.
(A) The connections between two transgenics indicate the observation of a synergistic effect on rosette size. Two transgenics producing larger leaves resulting from an increased cell area are SAUR19OE and EXP10OE. (B) Both synergistic (GRF5OE-SAUR19OE and ANTOE-SAUR19OE) and additive combinations (da1-1-GA20ox1OE and ANTOE-AVP1OE) lead to plants strongly enlarged up to 39% compared to the WT. In order to flatten the leaves for area measurements, cuts were made in the blade.
Figure 2—figure supplement 1
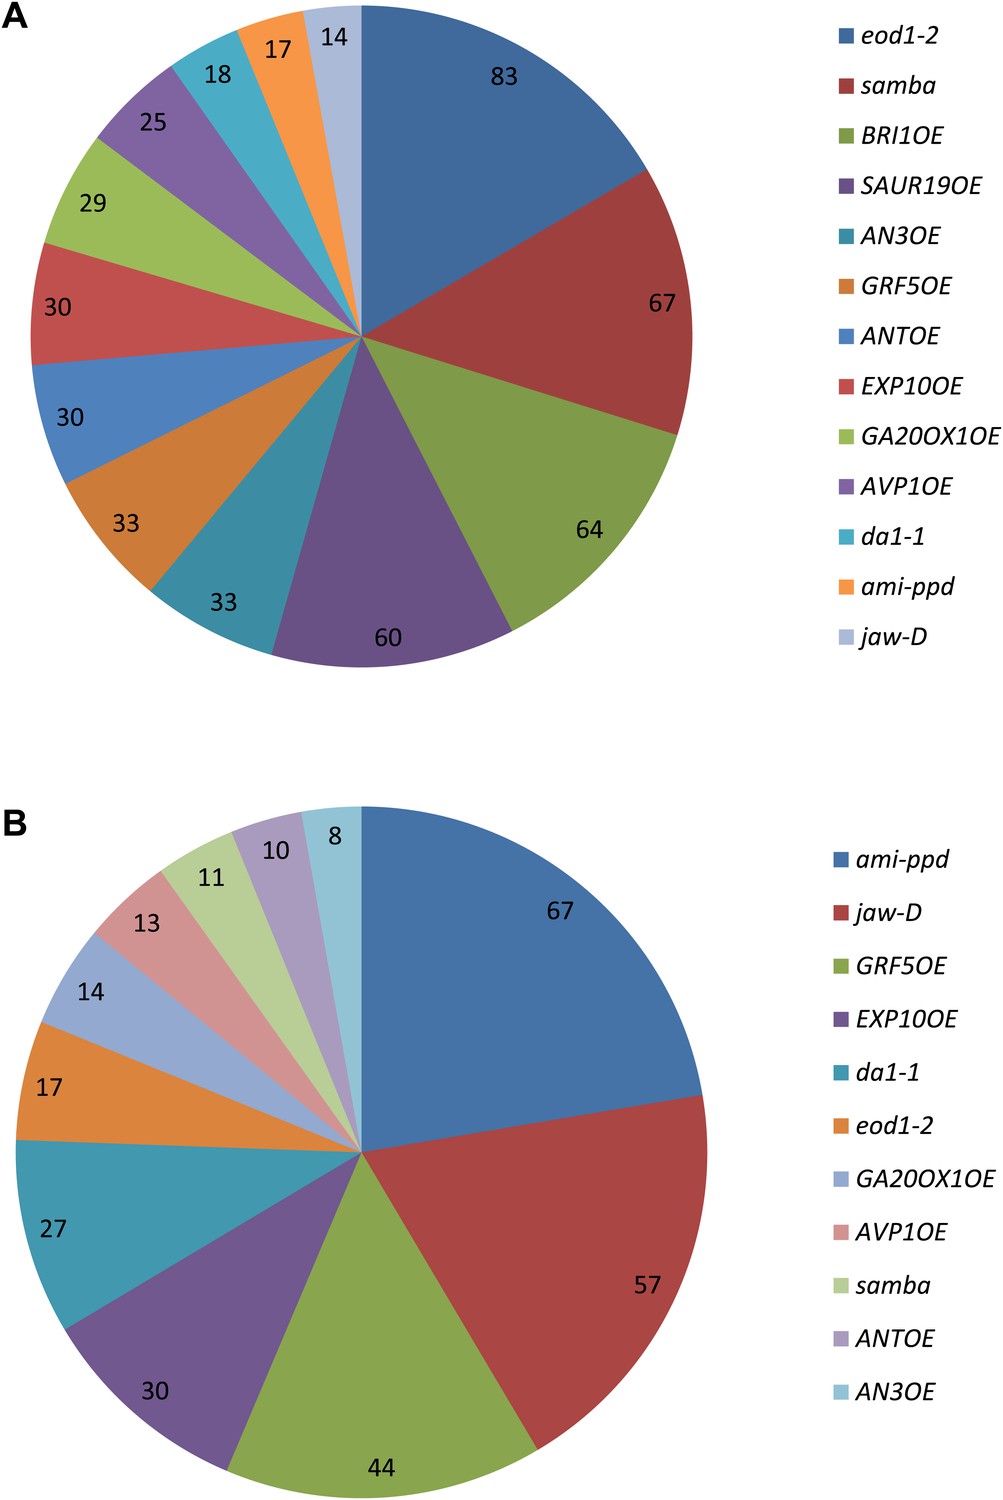
Occurrence of the growth-regulating genes in a (A) synergistic combination and (B) negative combinations.
The values indicate for each gene the % of synergistic effect observed in all its combinations. For example, 83% of all combinations with eod1-2 synergistically enhance leaf growth.
Figure 2—figure supplement 2
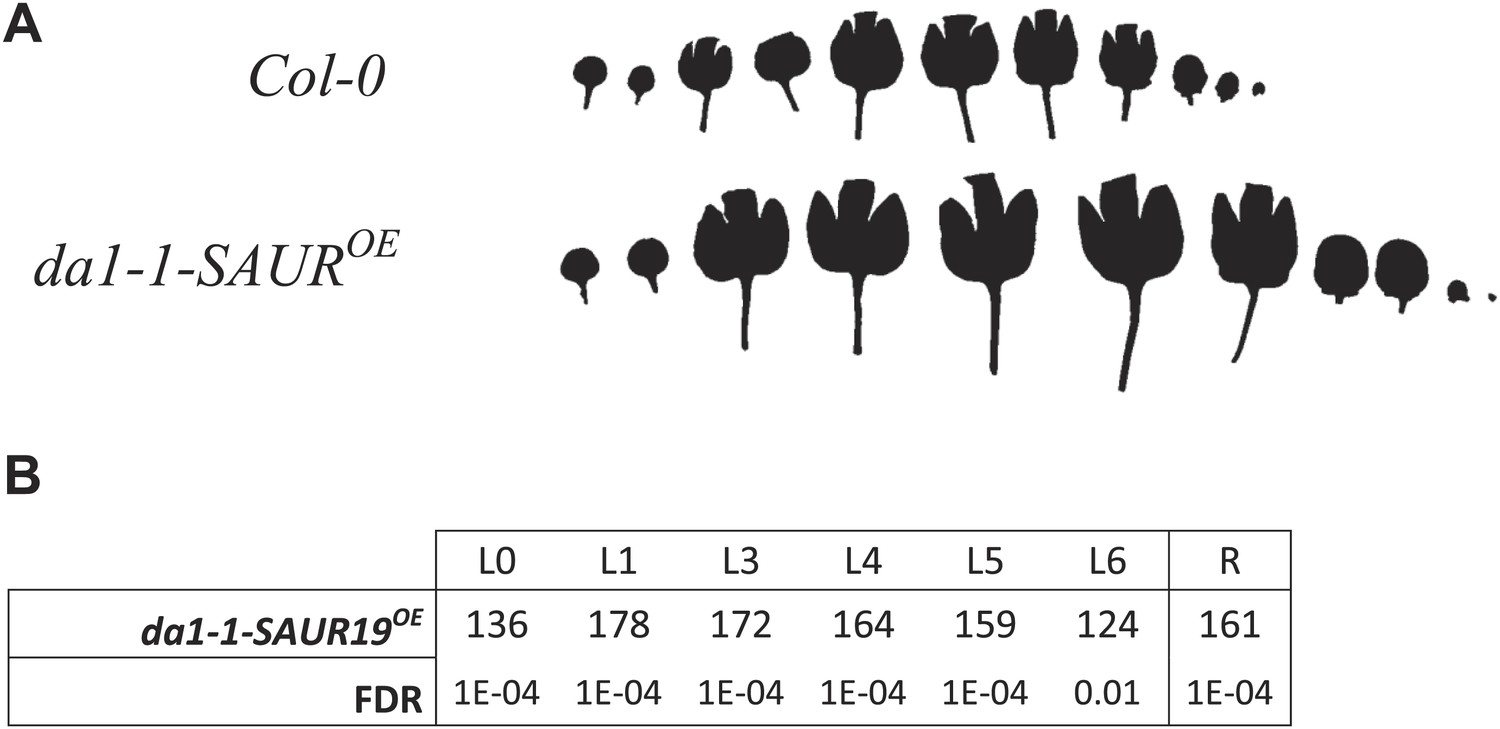
Phenotype of the homozygous combination da1-1-SAUR19OE.
(A) Leaf series to illustrate the size increase compared to the WT. (B) Percentages of the observed sizes of the cotyledons (L0) until leaf 6 (L6) and the complete rosette (R) are shown compared to the WT.
Figure 3 with 7 supplements

Heat map representing the effect of the binary combinations for rosette and leaf area (A) in reciprocal heterozygous crosses and (B) homozygous lines.
C/W represents the percentage of the rosette size of the combinations compared to the WT. Percentages of the observed sizes of the cotyledons (L0) until leaf 6 (L6) and the complete rosette are shown compared to the expected if non-interacting value (EXPni). The color code represents the range of differences with dark pink being the lowest and deep green being the highest value.
Figure 3—figure supplement 1
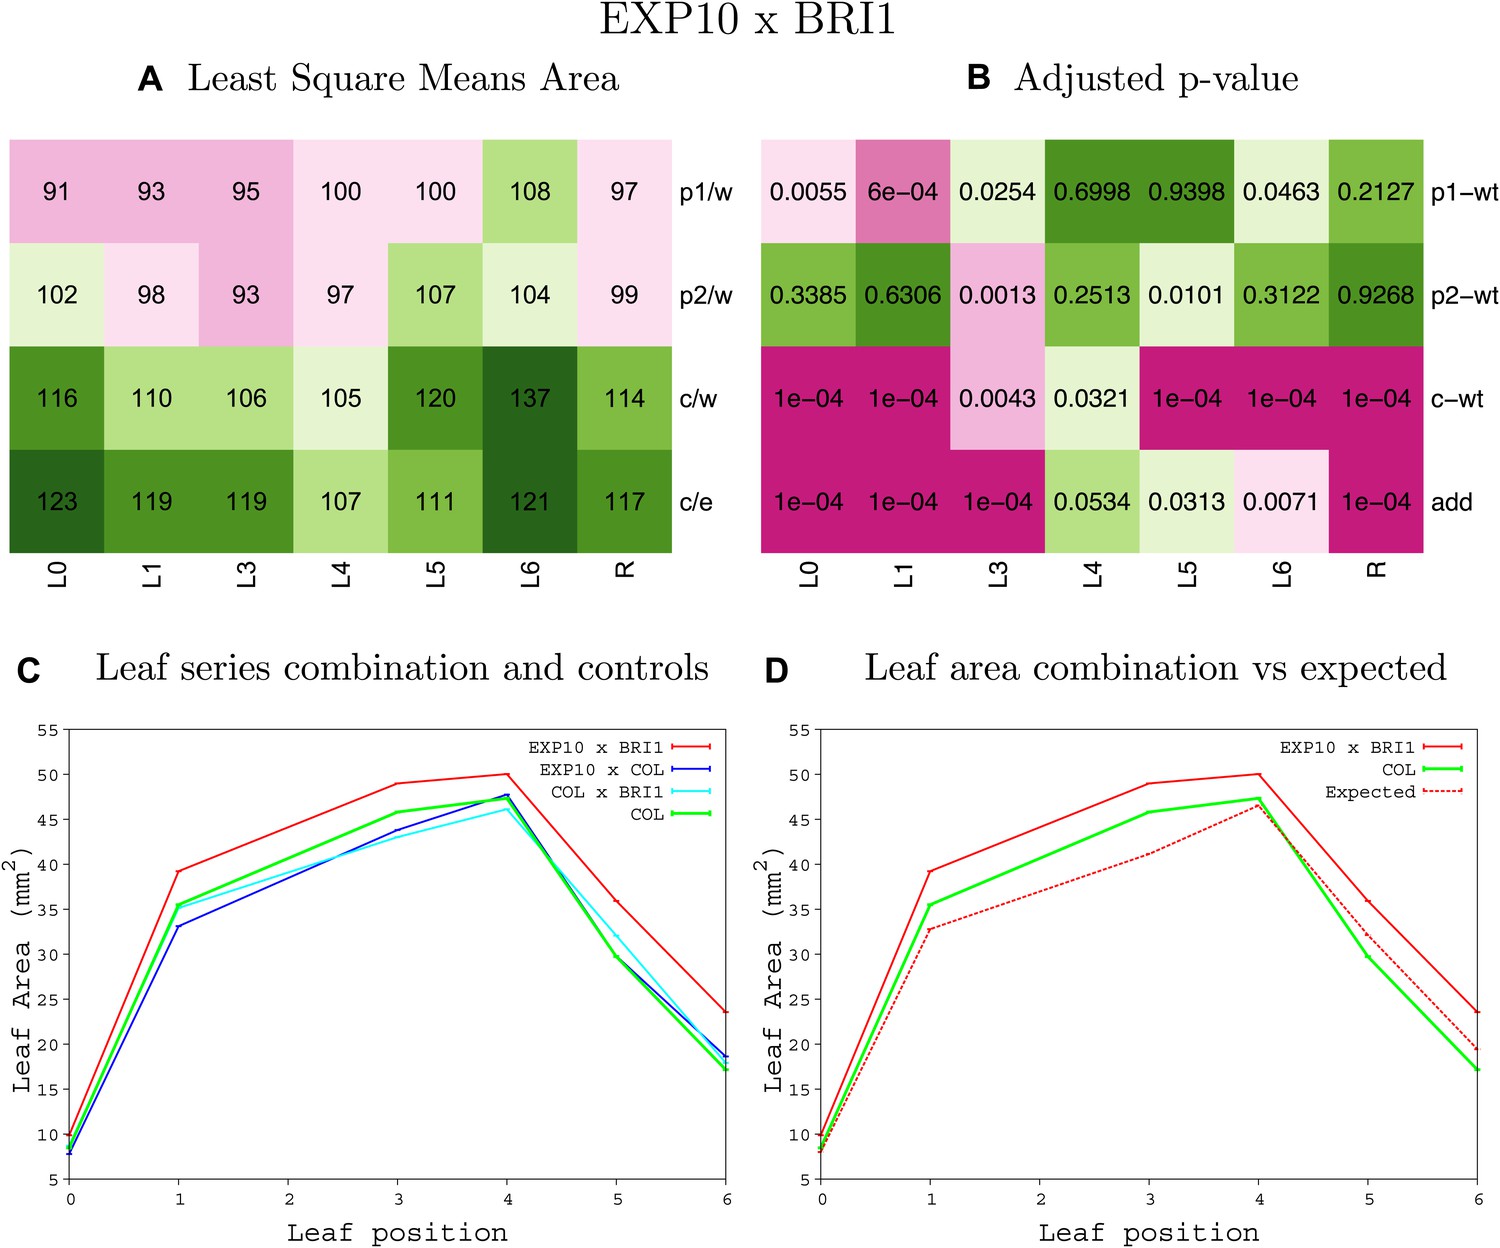
Statistical output of the phenotypic data for the heterozygous combination EXP10OE-BRI1OE.
Top left panel (A): p1/w, p2/w, c/w: percentage of the area to the WT (w) of parent 1 (p1), parent 2 (p2) and the combination (C) respectively. c/e: percentage of the area of the combination (C) to the expected if non-interacting value (EXPni) (e). Top right panel (b), corresponding FDRs for the percentages presented in the top left panel. The cotyledons (L0), first six leaves (L1–L6) and the rosette (R) are represented. Bottom left panel (C): graphs representing leaf areas for the WT (green), the combination (red) and both single lines (dark and light blue) in mm2. Bottom right panel: graph showing the leaf area of the combination (red) and the WT (green) compared to the calculated EXPni (dotted red).
Figure 3—figure supplement 2
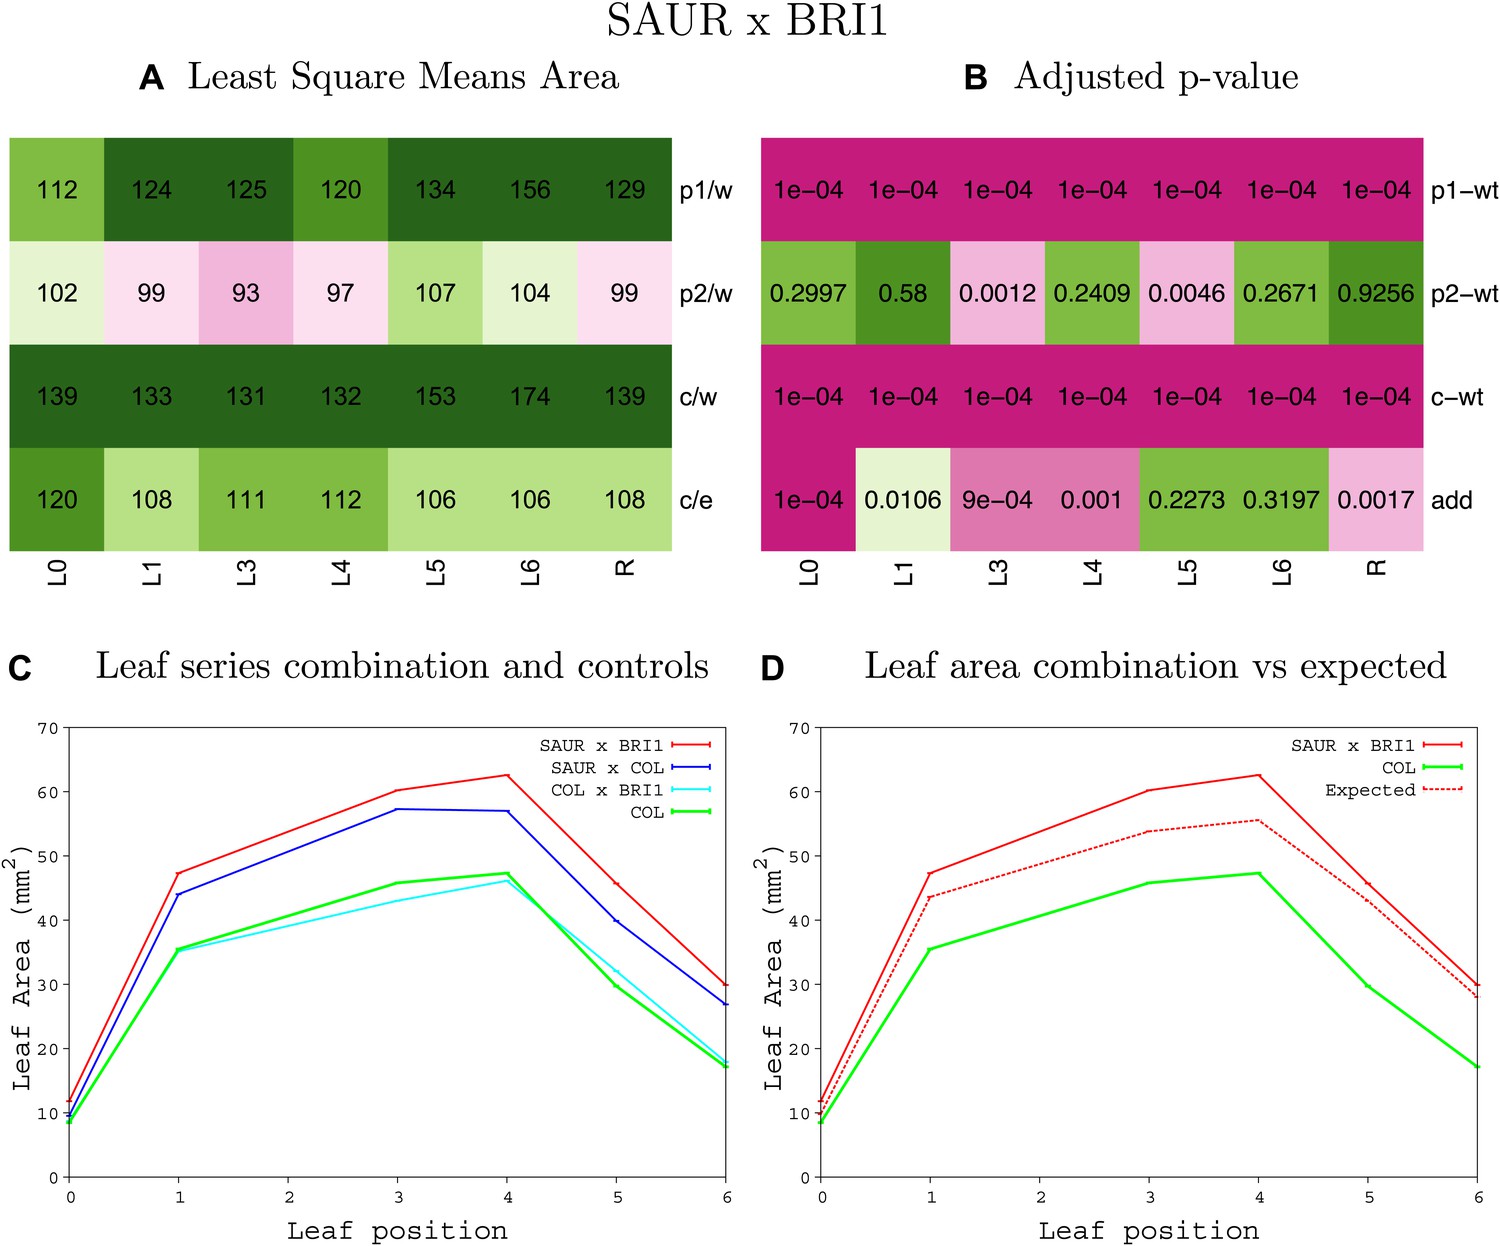
Statistical output of the phenotypic data for the heterozygous combination SAUR19OE-BRI1OE.
Top left panel (A): p1/w, p2/w, c/w: percentage of the area to the WT (w) of parent 1 (p1), parent 2 (p2) and the combination (C) respectively. c/e: percentage of the area of the combination (C) to the expected if non-interacting value (EXPni) (e). Top right panel (B), corresponding FDRs for the percentages presented in the top left panel. The cotyledons (L0), first six leaves (L1–L6) and the rosette (R) are represented. Bottom left panel (C): graphs representing leaf areas for the WT (green), the combination (red) and both single lines (dark and light blue) in mm2. Bottom right panel: graph showing the leaf area of the combination (red) and the WT (green) compared to the calculated EXPni (dotted red).
Figure 3—figure supplement 3
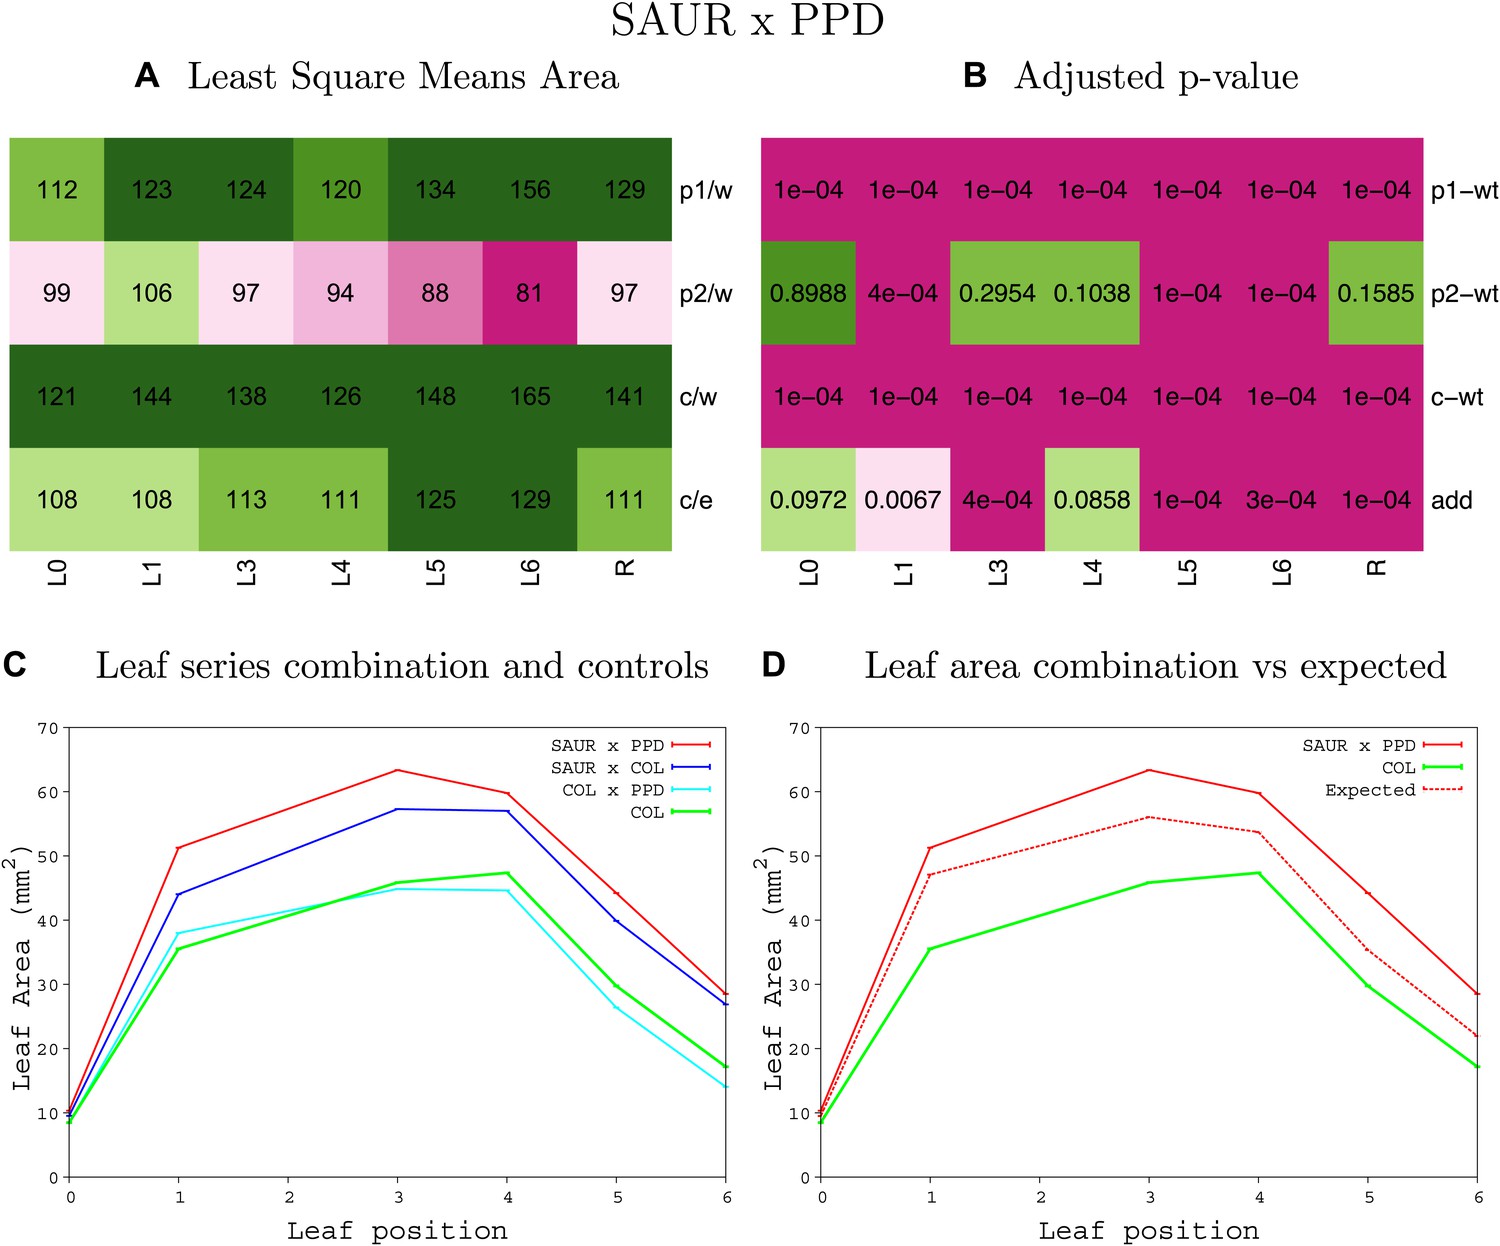
Statistical output of the phenotypic data for the heterozygous combination SAUR19OE-ami-ppd.
Top left panel (A): p1/w, p2/w, c/w: percentage of the area to the WT (w) of parent 1 (p1), parent 2 (p2) and the combination (C) respectively. c/e: percentage of the area of the combination (C) to the expected if non-interacting value (EXPni) (e). Top right panel (B), corresponding FDRs for the percentages presented in the top left panel. The cotyledons (L0), first six leaves (L1–L6) and the rosette (R) are represented. Bottom left panel (C): graphs representing leaf areas for the WT (green), the combination (red) and both single lines (dark and light blue) in mm2. Bottom right panel: graph showing the leaf area of the combination (red) and the WT (green) compared to the calculated EXPni (dotted red).
Figure 3—figure supplement 4
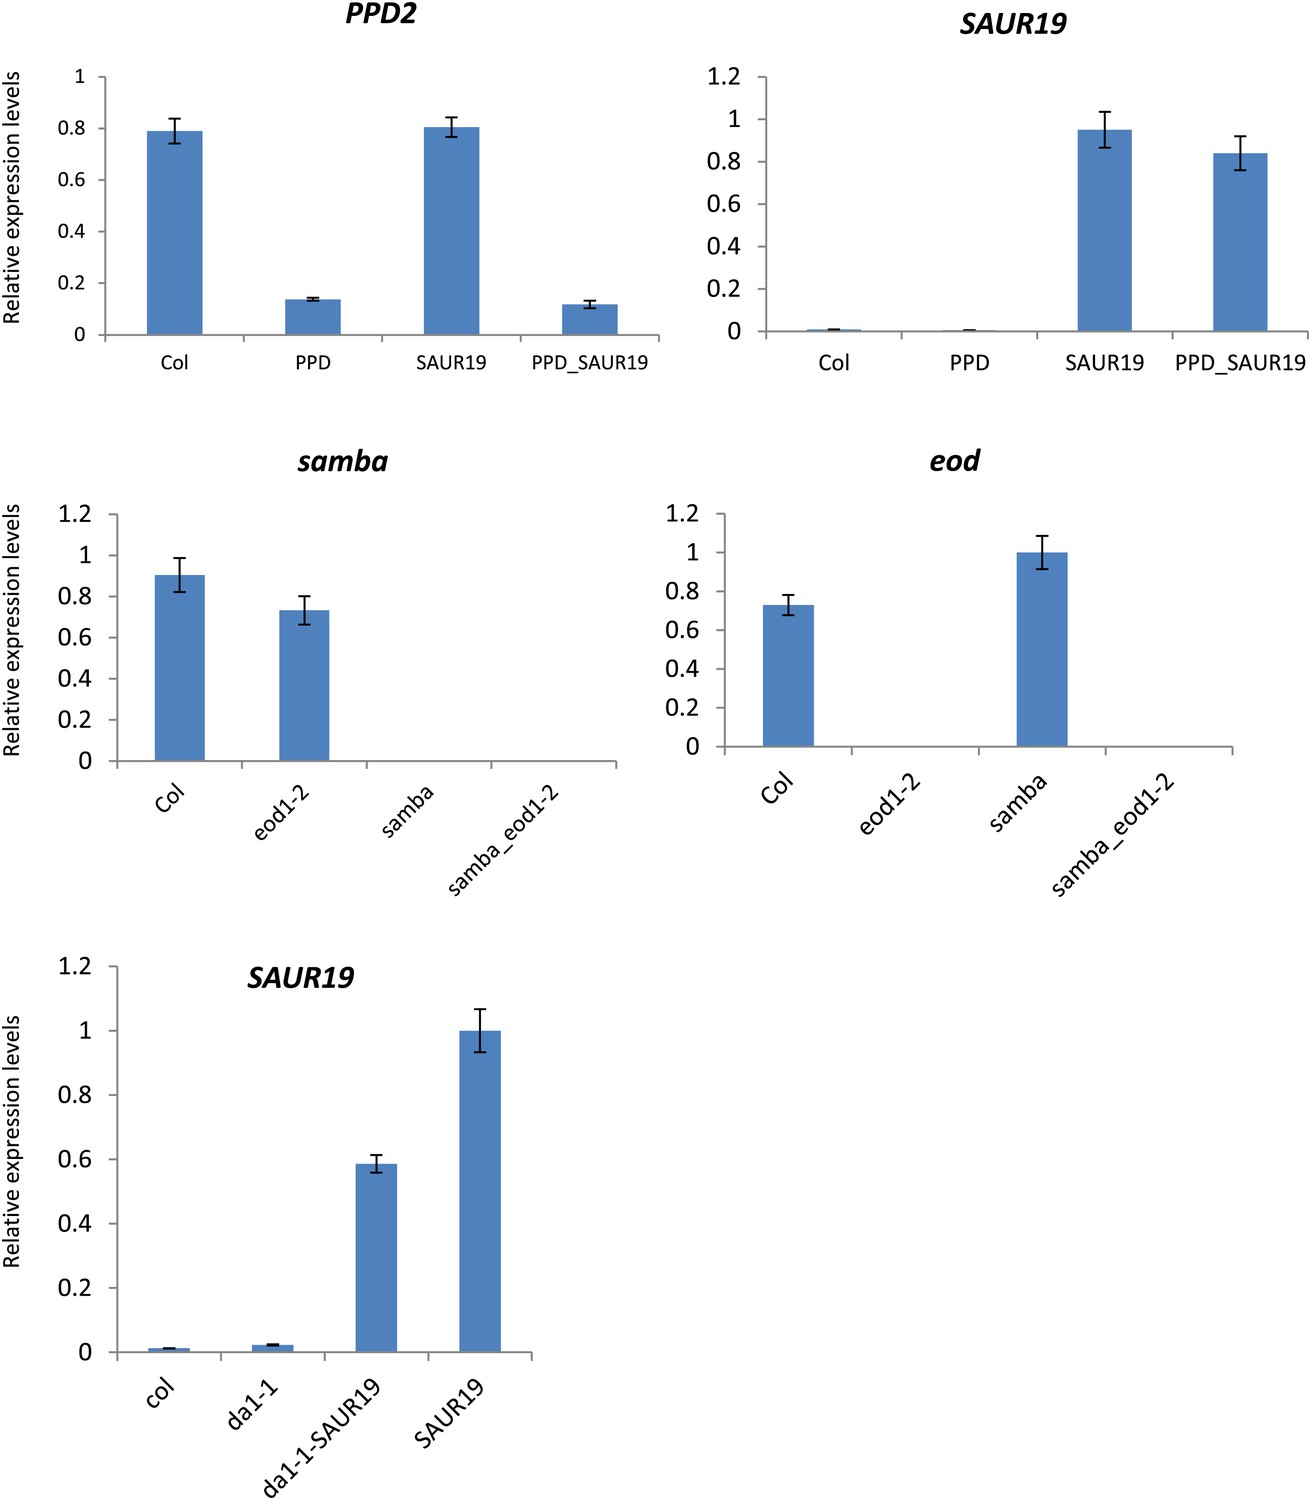
Relative gene expression levels in the homozygous binary combinations and their controls.
Each graph represents the relative expression of a gene of interest in Col-0, the homozygous control and the homozygous combinations.
Figure 3—figure supplement 5
Statistical output of the phenotypic data for the homozygous combination ami-ppd-SAUR19OE.
Top left panel (A): p1/w, p2/w, c/w: percentage of the area to the WT (w) of parent 1 (p1), parent 2 (p2) and the combination (C) respectively. c/e: percentage of the area of the combination (C) to the expected if non-interacting value (EXPni) (e). Top right panel (B), corresponding FDRs for the percentages presented in the top left panel. The cotyledons (L0), first six leaves (L1–L6) and the rosette (R) are represented. Bottom left panel (C): graphs representing leaf areas for the WT (green), the combination (red) and both single lines (dark and light blue) in mm2. Bottom right panel: graph showing the leaf area of the combination (red) and the WT (green) compared to the calculated EXPni (dotted red).
Figure 3—figure supplement 6
Statistical output of the phenotypic data for the homozygous combination samba-eod1-2.
Top left panel (A): p1/w, p2/w, c/w: percentage of the area to the WT (w) of parent 1 (p1), parent 2 (p2) and the combination (C) respectively. c/e: percentage of the area of the combination (C) to the expected if non-interacting value (EXPni) (e). Top right panel (B), corresponding FDRs for the percentages presented in the top left panel. The cotyledons (L0), first six leaves (L1–L6) and the rosette (R) are represented. Bottom left panel (C): graphs representing leaf areas for the WT (green), the combination (red) and both single lines (dark and light blue) in mm2. Bottom right panel: graph showing the leaf area of the combination (red) and the WT (green) compared to the calculated EXPni (dotted red).
Figure 3—figure supplement 7
Statistical output of the phenotypic data for the homozygous combination da1-1-SAUR19OE.
Top left panel (A): p1/w, p2/w, c/w: percentage of the area to the WT (w) of parent 1 (p1), parent 2 (p2) and the combination (C) respectively. c/e: percentage of the area of the combination (C) to the expected if non-interacting value (EXPni) (e). Top right panel (B), corresponding FDRs for the percentages presented in the top left panel. The cotyledons (L0), first six leaves (L1–L6) and the rosette (R) are represented. Bottom left panel (C): graphs representing leaf areas for the WT (green), the combination (red) and both single lines (dark and light blue) in mm2. Bottom right panel: graph showing the leaf area of the combination (red) and the WT (green) compared to the calculated EXPni (dotted red).
Figure 4

Cellular basis of the difference in leaf size observed for the homozygous line amippd-SAUR19OE and the corresponding controls.
(A) The graphs represent the percentage difference of leaf area, cell number and cell area between a transgenic and the WT. (n = 3; *p<0.05). (B) Representative drawing of cells in the different lines. Cells are colored in function of their area. Red: cells smaller than 1.25 E−4 mm2, light green: cell area ranging from 1.25 E−4 mm2 to 1.6 E−3 mm2, medium green: cell area ranging from 1.6 E−3 mm2 to 3.2 E−3 mm2, dark green: cells larger than 6.4 E−3 mm2, stomata are marked in grey.
Tables
Table 1
Growth regulators and transgenics used for the binary combinations
| Gene name | Gene symbol | Gene ID | Line name | Perturbation | Cellular process promoted | Reference |
|---|---|---|---|---|---|---|
| ANGUSTIFOLIA3 | AN3 | AT5G28640 | AN3OE | OE | Cell division | (Horiguchi et al., 2005) |
| AINTEGUMENTA | ANT | AT4G37750 | ANTOE | OE | Cell division | (Mizukami and Fischer, 2000) |
| ARABIDOPSIS V-PYROPHOSPHATASE | AVP1 | AT1G15690 | AVP1OE | OE | Cell division | (Li et al., 2005) |
| BRASSINOSTEROID INSENSITIVE 1 | BRI1 | AT4G39400 | BRI1OE | OE | Cell division | (Wang et al., 2001; Gonzalez et al., 2010) |
| DA1 | DA1 | AT1G19270 | da1-1 | LOF | Cell division | (Li et al., 2008) |
| ENHANCER OF DA1-1/BIG BROTHER | EOD/BB | AT3G63530 | eod1-2 | LOF | Cell division | (Li et al., 2008) |
| EXPANSIN 10 | EXP10 | AT1G26770 | EXP10OE | OE | Cell expansion | (Cho and Cosgrove, 2000) |
| GIBBERELLIN 20 OXIDASE 1 | GA20OX1 | AT4G25420 | GA20OX1OE | OE | Cell division and expansion | (Huang et al., 1998; Gonzalez et al., 2010) |
| GROWTH REGULATING FACTOR5 | GRF5 | AT3G13960 | GRF5OE | OE | Cell division | (Horiguchi et al., 2005) |
| miR-JAW/ miRNA 319 | miR-JAW | AT4G23713 | jaw-D | OE | Cell division | (Palatnik et al., 2003) |
| PEAPOD | PPD | AT4G14713 and AT4G14720 | ami-ppd | LOF | Meristemoid division | (White, 2006; Gonzalez et al., 2010) |
| SAMBA | SAMBA | AT1G32310 | samba | LOF | Cell division and expansion | (Eloy et al., 2012) |
| SMALL AUXIN UP RNA 19 | SAUR19 | AT5G18010 | SAUR19OE | OE | Cell expansion | (Spartz et al., 2012) |
-
OE: over-expression, LOF: loss of function.
Additional files
-
Supplementary file 1
Percentage rosette area of a heterozygous combination compared to the heterozygous parents.
Column ‘line’: heterozygous combination, Column ‘% to parA’: if a combination A is combined with B, par A represents the parent A, Column ‘% to parB’: if a combination A is combined with B, parB represents the parent B, Column ‘Pcross-parA’: pvalue, Column ‘Pcross-parB’: pvalue.
- https://doi.org/10.7554/eLife.02252.081
-
Supplementary file 2
List of primers used for the Q-RT-PCR analysis.
- https://doi.org/10.7554/eLife.02252.082
-
Supplementary file 3
Estimation of the interaction between genotype and experiment.
- https://doi.org/10.7554/eLife.02252.083
Download links
A two-part list of links to download the article, or parts of the article, in various formats.
Downloads (link to download the article as PDF)
Open citations (links to open the citations from this article in various online reference manager services)
Cite this article (links to download the citations from this article in formats compatible with various reference manager tools)
Combining growth-promoting genes leads to positive epistasis in Arabidopsis thaliana
eLife 3:e02252.
https://doi.org/10.7554/eLife.02252


