Atoh1-dependent rhombic lip neurons are required for temporal delay between independent respiratory oscillators in embryonic mice
- Washington University School of Medicine, United States
- Baylor College of Medicine, United States
- The College of William and Mary, United States
- Howard Hughes Medical Institute, Baylor College of Medicine, United States
Figures
Figure 1
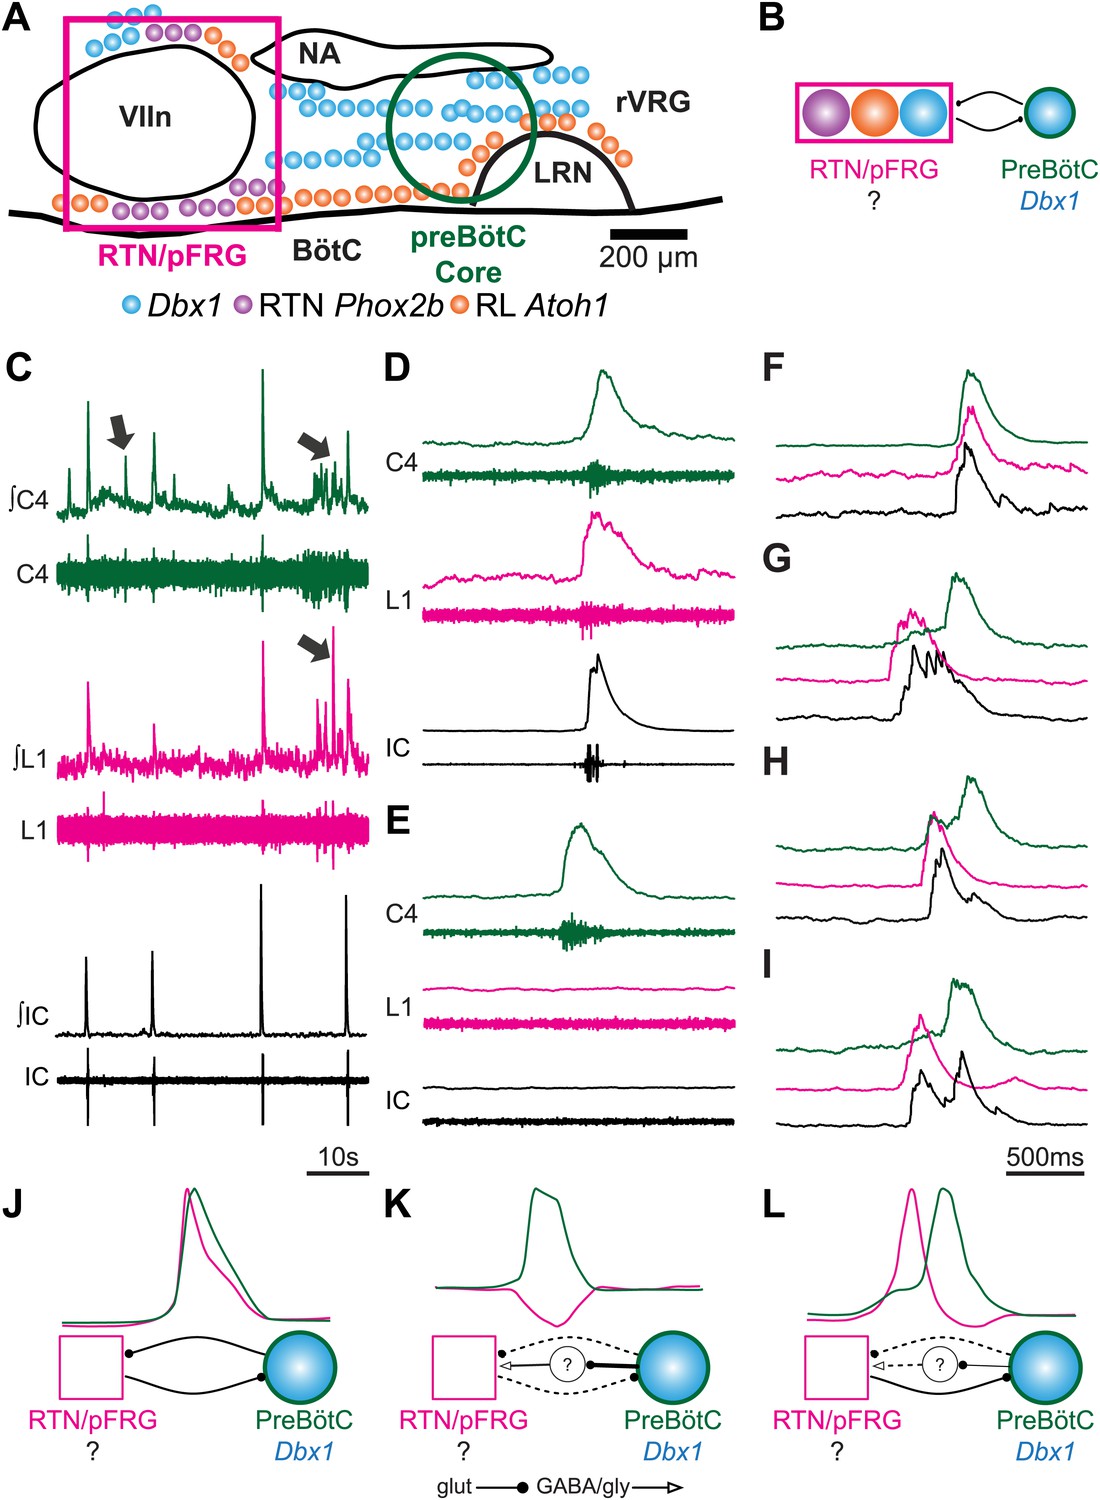
Perinatal mouse hindbrain produces temporally coordinated respiratory output from cervical and lumbar motor pools, as well as internal intercostal respiratory muscles.
(A) Cartoon of sagittal view through caudal hindbrain indicating the locations of distinct developmentally defined glutamatergic populations important for breathing. Colored filled circles indicate the relative location of rhombic lip (RL) Atoh1 (orange), RTN Phox2b (purple), and Dbx1 (blue) derived neurons. Note: RTN Phox2b neurons transiently express Atoh1, but we have left this out for clarity. Atoh1 RL neurons do not express Phox2b and have not been shown to be chemosensitive. The green circle identifies the location of preBötzinger Complex (preBötC) Dbx1 neurons hypothesized to generate the cervical (inspiratory) rhythm. The magenta rectangle indicates the location of Retrotrapezoid/Parafacial respiratory group (RTN/pFRG) region neurons hypothesized to generate independent lumbar (expiratory) rhythm. LRN–lateral reticular nucleus, NA–nucleus ambiguus, rVRG–rostral ventral respiratory group, VIIn (VII motor nucleus). Scale bar = 200 µm. (B) Schematic describing the hypothesized glutamatergic coupling between Dbx1 preBötC neurons generating inspiration (green circle–right) and the three candidate glutamatergic RTN/pFRG populations generating expiration (magenta rectangle–left). Colored circles indicate genetic lineage as in (A). (C) Electrophysiological traces (upper–integrated, lower–raw) of spontaneous respiratory-related output from cervical (C4, green) and lumbar (L1, magenta) motor roots as well as EMG recording from the XIth internal intercostal muscle (IC). Cervical roots innervate the diaphragm active during inspiration. Lumbar roots innervate abdominal respiratory muscles active during expiration in adults. Arrows indicate respiratory-related bursts where some respiratory motor pools lack activity. (D) In some fictive breaths, cervical (green), lumbar (magenta), and IC (black) motor outputs are active nearly simultaneously. (E) In other fictive breaths only the cervical root is active. (F–I) Single integrated C-L-IC fictive breaths showing breath-by-breath variations in temporal co-activation between respiratory motor outputs. Note that in some respiratory bursts (G–I) both lumbar (magenta) and IC (black) burst peaks occur before the cervical burst. Also IC activity can occur during both cervical and lumbar bursts (H–I). (J–K) Cartoons indicating how different patterns of respiratory motor output from cervical and lumbar motor pools could be produced by changes in the synaptic strengths of excitatory (dots) or inhibitory (arrowheads) synaptic connections between the putative preBötC Dbx1 inspiratory oscillator, the unknown RTN/pFRG expiratory oscillator, and intervening inhibitory interneurons. Solid lines indicate strong connections, dotted lines indicate weaker connection. Scale bar = 10 s (C), 500 ms (D–I).
Figure 2 with 1 supplement
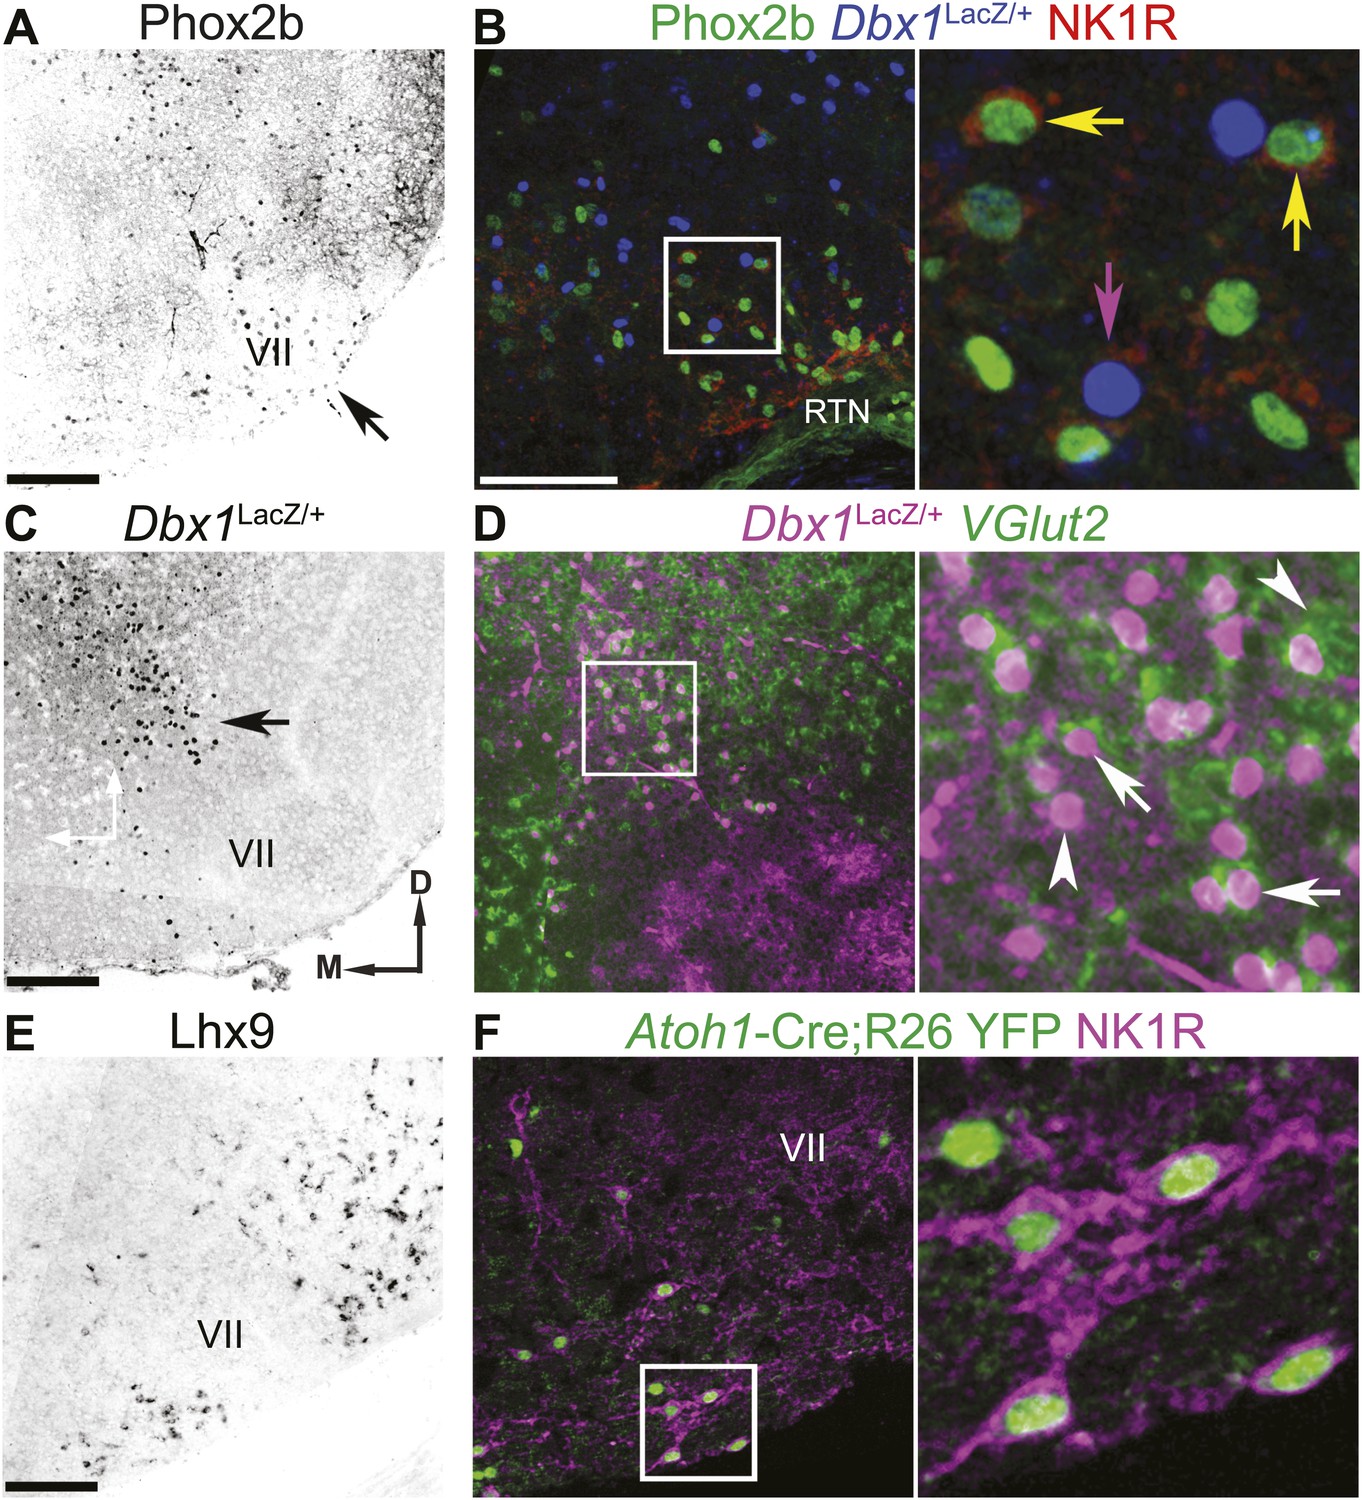
The RTN/pFRG contains three candidate expiratory rhythm generating populations.
(A and B) Phox2b-expressing RTN neurons are located directly ventral to VII motor nucleus (VII) (A–arrow, B–green); many co-express NK1R (B, red). (C and D) Dbx1-dependent LacZ-labeled neurons are located ventral and dorsomedial to VII (C–arrow). RTN/pFRG Dbx1-derived LacZ-expressing neurons (B–blue, D–magenta) co-express NK1R (B–red) and VGlut2 mRNA (D–green) in a P0 Dbx1LacZ/+ mouse (B–D). (E and F) Atoh1-dependent RL neurons are located medial and ventral to VII, and many express Lhx9 mRNA (E) or NK1R (F–magenta) in P0 WT (E) or Atoh1-CreTg;R26 YFP (F–green) mice. Arrows in B and D indicate co-expression, arrowheads indicate lack of co-expression. Squares (B, D, F) are enlarged to right. Scale bars = 200 µm. D-dorsal, M-medial. See Figure 2—figure supplement 1 for the effects of loss of Atoh1 on RTN neurons as well as the loss of Dbx1 on RTN/pFRG VGlut2 expressing neurons.
Figure 2—figure supplement 1
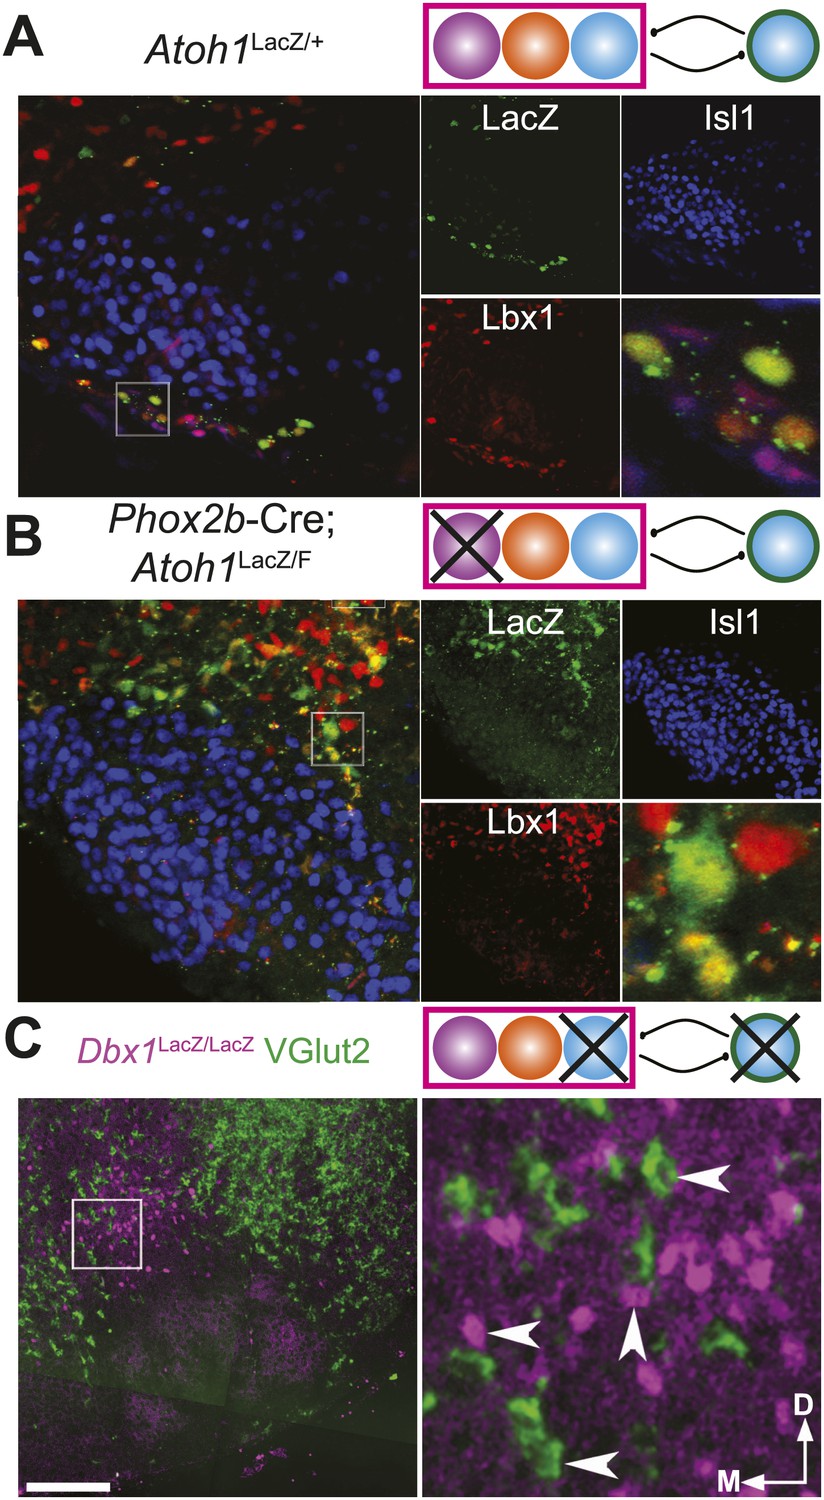
Loss of Atoh1 or Dbx1 eliminates specific RTN/pFRG neuronal populations.
(A) Three color confocal image showing co-expression of Lbx1 (red) in Atoh1-dependent, LacZ (green) expressing neurons in the RTN, ventral to Islet1 (Isl1, blue) expressing VII motoneurons in a P0 Atoh1LacZ/+ mouse. Schematic (upper right) indicates maintenance of all three putative RTN/pFRG developmental lineages. (B) RTN Lbx1 (red) and LacZ (green) co-expressing neurons fail to property migrate ventral to Isl1 expressing VII neurons in E18.5 Phox2b-Cre;Atoh1LacZ/F (RL+/RTN−) mutant mice. Schematic (upper right) indicates selective loss of RTN/pFRG Phox2b neurons (cross through purple RTN population). (C) VGlut2 (green) expressing neurons fail to form dorsomedial to VII in E18.5 Dbx1LacZ/LacZ mutant mice. Note the maintenance of LacZ+ VGlut2− cells in the RTN/pFRG region (magenta). Schematic (upper right) indicates selective loss of RTN/pFRG and preBötC Dbx1 neurons (crosses through blue Dbx1 populations). Single color images (A and B) are shown to right. Boxes (A–C) are expanded to far right. Scale bar = 200 µm.
Figure 3
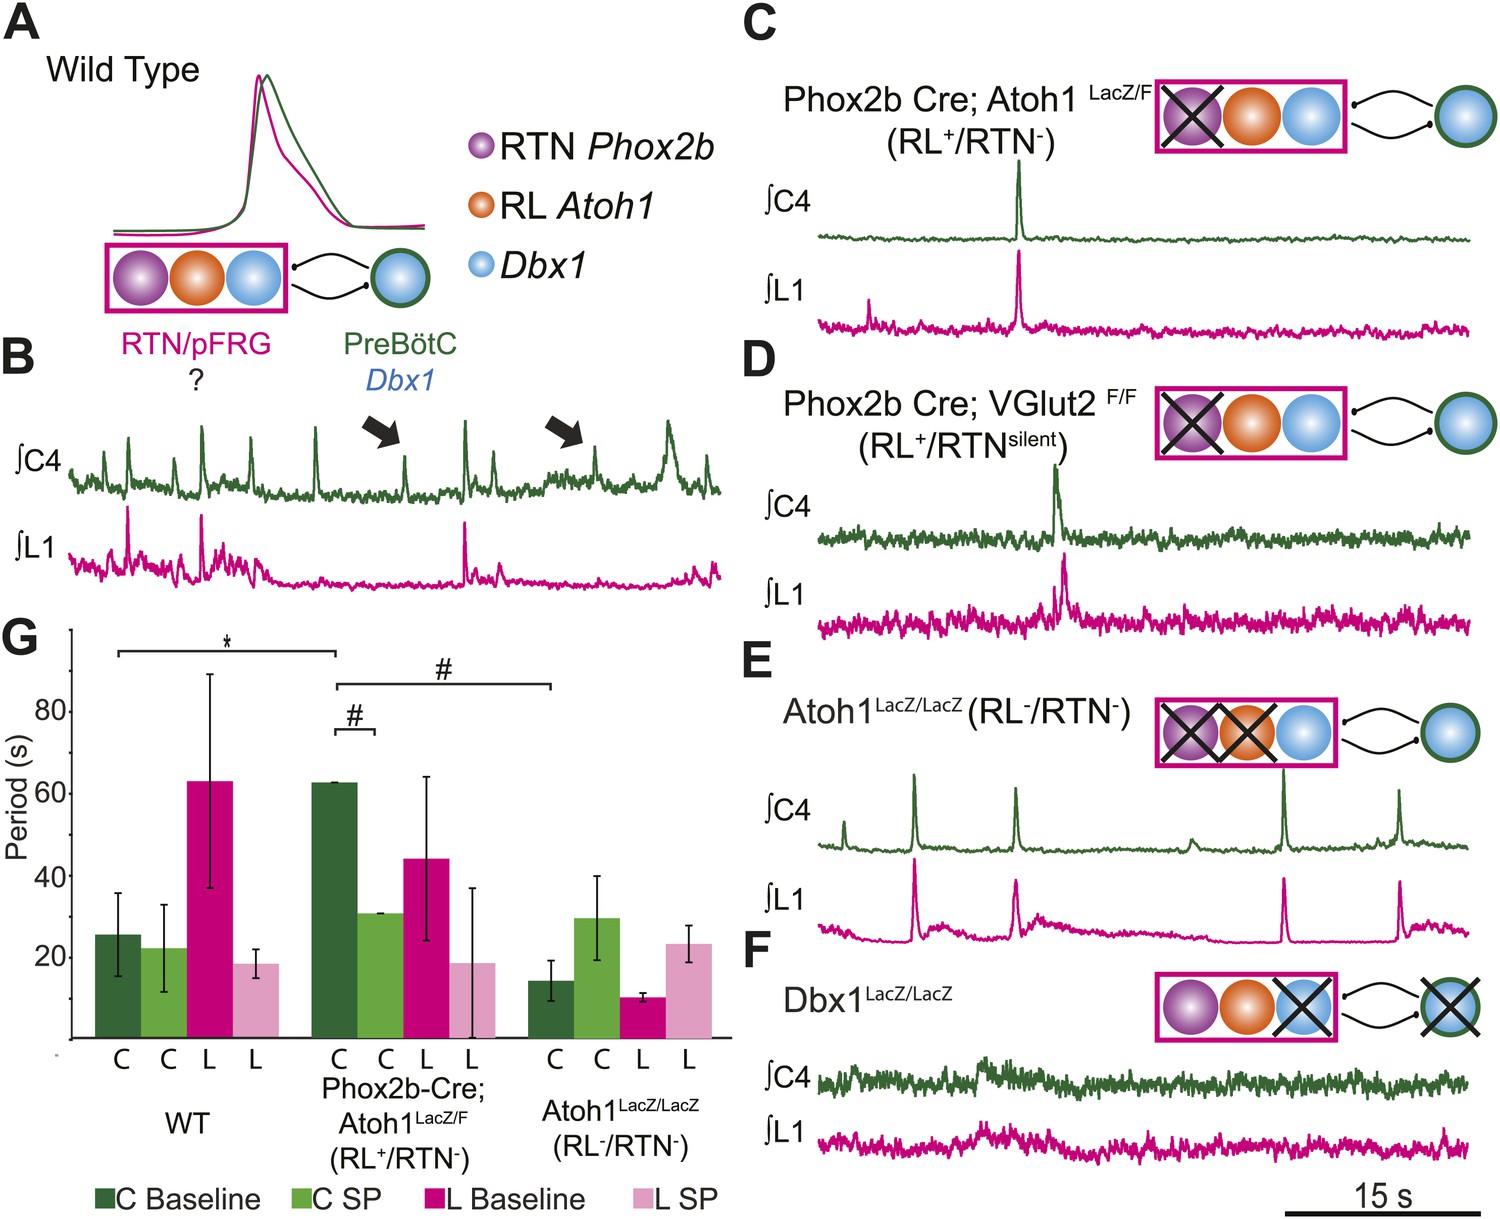
RL and RTN neurons are neither necessary nor sufficient for lumbar respiratory output.
(A) Schematic cartoon describing populations targeted for genetic elimination to determine necessity for generating cervical (green) and/or lumbar (magenta) respiratory output. Colored filled circles indicate the developmental origin of RL Atoh1 (orange), RTN Phox2b (purple), or Dbx1 (blue) derived neurons with schematic as in Figure 1B. (B) 50 s integrated recordings of spontaneous respiratory output from cervical (C4, green) and lumbar (L1, magenta) motor roots in an E18.5 WT isolated hindbrain-spinal cord preparation showing normal lumbar-cervical coordinated respiratory output. Upward deflections indicate respiratory-related events. Arrows indicate fictive breaths where cervical output is not matched by lumbar output. Targeted ablation (C, Phox2b-Cre;Atoh1LacZ/F [RL+/RTN−]) or silencing (D, Phox2b-Cre;VGlut2F/F [RL+/RTNsilent]) of RTN Phox2b neurons does not eliminate lumbar respiratory output. Schematics (C–D, upper right) indicate targeted loss of Phox2b RTN neurons (purple). Note the marked increase in respiratory period (i.e., slowing of frequency). (E) Loss of both RTN Phox2b and RL Atoh1 neurons in Atoh1LacZ/LacZ (RL−/RTN−) mice similarly does not eliminate lumbar respiratory output. Schematic (upper right) indicates targeted loss of both Phox2b RTN (purple) and RL Atoh1 neurons (orange). (F) Loss of Dbx1-dependent neurons in Dbx1LacZ/LacZ mice eliminates both lumbar and cervical respiratory outputs. Schematic (upper right) indicated targeted loss of Dbx1 neurons (blue). Scale bar = 15 s. (G) Loss of RTN Phox2b neurons slows the respiratory rhythm, thus increasing the cervical period. Bar graphs show least-squares mean (LSMEAN) of respiratory periods in seconds (±SEM) during baseline (cervical–[C], dark green, lumbar–[L], magenta) or in the presence of 1 µm SP (cervical–[C], light green, lumbar–(L), pink) in wild-type (WT) (n = 6), Phox2b-Cre;Atoh1LacZ/F (RL+/RTN−) (n = 4), and Atoh1LacZ/LacZ (RL−/RTN−) (n = 5) mice. Top brackets indicate statistical test groups (*p<0.05, #p<0.001; mixed random effects ANOVA).
Figure 4 with 2 supplements
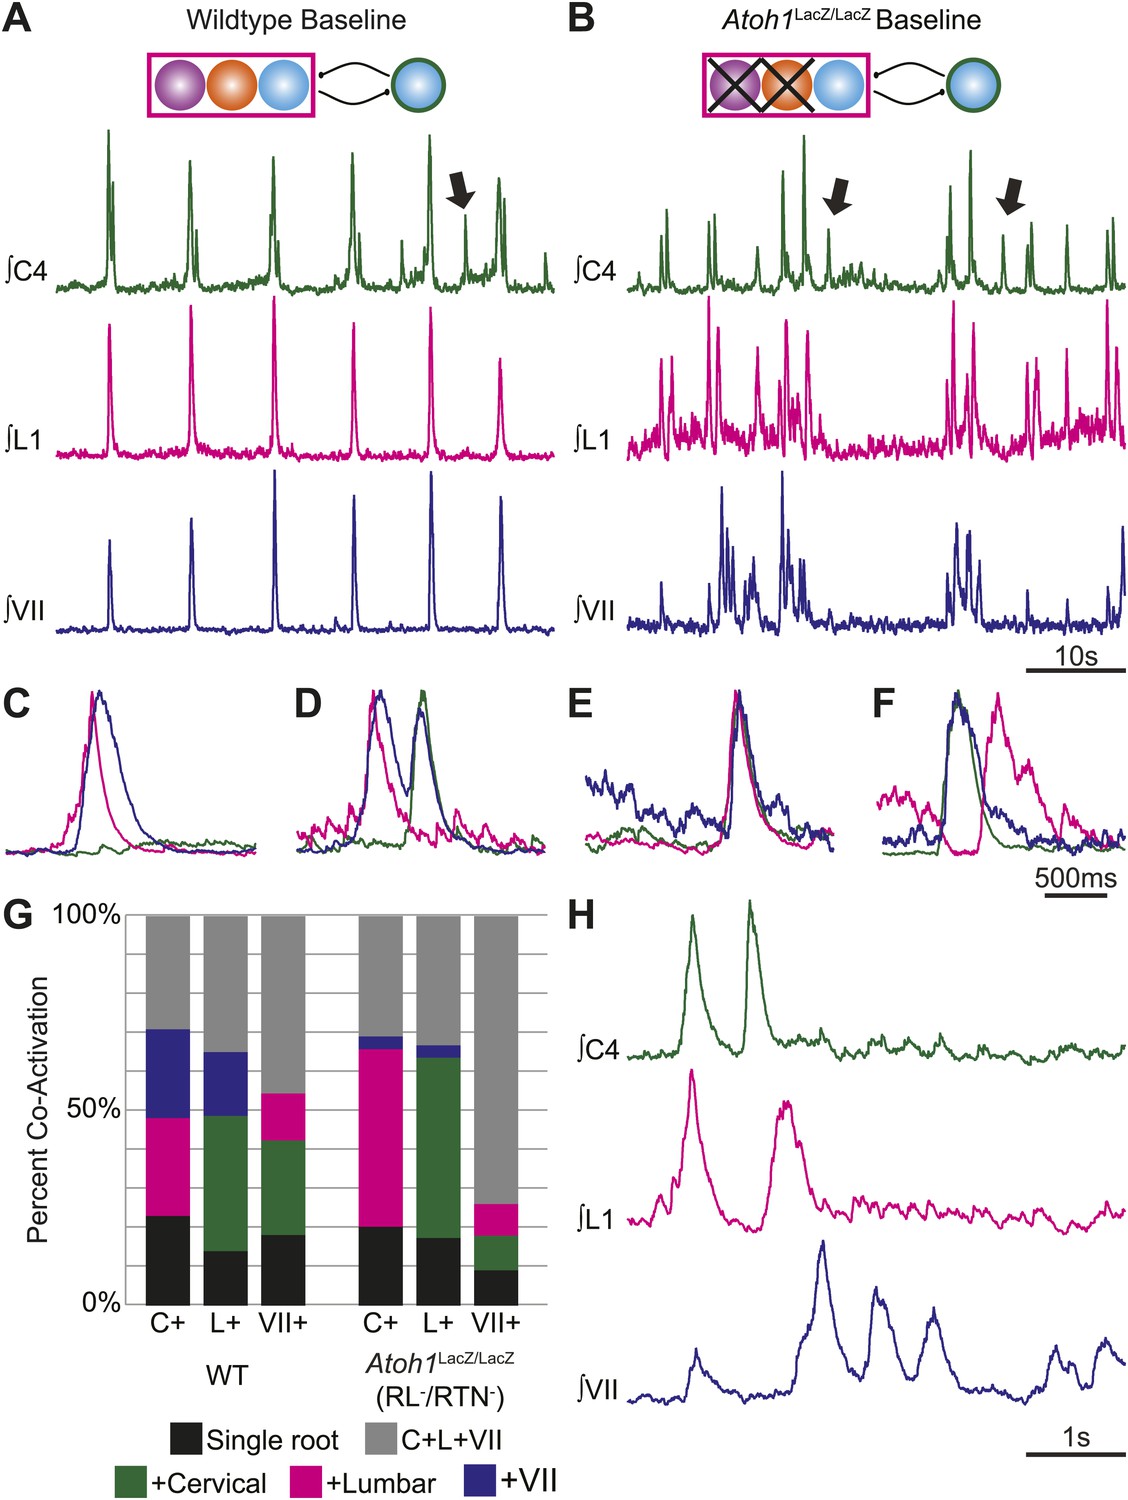
RL and RTN neurons are not essential for the expression or independence of cervical, lumbar, or VII respiratory motor outputs.
(A) E18.5 WT mice show respiratory co-activation of cervical (green), lumbar (magenta), and/or VII (dark blue) motor roots. Schematic (top) indicates maintenance of all RTN/pFRG and preBötC glutamatergic lineages. (B) Targeted loss of RL and RTN neurons in Atoh1LacZ/LacZ (RL−/RTN−) mice does not eliminate respiratory co-activation of cervical, lumbar, and/or VII respiratory outputs. Schematic (top) indicates targeted loss of Phox2b RTN (purple) and Atoh1 RL (orange) neurons. Arrows (A and B) indicate respiratory cervical outputs lacking lumbar or VII output. During single respiratory bursts, each motor pool can be co-active nearly simultaneously, with a temporal delay, or can be silent in relation to each other motor pool in WT (C and D) or in the absence of both RTN and RL neurons (E and F). (G) Stacked histograms showing the percentage of fictive breaths from each individual motor pool (cervical–C+, lumbar–L+, VII–VII+) where that motor pool fires either alone (bottom–black), fires with one of the two other motor roots (middle two bars, +cervical–green, +lumbar–magenta, +VII–dark blue), or where all three roots are co-active (top, C+L+VII–gray) from WT (left) or in Atoh1LacZ/LacZ (right) mice. Note the loss of RL and RTN neurons only affects the relative percentage of coupling. Scale bars = 10 s (A and B), 500 ms (C–F), 1 s (H). See Figure 4—figure supplements 1A–L for additional examples of the independence of respiratory motor pool co-activation in WT and Atoh1LacZ/LacZ mice. See Figure 4—figure supplements 2A–C for examples of independent lumbar activation and quantification of cervical and lumbar deletions in Phox2b-Cre;Atoh1LacZ/F (RL+/RTN−) mice.
Figure 4—figure supplement 1
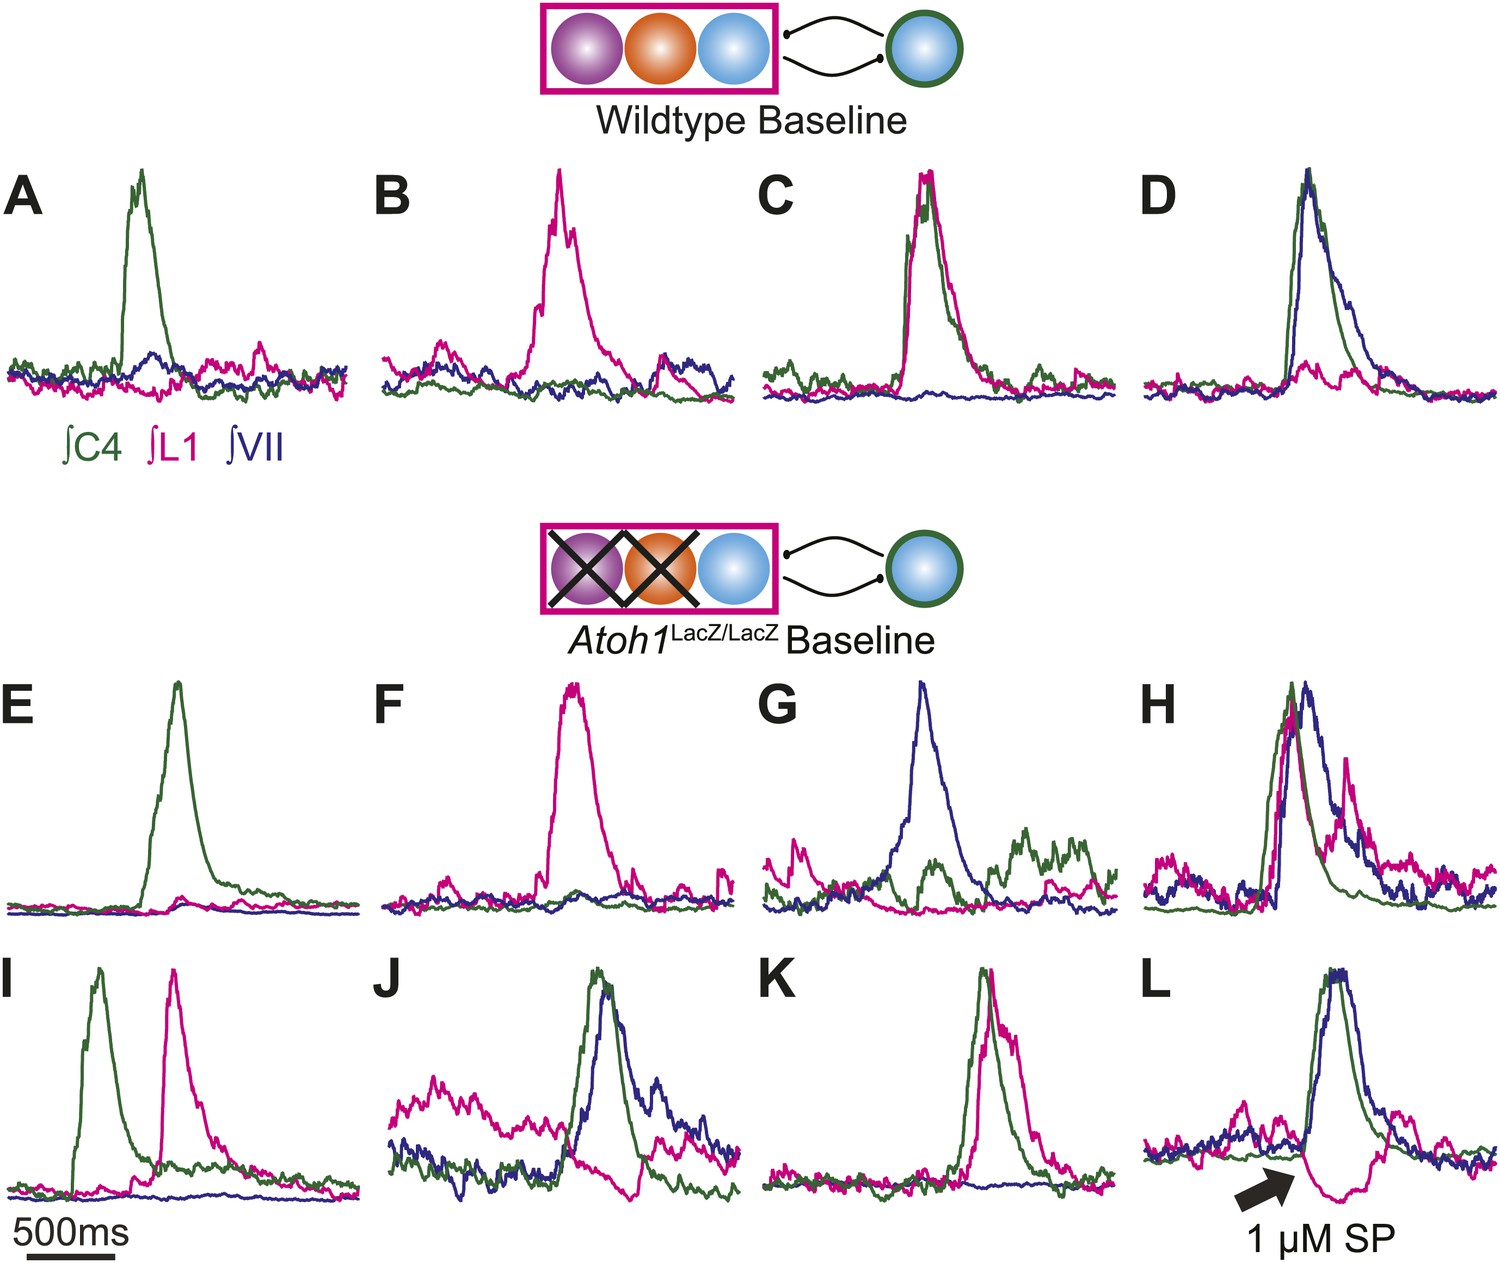
Maintenance and independence of multiple respiratory motor outputs in RL−/RTN− mice.
Overlaid integrated cervical (green), lumbar (magenta), and VII (dark blue) fictive breaths from WT (A–D) or Atoh1LacZ/LacZ (E–L) mice showing the range of independence and co-activation of each motor root during single respiratory bursts. Schematics indicate maintenance (top) or targeted loss (middle) of Phox2b RTN (purple), Atoh1 RL (orange), or Dbx1 (blue) populations in WT (top) or Atoh1LacZ/LacZ (RL−/RTN−) mice. Arrow in L indicates maintenance of active inhibition of lumbar output during cervical and VII co-activation in the presence of 1 µM SP. Scale bar = 500 ms.
Figure 4—figure supplement 2
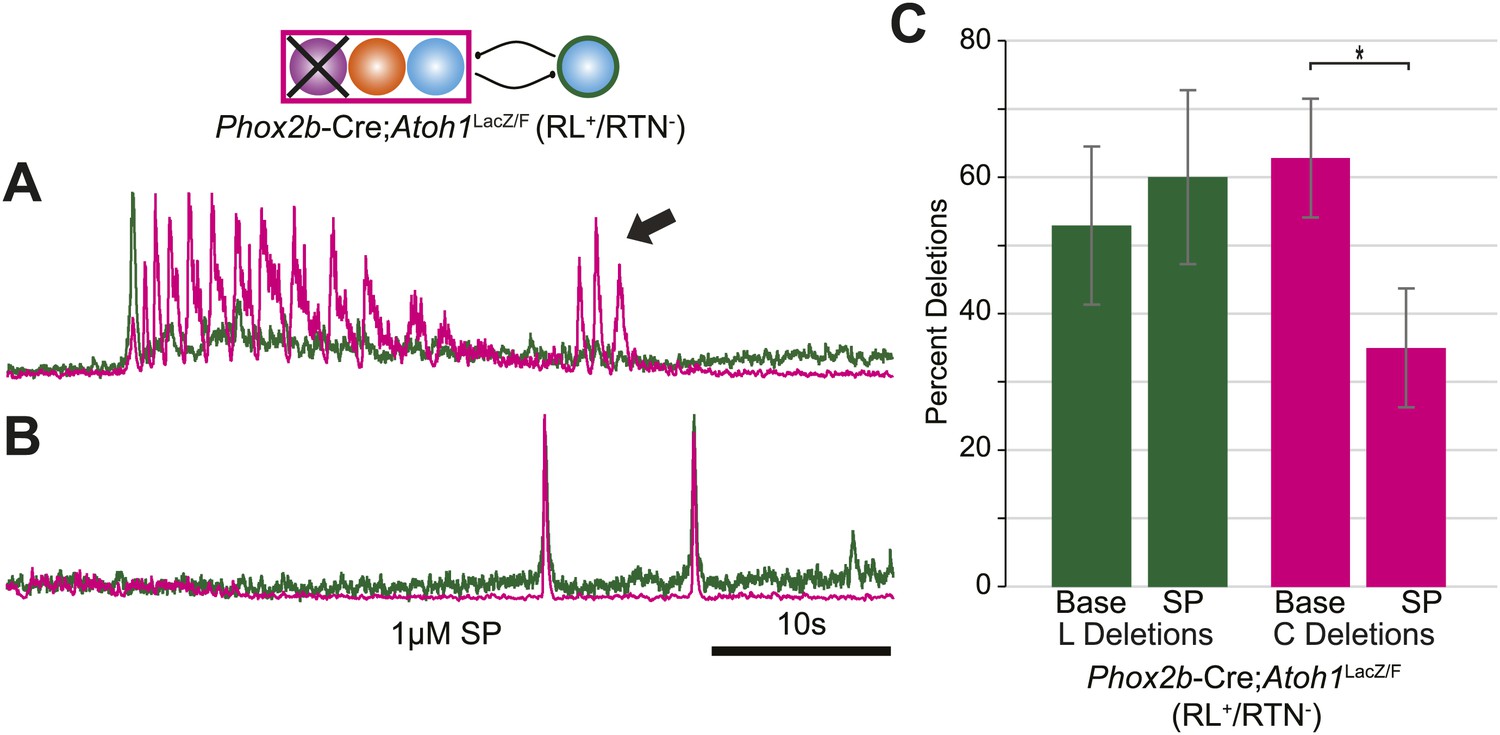
Independent lumbar oscillator is transiently released in RL+/RTN− mice.
(A) Loss of RTN neurons transiently releases independent lumbar output (arrow) in Phox2b-Cre;Atoh1LacZ/F mice, which is eliminated after application of SP to the hindbrain (B). Schematic (top) indicates the targeted loss of Phox2b RTN neurons (purple). Scale bar = 10 s. (C) Bar graph showing LSMEAN percentage of cervical bursts without lumbar output (lumbar deletion) (left) and lumbar bursts without cervical output (cervical deletions, right) for E18.5 RL+/RTN− mice (n = 5). Top bracket indicates statistically significant differences between treatments (*p<0.05; mixed random effects ANOVA).
Figure 5 with 1 supplement
Atoh1 neurons are necessary for biphasic cervical sigh-like fictive breaths.
E18.5 WT mice produce biphasic respiratory-related cervical bursts (C4, green) with lumbar (L1, magenta) activation only during the initial normal amplitude cervical burst under baseline (A) or in the presence of 1 µM SP (B). Arrow in B indicates likely active inhibition of lumbar root during the larger amplitude cervical burst peak. (C) Biphasic cervical bursts persist after loss of RTN neurons in Phox2b-Cre;Atoh1LacZ/F (RL+/RTN−) mice with the lumbar burst occurring during the larger amplitude burst. Schematics indicate maintenance (top left) or targeted loss (right) of Phox2b RTN (purple) populations in WT or Phox2b-Cre;Atoh1LacZ/F (RL+/RTN−) mice. (D–E) In contrast to lumbar respiratory output (magenta), XIth internal intercostal (D, IC, black), or VIIn (E, VII, dark blue) can occur during both the initial and larger amplitude cervical burst (green) in E18.5 WT (D) or control Atoh1LacZ/+ heterozygote (E). Note the co-activation of cervical and VII roots during lumbar inhibition (E). (F–I) Atoh1LacZ/LacZ (RL−/RTN−) mice do not exhibit biphasic respiratory cervical bursts. Schematic indicates targeted loss of Phox2b RTN (purple) and Atoh1 RL (orange) neurons. (F–G) Single integrated traces showing temporal separation between cervical (green) and lumbar (magenta) peaks due to increased noise (arrows). Numbers under traces indicate time of the lumbar peak in relation to the cervical peak (in ms). In some fictive breaths, Atoh1LacZ/LacZ mice show respiratory doublets with two distinct cervical outputs with likely lumbar inhibition (arrow in I) during the initial burst in the presence of 1 µM SP (H) or 10−12 M SST (I). Scale bar = 1 s. Figure 5—figure supplement 1 shows the variability in amplitude and pattern of biphasic cervical bursts other respiratory bursts during baseline rhythmic activity as well as average and overlapping standard and biphasic bursts in a E18.5 WT mouse preparation.
Figure 5—figure supplement 1
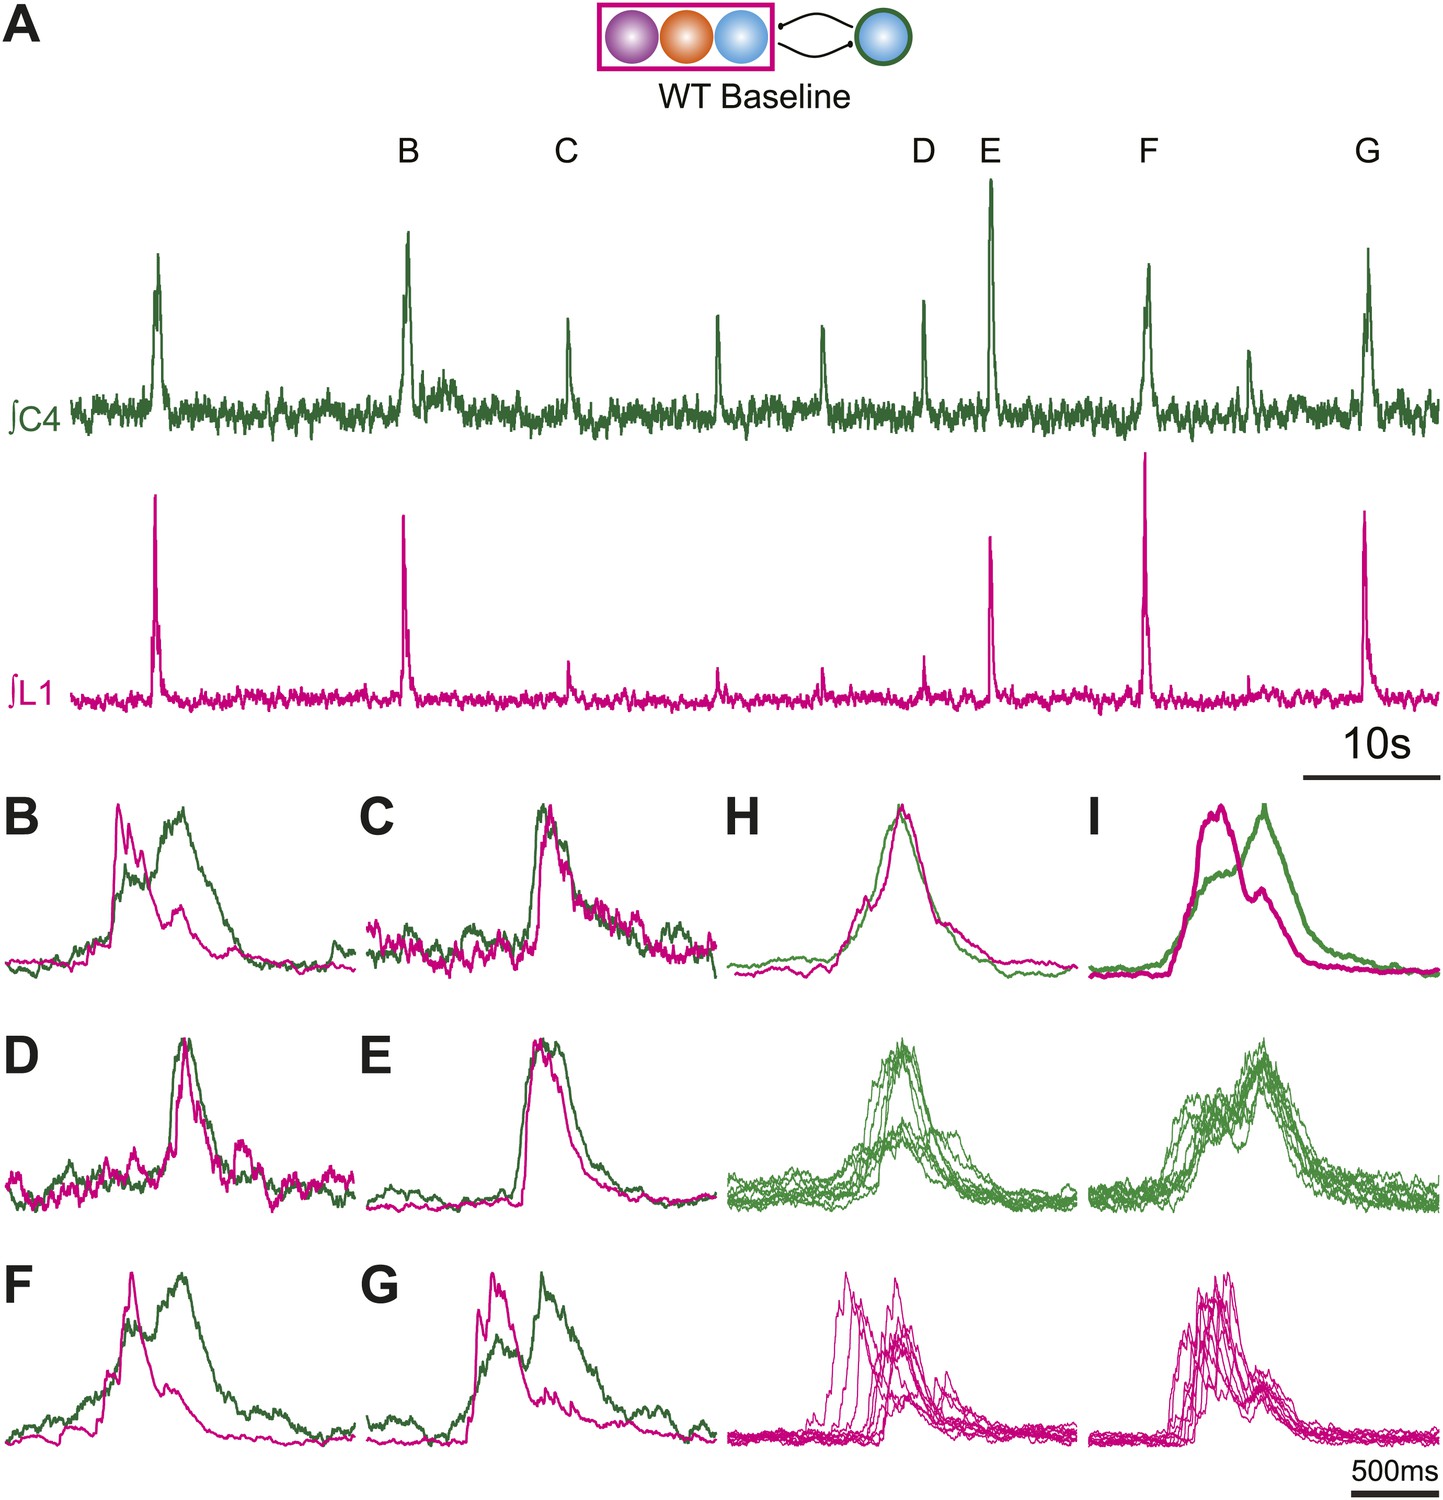
Normal and biphasic cervical respiratory bursts show different cervical and lumbar patterns and vary in amplitude during fictive breathing in an E185 mouse brainstem preparation.
(A) 100 s recording of integrated endogenous respiratory-related output from cervical (C4, green) and lumbar (L1, magenta) motor roots in an E18.5 WT mouse brainstem-spinal cord preparation. Letters above peaks (B–G) are expanded below for clarity. Note the variations in amplitude of both cervical and lumbar bursts. (B–G) 2 s overlapping traces of integrated cervical and lumbar motor output expanded from A. Peaks have been scaled to the same height for ease of comparison of the patterns of activity. Biphasic cervical bursts (B, F–G) show lumbar activity primarily during the initial cervical peak. Note that some fictive breaths that do not show biphasic cervical activity can have either smaller (C–D) or larger (E) amplitude motor output than biphasics bursts. Scale bar 10 s (A), 500 ms (B–G). (H) Integrated average top and overlapped cervical (middle, green) and lumbar (bottom, magenta) traces from 10 consecutive fictive breaths lacking biphasic cervical output. Note the variation in amplitude in cervical traces. Integrated average traces are scaled for clarity. (I) Integrated average top and overlapped cervical (middle, green) and lumbar (bottom, magenta) traces from 10 sequential, but not consecutive, fictive breaths showing biphasic cervical output.
Figure 6 with 1 supplement
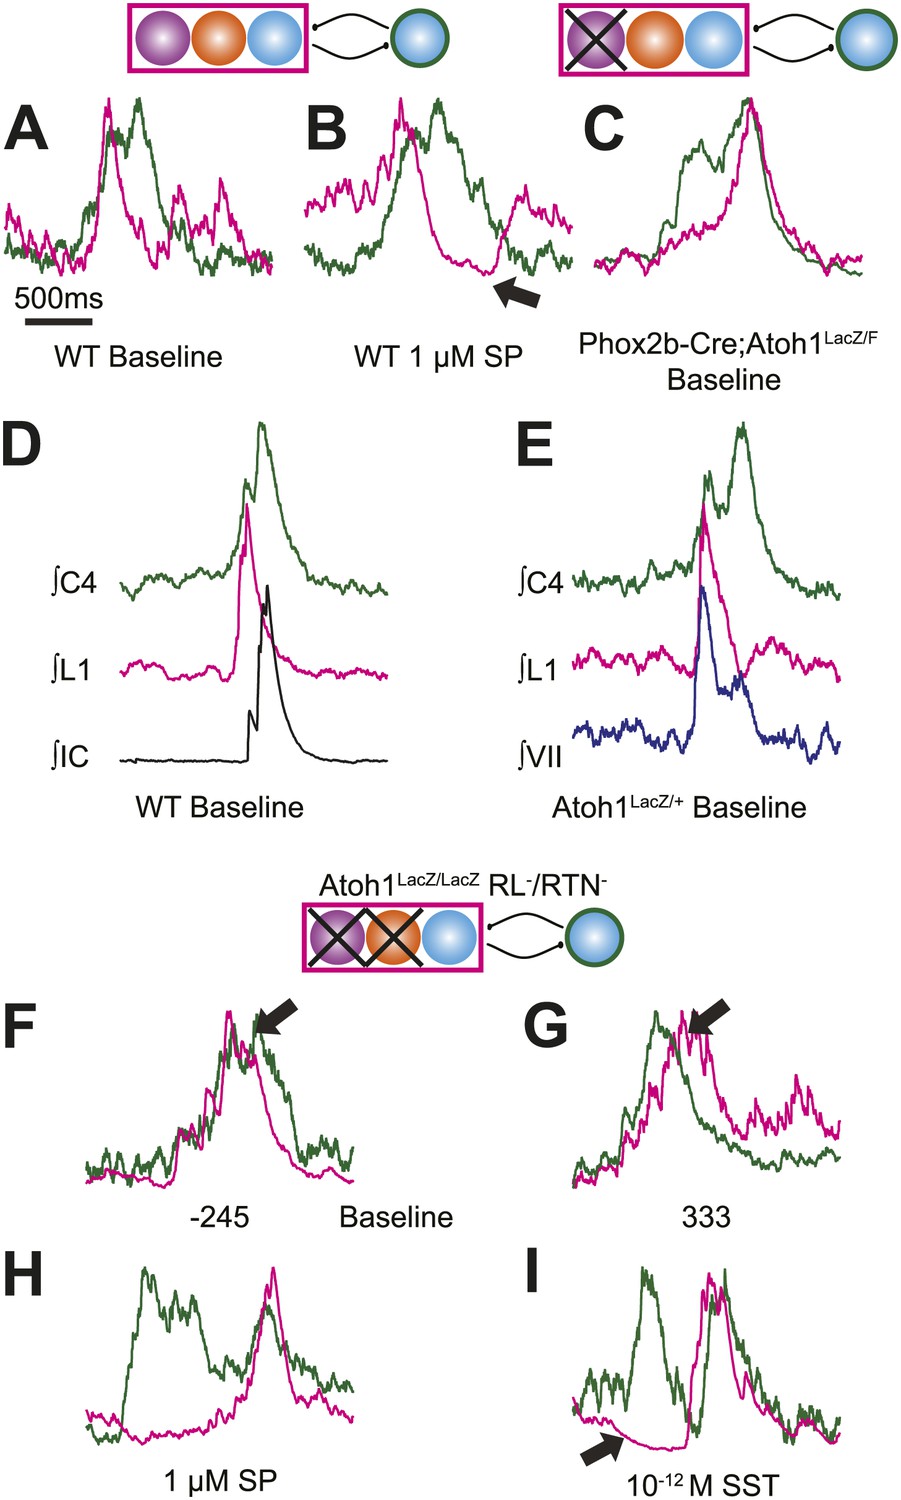
Rhombic lip, Atoh1-dependent neurons are necessary for normal cervical-lumbar temporal lag.
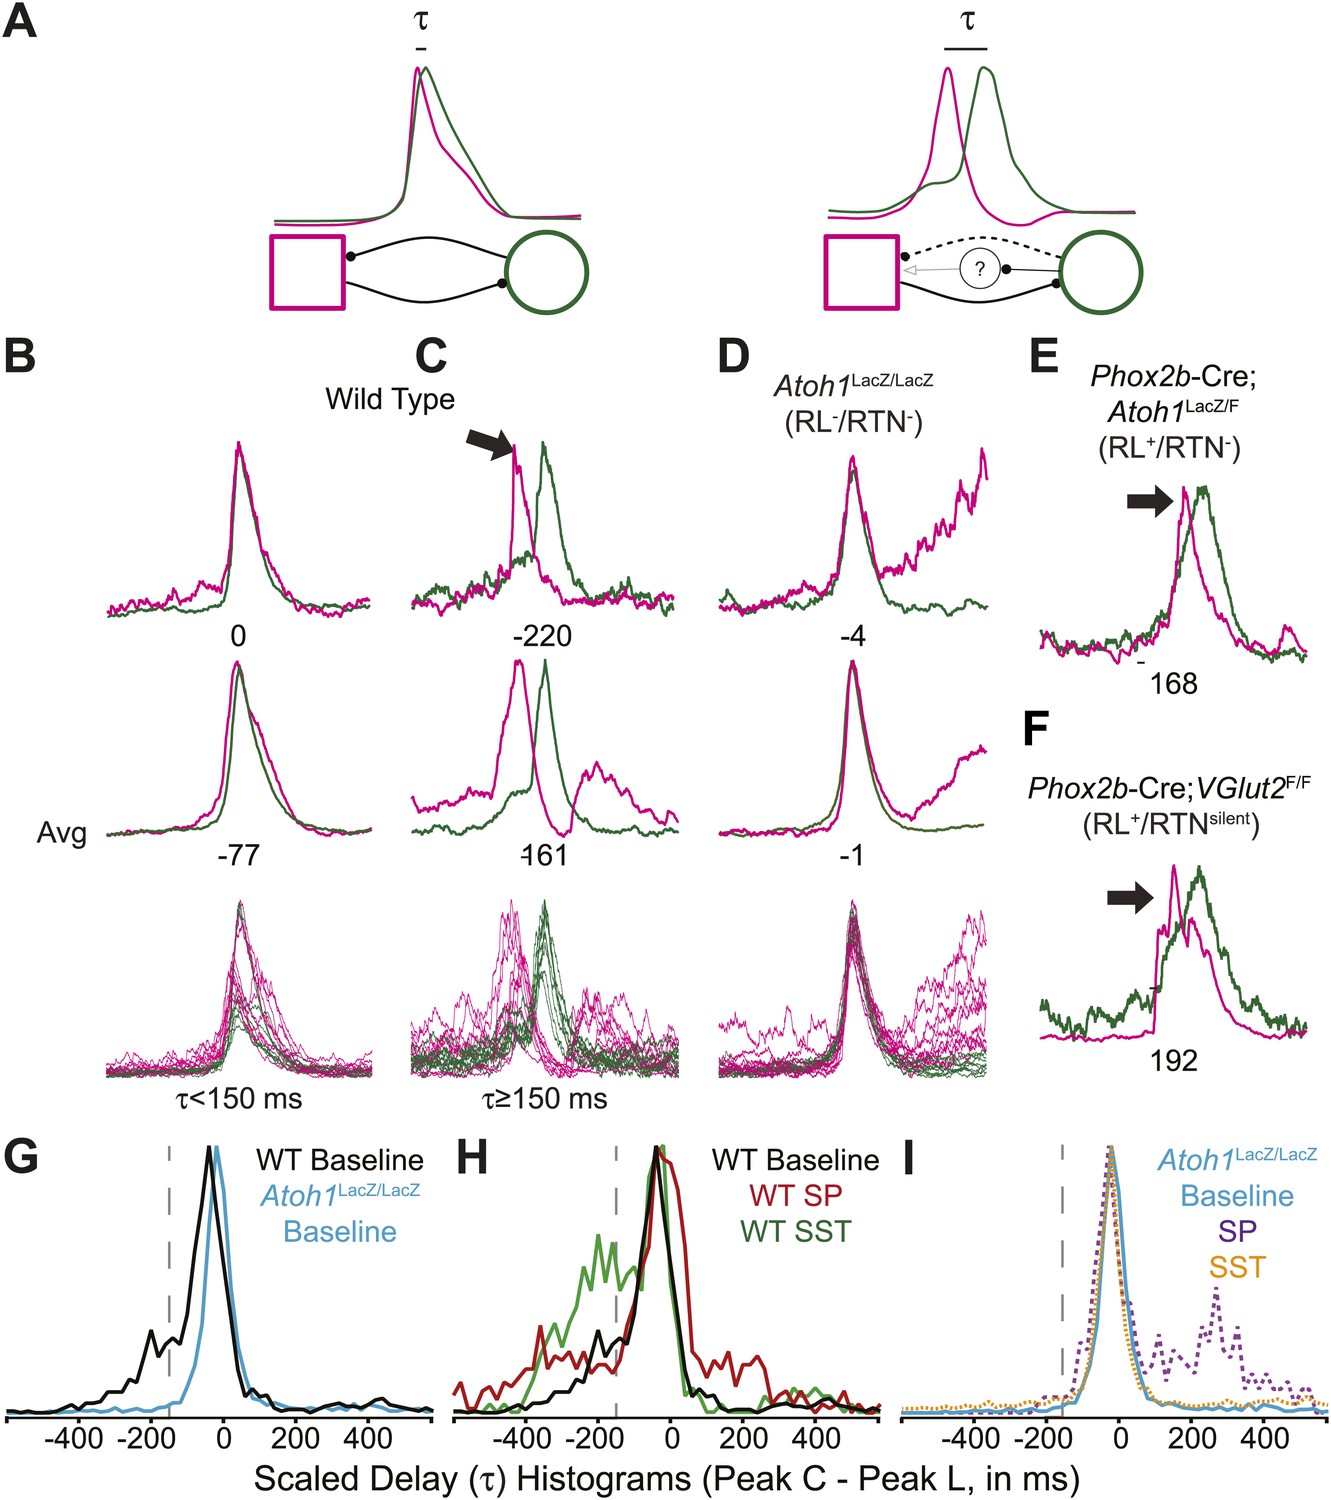
(A) Cartoons showing hypothesized network interactions (bottom) between putative independent lumbar (magenta square) and cervical (green circle) oscillators and unknown inhibitory interneurons, together generating two distinct temporal patterns of cervical (green) and lumbar (magenta) respiratory co-activation (top). These different networks produce motor outputs that differ in the relative time between their peaks (lumbar time-cervical time = τ, in ms). (B–D) Integrated and overlapped cervical and lumbar traces from 10 consecutive (B, WT–τ <150 ms), sequential but not consecutive (C, WT–τ ≥150 ms), or consecutive (D, Atoh1LacZ/LacZ [RL−/RTN−]) respiratory-related bursts aligned from the peak of cervical output (top–single burst, middle–average of 10 breaths, bottom–overlap of 10 bursts, numbers under traces = τ). Note the low level pre-inspiratory activity of the cervical trace during the lumbar burst as well as likely inhibition during the cervical burst in wild-type mice (C), but the strong simultaneous co-activation of lumbar and cervical outputs in Atoh1LacZ/LacZ mice (D). Partial peak delays are still present in E18.5 Phox2b-Cre; Atoh1LacZ/F (RL+/RTN−, E), and Phox2b-Cre;VGlut2F/F mice (RL+/RTNsilent, F) indicating Phox2b RTN neurons are not essential for temporal delay. (G–H) Histograms (12 ms bins) showing distributions of τ for WT (G–H) and Atoh1LacZ/LacZ (G and I) mice to determine whether loss of RL and RTN neurons affects τ. Distributions are scaled to same height for better comparison. Gray dashed line indicates τ = −150 ms cutoff. Note the clear differences in the peak and spread between baseline WT and Atoh1LacZ/LacZ distributions (G). WT but not Atoh1LacZ/LacZ distributions show increased temporal delay after application of 1 µM SP or 10−12M SST (H–I). Histogram color: WT (baseline–black, SP–red, SST–green), Atoh1LacZ/LacZ (baseline–cyan, SP–purple dashed, SST–orange dashed). See Figure 6—figure supplement 1 for traces showing the absence of effect of SP or SST on temporal delay (τ) in Atoh1LacZ/LacZ mice.
Figure 6—figure supplement 1
Peptides do not induce cervical-lumbar temporal delay in Atoh1LacZ/LacZ (RL−/RTN−) mice.
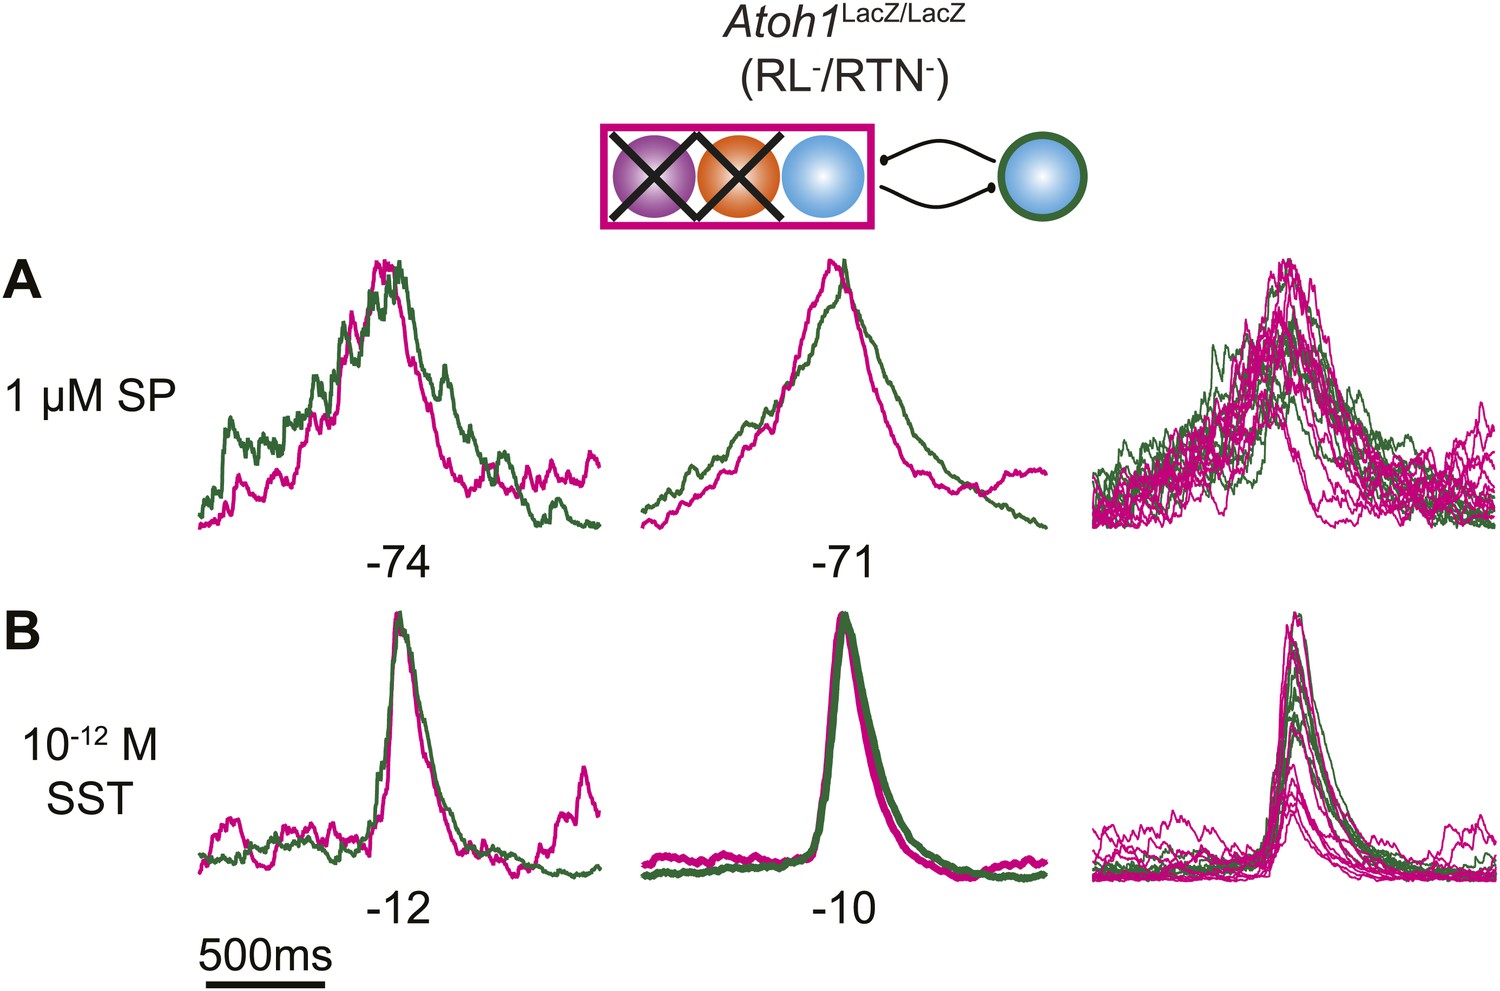
Schematic (top) indicates targeted loss of both Phox2b RTN neurons (purple) and RL Atoh1 neurons (orange). Overlapped integrated cervical (green) and lumbar (magenta) bursts showing lack of temporal delay in E18.5 Atoh1LacZ/LacZ preparations in the presence of 1 µM SP (A) or 10−12M SST (B). Integrated traces from single fictive breaths (left), average trace of 10 consecutive bursts (middle), and overlap of 10 bursts (right) aligned from the peak of cervical output. Numbers under traces indicate time of integrated lumbar peak relative to cervical peak (τ, in ms). Scale bar = 500 ms.
Figure 7
Loss of RL and RTN neurons does not change the phase relationship between putative respiratory oscillators.
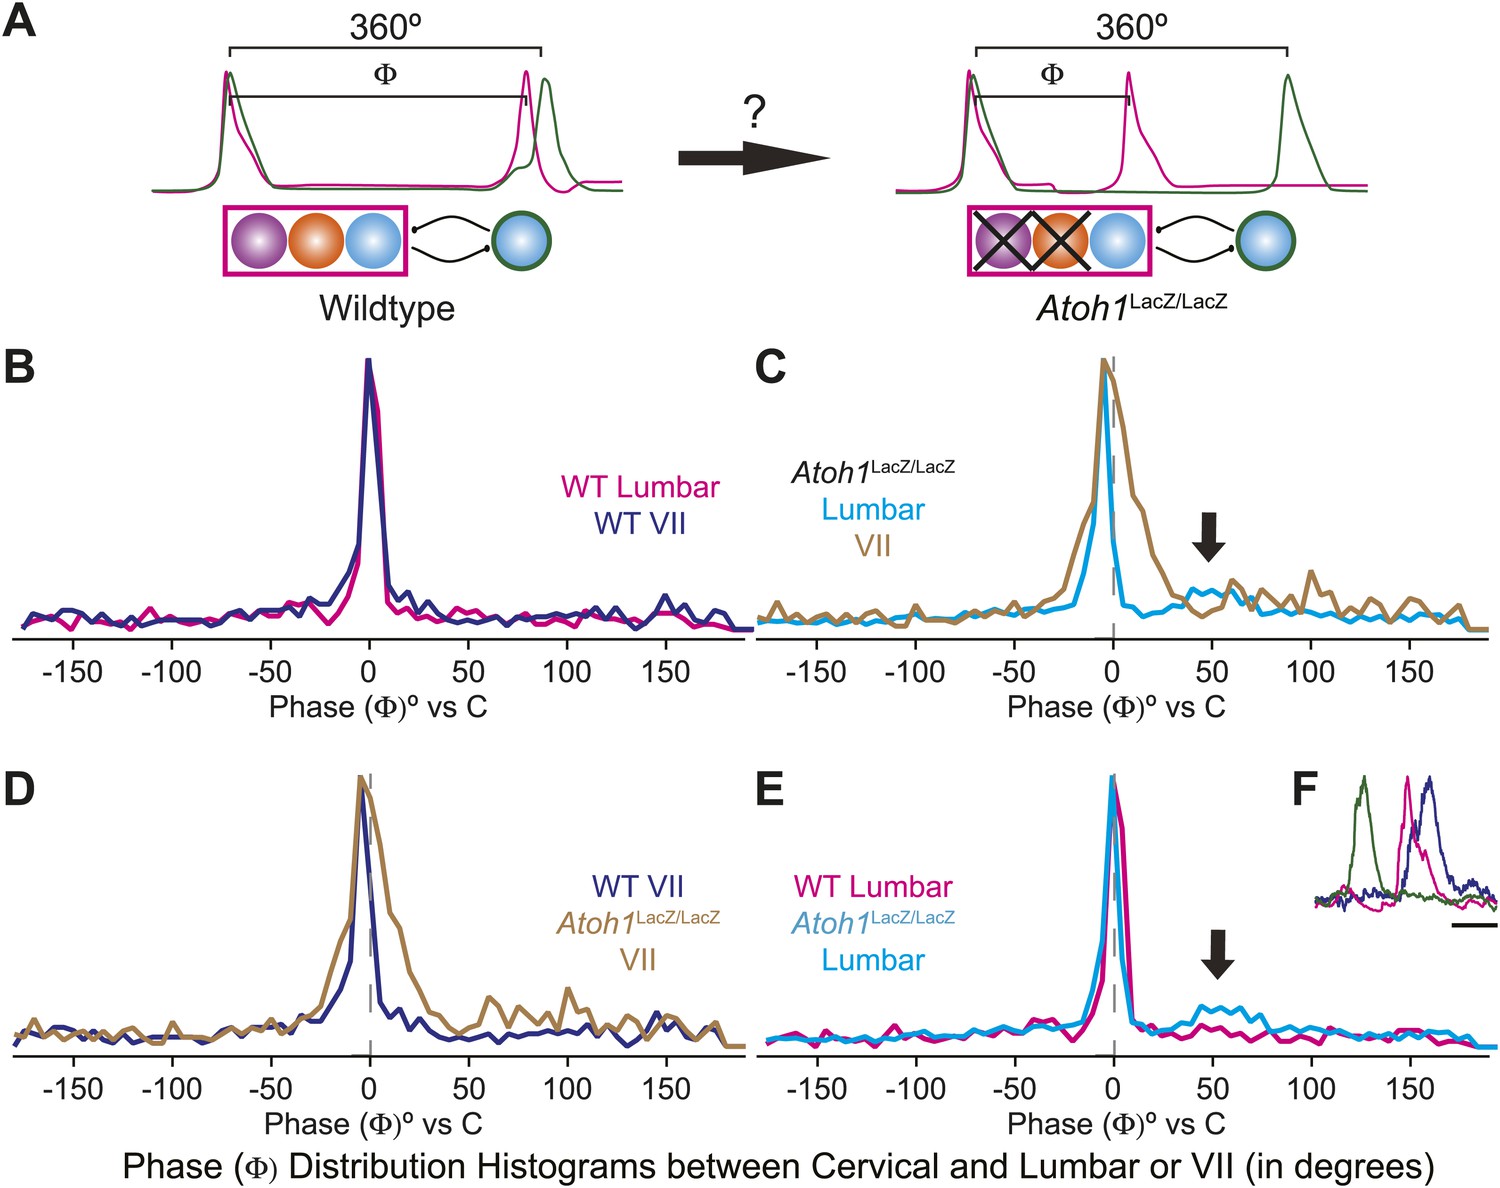
(A) Cartoons indicating how relative phase (Φ, in degrees) between cervical burst peaks and either lumbar or VII respiratory peaks for each fictive breath are calculated (left) and possible change in phase relationships after loss of RL and RTN neurons (right). Schematics (top right) indicate targeted loss of Phox2b RTN (purple) and Atoh1 RL (orange) neurons. (B) Histogram (5° bins) showing the distributions of phase relationship (Φ) between cervical and either lumbar (magenta) or VII (dark blue) peaks indicating consistent temporal delays between outputs in WT mice. (C) Phase relationships (Φ) between cervical and either lumbar (cyan) or VII (tan) outputs indicate a maintenance in phase relationships between respiratory outputs in Atoh1LacZ/LacZ (RL−/RTN−) mice. (D) Loss of RL/RTN neurons broadens the phase relationship (Φ) of cervical-VII root activation compared to WT. (E). Loss of RL/RTN neurons does not effect phase (Φ) of most lumbar bursts but introduces a occasional Atoh1LacZ/LacZ specific burst pattern (arrow in C and E, F) with the cervical burst (green) followed by a pause then overlapping lumbar (magenta) and VII (dark blue) bursts. Scale bar = 500 ms.
Figure 8
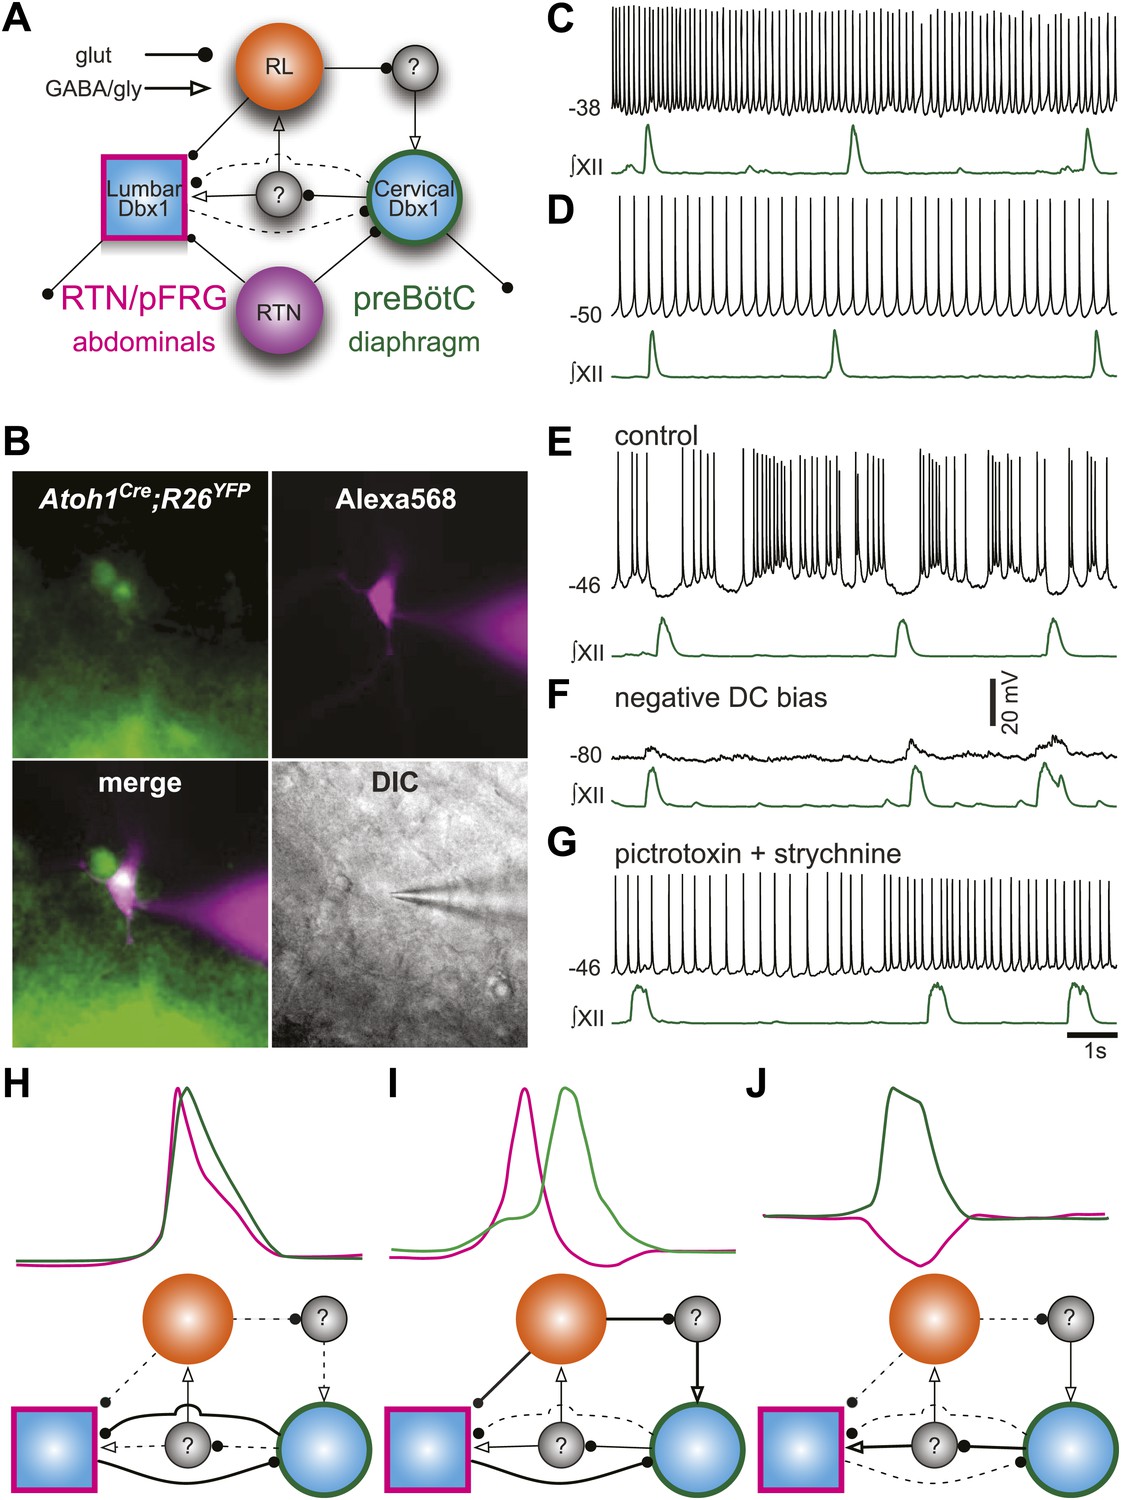
Proposed respiratory network underlying temporal relationship between inspiratory and expiratory respiratory oscillators.
(A) Putative cervical (preBötC, green circle) and lumbar (RTN/pFRG, magenta square) oscillators contain Dbx1-derived neurons (blue filled circles) and drive expiratory (magenta, abdominals) and inspiratory (green, diaphragm) muscles. The preBötC is asymmetrically coupled to RTN/pFRG neurons via unknown inhibitory interneurons (gray filled circles). Phox2b RTN neurons (purple) provide excitatory drive to both oscillators. Atoh1 RL neurons (orange) excite the RTN/pFRG oscillator. Lines with circles indicate glutamatergic connections. Lines with arrowheads indicate inhibitory GABA/glycine connections. Black lines indicate strong synaptic connections. Dashed lines indicate weak synaptic connections. (B) EYFP-labeled neurons (green) within the BötC area of an Atoh1-Cre;R26 EYFP slice preparation. The recorded neuron was filled with Alexa 568 (magenta) through whole-cell patch dialysis. The merged pseudo-color fluorescence and transmitted light IR-DIC images of the recorded neuron are also shown. (C–F) Current-clamp recordings of BötC Atoh1 neurons (black, top). The corresponding integrated inspiratory activity is shown as ∫XII (bottom, green). The majority of Atoh1 neurons show tonic non-respiratory activity (C–D). (E) Recording of an expiratory Atoh1 neuron (from B) with rhythmic inhibition during inspiration. (F) Inhibitory inspiratory drive reverses with current bias to achieve a baseline membrane potential of −80 mV. Voltage scale bar = 20 mV. (G) Inhibitory inspiratory drive is eliminated with bath application of picrotoxin/strychnine. Scale bar = 1 s. (H–J) Cartoons showing hypothesized network reorganizations (bottom) underlying cervical (green) and lumbar (magenta) bursts (top). (H) Outputs without temporal lag are mediated by weak Atoh1 RL and inhibitory inputs and strong RTN/pFRG and preBötC excitatory coupling. (I) Fictive breaths with temporal delay between cervical and lumbar motor outputs have strong Atoh1 excitation of RTN/pFRG Dbx1 neurons and produce phasic inhibition of preBötC neurons. During the cervical burst, strong preBötC-mediated excitation of inhibitory interneurons leads to silencing of lumbar outputs. (J) Fictive breaths with lumbar inhibition during cervical bursts are due to weak Atoh1 RL neuron output and strong preBötC-mediated excitation of inhibitory interneurons leads to silencing of lumbar outputs. Lines define connectivity as in (A).
Tables
Table 1
Baseline percentage of simultaneous co-activation for zero, one, or two other motor pools between cervical, lumbar, and VII respiratory outputs in E18.5 WT mice
| Percentage of Co-activation | ||||
|---|---|---|---|---|
| +Cervical | +Lumbar | +VII | C+L+VII | |
| Cervical | 23 ± 5.8 | 25.1 ± 11.6 | 22.8 ± 9.7 | 29.2 ± 9 |
| Lumbar | 34.7 ± 17.5 | 14 ± 6.3 | 16.4 ± 8.4 | 34.9 ± 11.7 |
| VII | 24.9 ± 9 | 12.3 ± 4.5 | 18.6 ± 10.4 | 46.7 ± 11.3 |
Table 2
Baseline percentage of simultaneous co-activation with zero, one, or two other motor pools between cervical, lumbar, and intercostal XI (ICX1) respiratory outputs in E18.5 WT mice
Table 3
Baseline percentage of simultaneous co-activation for zero, one, or two other motor pools between cervical, lumbar, and VII respiratory outputs in E18.5 Atoh1LacZ/LacZ (RL−/RTN−) mice
Table 4
Percentage change between WT and E18.5 Atoh1LacZ/LacZ (RL−/RTN−) mice of baseline simultaneous co-activation for zero, one, or two other motor pools between cervical, lumbar, and VII respiratory outputs
| Percentage change of co-activation between WT and E18.5 Atoh1LacZ/LacZ (RL−/RTN−) mice. | ||||
|---|---|---|---|---|
| +Cervical | +Lumbar | +VII | C+L+VII | |
| Cervical | −11.7 | 81.7 | −85.5 | 5.8 |
| Lumbar | 33.4 | 24.3 | −80.5 | −4.9 |
| VII | −64.3 | −34.1 | −51.1 | 164.7 |
Download links
A two-part list of links to download the article, or parts of the article, in various formats.
Downloads (link to download the article as PDF)
Open citations (links to open the citations from this article in various online reference manager services)
Cite this article (links to download the citations from this article in formats compatible with various reference manager tools)
Atoh1-dependent rhombic lip neurons are required for temporal delay between independent respiratory oscillators in embryonic mice
eLife 3:e02265.
https://doi.org/10.7554/eLife.02265


