Structural basis of HIV-1 Vpu-mediated BST2 antagonism via hijacking of the clathrin adaptor protein complex 1
- Yale University, United States
- University of California San Diego, United States
- The VA San Diego Healthcare System, United States
Figures
Figure 1 with 1 supplement
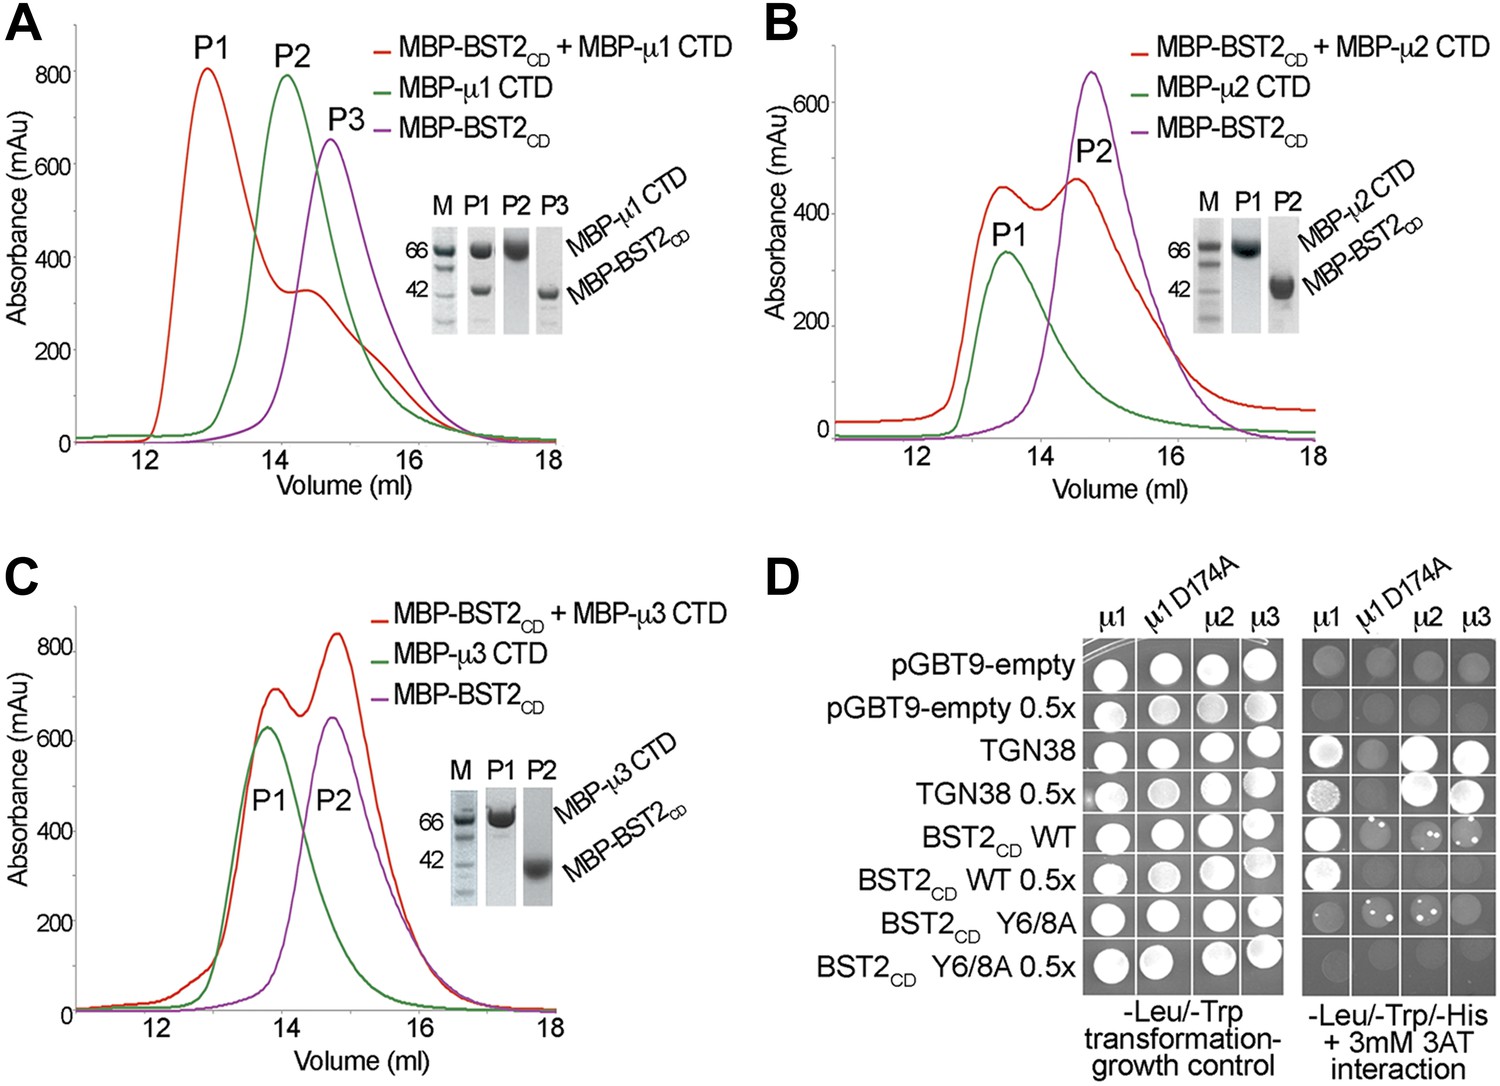
BST2 interacts with µ1 but not µ2 or µ3.
(A–C) Size exclusion chromatograms and SDS PAGE analysis of purified MBP-BST2CD (purple curve), MBP-µ CTD (green curve), and their mixture (red curve). A MBP-µ1 CTD and MBP-BST2CD complex is formed in (A), as indicated by the shift (P1) of its elution volume from those of the individual components (P2 and P3). No complex formed between BST2 and µ2 (B) or µ3 (C). (D) Yeast 2-hybrid assays showing binding of BST2CD to µ1, but not µ2 or µ3. Growth on -Leu/-Trp/-His + 3 mM 3AT plates indicates interaction. Growth on -Leu/-Trp serves as a growth control. ‘0.5x’ indicates plating of one-half the amount of yeast cells relative to other spots. The BST2CD-µ1 interaction is abolished by the tyrosine motif mutation Y6/8A in BST2CD or the tyrosine-binding pocket mutation D174A in µ1.
Figure 1—figure supplement 1
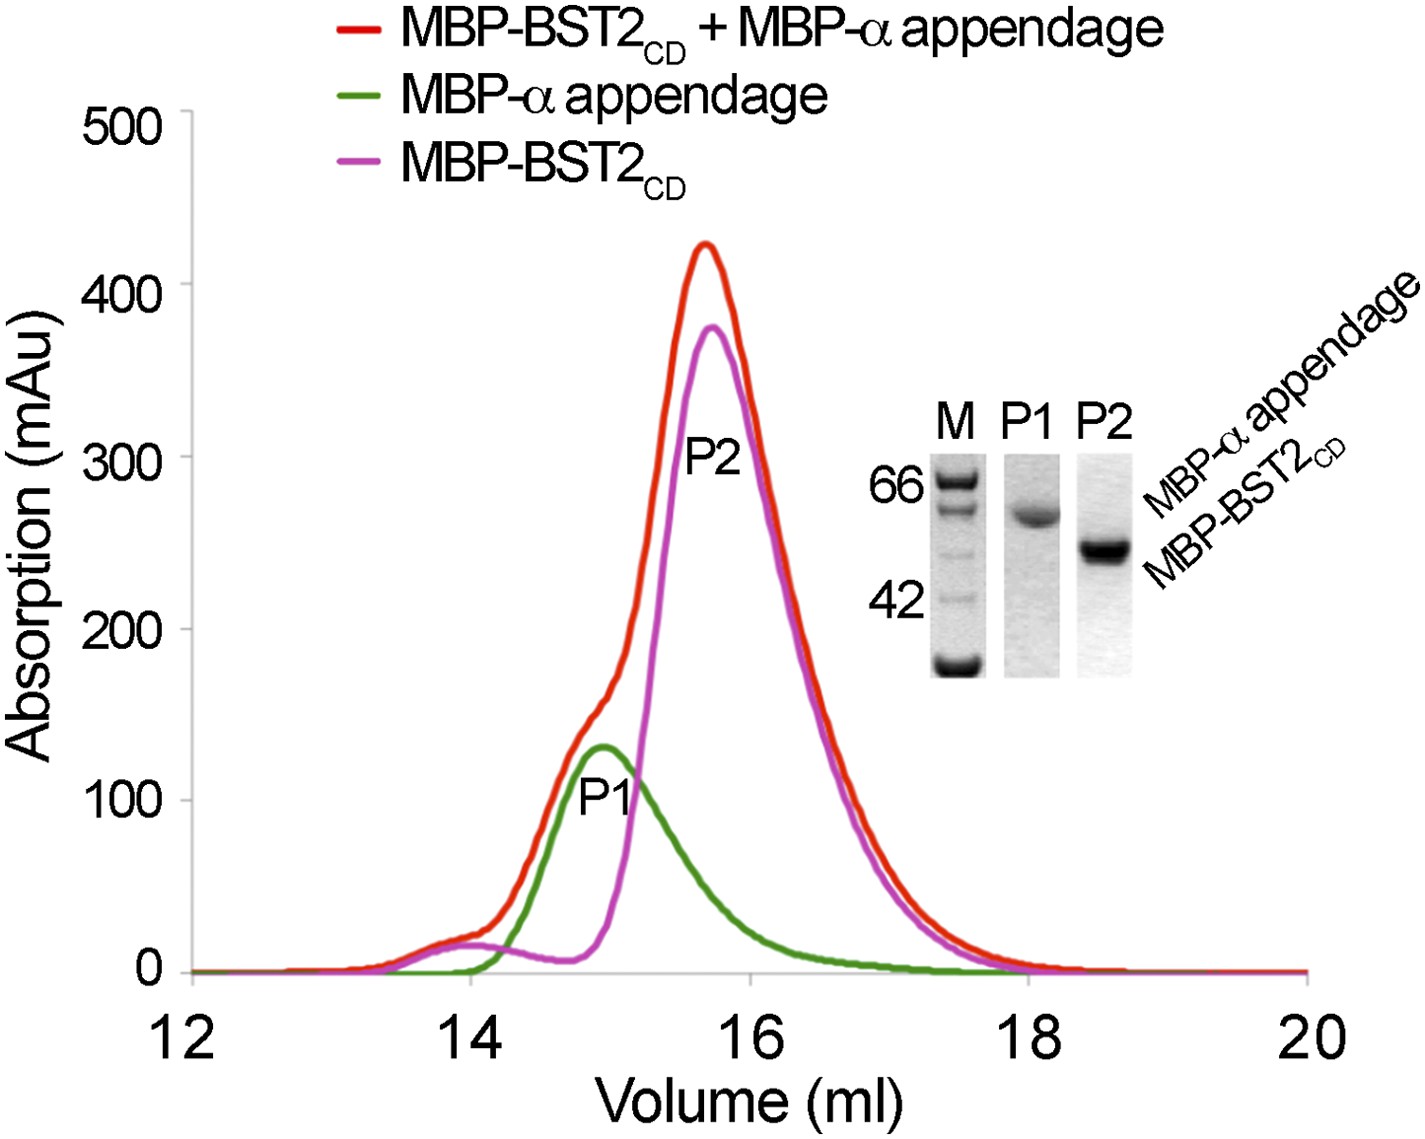
BST2 does not interact with the α appendage domain of AP2.
Size exclusion chromatograms and SDS PAGE analysis of purified MBP-BST2CD (purple curve), MBP-α appendage (green curve), and their mixture (red curve).
Figure 2 with 1 supplement
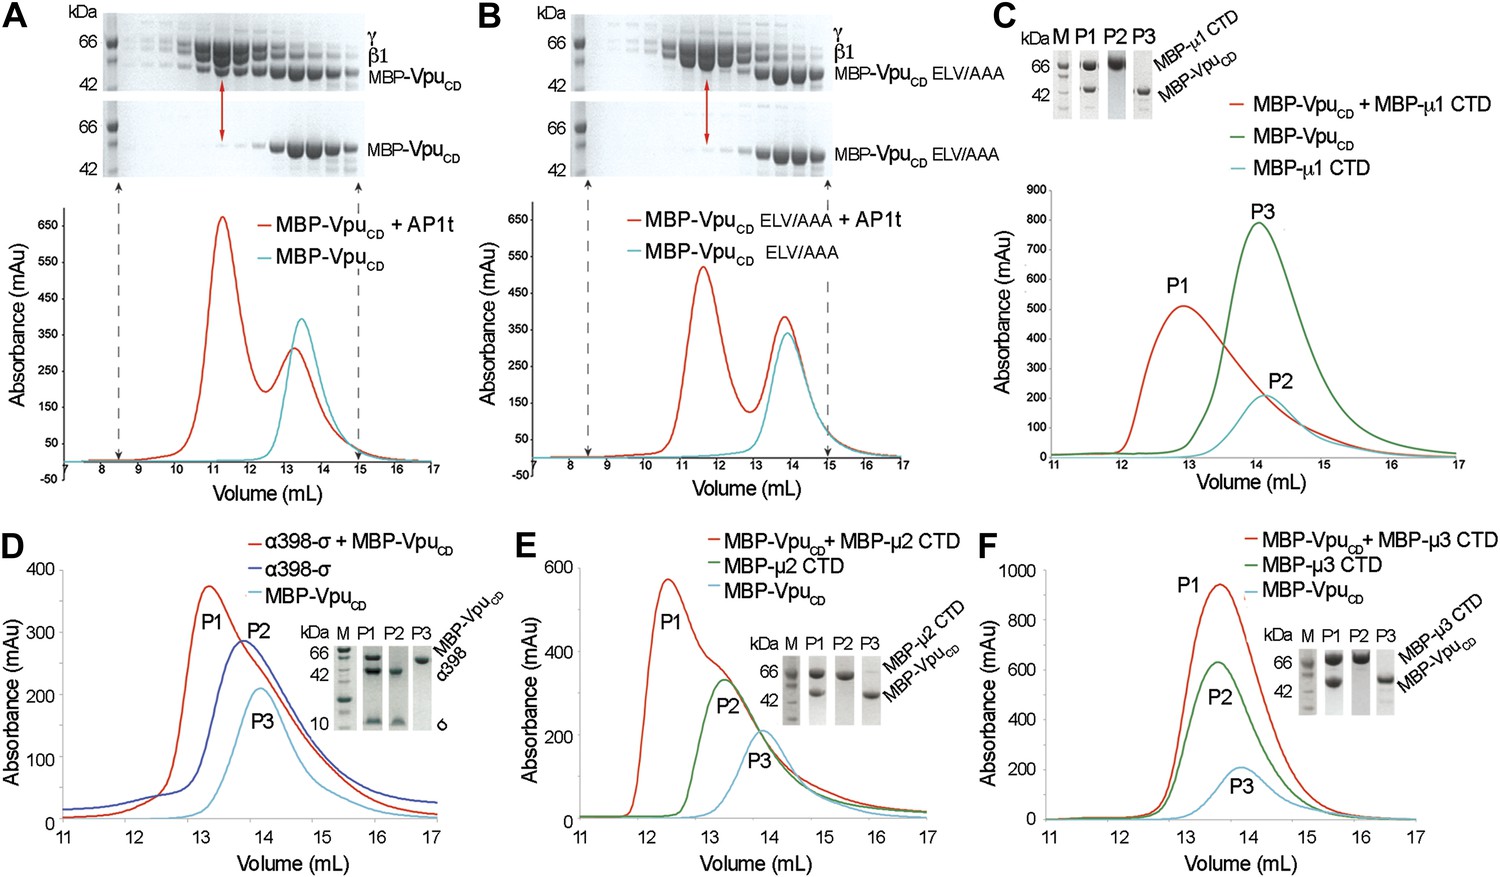
Vpu interacts with multiple subunits of AP1 and AP2, but not μ3 of AP3.
(A and B) Size exclusion chromatograms and SDS PAGE analysis of purified MBP-VpuCD constructs (cyan curve and bottom SDS gel) and its mixture with μ1-truncated AP1 (AP1t) (red curve and top SDS gel). (A) The elution profile of MBP-VpuCD on the size exclusion column is altered in the presence of AP1t (marked by the red arrow), indicating complex formation. (B) The alanine mutation of the ELV motif in VpuCD (MBP-VpuCD ELV/AAA) abolishes the interaction with AP1t, as the elution profile of MBP-VpuCD ELV/AAA does not change with or without AP1t. (C) MBP-VpuCD binds to MBP-µ1 CTD. A shift occurs in the elution volume of the MBP-µ1 CTD and MBP-VpuCD mixture (P1) relative to the individual components (P2 and P3). (D) Size exclusion chromatogram and SDS PAGE analysis showing the co-migration of MBP-VpuCD and α398-σ to a higher molecular weight region relative to the individual components. (E) MBP-VpuCD and MBP-μ2-CTD also form a co-migrating interaction complex. (F) No complex is formed between MBP-VpuCD and MBP-μ3-CTD as the mixture migrates in the same manner as the individual components.
Figure 2—figure supplement 1
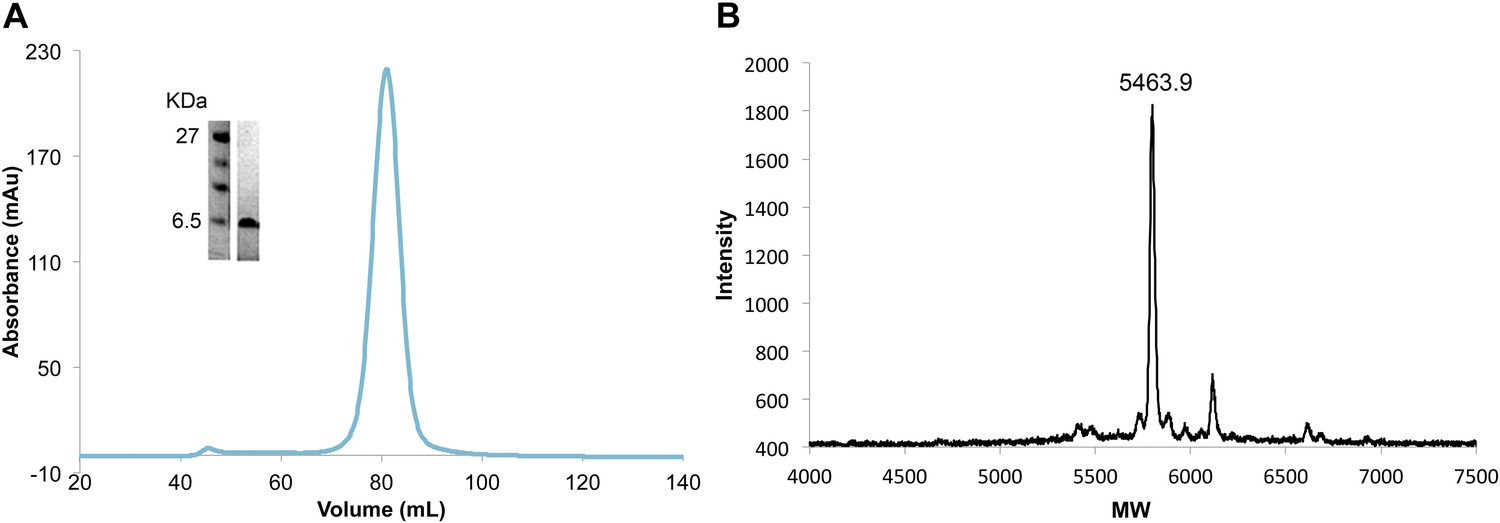
Efficient and complete double phosphorylation of recombinant VpuCD.
(A) SDS-PAGE gel, size-exclusion chromatogram and (B) mass spectrometry of purified phosphorylated VpuCD. The molecular weight measured by mass spectrometry confirms that VpuCD is doubly phosphorylated.
Figure 3

BST2CD-VpuCD fusion binds tightly to AP1.
(A) Schematic of the BST2–Vpu interaction at the lipid membrane (top) and the fusion protein used for in vitro studies (bottom) showing the location of important residues in both BST2 (YxY) and Vpu (ELV). S52 and S56 are phosphorylation sites required for the binding of Vpu to β-TrCP. The regions of Vpu and BST2 used in the fusion are boxed in green. (B) GST pulldown assay using an AP1 with a GST-tagged γ subunit. GST bead-bound AP-1 captured MBP-BST2CD-VpuCD, but not MBP-VpuCD or MBP-BST2CD alone. SDS PAGE analysis shows the amount of protein in the load and eluted from the GST beads.
Figure 4

BST2/Vpu/AP1 interaction involves the BST2 YxY sequence and the dileucine motif-binding pocket on γ/σ1 and is independent of Vpu phosphorylation.
(A) GST affinity pulldown assay using an AP1 core complex with a GST-tagged γ subunit. Mutation of the acidic dileucine pocket on γ (‘AP1 R15E’) and the YxY motif on BST2 substantially reduced binding to AP1. Phosphorylation or S52/56N mutation of Vpu has no effect on AP1 binding. (B) Schematic of the TM-containing BST2 and Vpu fusion chimera. The broken line indicates the first 20 residues of the native BST2 ectodomain followed by the fusion linker, the FLAG epitope tag, and the Vpu ectodomain. (C) HEK293T cells were transfected to express FLAG-tagged Vpu, BST2, or the fusion chimera or related mutants. ‘no FLAG’ indicates mock transfection without any FLAG-tagged construct. Notably, Vpu is much more abundantly expressed than either BST2 or the BST2-Vpu chimeras, and the chimeras appear to be partly proteolyzed. Nonetheless, immunoprecipitation (IP) using anti-FLAG antibody shows endogenous µ1 only in the presence of the BST2-Vpu chimera. Mutation of both the BST2 YxY and Vpu ELV motifs is necessary to prevent co-IP of µ1.
Figure 5 with 1 supplement
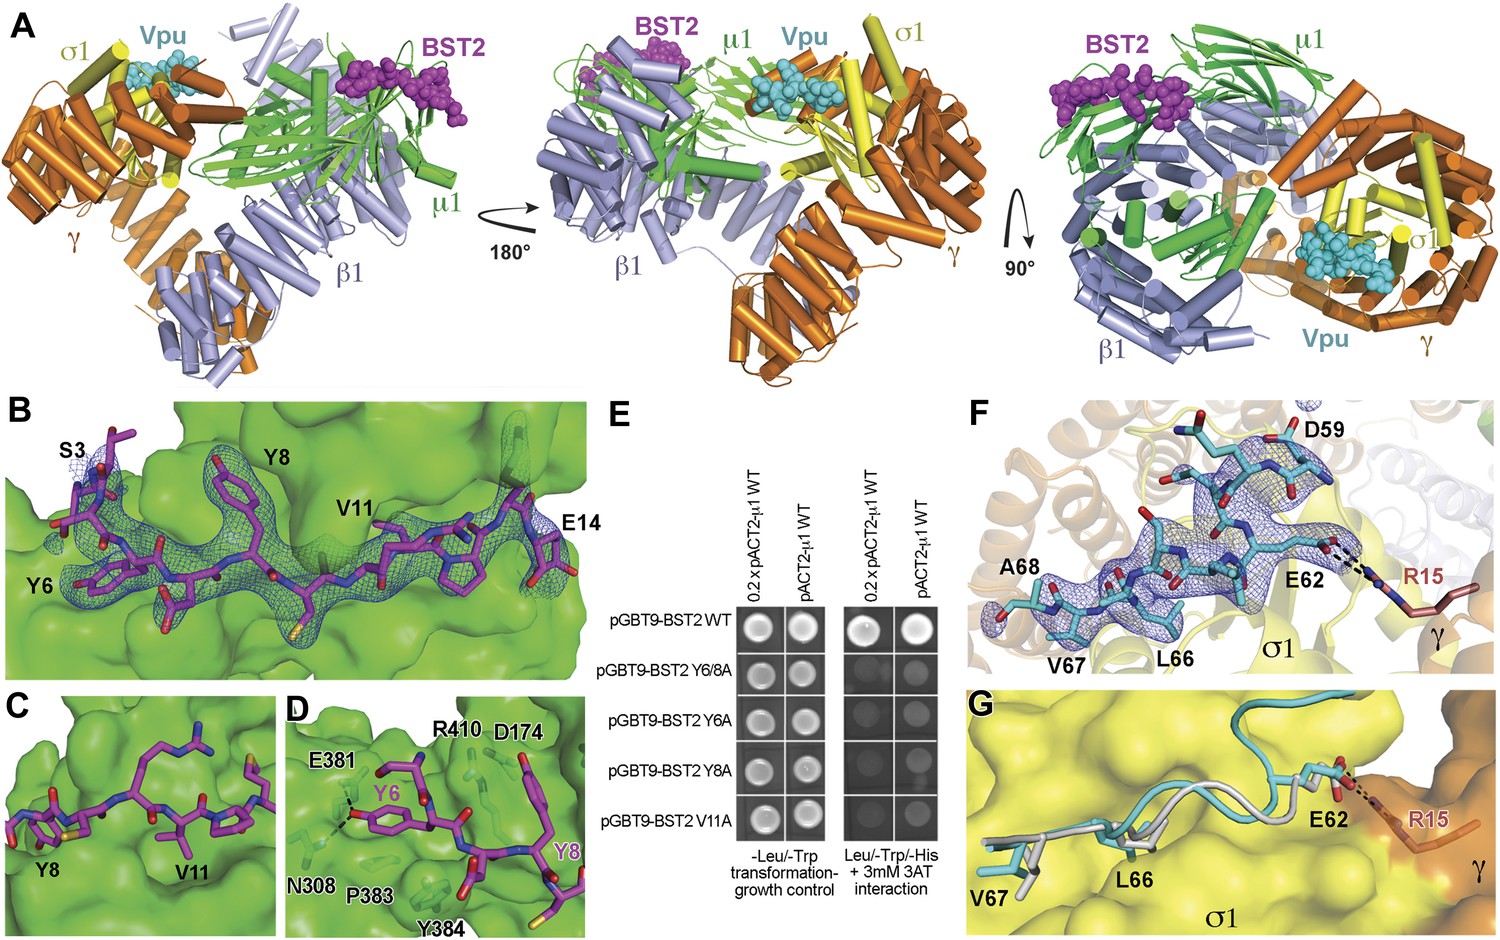
Crystal structure of the BST2CD-VpuCD/AP1 complex.
(A) The crystal structure of the BST2CD-VpuCD/AP1 complex. AP1 is colored by subunit (β1 in gray, γ in orange, μ1 in green and σ1 in yellow). VpuCD (cyan) binds to the acidic dileucine binding pocket of γ/σ1, and BST2CD (magenta) binds to the tyrosine-binding pocket in μ1. (B) The difference Fourier map (mFo-DFc at 3σ level, blue mesh) of BST2CD (magenta sticks) binding to μ1 (green surface). Important residues in BST2CD are labeled. (C) V11 partly fills the canonical Φ residue binding-site on µ1. (D) Y6 and Y8 make extensive interactions to µ1 residues. Hydrogen bonds are indicated with dashed lines. (E) Yeast 2-hybrid assays showing binding of BST2 to µ1. Growth on -Leu/-Trp/-His + 3 mM 3AT plates indicates interaction. Growth on -Leu/-Trp serves as a growth control. ‘0.2x’ indicates plating of one-fifth the amount of yeast cells relative to other spots. The BST2-µ1 interaction is abolished by the alanine mutations of BST2 Y6/8A, Y6A, Y8A, or V11A. (F) The difference Fourier map (mFo-DFc at 3σ level, blue mesh) of VpuCD (cyan sticks) binding to σ1 (yellow surface) and γ (orange surface) subunits of AP1. Important VpuCD and γ residues are labeled. (G) Overlay of α/σ2 of AP-2 (PDB ID 2JKT) (Kelly et al., 2008) and γ/σ1 of AP1 shows that the Vpu ELV motif (cyan) binds in the same way as the canonical peptide (gray).
Figure 5—figure supplement 1
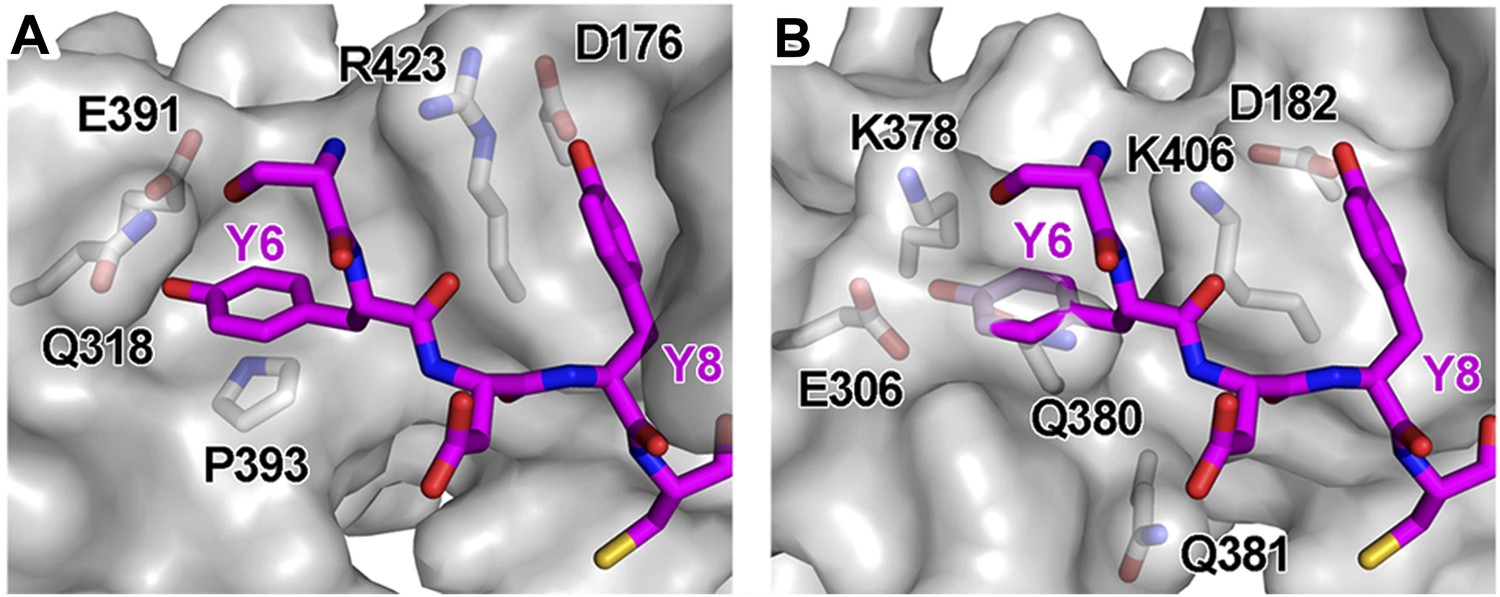
Structural incompatibility prevents the binding of BST2 to either μ2 of AP2 or μ3 of AP3.
(A) µ2 (gray surface) and (B) µ3 (gray surface) do not support binding to the YxY motif of BST2. Note the steric hindrance for the Y6 side chain and the lack of stacking interaction as provided by Y384 of µ1. The models were made by superimposing the coordinates of μ1 in the current structure with those of μ2 (PDB ID 1BXX) (Owen and Evans, 1998) and μ3 (PDB ID 4IKN) (Mardones et al., 2013).
Figure 6
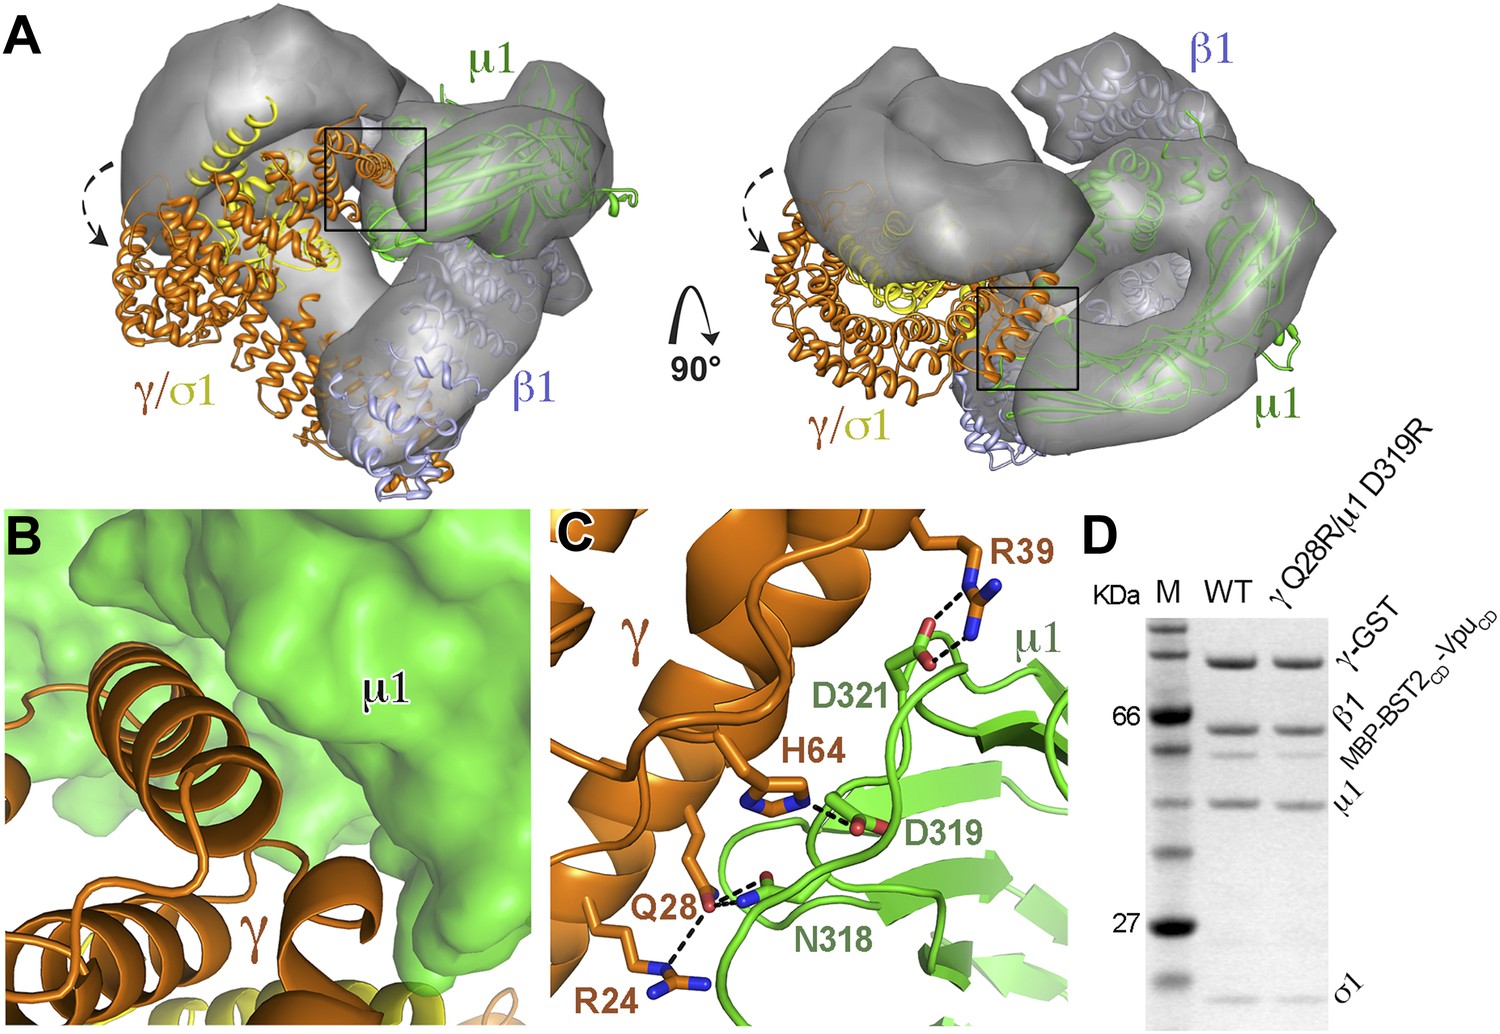
AP1 adopts a novel open conformation when bound to BST2CD and VpuCD.
(A) Overlay of the Arf1-bound AP1 structure (PDB ID 4HMY, grey surface) (Ren et al., 2013) and the BST2CD-VpuCD-bound AP1 structure (ribbon representation with β1 in blue, γ in orange, μ1 in green and σ1 in yellow). The broken arrows point to the large relative movement of the γ/σ1 subunits of our structure with respect to Arf-1/AP1. Note that the β1/μ1 subunits overlay well in the two structures. (B and C) Close-up views of the new γ-μ1 interface observed in the present study, boxed in (A), with hydrogen bonds represented by dashes. (D) GST affinity pulldown assay using an AP1 core complex with GST-tagged γ subunit. Mutations at the γ-μ1 interface reduced MBP-BST2CD-VpuCD binding to AP1.
Figure 7 with 1 supplement

Vpu R44, L/I45 residues may interact with AP1 at the γ-μ1 interface and contribute to the optimal Vpu activity.
(A) The difference Fourier map (mFo-DFc at 3σ level, blue mesh) near γ (orange)-μ1 (green) interface of AP1. VpuCD is shown in cyan sticks and AP1 σ1 is in yellow. (B and C) Affinity pulldown assays using an AP1 with GST-tagged γ subunit (B) or using a His-tagged MBP-μ1-CTD (C). SDS PAGE analysis shows the amount of protein in the load and elution. Mutation of these potentially important Vpu residues at the γ-μ1 interface, R44A:I45A, significantly affected the binding interactions. (D) Downregulation of surface BST2 by Vpu is impaired by the R44A:L45A (RL/AA) mutation as well as by the S52N:S56N (S52/56N) mutation. (E) HEK293T cells were co-transfected to express provirus lacking vpu, and the indicated codon-optimized Vpu proteins. The Vpu R44A:L45A and S52N:S56N mutations each impair Vpu mediated-virion release, and their effects are additive. (F) Western blot of the experiment shown in E, indicating the expression levels of BST2 and Vpu; gp120 is the viral envelope glycoprotein. (G) Co-IP showing that β-TrCP binding was abolished by the S52/56N (‘2/6’) mutation, but not the RL/AA mutation.
Figure 7—figure supplement 1
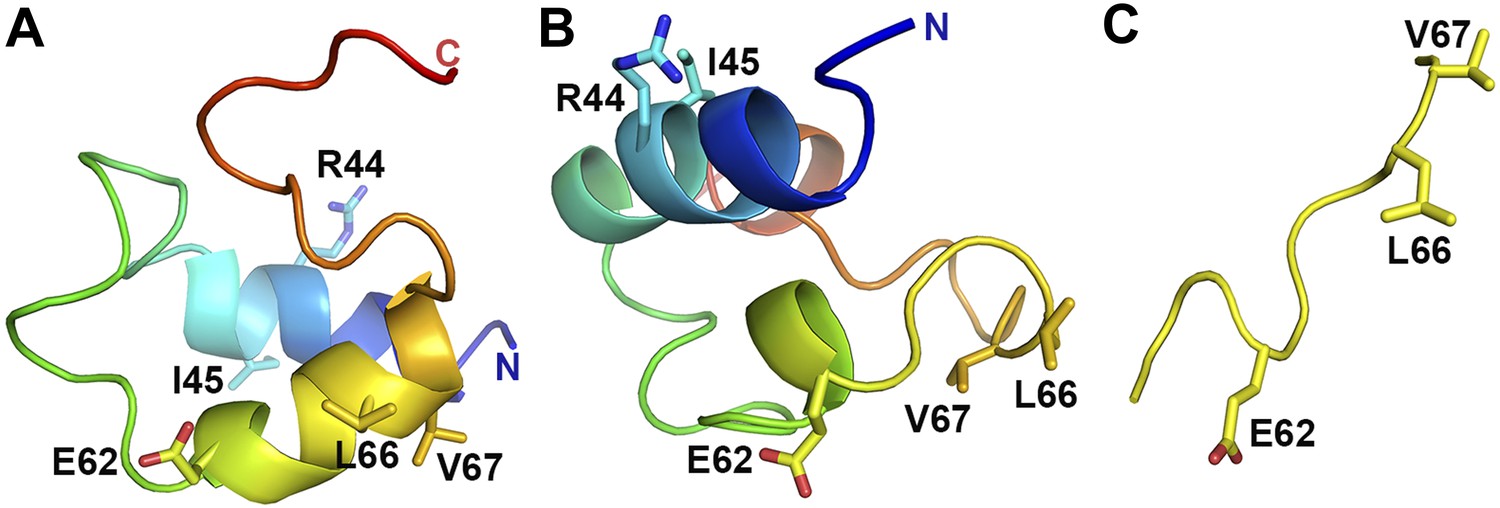
VpuCD exhibits large conformational flexibility.
Comparison of VpuCD conformations observed in previous NMR studies (A: PDB ID 1VPU and B: PDB ID 2K7Y) (Willbold et al., 1997; Wittlich et al., 2009) and the current work (C). The molecules in (A) and (B) are colored in a blue-to-red color ramp from N-terminus to C-terminus. Residues R44 and L/I45 and the ELV motif are shown in sticks.
Figure 8
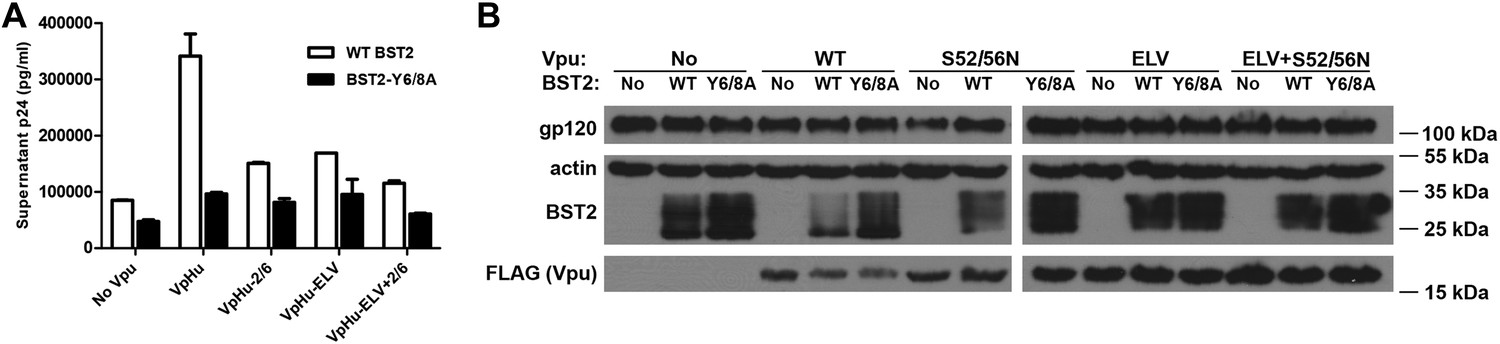
The BST2 YxY as well as the Vpu ELV and di-serine motifs are each important for Vpu-mediated reduction in BST2-expression and for optimal virion release.
(A) HEK293T cells were co-transfected to express the indicated BST2 variants, provirus lacking vpu, and the indicated codon-optimized Vpu proteins. Mutations of the BST2 YxY, Vpu ELV and S52/S56 (‘2/6’) sequences have additive effects in decreasing the efficiency of Vpu mediated- virion release. (B) Western blot showing the expression levels of BST2 (WT or Y6/8A) and Vpu (WT or mutants).
Figure 9 with 1 supplement
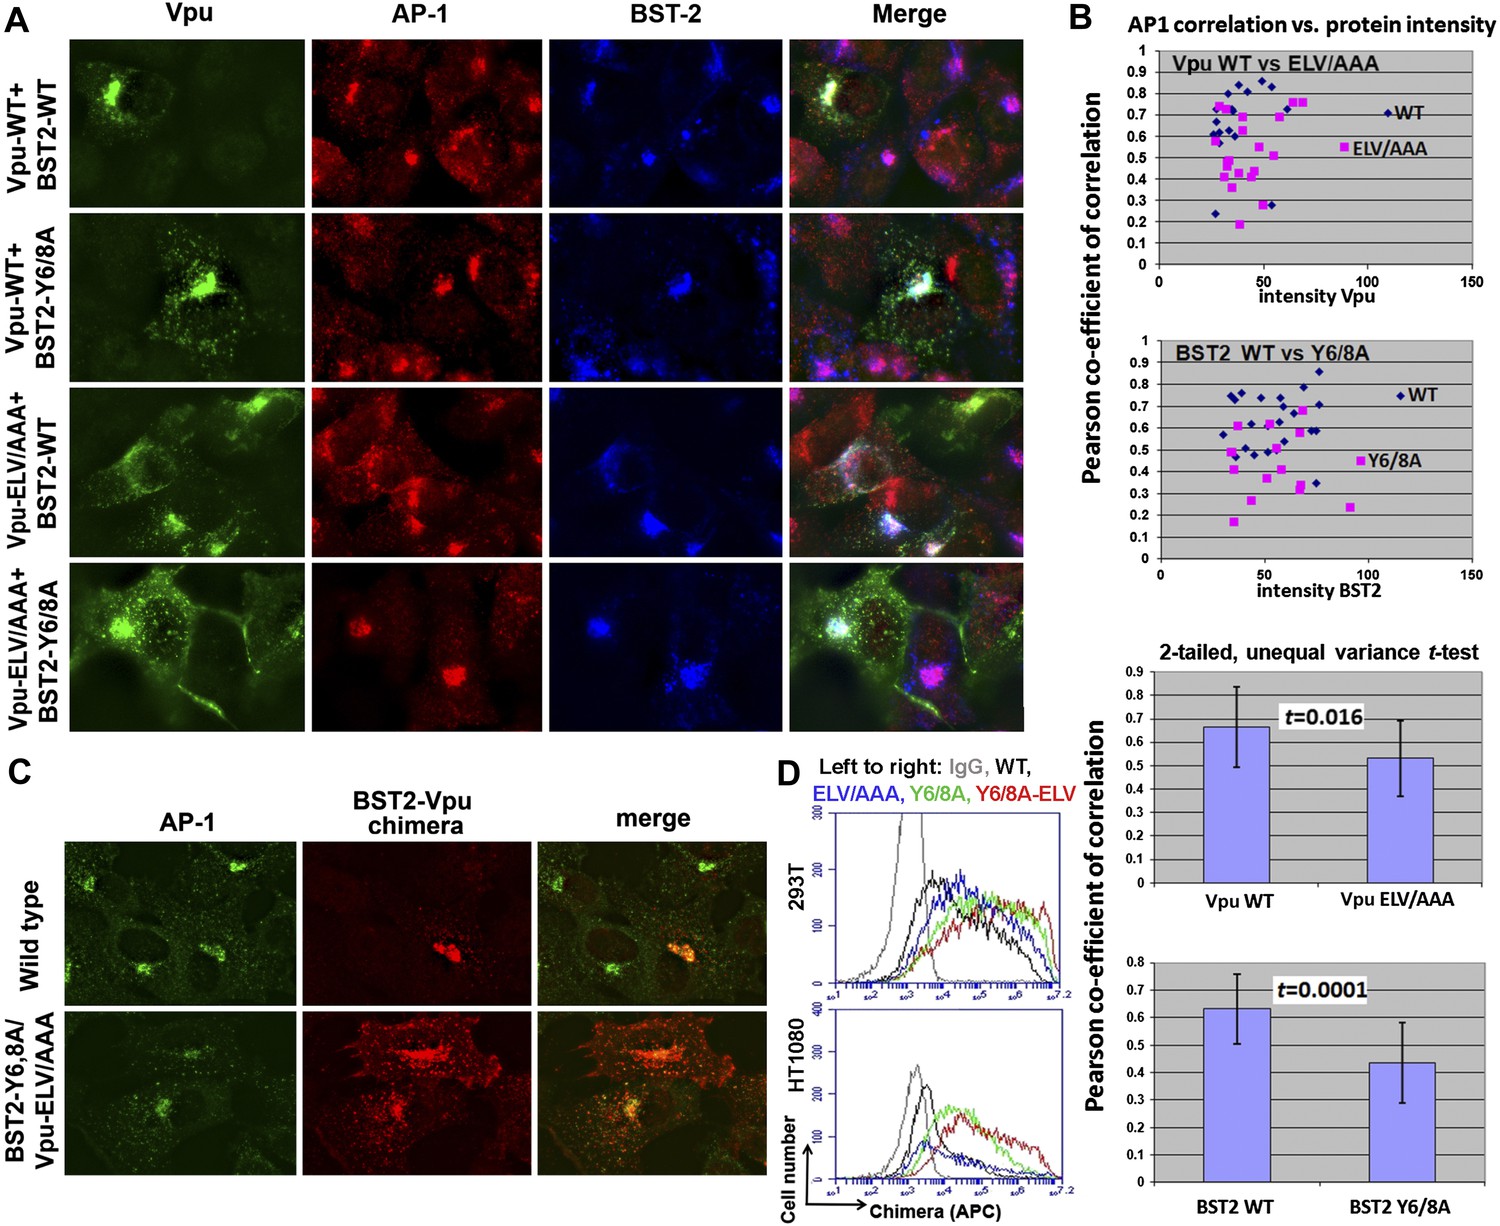
YxY and ELV motifs contribute to BST2/Vpu/AP1 co-localization and the trafficking of BST2/Vpu complexes.
(A) HT1080 cells stably expressing BST2 WT or the Y6/8A mutant were transfected to express Vpu or the ELV/AAA mutant. The cells were stained for Vpu, BST2, and AP1 (γ subunit). (B) Pearson co-efficient of correlation between AP1 and Vpu or between AP1 and BST2 vs the intensity of each protein. Each datum point represents a single cell. The correlation between Vpu and AP1 was analyzed in cells expressing wild type BST2, whereas that between BST2 and AP1 was analyzed in cells that were microscopically negative for Vpu expression (although transfected with the wild type Vpu-expression construct). Mutation of the YxY sequence in BST2 and the ELV sequence in Vpu decrease each protein's overlap with AP1. Statistical significance of these data is shown on the bottom. (C) HT1080 cell were transfected to express the BST2-Vpu chimera. The wild type chimera co-localized with AP1 at the perinuclear region. Alanine mutations of the YxY and ELV motifs decreased the co-localization of the BST2-Vpu chimera and AP1 and caused displacement of the chimera to peripheral endosomes and the plasma membrane. (D) The surface expression of the BST2-Vpu chimera after expression in HEK293T or HT1080 cells by transient transfection was measured using anti-FLAG antibody and flow cytometry. GFP was expressed from a separate plasmid as a transfection marker. The histograms show the cell number vs the intensity of surface stain for the chimera in the GFP-positive (transfected) cells. The Y6/8A mutation caused increased surface expression, as did the ELV/AAA mutation, although to a lesser extent. The highest expression at the cell surface was observed in case of the mutant containing both Y6/8A and ELV/AAA mutations.
Figure 9—figure supplement 1
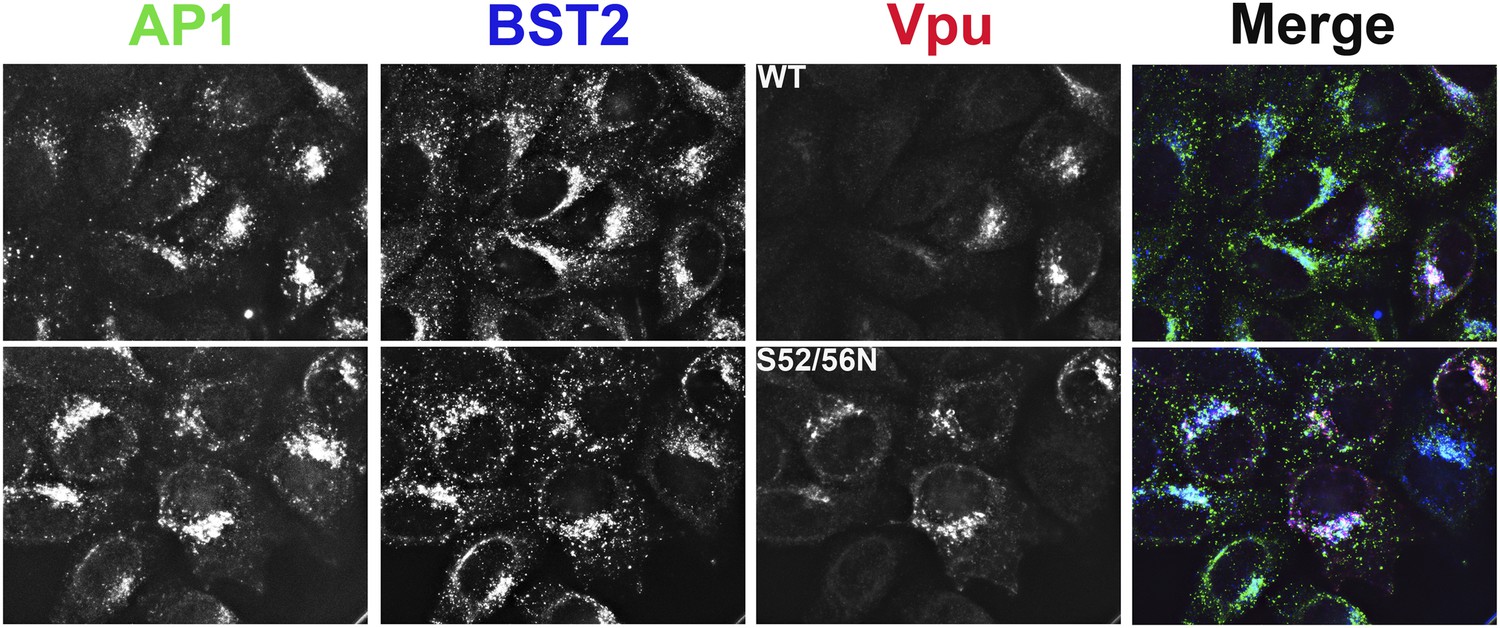
Co-localization of BST2, Vpu, and AP1 in HeLa cells transfected to express either the wild type or the S52N/S56N mutant of Vpu.
https://doi.org/10.7554/eLife.02362.016
Figure 10
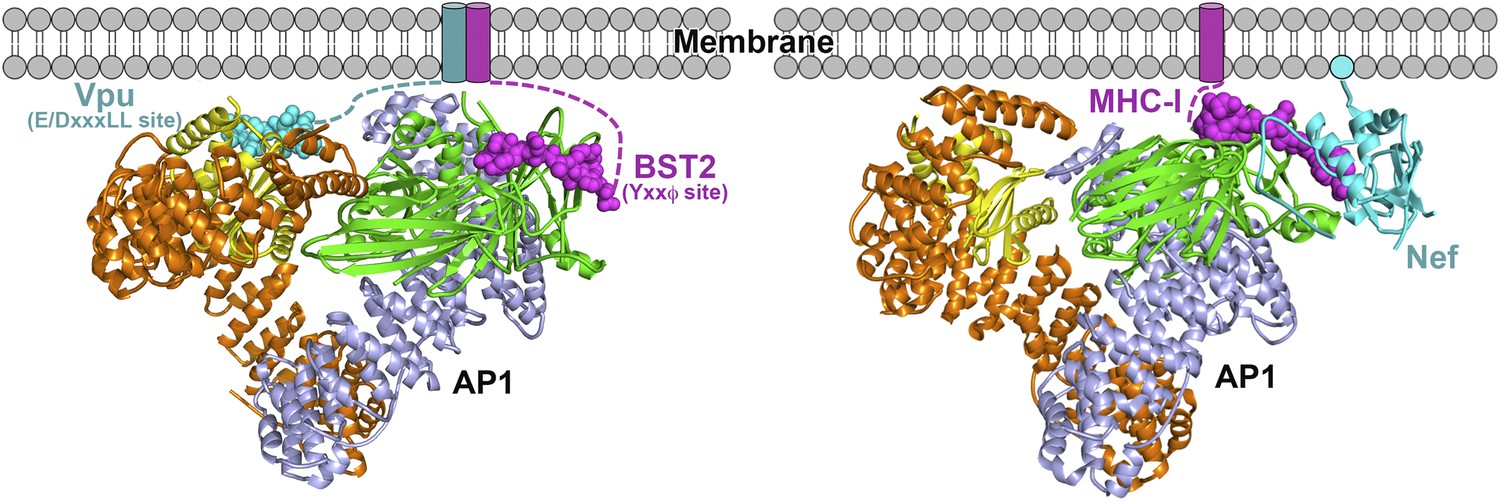
Schematics of hijacking of AP1 by HIV-1 Vpu to target BST2 (left) and by HIV-1 Nef to target MHC-I (right) (Jia et al., 2012).
Transmembrane helices are represented by cylinders and the Nef myristoyl anchor is represented by a cyan sphere.
Tables
Table 1
Crystallographic data collection and refinement statistics
| Native | |
|---|---|
| Data collection | |
| Space group | P43 |
| Cell dimensions | |
| a, b, c (Å) | 160.5, 160.5, 118.4 |
| Wavelength (Å) | 0.9792 |
| Resolution (Å) | 48.8–3.0 (3.11–3.0) |
| Rmerge | 0.077 |
| I/σI | 13.6 (0.9) |
| Completeness (%) | 99.4 (99.5) |
| Redundancy | 3.8 (3.7) |
| Refinement | |
| Unique reflections | 59937 |
| Rwork/Rfree | 0.186/0.229 |
| No. atoms | |
| Protein | 13,926 |
| Water | 14 |
| B-factors | |
| Protein | 107.1 |
| Water | 74.2 |
| R.m.s deviations | |
| Bond lengths (Å) | 0.013 |
| Bond angles (°) | 1.27 |
| Ramachandran | |
| Favored | 95% |
| Outliers | 0.23% |
-
Values in parenthesis are for highest-resolution shell.
Download links
A two-part list of links to download the article, or parts of the article, in various formats.
Downloads (link to download the article as PDF)
Open citations (links to open the citations from this article in various online reference manager services)
Cite this article (links to download the citations from this article in formats compatible with various reference manager tools)
Structural basis of HIV-1 Vpu-mediated BST2 antagonism via hijacking of the clathrin adaptor protein complex 1
eLife 3:e02362.
https://doi.org/10.7554/eLife.02362


