Shared mushroom body circuits underlie visual and olfactory memories in Drosophila
- Max-Planck-Institute of Neurobiology, Germany
- Janelia Farm Research Campus, Howard Hughes Medical Institute, United States
- Tohoku University, Japan
Figures
Figure 1 with 1 supplement
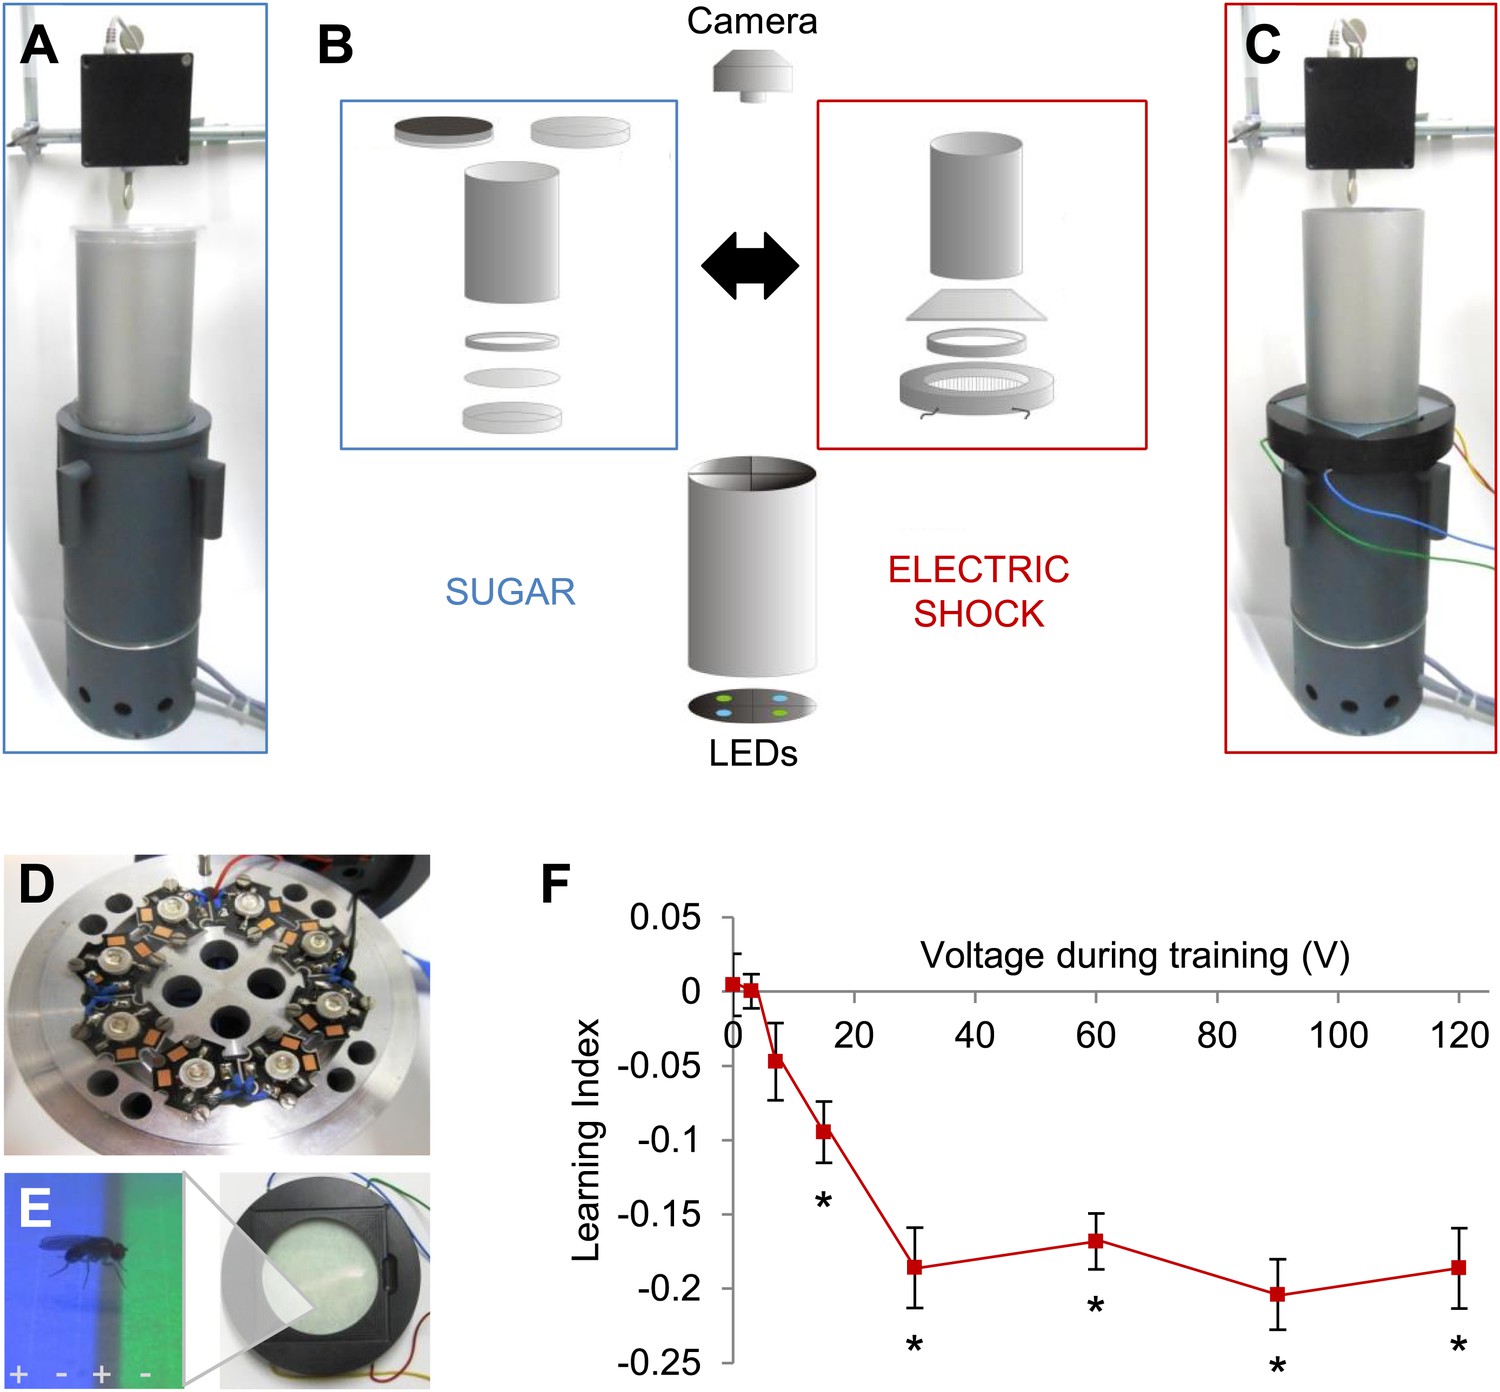
Modular appetitive and aversive visual learning.
(A–C) Experimental setups for appetitive and aversive visual learning. Scheme shows single components (B) of exchangeable conditioning arenas for sugar reward (A) and electric shock punishment (C) that share the same light source and video camera (B). (B) Appetitive setup: cylindrical Fluon-coated arena closed from top with opaque lid during training or transparent lid during test. Exchangeable Petri dish on the bottom to present sugar or water soaked filter paper during training and neutral filter paper during test. Filter paper is clamped in the dish by a plastic ring. Aversive setup: the circular arena consists of a transparent electric shock grid, removable Fluon-coated plastic ring and transparent lid. The cylinder on top isolates each setup from the others and creates a similar closed visual scene as in the appetitive setup. (D) Visual stimulus source with one blue and one green high power LED per quadrant. (E) The conditioning arena with the transparent electric shock grid and a magnification with visual stimulation and a fly. Alternating stripes marked by + and − symbols indicate electric shock application. (F) Aversive visual memory depends on shock intensity (One-way ANOVA, p < 0.001). Flies show significant memory from 15 V (One sample t test, p < 0.001) n = 15. No difference in performance is found among 30–120 V (post-hoc pairwise comparisons p > 0.05) n = 16–30. Further parametric behavioral analyses for aversive conditioning are shown in Figure 1—figure supplement 1. Bars and error bars represent mean and SEM, respectively.
Figure 1—figure supplement 1
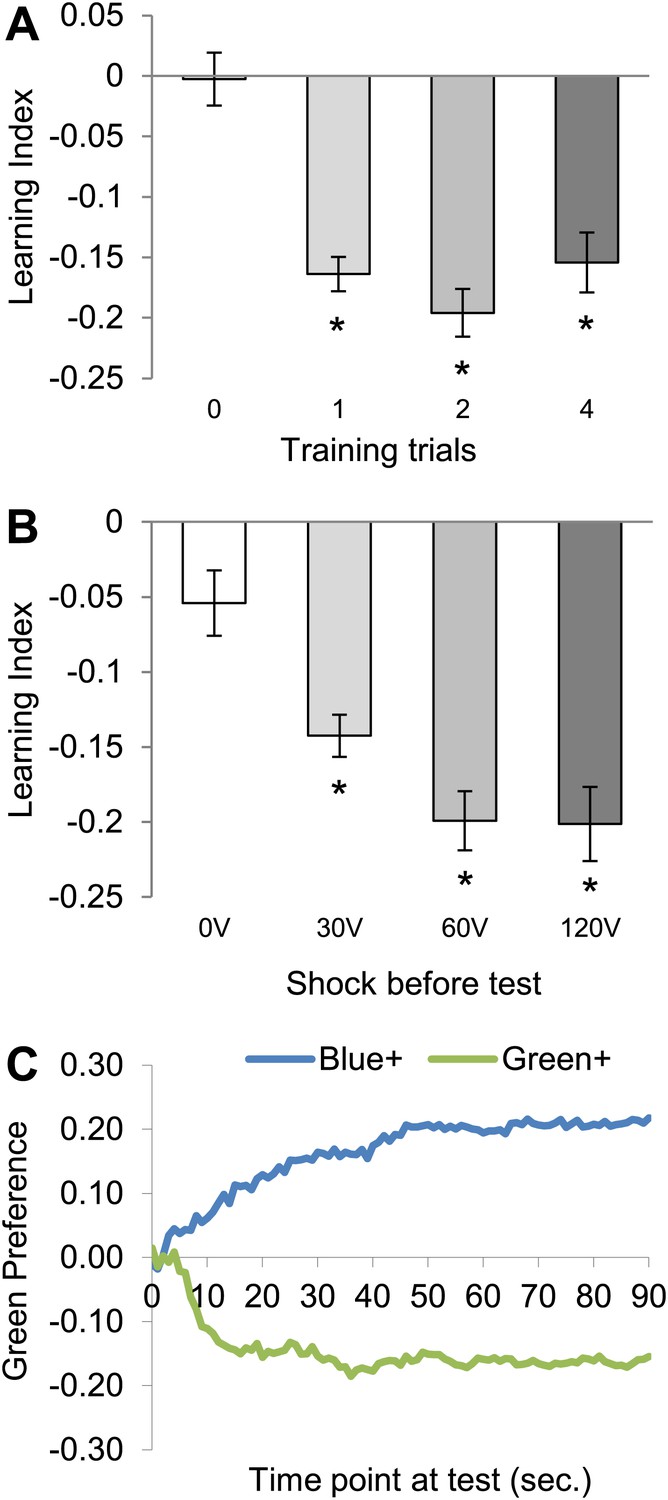
Conditioning with electric shock induces significant aversive visual memory.
(A) For aversive visual memory a single training trial leads to significant aversive memory (One sample t test, p < 0.001). Further repetition of training does not lead to improvement in learning (one way ANOVA, p > 0.1). n = 16. (B) A single shock (1 s) before test facilitates the memory performance at 25°C (0 V; One sample t test, p > 0.05, 30–120 V; One sample t test, p < 0.001), n = 16. Bars and error bars represent mean and SEM, respectively. (C) Green preference of flies after aversive conditioning with 60 V at 25°C. During every second of the test green preference is calculated independently for both reciprocals (Blue+/Green+ represent punished color during training).
Figure 2
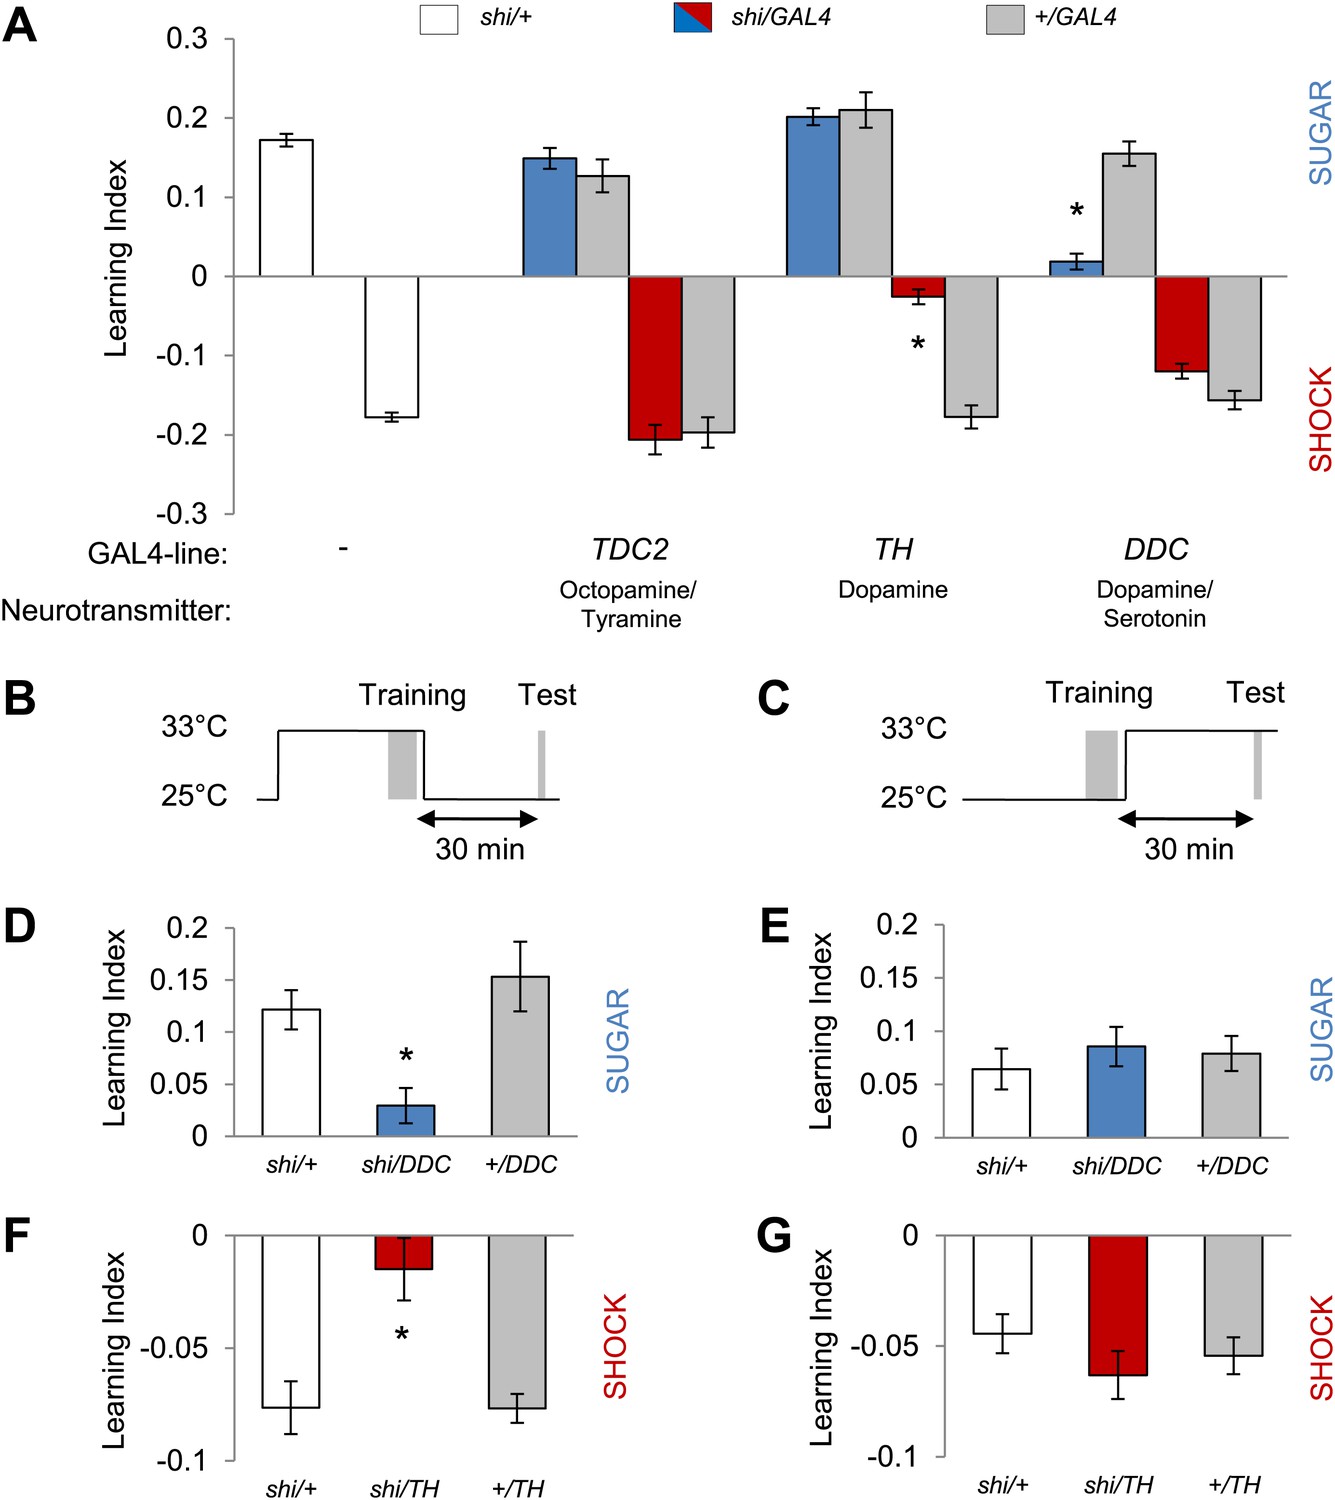
Different dopamine neurons are required for appetitive and aversive memory acquisition.
(A) Different aminergic neurons are continuously blocked with corresponding GAL4 drivers. The blockade with TH-GAL4 and DDC-GAL4 selectively impaired aversive (one-way ANOVA, post-hoc pairwise comparisons, p < 0.001) and appetitive memories (Kruskal–Wallis test, post-hoc pairwise comparisons, p < 0.001), respectively. Blocking octopamine and tyramine neurons does not significantly impair memory (post hoc pairwise comparisons p > 0.05). n = 8–45. (B and C) Scheme of the temperature shift to block the output of corresponding neurons during training (B) or test (C). (D and E) Output of DDC-GAL4 labeled neurons is only necessary in appetitive training (one-way ANOVA, post hoc pairwise comparisons, p < 0.05) but dispensable during test (one-way ANOVA, p > 0.05). n = 13–38. (F and G) Similarly, output of TH-GAL4 labeled neurons is only necessary during aversive training (Kruskal–Wallis test, post hoc pairwise comparisons, p < 0.01) but dispensable during test (one-way ANOVA, p > 0.05). n = 12–16. All flies were starved prior to the experiments. Memory of the experimental group is compared to performances of the corresponding control groups. Only the most conservative statistical result of multiple pairwise comparisons is stated. Bars and error bars represent mean and SEM, respectively.
Figure 3
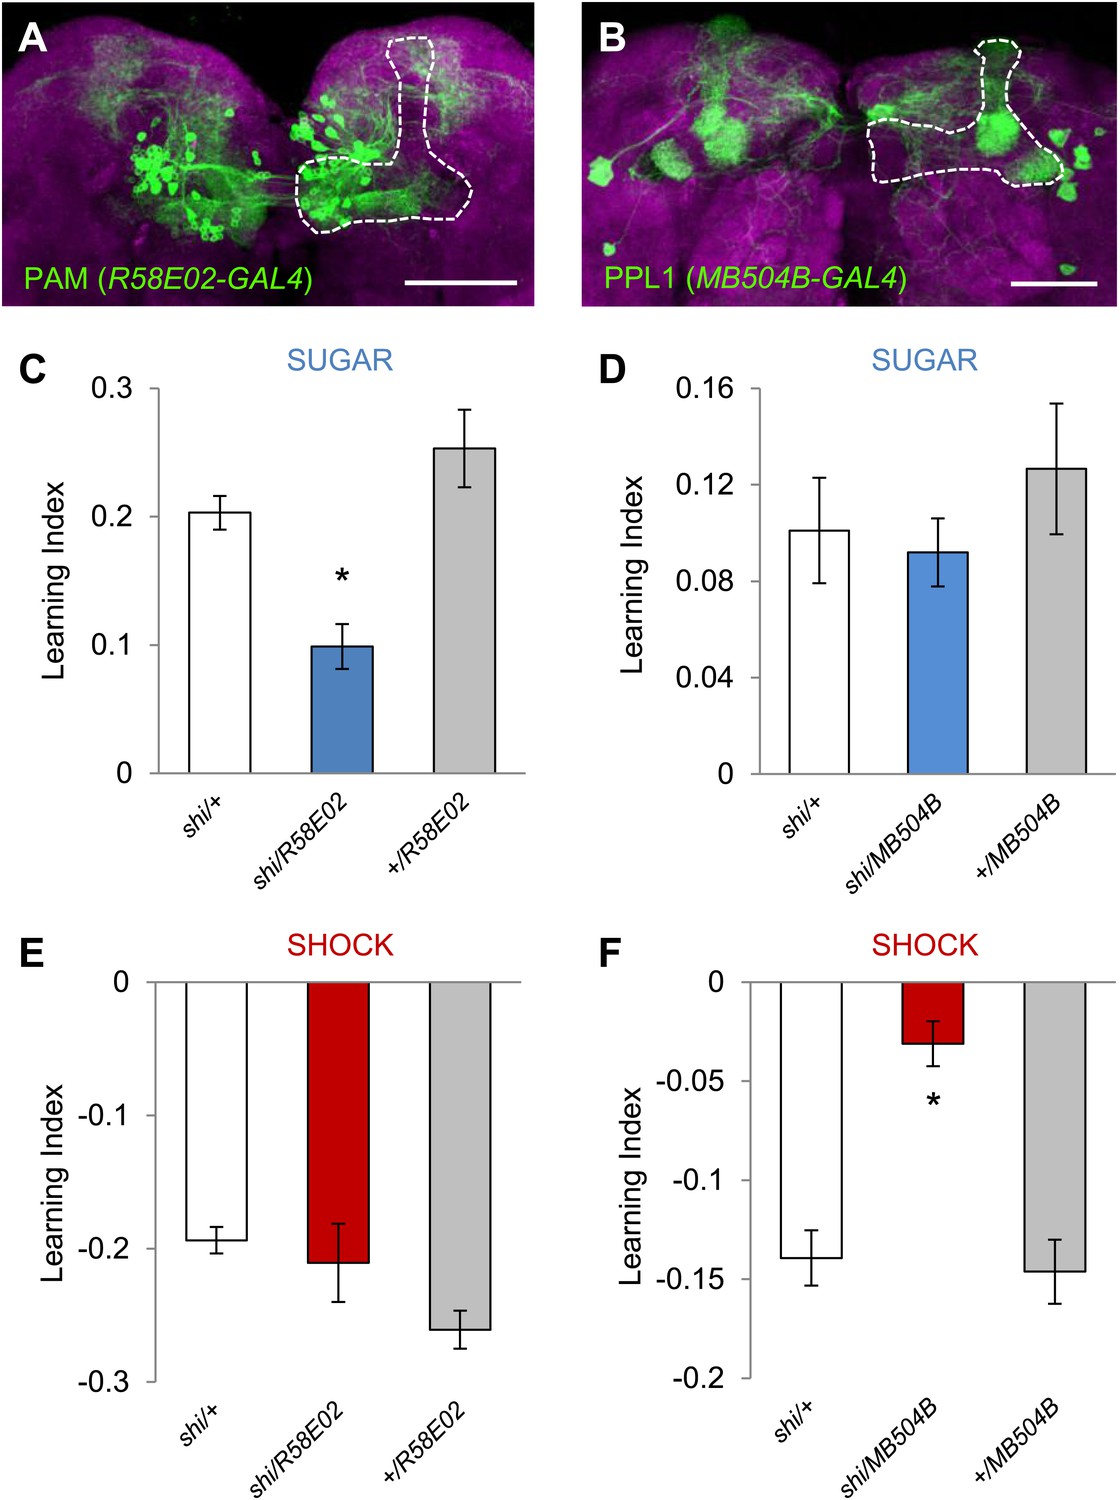
Different sets of dopamine neurons projecting to the MB are necessary for appetitive and aversive memories.
(A and B) Expression patterns of R58E02-GAL4 (PAM-Cluster) and MB504B-GAL4 (PPL1-Cluster) in the MB region (outlined) are visualized by mCD8::GFP (green). Neuropil counterstaining with antibody against Synapsin (magenta). Scalebar = 50 µm. (C and D) Blocking R58E02-GAL4 (C), but not MB504B-GAL4 (D) subsets of dopamine neurons impairs appetitive memories, respectively (one-way ANOVA, post-hoc pairwise comparisons, p < 0.001). n = 10–21. (E and F) Blocking MB504B-GAL4 (E), but not R58E02-GAL4 (F) subsets of dopamine neurons impairs aversive memories, respectively (one-way ANOVA, post-hoc pairwise comparisons, p < 0.001). n = 11–21. All flies were starved prior to the experiments. Bars and error bars represent mean and SEM, respectively.
Figure 4 with 1 supplement
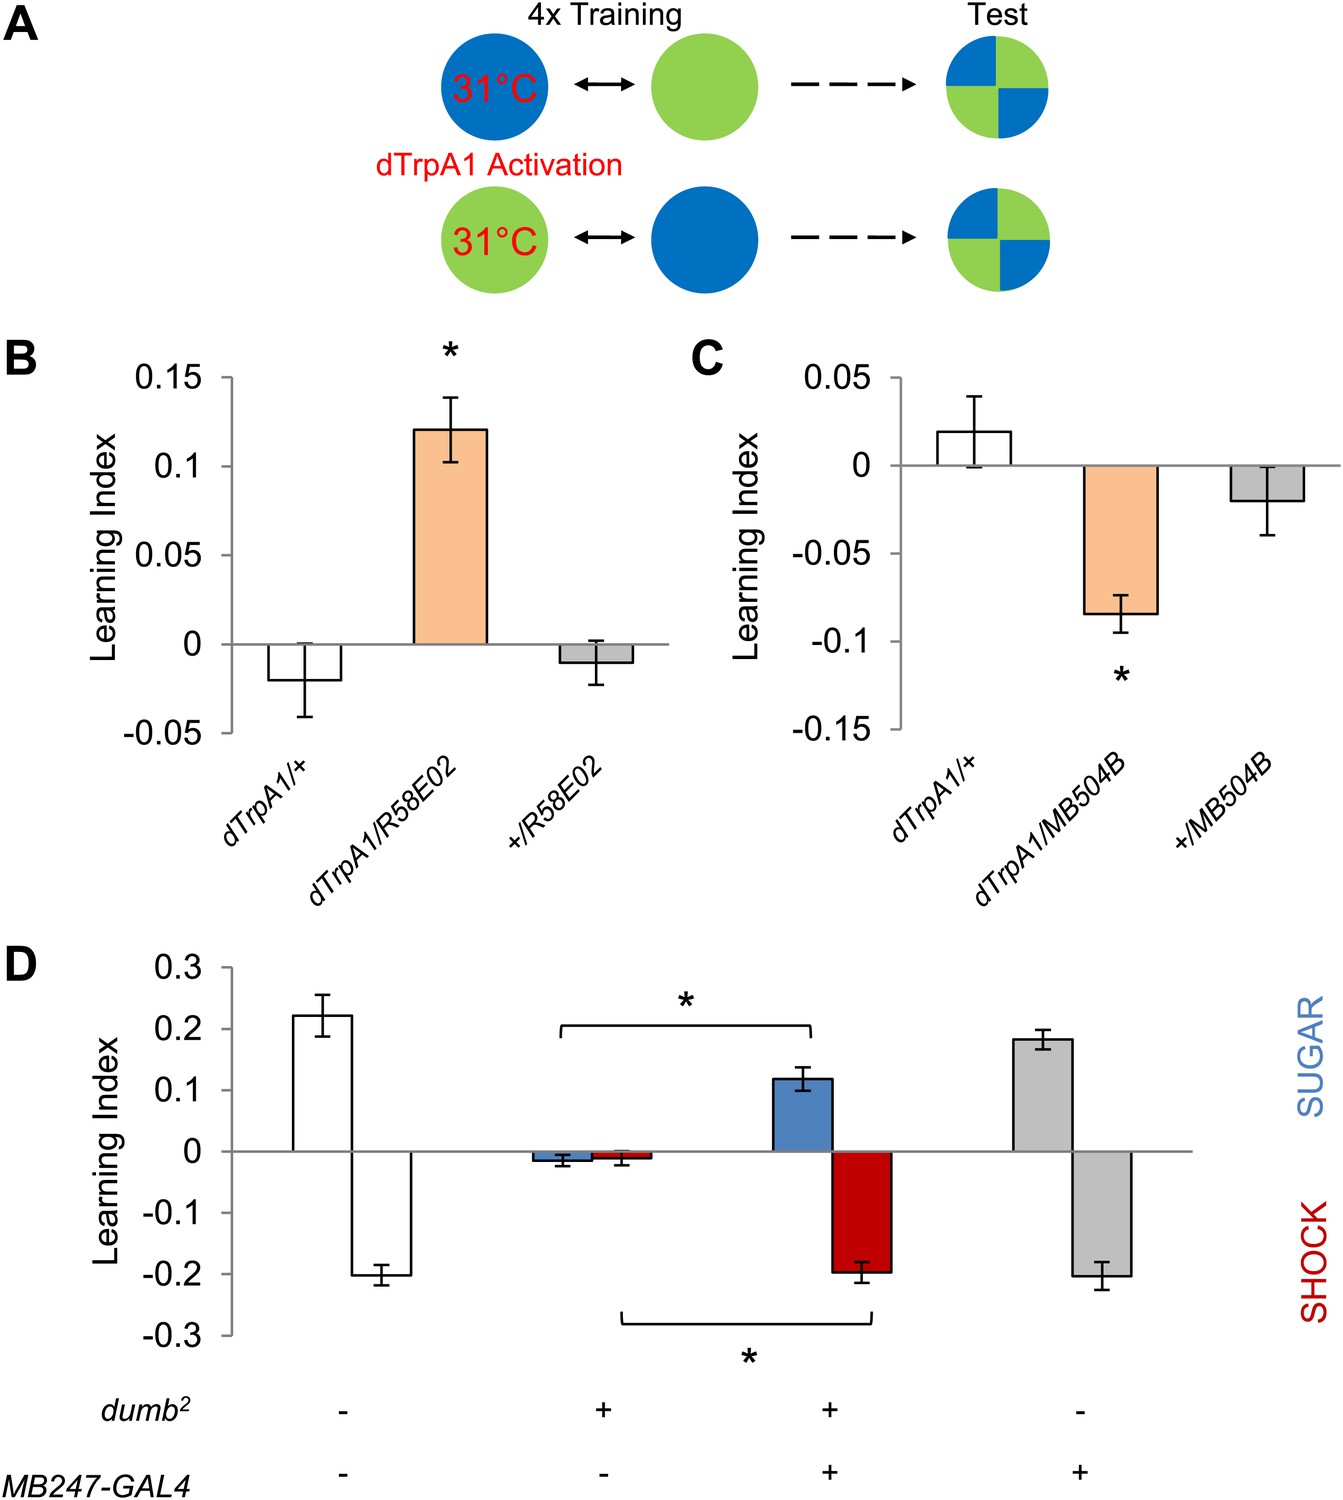
Different sets of dopamine neurons projecting to the MB are sufficient for appetitive and aversive memories.
(A) Scheme of reinforcement replacement. One visual stimulus is paired with temperature elevation (31°C) during training, leading to activation of dTrpA1-expressing neurons. (B and C) Thermo-activation with R58E02-GAL4 (PAM) and MB504B-GAL4 (PPL1) induces appetitive (one-way ANOVA, post-hoc pairwise comparisons test, p < 0.01) and aversive visual memories (Kruskal–Wallis test, post-hoc pairwise comparisons test, p < 0.05), respectively. n = 6–18. (D) DopR null mutant dumb2 (which also allows dumb expression via GAL4) shows a strong defect in appetitive and aversive memory (Kruskal–Wallis test, post-hoc pairwise comparisons test, p < 0.001). Expression of DopR+ in the MB restores both forms of visual memory of the dumb2 mutant (Kruskal–Wallis test, post-hoc pairwise comparisons test, p < 0.05). n = 8–16. Visual cue discrimination for dumb2 mutant flies is shown in Figure 4—figure supplement 1. All flies were starved prior to the experiments. Bars and error bars represent mean and SEM, respectively.
Figure 4—figure supplement 1
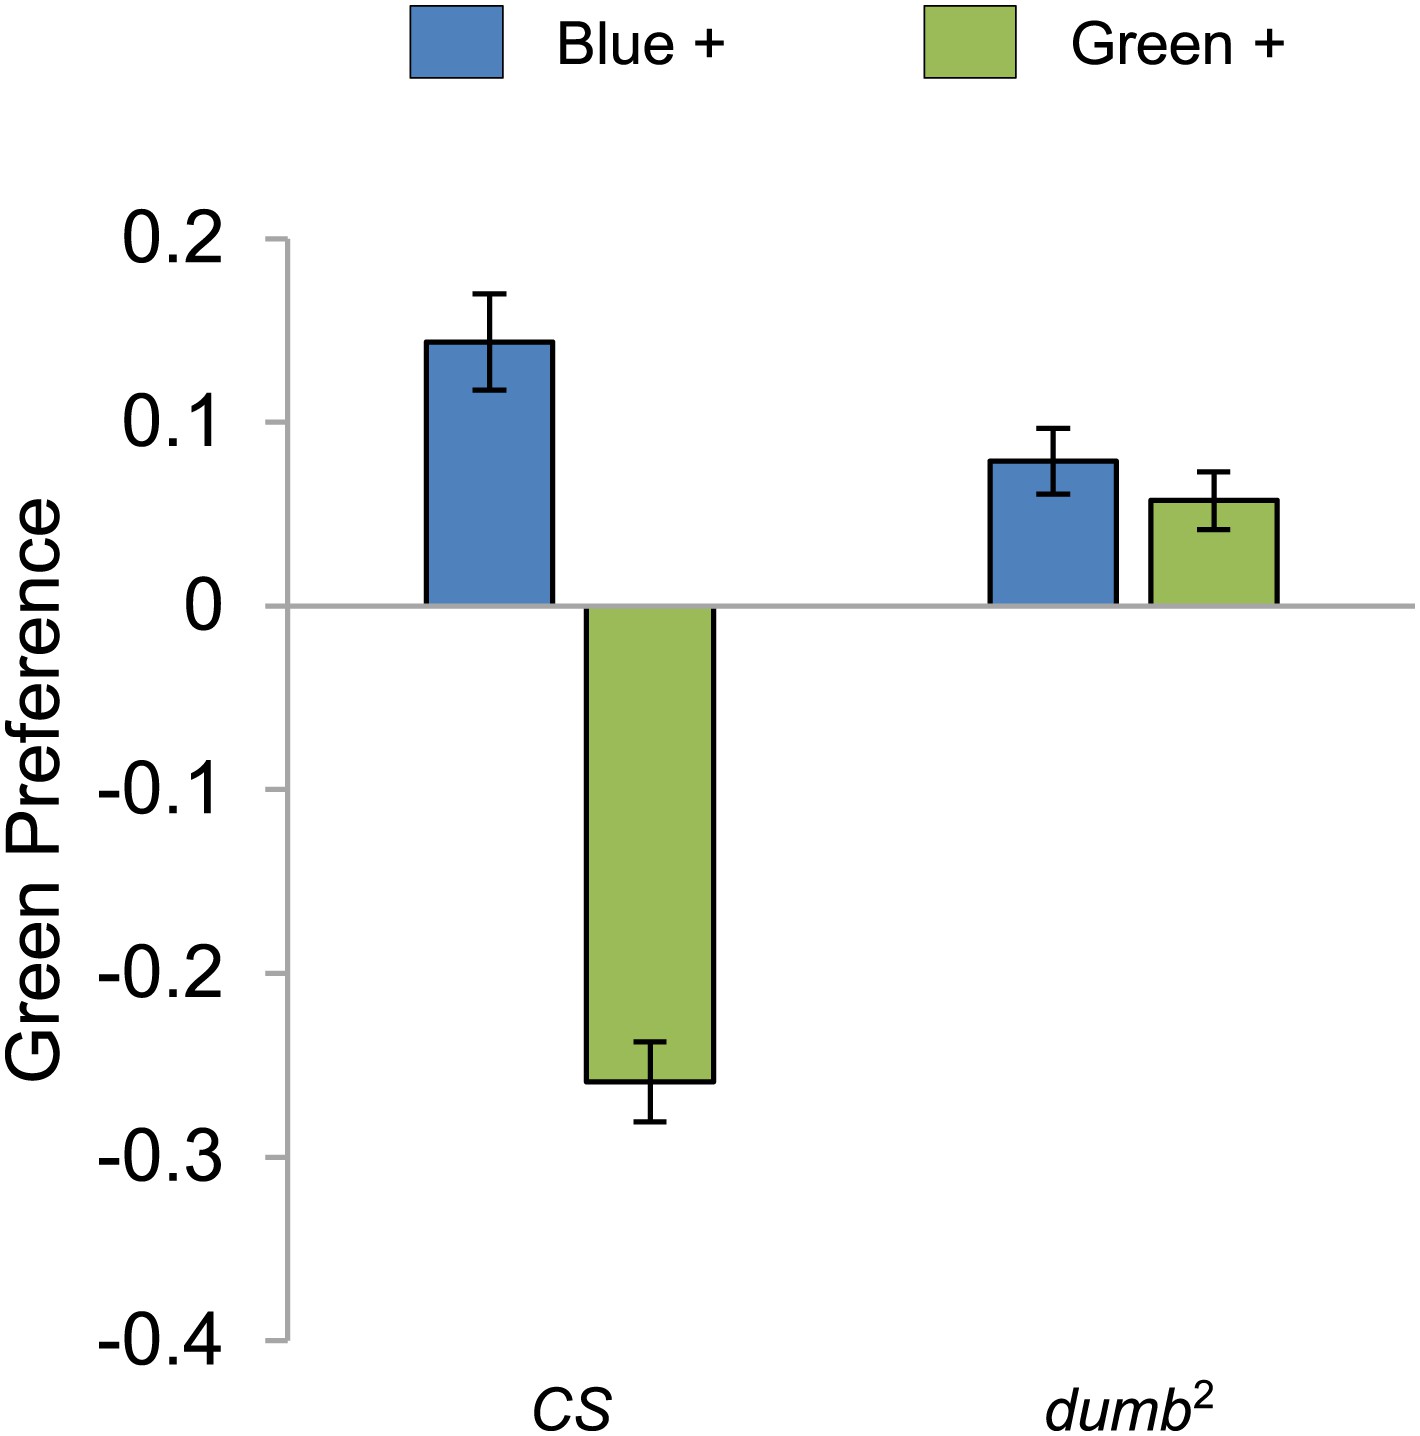
Visual stimulus preference in the memory test after aversive conditioning.
The blue and green bars represent the punished color during training in both reciprocals (Blue+ and Green+). Deviation from zero shows bias in visual choice, thus animals are able to discriminate visual stimuli in test. Bars and error bars represent mean and SEM, respectively.
Figure 5 with 2 supplements

MBs are necessary for visual memories.
(A) Blocking output of KCs labeled with 201y-GAL4 and MB247-GAL4 leads to significant impairment in both appetitive and aversive memories (one-way ANOVA, post-hoc pairwise comparisons, p < 0.05). n = 10–14. MB247-GAL80 restores impaired memory with 201y-GAL4 (post-hoc pairwise comparisons, p > 0.05). n = 10–14. Visual cue discrimination of these genotypes is shown in Figure 5—figure supplement 1. (B) Conditioning protocol with operant component and with visual context maintained between training and test (compare to protocol in A). Visual memories with the modified protocol require intact MBs (one-way ANOVA, post-hoc pairwise comparisons, p < 0.05). n = 14–15. Figure 5—figure supplement 2 shows another example for the requirement of MBs with a modified aversive conditioning protocol. Bars and error bars represent mean and SEM, respectively.
Figure 5—figure supplement 1
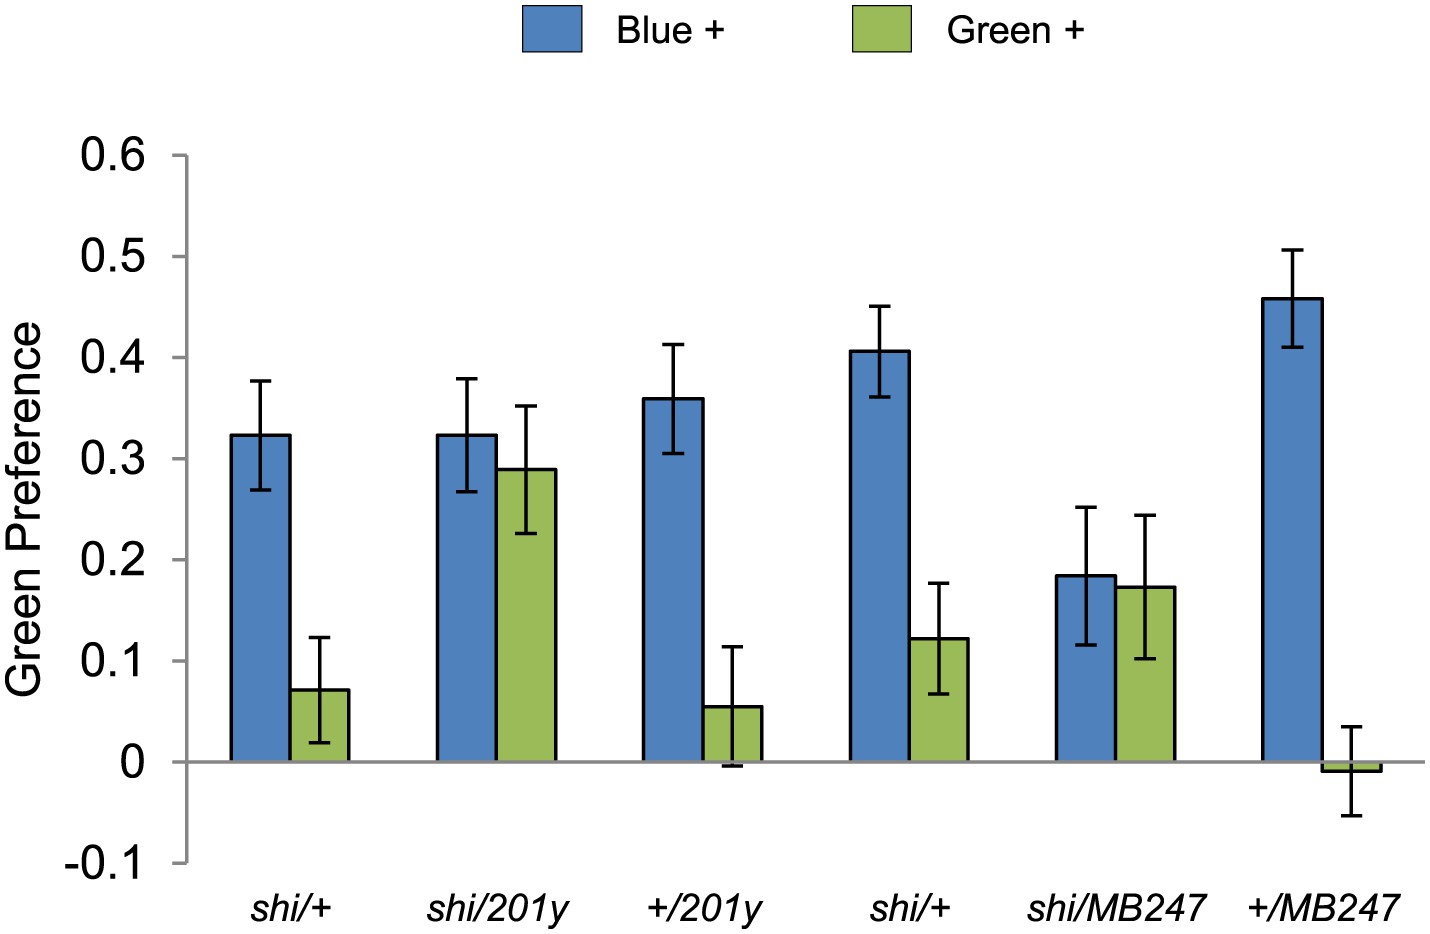
Visual stimulus preference in the memory test after aversive conditioning.
The blue and green bars represent the punished color during training in both reciprocals (Blue+ and Green+). Deviation from zero shows bias in visual choice, thus animals are able to discriminate visual stimuli in test. Bars and error bars represent mean and SEM, respectively.
Figure 5—figure supplement 2
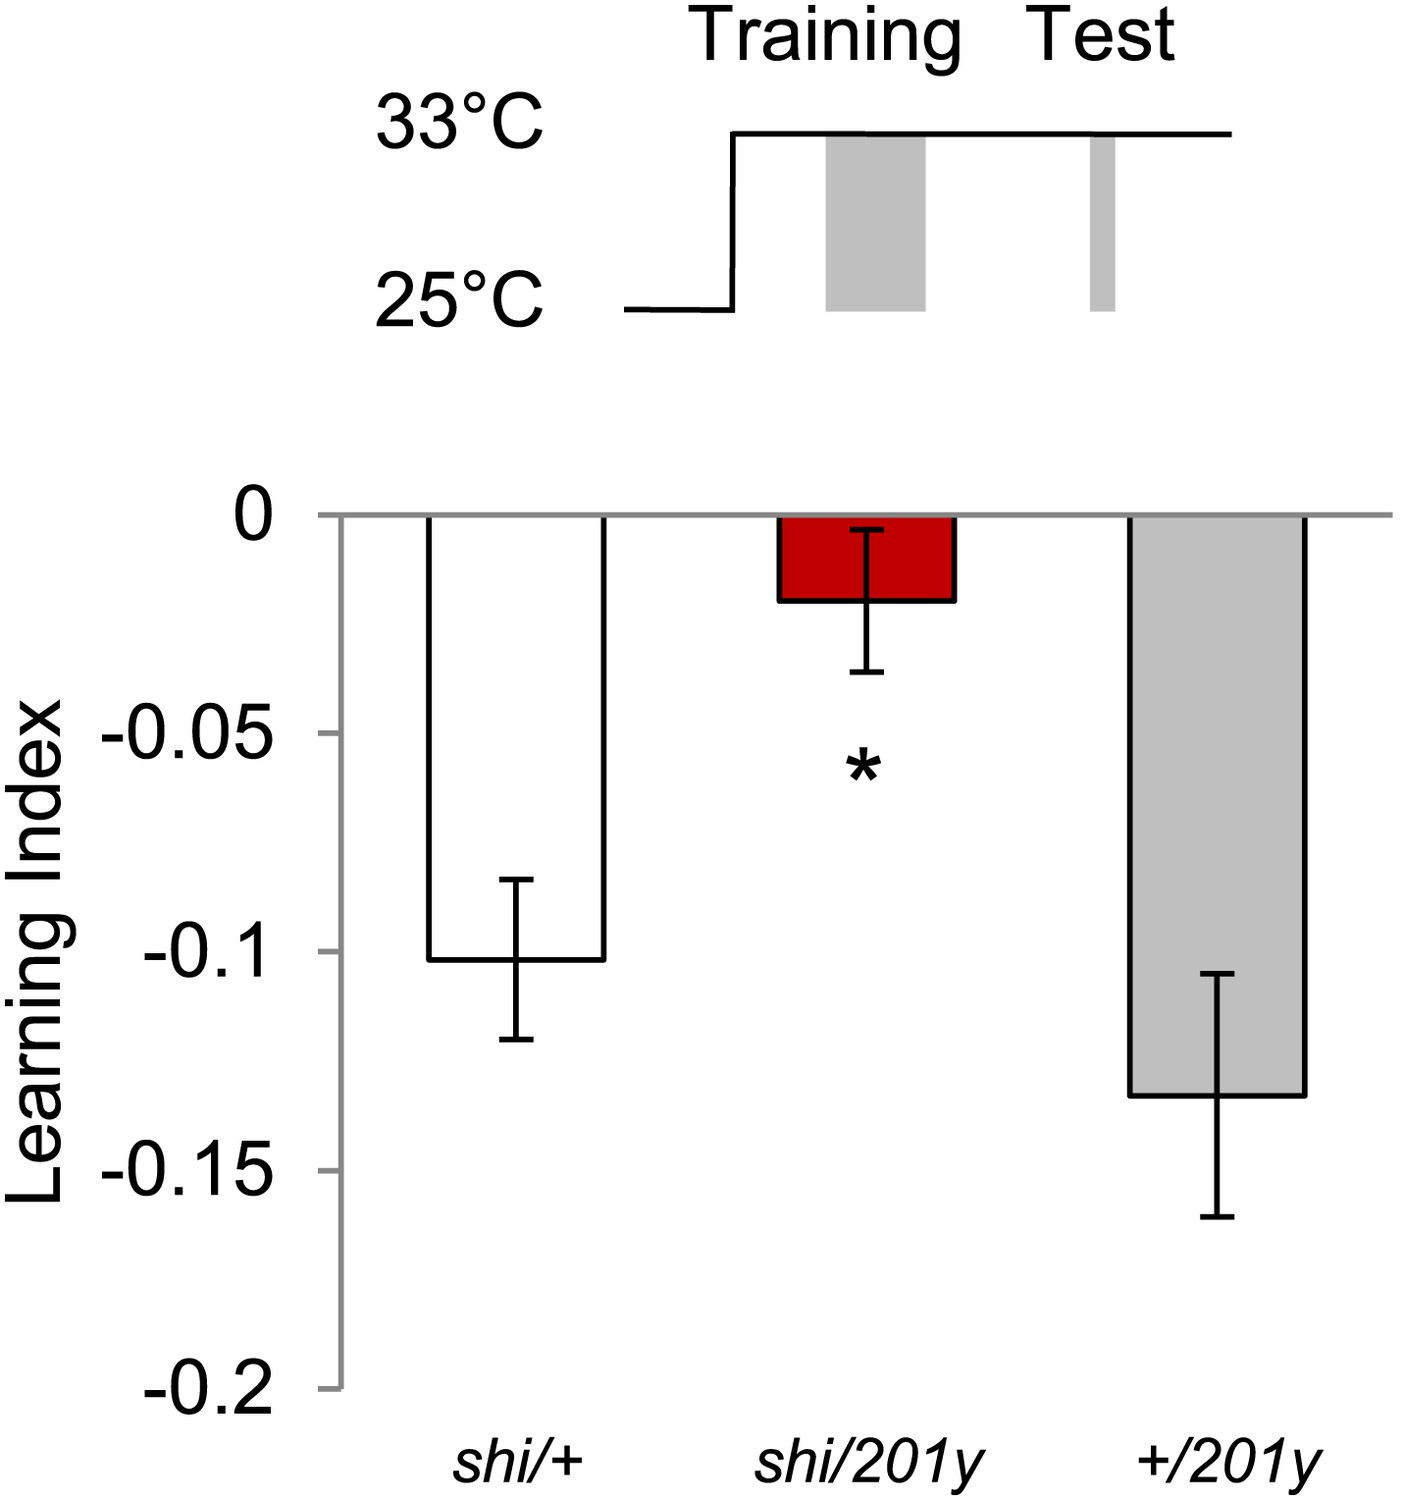
Shock before test is dispensable at high temperature, however, requirement of MBs remains.
Test at 33°C does not require shock (Control groups: One sample t test, p < 0.01). n = 10–11. Visual memories without shock before test require intact MBs (one-way ANOVA, post-hoc pairwise comparison, p < 0.05). n = 10–11. Bars and error bars represent mean and SEM, respectively.
Figure 6
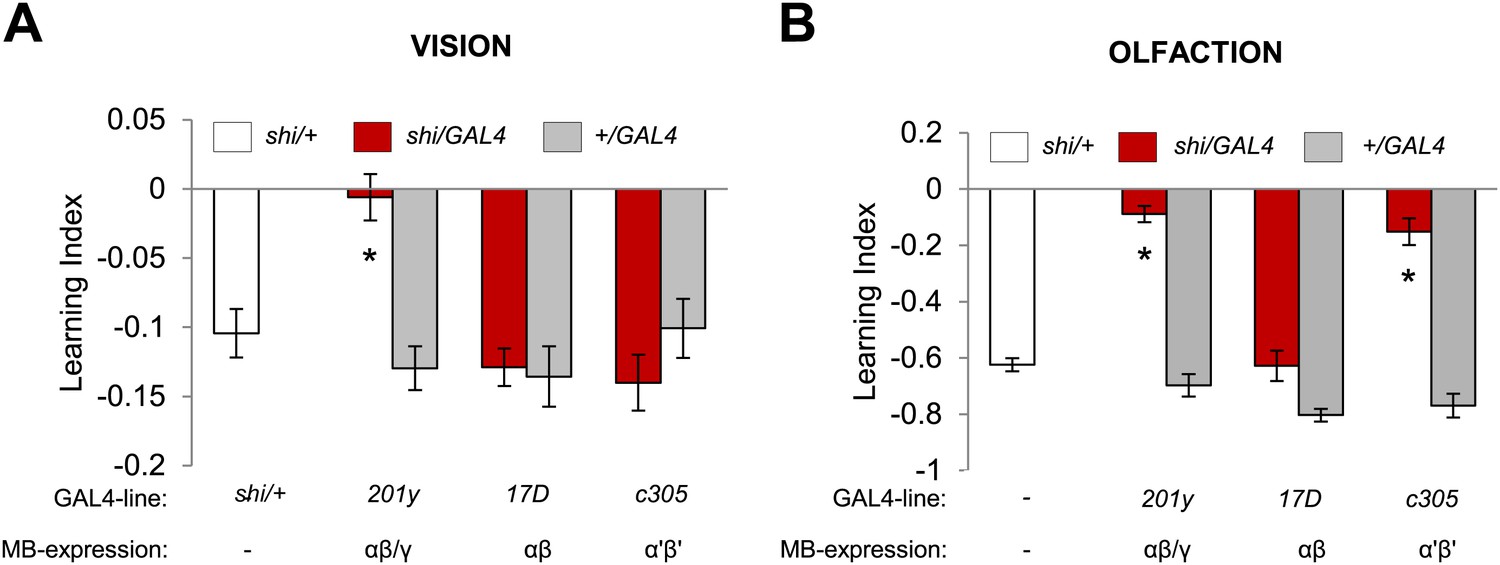
Overlapping, yet distinct sets of MB-lobes are needed for aversive visual and olfactory learning.
(A) Only blocking output of neurons labeled with 201y-GAL4 (α/β and γ lobes) during visual conditioning leads to memory impairment (one-way ANOVA, post-hoc pairwise comparison, p < 0.01), n = 12–19. (B) In contrast, in aversive olfactory memory, blocking output of neurons labeled with 201y-GAL4 (α/β and γ lobes) and c305-GAL4 (αʹ/βʹ lobes) leads to significant memory impairment (one-way ANOVA, post-hoc pairwise comparison, p < 0.001). n = 10–22. Bars and error bars represent mean and SEM, respectively.
Figure 7 with 1 supplement
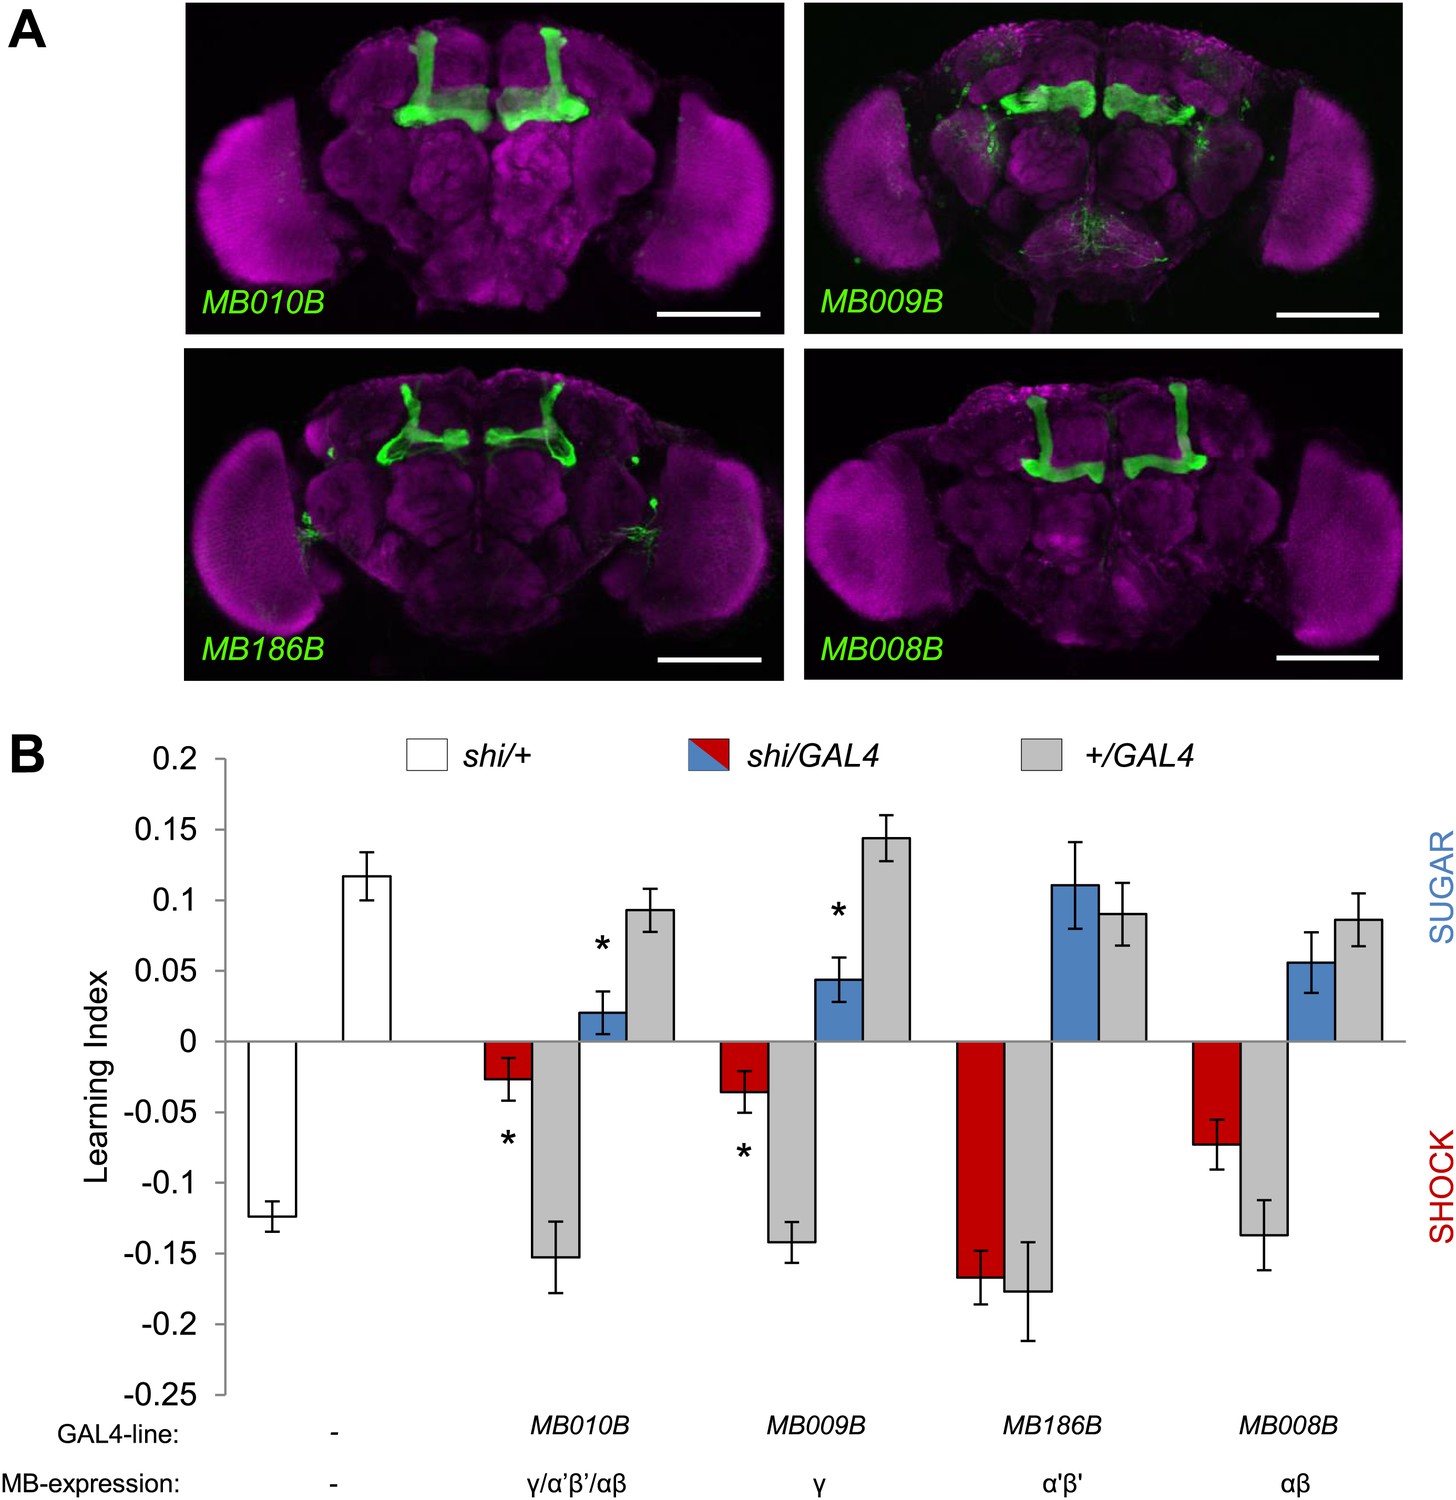
MB γ lobes are required for visual memory.
(A) Partial projections of expression patterns of Split GAL4 lines are visualized by mCD8::GFP (green). Neuropil counterstaining with antibody against Synapsin (magenta). Scalebar = 100 µm. MB010B-GAL4 labels all lobes of the MB, MB009B-GAL4 labels γ lobes, MB186B-GAL4 labels α′/β′ lobes, MB008B-GAL4 labels α/β lobes. (B) Blocking output of specific MB-lobe subsets during appetitive conditioning showed that γ lobes are specifically required (Kruskal–Wallis test, post-hoc pairwise comparisons, p < 0.05). n = 10–23. In aversive conditioning we found similar requirement of the γ lobes (one-way ANOVA, post-hoc pairwise comparisons, p < 0.05). n = 8–23. Visual cue discrimination of these genotypes is shown in Figure 7—figure supplement 1. Bars and error bars represent mean and SEM, respectively.
Figure 7—figure supplement 1
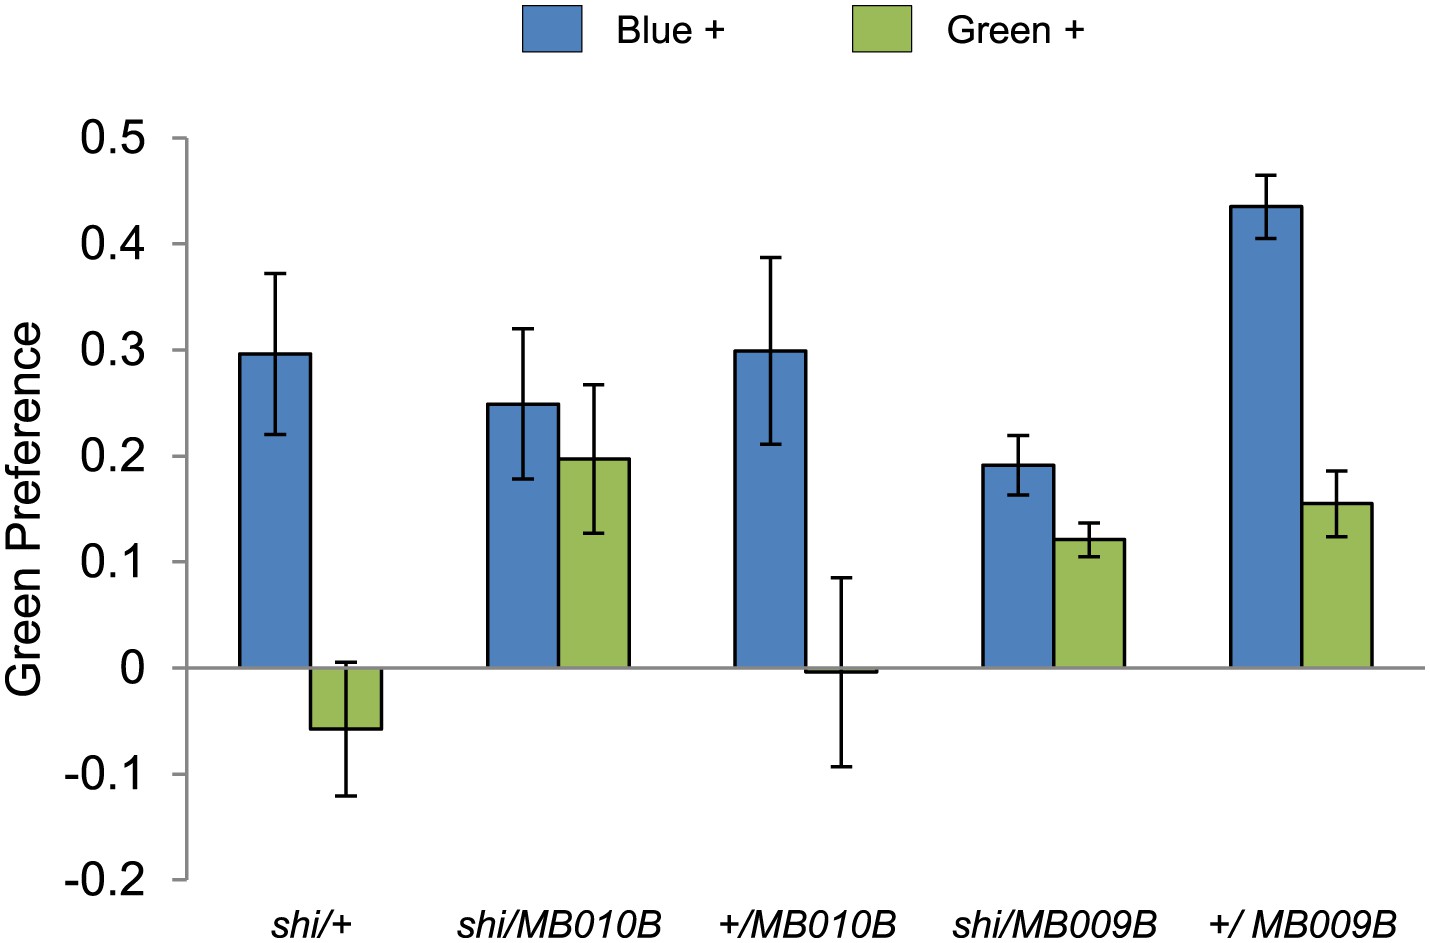
Visual stimulus preference in the memory test after aversive conditioning.
The blue and green bars represent the punished color during training in both reciprocals (Blue+ and Green+). Deviation from zero shows bias in visual choice, thus animals are able to discriminate visual stimuli in test. Bars and error bars represent mean and SEM, respectively.
Figure 8
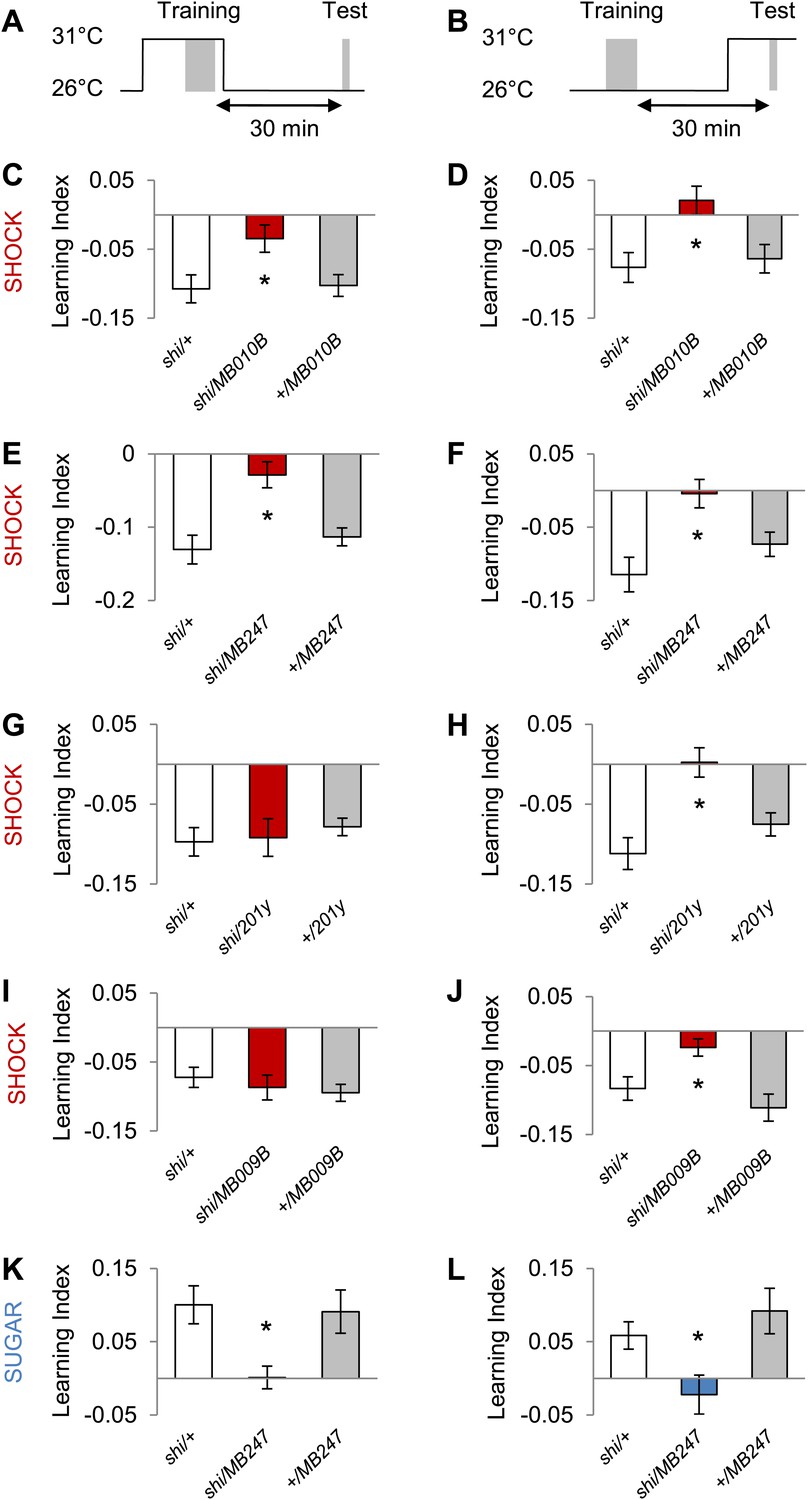
MB output is needed during visual memory acquisition and retrieval.
(A and B) Scheme of the temperature shift to block the output of corresponding neurons during training (A) or test (B). (C and D) Output of neurons labeled with MB010B-GAL4 is necessary during aversive training and test (one-way ANOVA, post-hoc pairwise comparisons, p < 0.05), n = 7–13. (E and F) Output of neurons labeled with MB247-GAL4 is necessary during aversive training and test (one-way ANOVA, post-hoc pairwise comparison, p < 0.05). n = 10–16. (G and H) Output of neurons labeled with 201y-GAL4 is dispensable during training (one-way ANOVA, p > 0.05), n = 20–22, but necessary during aversive test (one-way ANOVA, post-hoc pairwise comparisons, p < 0.01) n = 12–17. (I and J) Output of neurons labeled with MB009B-GAL4 is dispensable during training (one-way ANOVA, p > 0.1), n = 8, but necessary during aversive test (one-way ANOVA, post-hoc pairwise comparisons, p < 0.05) n = 8. (K and L) Output of MB247-labeled neurons is needed during appetitive training and test (one-way ANOVA, post-hoc pairwise comparison, p < 0.05). n = 10–28. Bars and error bars represent mean and SEM, respectively.
Figure 9
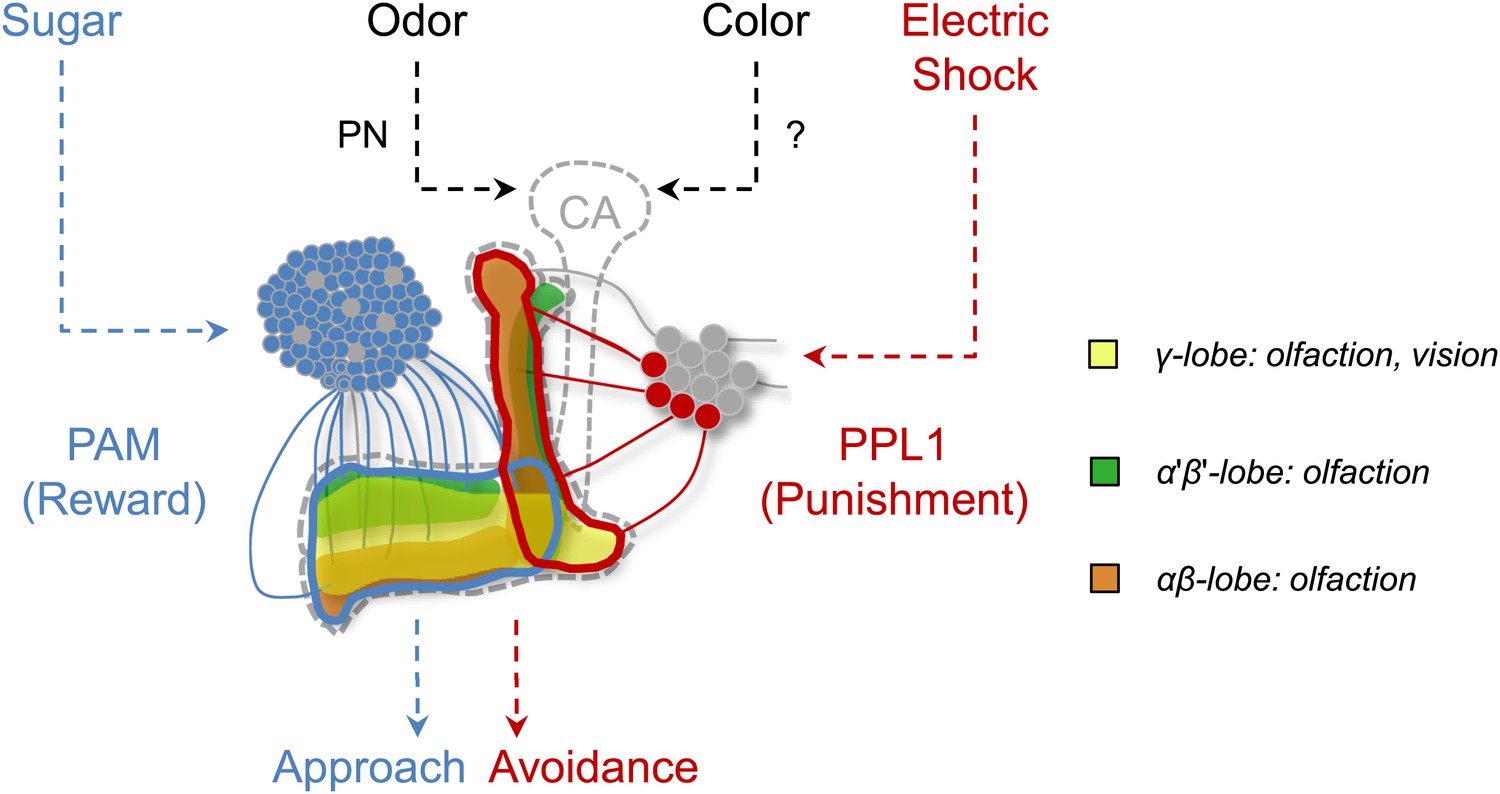
Circuit model of olfactory and visual short-term memories.
Visual and olfactory information is conveyed to partially overlapping sets (γ lobe neurons) of KCs. Olfactory input to the calyx (CA) via projection neurons (PN) is well characterized, whereas the visual input to the MB has not been identified yet. Output of KCs, representing olfactory and visual information is locally modulated by the different subsets of dopamine neurons (PAM, PPL1) to form appetitive and aversive memories.
Tables
Table 1
Sugar and shock response of the lines with impaired visual memories
| Genotype | Sugar response Mean ± SEM | Shock response Mean ± SEM | * p < 0.05 | Control data for |
|---|---|---|---|---|
| shi/+ | – | −0.429 ± 0.056 | Figures 2 and 3 | |
| shi/TH | – | −0.189 ± 0.019 | * | Figure 2 |
| +/TH | – | −0.386 ± 0.060 | Figure 2 | |
| shi/MB504B | – | −0.382 ± 0.041 | Figure 3 | |
| +/MB504B | – | −0.385 ± 0.051 | Figure 3 | |
| shi/+ | 0.718 ± 0.020 | – | Figure 2 | |
| shi/DDC | 0.729 ± 0.027 | – | Figure 2 | |
| +/DDC | 0.725 ± 0.017 | – | Figure 2 | |
| shi/+ | 0.436 ± 0.053 | – | Figure 3 | |
| shi/R58E02 | 0.544 ± 0.033 | – | Figure 3 | |
| +/R58E02 | 0.563 ± 0.036 | – | Figure 3 | |
| CS | 0.547 ± 0.041 | −0.471 ± 0.044 | Figure 4 | |
| dumb2 | 0.634 ± 0.042 | −0.289 ± 0.031 | * | Figure 4 |
| dumb2/MB247, dumb2 | – | −0.255 ± 0.028 | * | Figure 4 |
| +/MB247 | – | −0.452 ± 0.067 | Figure 4 | |
| shi/+ | 0.569 ± 0.039 † | −0.359 ± 0.034 | Figure 5 | |
| shi/201y | 0.444 ± 0.039 | −0.401 ± 0.033 | Figure 5 | |
| +/201y | 0.649 ± 0.064 | −0.353 ± 0.033 | Figure 5 | |
| shi/+ | 0.569 ± 0.039 † | −0.387 ± 0.029 | Figure 5 | |
| shi/MB247 | 0.535 ± 0.018 | −0.297 ± 0.038 | Figure 5 | |
| +/MB247 | 0.575 ± 0.048 | −0.384 ± 0.028 | Figure 5 | |
| shi/+ | 0.548 ± 0.024 | −0.366 ± 0.031 | Figure 7 | |
| shi/MB010B | 0.526 ± 0.061 | −0.393 ± 0.052 | Figure 7 | |
| +/MB010B | 0.591 ± 0.048 | −0.353 ± 0.040 | Figure 7 | |
| shi/MB009B | 0.689 ± 0.067 | −0.368 ± 0.028 | Figure 7 | |
| +/MB009B | 0.739 ± 0.017 | −0.373 ± 0.035 | Figure 7 |
-
No significant defect in naïve sugar preference is detected among the experimental groups and the corresponding control groups (one-way ANOVA, p > 0.05), n = 4–8. No significant defect in naïve shock avoidance is detected among the experimental groups and the corresponding control groups (one-way ANOVA, p > 0.05), except for shi/TH, dumb2 and dumb2/MB247, dumb2 (one-way ANOVA, post-hoc pairwise comparisons, p < 0.05). n = 6–10. Consistent with a study by Lebestky et al. (2009), we observe prolonged arousal after shocking these flies, and this hyperactivity rather than shock sensitivity is a likely cause of the reduced avoidance. Indeed, the DopR+ expression in the MB rescues visual memories, even though shock avoidance is still not intact.
-
†
The identical data is represented, as these two sets of measurements were performed in parallel.
-
*
indicates p-value lower than 0.05. Corrected p-values for shock avoidance: shi/TH vs. shi/+: p = 0.006, shi/TH vs. +/TH: p = 0.037; CS vs. dumb2: p = 0.01, dumb2/MB247,dumb2 vs. CS/MB247: p = 0.0492
Download links
A two-part list of links to download the article, or parts of the article, in various formats.
Downloads (link to download the article as PDF)
Open citations (links to open the citations from this article in various online reference manager services)
Cite this article (links to download the citations from this article in formats compatible with various reference manager tools)
Shared mushroom body circuits underlie visual and olfactory memories in Drosophila
eLife 3:e02395.
https://doi.org/10.7554/eLife.02395


