MicroRNA-9 controls dendritic development by targeting REST
- Max Planck Institute of Psychiatry, Germany
- University of Bonn, Germany
- Instituto de Investigación en Biomedicina de Buenos Aires (IBioBA)-CONICET-Partner Institute of the Max Planck Society, Argentina
- Helmholtz Zentrum München, Germany
- Technische Universität, Germany
- Deutsches Zentrum für Neurodegenerative Erkrankungen, Germany
- Munich Cluster for System Neurology, Germany
- University of Utah School of Medicine, United States
Figures
Figure 1 with 3 supplements
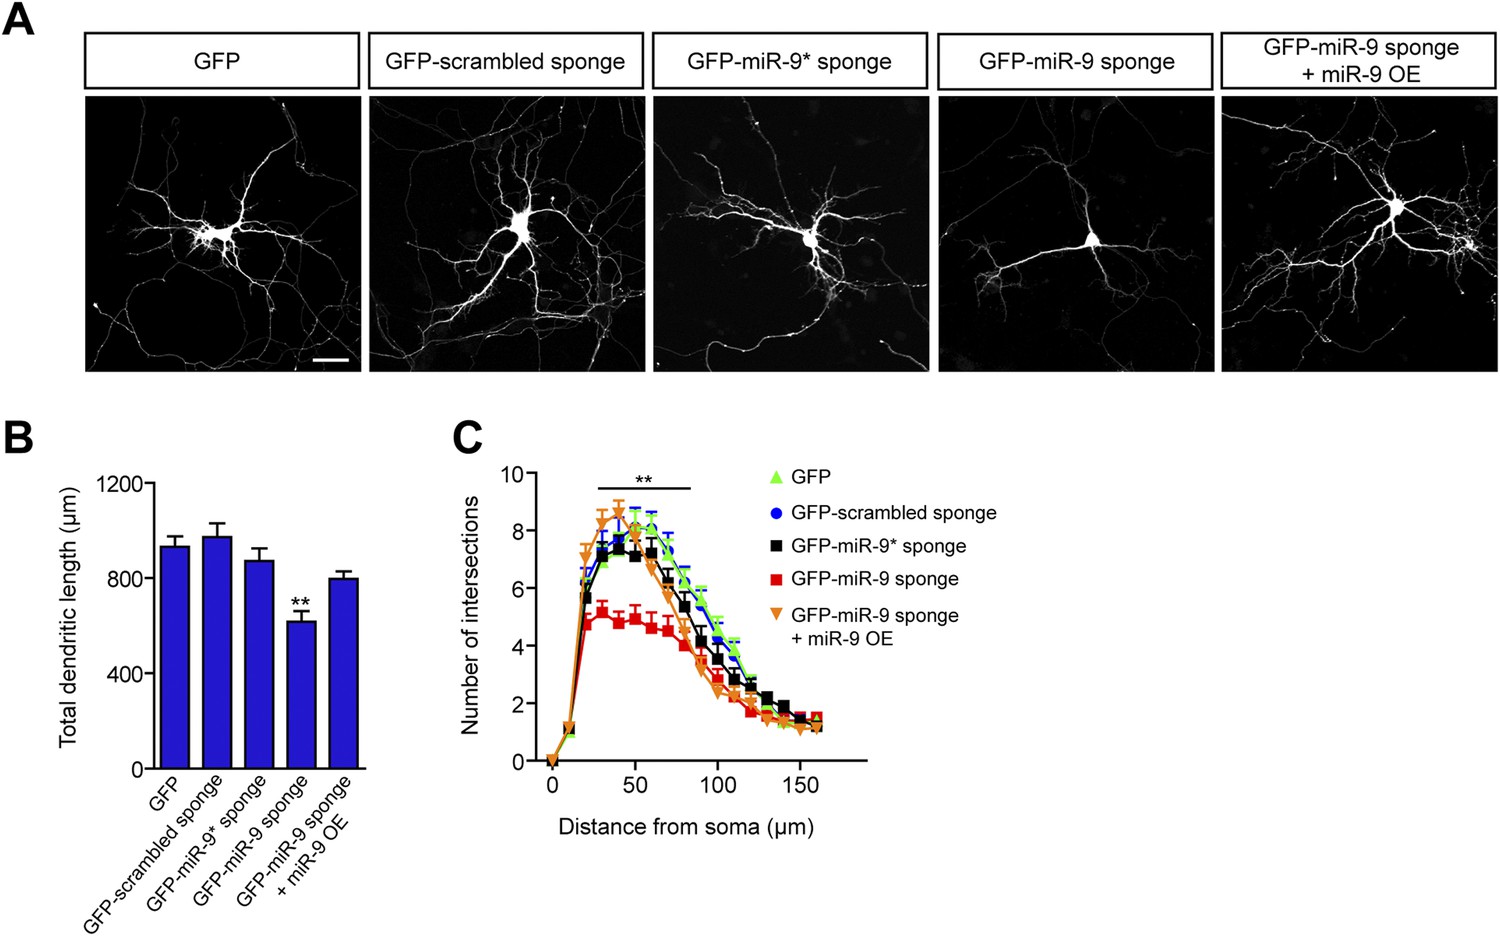
miR-9 regulates dendritic development.
(A) Representative images of primary hippocampal neurons transiently transfected at DIV4 with the indicated constructs and fixed at DIV10. mRFP was cotransfected for visualization. Scale bar 50 μm. (B) Quantification of the total dendritic length (mean + SEM, one-way ANOVA, and Bonferroni post-test) and (C) quantification of dendritic complexity by Sholl analysis of neurons transfected as described in (A) (mean + SEM, repeated measures two-way ANOVA and Bonferroni post-test showing GFP-scrambled vs GFP-miR-9 sponge). **p < 0.01, n ≥ 30 neurons per condition.
Figure 1—figure supplement 1
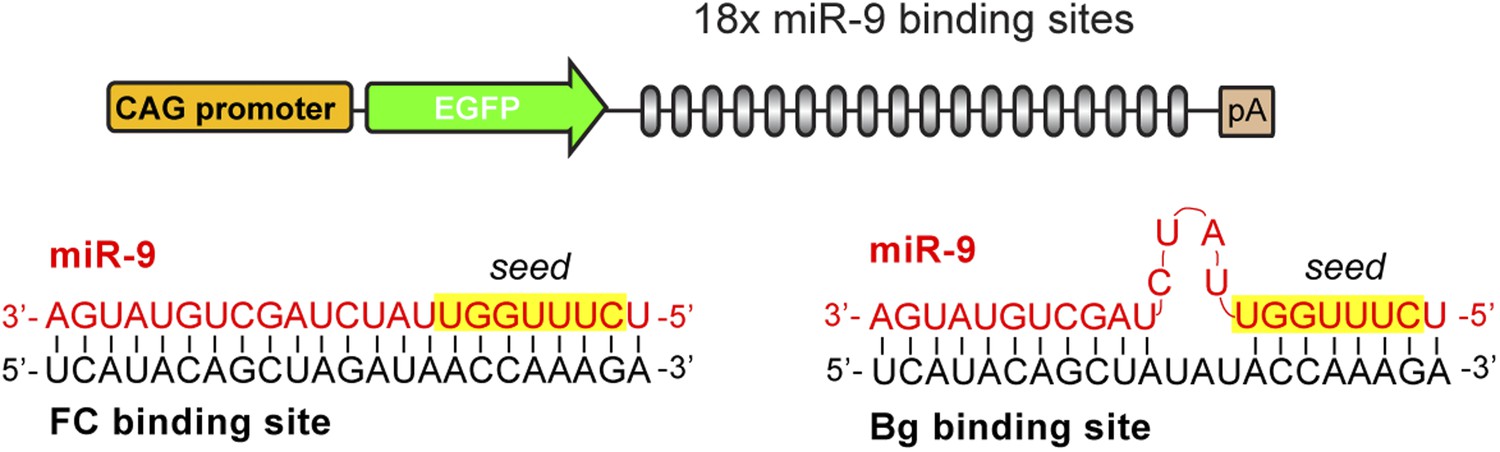
FC and Bg miR-9 sponges.
Schematic representation of the GFP-miR-9 sponge construct and the interaction between miR-9 and the FC (left) or Bg (right) binding sites.
Figure 1—figure supplement 2
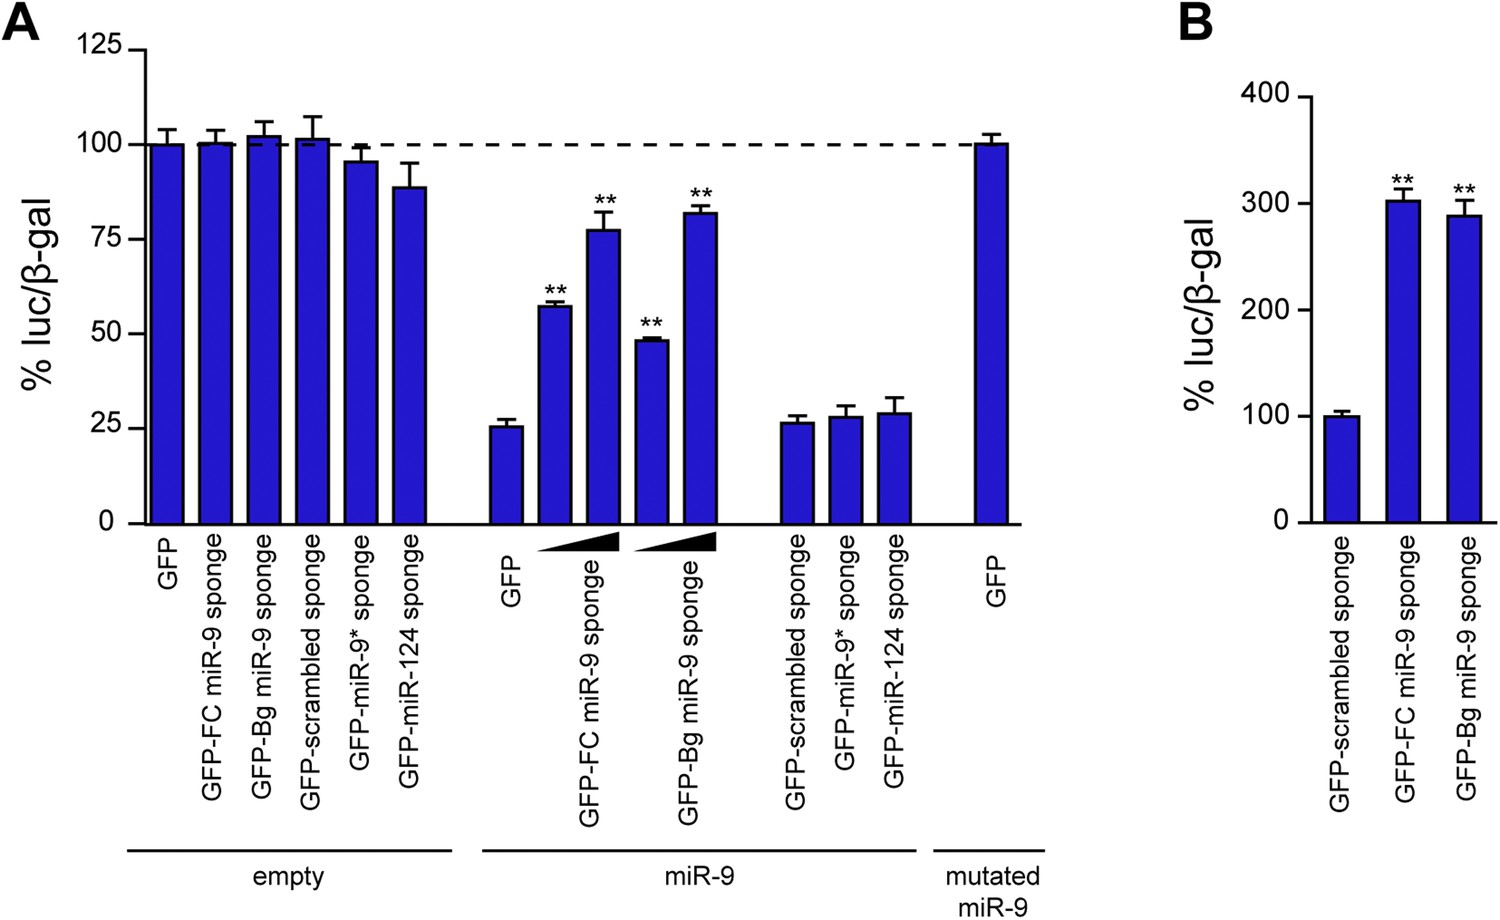
Comparison of the efficacy of FC and Bg miR-9 sponges.
(A) The efficacy of miR-9 sponges to inhibit miR-9 activity was assessed by cotransfection of Neuro-2a cells with a luciferase-based miR-9 sensor, a CMV-lacZ construct to normalize transfection efficiency, and the indicated sponge constructs. Overexpression of miR-9 induced a strong downregulation in the luciferase activity (GFP + empty vs GFP + miR-9). GFP-FC- and GFP-Bg-miR-9 sponges were equally effective to rescue the expression of the miR-9 sensor in a dose-dependent manner. To control the specificity of the effect of the miR-9 sponges, a scrambled version of the miR-9 sponge and sponges designed to bind other microRNAs (miR-9*, miR-124) were used. To check the specificity of the sensor, a mutated version of miR-9 was expressed. (B) Primary neurons were transfected with the sponge plasmids described in (A). Both miR-9 sponges were also equally effective to rescue the expression of the miR-9 sensor. Values represent mean + SEM, one-way ANOVA, and Bonferroni post-test, **p < 0.01.
Figure 1—figure supplement 3
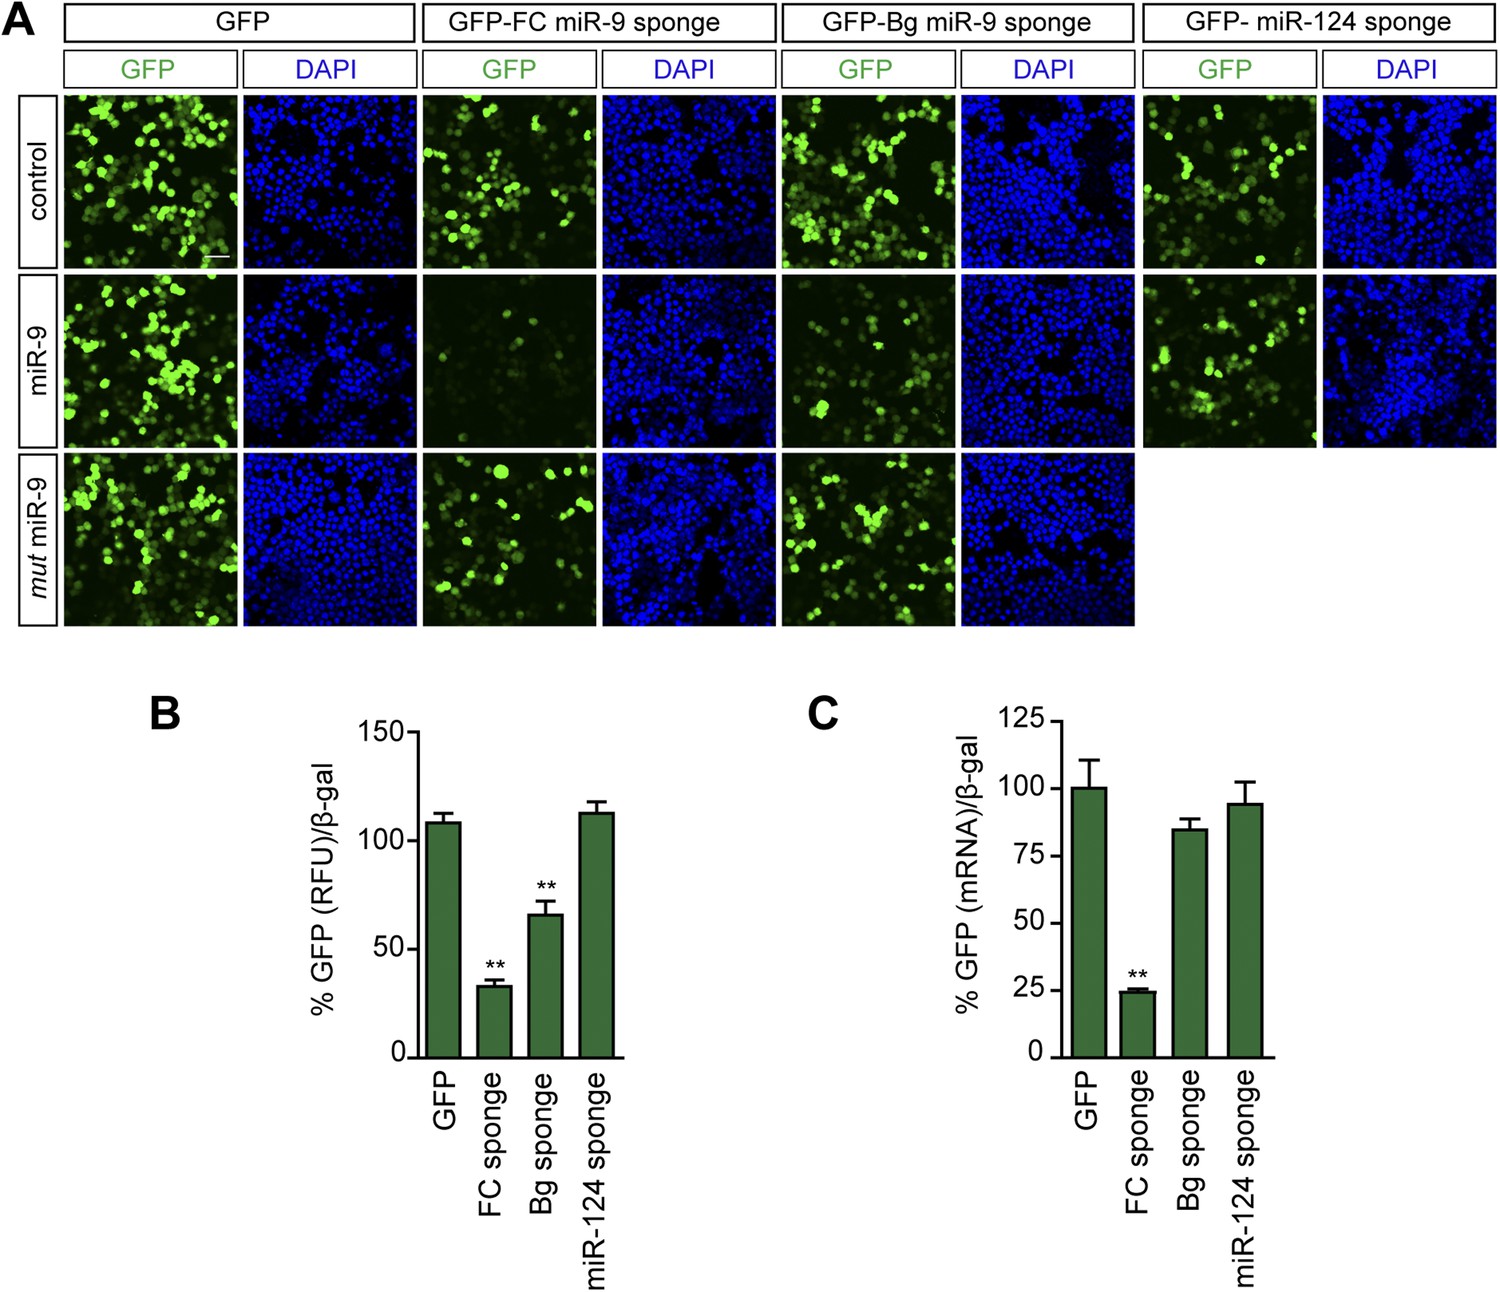
FC and BG sponges as reporters of miR-9 activity.
Neuro-2a cells were cotransfected with a plasmid expressing either a GFP-sponge-construct (FC-miR-9, Bg-miR-9, miR-124) or GFP, and an empty vector (control), a plasmid expressing miR-9, or a plasmid expressing the mutated form of miR-9. (A) Microscopic images of Neuro-2a cells showing native GFP fluorescence. Note that GFP encoded by both FC and Bg miR-9 sponges is downregulated in miR-9-cotransfected cells. Scale bar: 25 μm. (B) To quantify miR-9-induced GFP downregulation, GFP-derived fluorescence was quantified in protein lysates from transfected Neuro-2a. Quantification of GFP downregulation is expressed as the percentage of remaining GFP fluorescence (normalized) after miR-9 cotransfection. For each condition, 100% represents GFP fluorescence when an empty control vector was cotransfected. FC sponges are more sensitive reporters of miR-9 activity. (C) The stability of the sponge transcripts was estimated by qPCR in transfected Neuro-2a cells. Quantification of the sponge transcript levels by qPCR (GFP) after miR-9 cotransfection. For each condition, 100% represents the amount of GFP transcript when an empty control vector was cotransfected. The lower stability of the FC sponge likely reflects AGO2-mediated degradation and is probably the basis of the higher sensitivity of this sponge variant as reporter. Values represent mean + SEM, one-way ANOVA, and Bonferroni post-test, **p < 0.01.
Figure 2 with 2 supplements
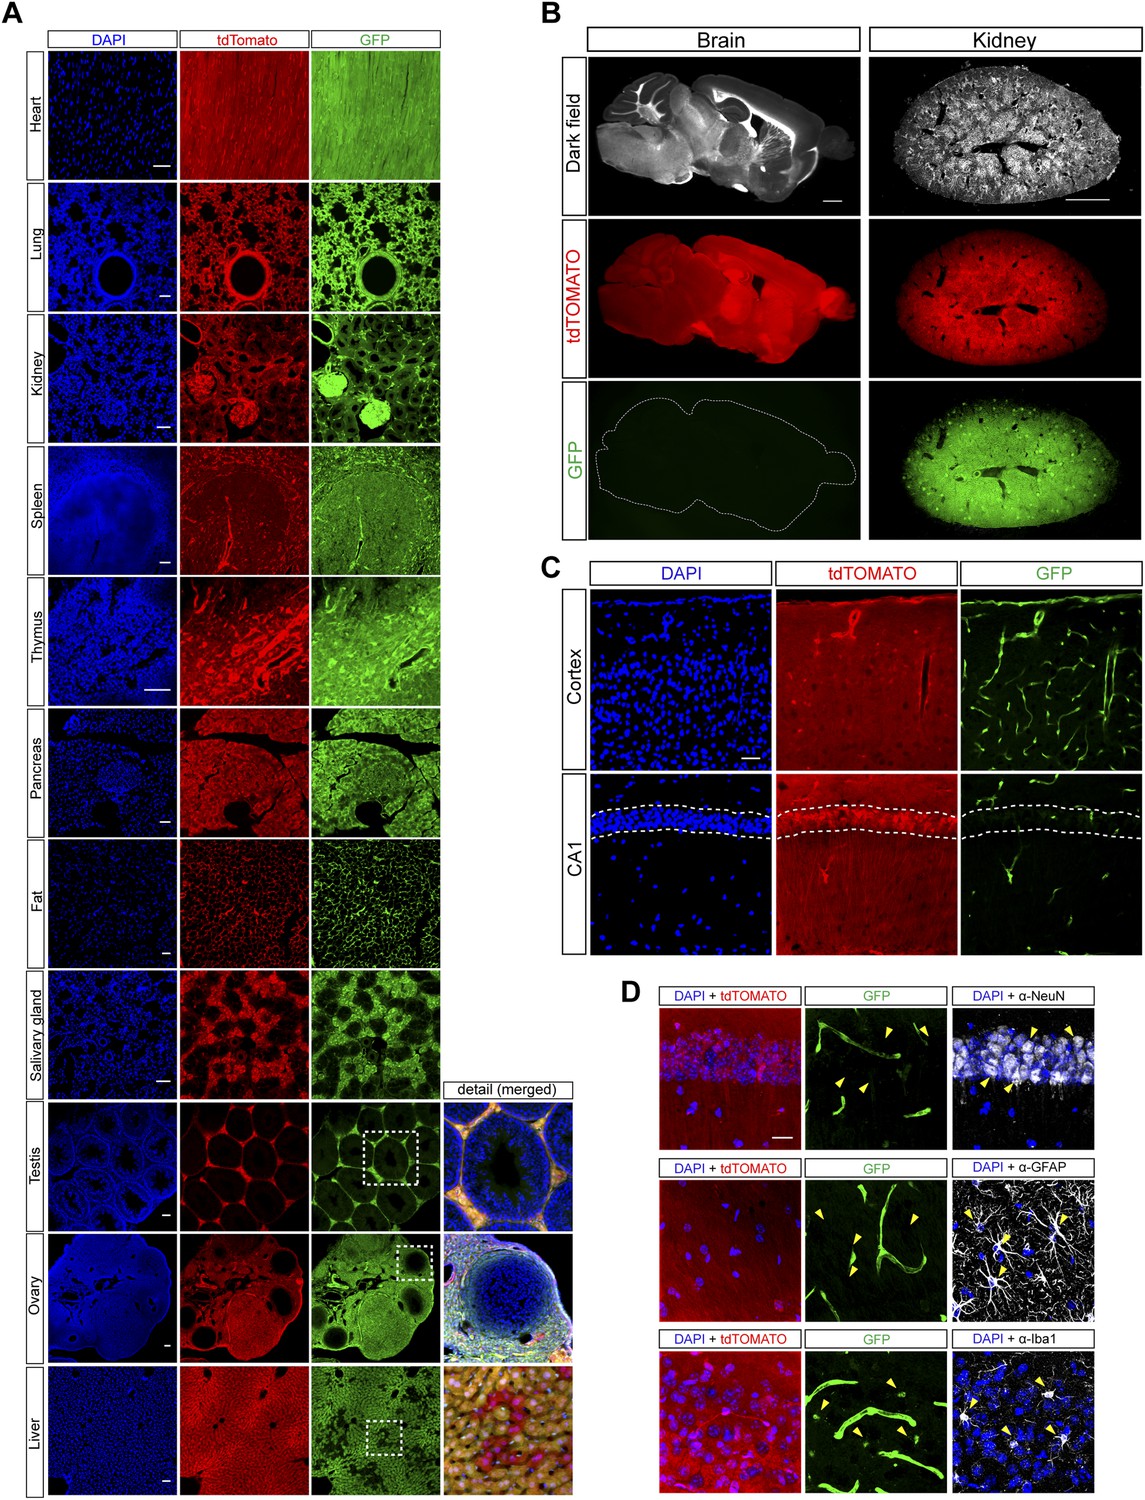
Histological analysis of miR-9-Sp/tdTomato reporter mouse line.
(A) Confocal images of different organs of the reporter mice showing native GFP and tdTomato fluorescence. Scale bar: 50 μm. (B) Low power images of sections from brain and kidney showing native GFP and tdTomato fluorescence. Scale bar: 1 mm. (C) At microscopic level within the brain, strong native GFP signal could be only detected in blood vessels (top) and in the choroid plexus. Note the downregulation of GFP in the stratum pyramidale (dashed lines) of hippocampal CA1 (bottom). Scale bar: 50 μm. (D) Brain sections showing native GFP and tdTomato fluorescence with immunohistochemistry for different cell-specific markers: NeuN (neurons), GFAP (astrocytes), and Iba1 (microglia). Arrows show examples of individual cells. Note the faint native GFP signal in microglial cells. Scale bar: 20 μm.
Figure 2—figure supplement 1
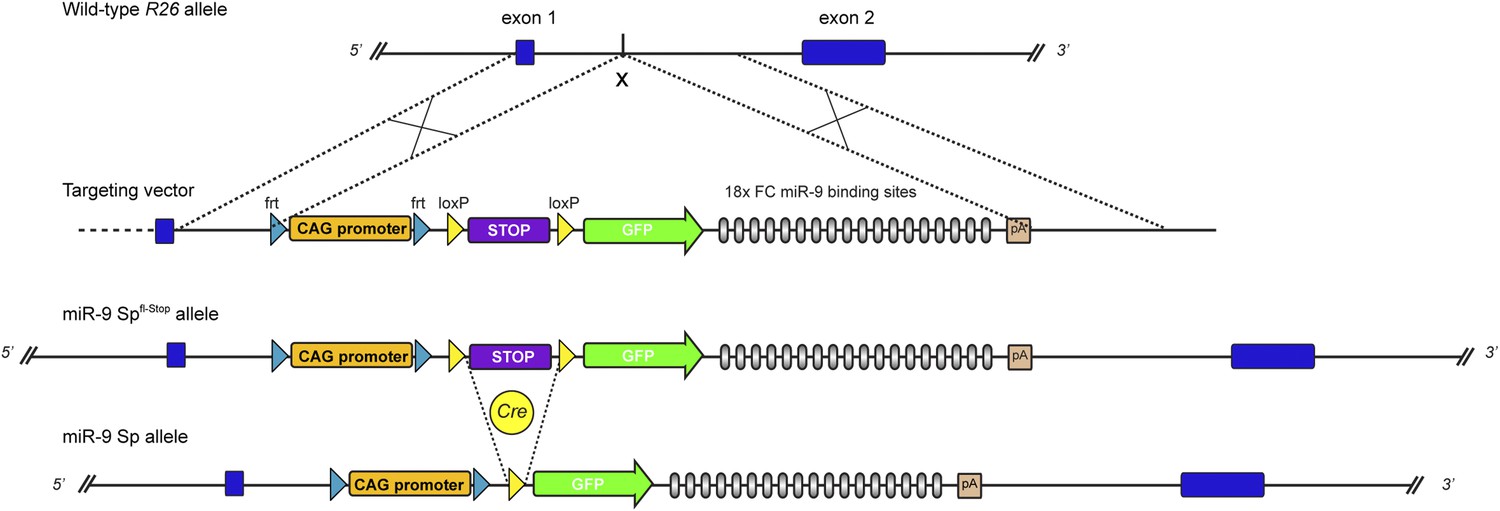
Generation of conditional GFP-FC-miR-9 sponge mice.
Strategy for conditional, Cre-mediated expression of FC-miR-9 sponge from the Rosa26 (R26) locus. Schematic representation of wild-type R26 locus, targeting vector, recombined miR-9-Spfl-Stop allele and activated miR-9-Sp allele resulting from Cre-mediated excision of the ‘Stop’ cassette. To maximize the level of transcription of the transgene, we used a CAG promoter, significantly stronger than the endogenous R26 promoter.
Figure 2—figure supplement 2
miR-9 reporter mouse line.
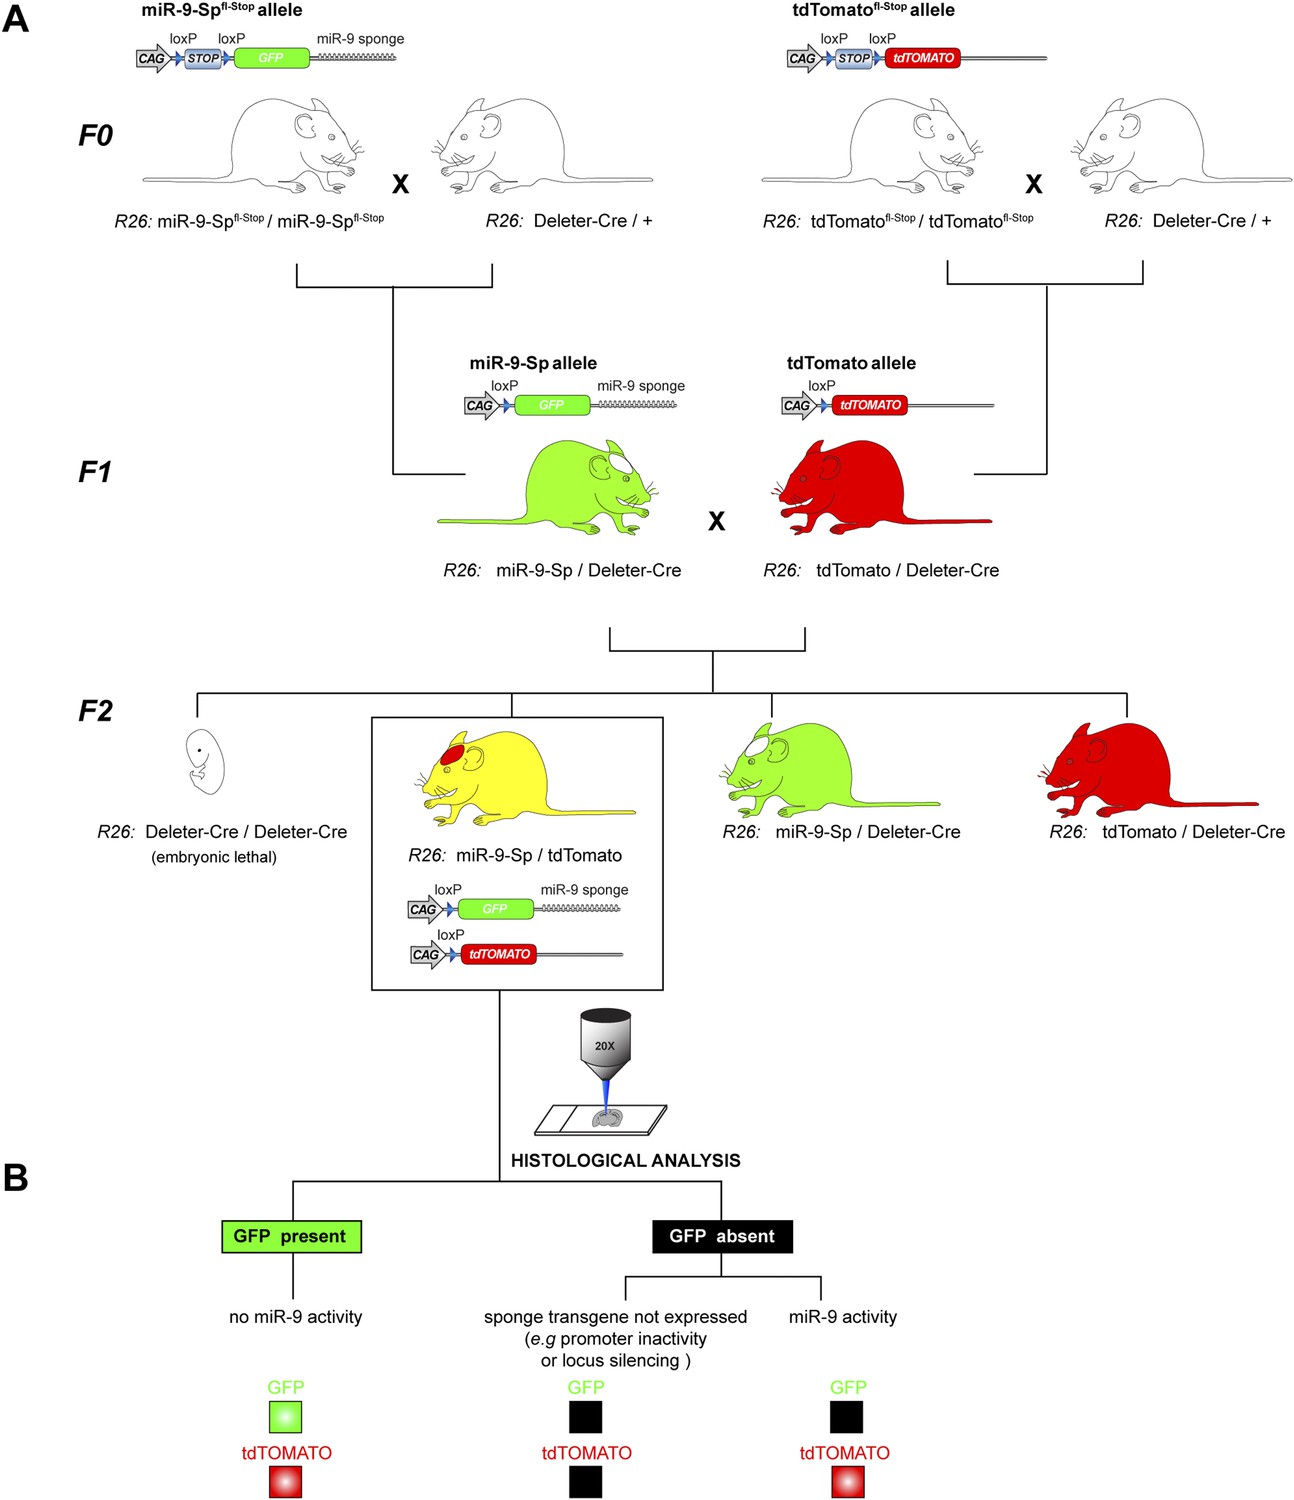
(A) Breeding strategy to generate the miR-9-Sp/tdTomato reporter mouse line from conditional miR-9-Spfl-Stop and tdTomatofl−Stop mouse lines. The genotypes described below each mouse cartoon indicate the alleles in the Rosa26 (R26) locus. In the F0, homozygous mice for miR-9-Spfl-Stop and the tdTomatofl-Stop alleles were independently bred with a Deleter-Cre mouse line, carrying a ubiquitously expressed Cre transgene in the R26 locus. This leads to a removal of the ‘Stop’ cassette from the miR-9-Spfl-Stop and the tdTomatofl-Stop alleles in all tissues of F1 mice, including the germ line. As a result, the miR-9-Sp and tdTomato alleles are ubiquitously expressed. An additional breeding step was needed to generate in the F2 the heterozygous reporter mice, carrying one miR-9-Sp allele and one tdTomato allele, both in the R26 locus. Note that both transgenes are active and that the Deleter-Cre transgene is not present in the reporter mice. (B) The reporter function of the mouse line relies on the miR-9-induced GFP down-regulation of the sponge transcript. The tdTomato transgene acts as a control allele since it is located in the same locus and is also driven by a CAG promoter. The absence of GFP signal would therefore imply miR-9 activity only if tdTomato signal is present, excluding lack of expression of the sponge transgene.
Figure 3

Characterization of miR-9-SpNestin-Cre mouse line.
miR-9-Spfl-Stop littermates were used as controls. The expression of the sponge construct was evaluated by (A) in situ hybridization using anti-GFP riboprobe and (B) qPCR. As an additional readout of the expression of the sponge, GFP protein content was determined by (C) Western blotting and (D and E) immunohistochemistry with anti-GFP antibodies. (D) Note that only a faint native GFP fluorescence is observed in miR-9-SpNestin-Cre brain sections, whereas a strong GFP signal can be detected after immunofluorescence, indicating that GFP protein levels are low but not completely down-regulated by miR-9. Scale bar: 100 μm. (E) Co-immunohistochemistry of GFP and NeuN, showing GFP expression in CA1 neurons. Scale bar: 50 μm. (F) Quantification of miR-9 levels in hippocampal and cortical samples by qPCR using Taqman probes. (G) Quantification of miR-9 precursors (miR-9-1, miR-9-2, and miR-9-3) in hippocampal and cortical samples by qPCR. Values represent mean + SEM, one-way ANOVA, and Bonferroni post-test, *p < 0.05, **p < 0.01, n = 4.
Figure 4 with 3 supplements
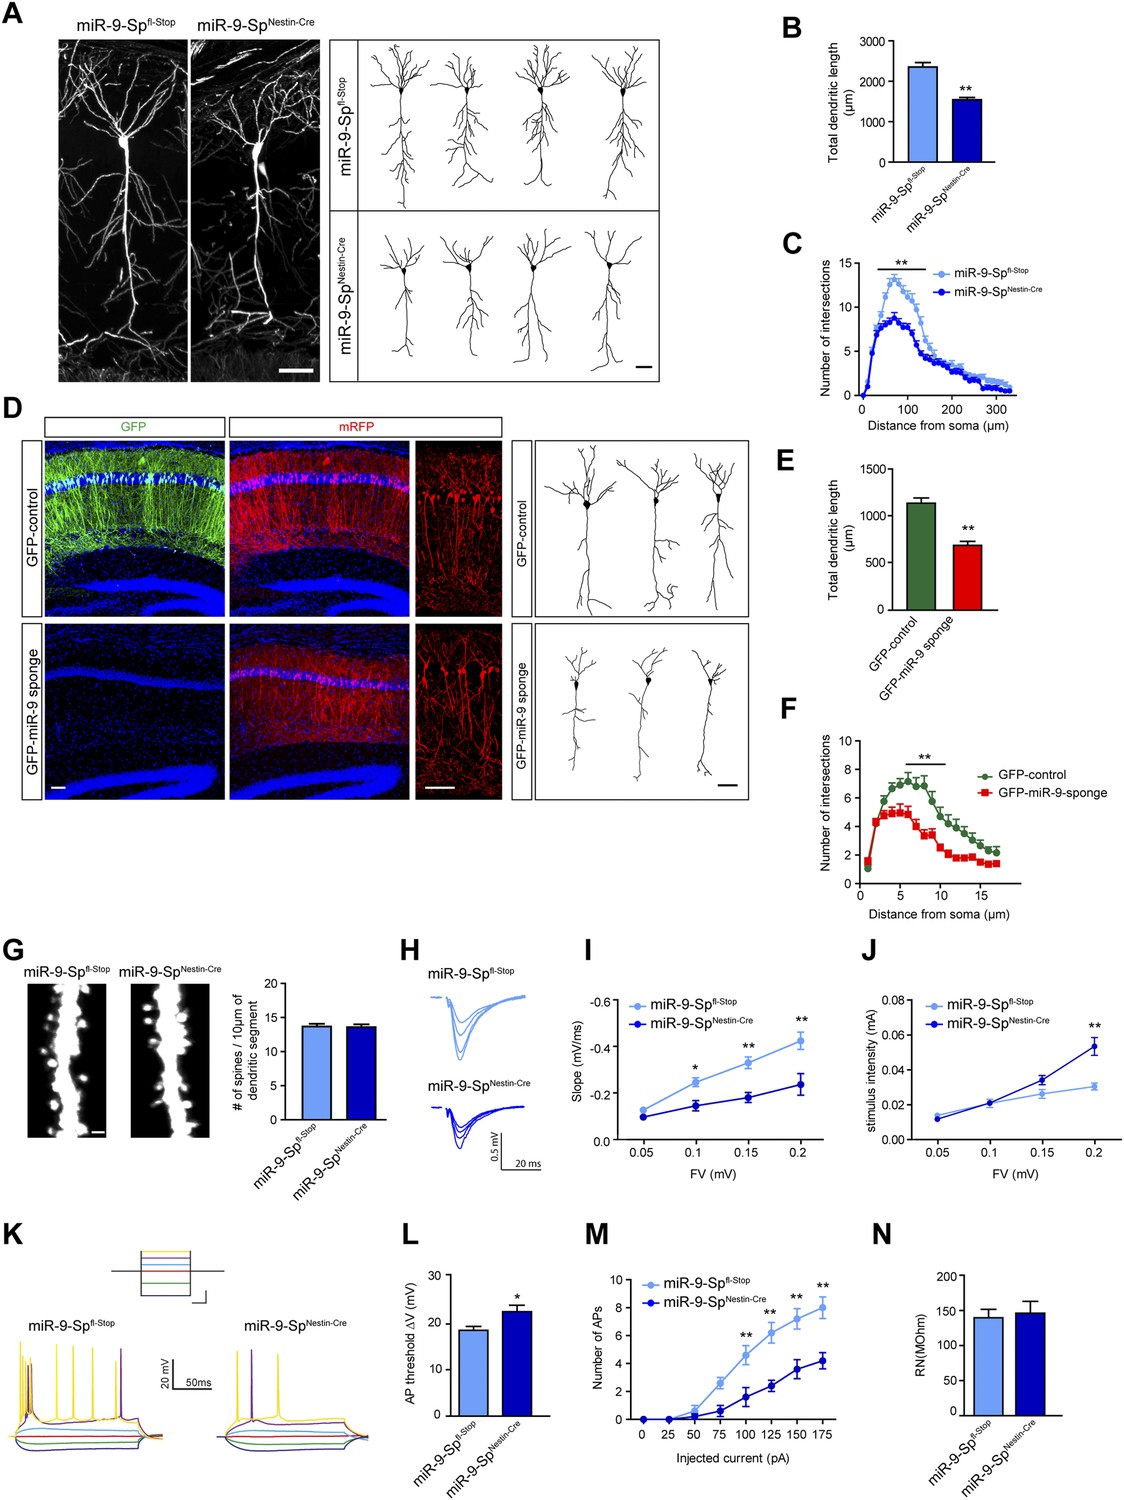
miR-9 sponge transgenic mice exhibit dendritic growth defects and impaired synaptic transmission.
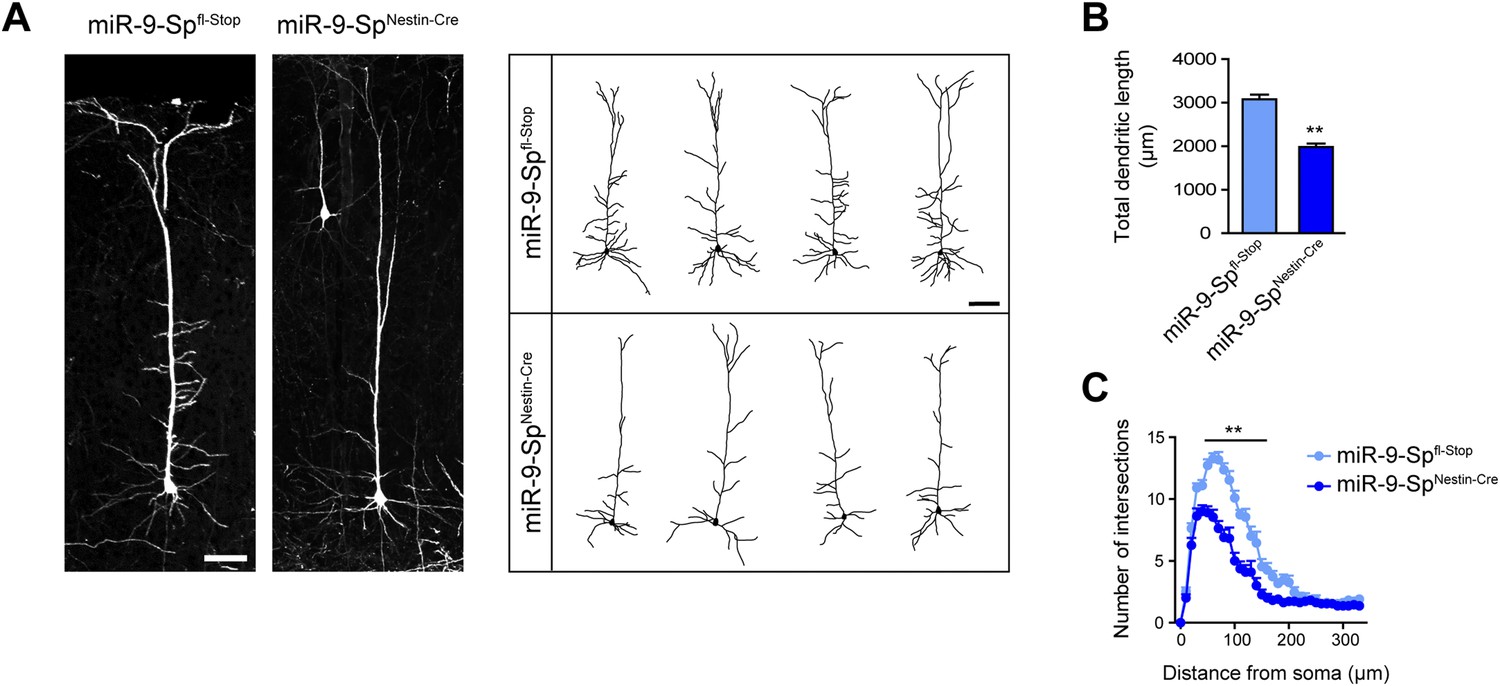
(A) Confocal stack images (left) and representative tracings (right) of CA1 neurons of Thy1EGFP-miR-9-Spfl-Stop (control) and Thy1EGFP-miR-9-SpNestin-Cre mice. Scale bar: 50 μm. (B) Quantification of the total dendritic length of neuronal tracings (mean + SEM, Student's t test), (C) Sholl analysis of neuronal tracings (mean + SEM, two-way ANOVA and Bonferroni post-test). (B and C) **p < 0.01, n ≥ 30 neurons per condition recruited from five mice per genotype. (D–F) GFP-miR-9 sponge or GFP (control) plus mRFP plasmids (for visualization) were in utero electroporated at E14.5. At P30, pyramidal hippocampal neurons in CA1 were traced with the Neurolucida software. (D) Images of transfected brain sections (left). Note the downregulation of GFP encoded in the miR-9 sponge plasmid. Scale bar: 100 μm. Representative tracings (right). Scale bar: 50 μm. (E) miR-9 sponge-transfected neurons show a reduced total dendritic length (mean + SEM, Student’s t test) (F) and reduced dendritic complexity (mean + SEM, two-way ANOVA and Bonferroni post-test). (E and F) **p < 0.01, n ≥ 18–20 neurons per condition. (G) Dendritic spines on secondary apical dendrites of CA1 neurons of Thy1EGFP-miR-9-Spfl-Stop (control) and Thy1EGFP-miR-9-SpNestin-Cre mice and quantification of spine density (n.s, Student's t test, n ≥ 30 neurons per condition recruited from five mice per genotype). Scale bar: 1 μm. (H–J) fEPSP recordings in acute hippocampal brain slices demonstrate an impairment of synaptic transmission. (H) Sample traces. (I) Input–output curve showing reduced synaptic transmission and (J) reduced excitability in miR-9-SpNestin-Cre slices (mean ± SEM, two-way ANOVA and Bonferroni post-test, *p < 0.05, **p < 0.01, n ≥ 9 recordings per condition recruited from 4 mice per genotype). (K–N) Current-clamp recordings. (K) Sample traces of current-clamp recordings. Inset shows the current step protocol, and the same colors indicate same injected currents: dark blue, −100 pA; green, −50 pA; red, 0 pA; light blue, 25 pA; magenta, 50 pA; yellow, 75 pA. Calibration (for inset): 250 ms, 50 pA. (L) Action potential (AP) threshold is shifted to more positive membrane potentials in CA1 neurons form miR-9-SpNestin-Cre mice (mean + SEM, Student's t test) and (M) fewer APs were elicited with the same current injected (mean ± SEM, two-way ANOVA and Bonferroni post-test, *p < 0.05, **p < 0.01, n ≥ 9 recordings per condition recruited from four mice per genotype). (N) Input resistance was not changed (mean + SEM, Student's t test, n.s).
Figure 4—figure supplement 1
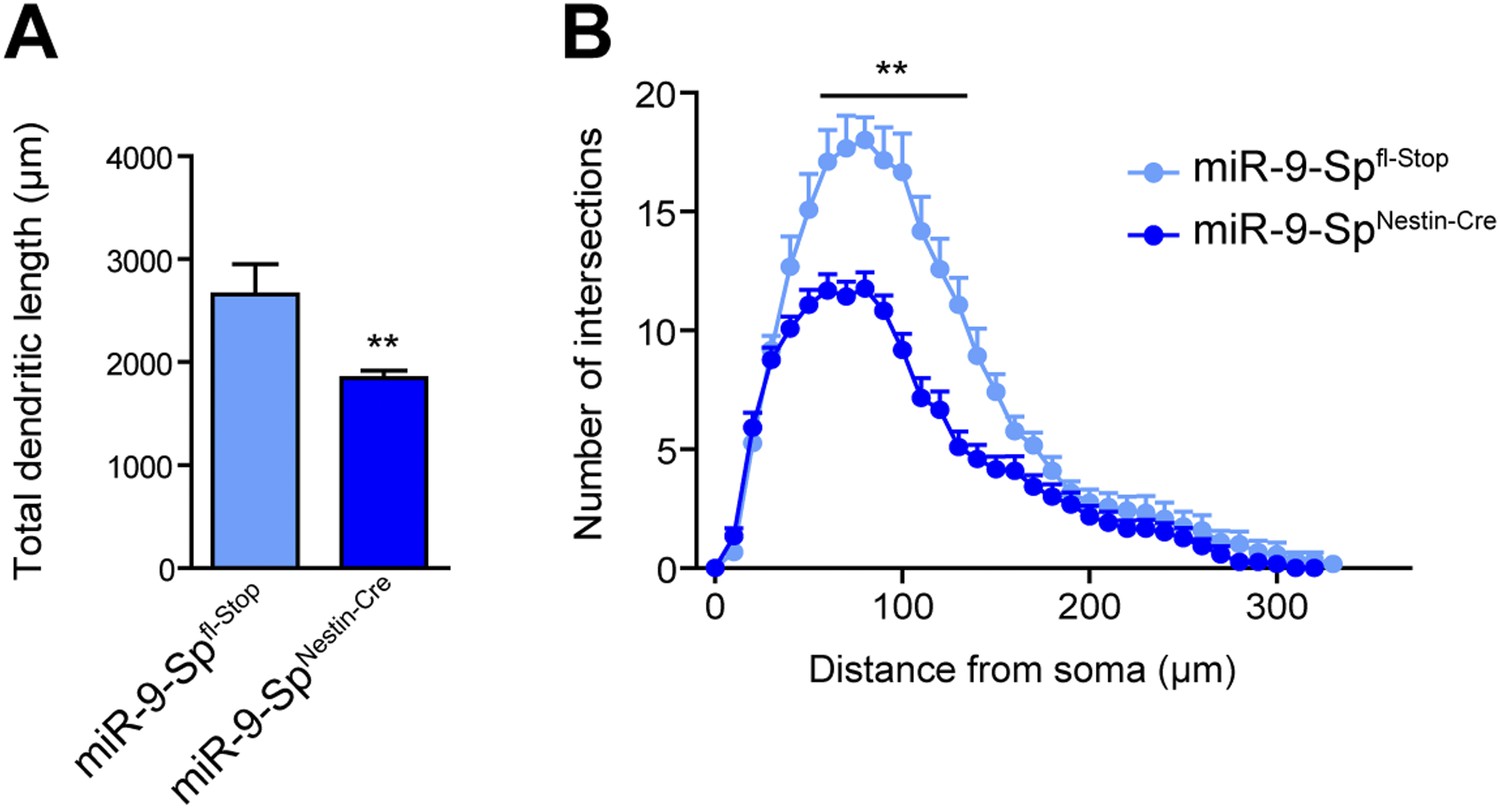
miR-9 loss of function induces dendritic growth defects.
Golgi-stained sections from miR-9-SpNestin-Cre and miR-9-Spfl-Stop (control) mice were used to trace CA1 neurons with the Neurolucida software. (A) Neurons from miR-9-SpNestin-Cre mice display a reduced total dendritic length (mean + SEM, Student's t test) and (B) reduced dendritic complexity maeasured by Sholl analysis (mean + SEM, two-way ANOVA and Bonferroni post-test). **p < 0.01, n ≥ 30 neurons per condition recruited from five mice per genotype.
Figure 4—figure supplement 2
Dendritic defects in cortical neurons of miR-9 sponge transgenic mice.
(A) Confocal stack images (left) and representative tracings (right) of layer V cortical neurons in the primary somatosensory region of Thy1EGFP-miR-9-Spfl-Stop (control) and Thy1EGFP-miR-9-SpNestin-Cre mice. Scale bar: 100 μm. (B) Quantification of the total dendritic length of neuronal tracings (mean + SEM, Student's t test) (C) Sholl analysis of neuronal tracings (mean + SEM, two-way ANOVA and Bonferroni post-test). (B and C) **p < 0.01, n ≥ 30 neurons per condition recruited from five mice per genotype.
Figure 4—figure supplement 3
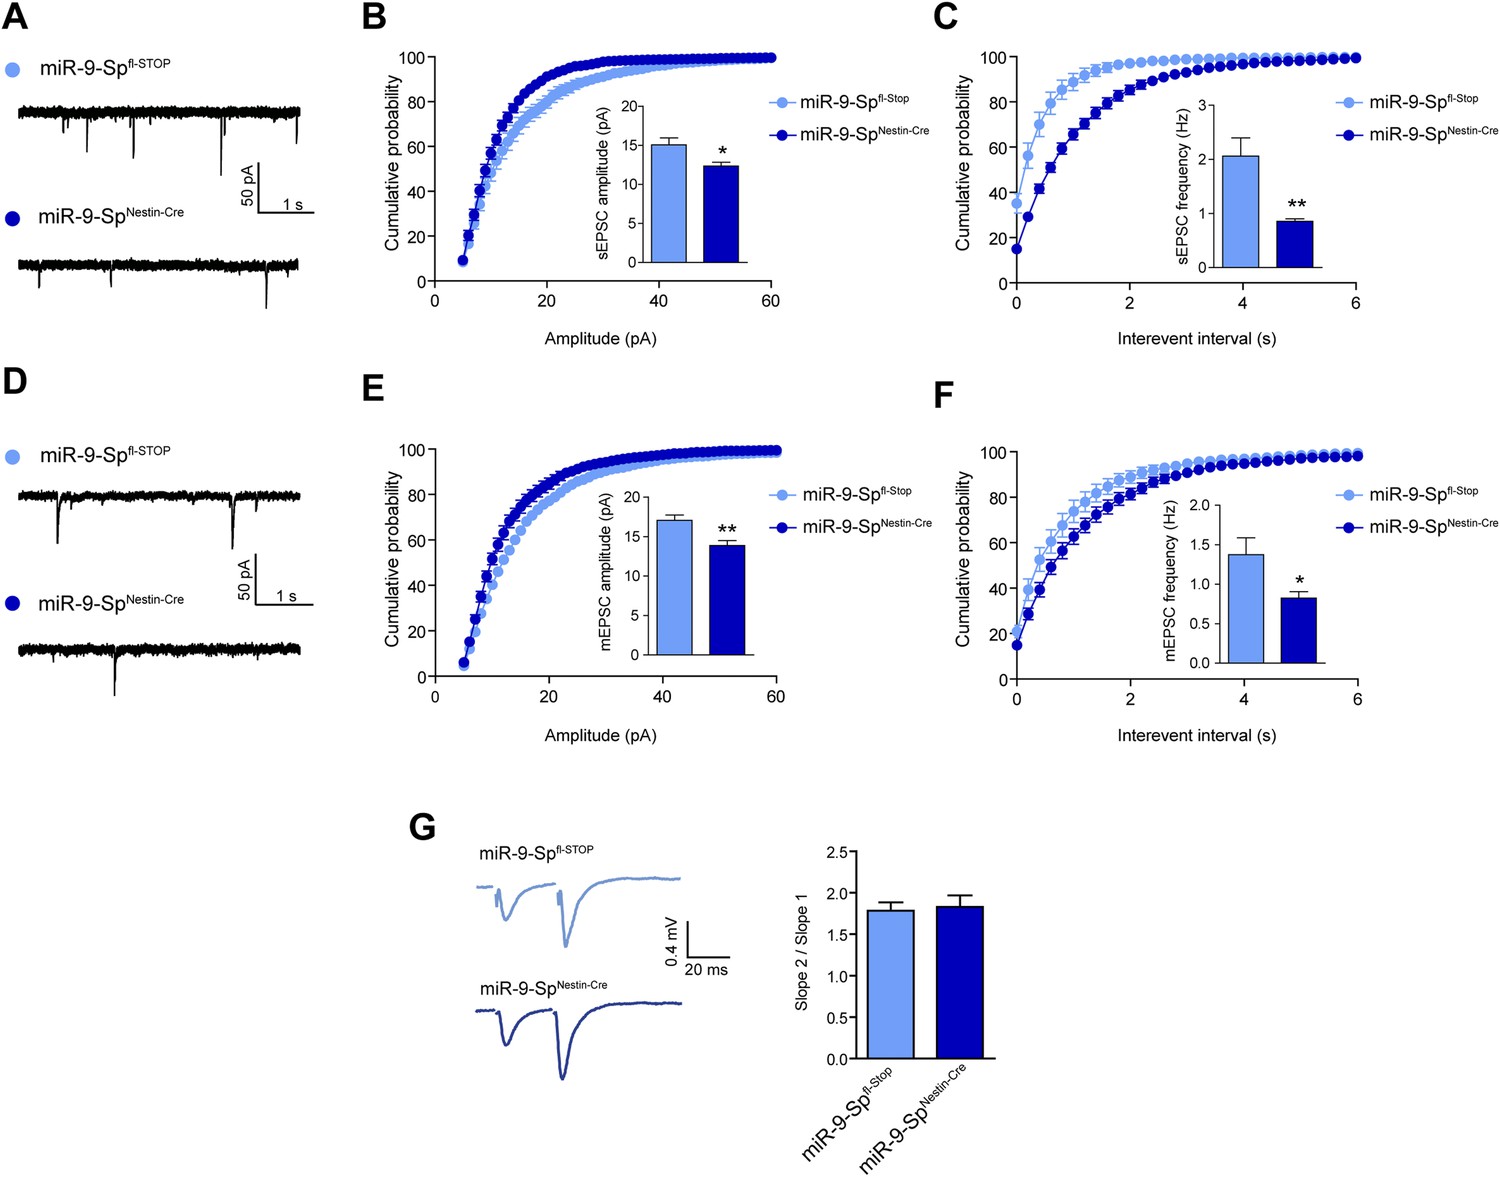
sEPSC and mEPSC are affected by miR-9 loss of function.
(A) sEPSC sample traces. (B) sEPSC amplitude is reduced in miR-9-SpNestin-Cre neurons. (C) sEPSC frequency is strongly reduced in miR-9-SpNestin-Cre neurons. (D) mEPSC sample traces. (E) mEPSC amplitude and (F) frequency are reduced in miR-9-SpNestin-Cre neurons. (G) No changes were found in paired-pulse facilitation. *p < 0.05, **p < 0.01. Distributions were analyzed by KS test; average values were analyzed by Student's t test. n ≥ 9 recordings per condition recruited from four mice per genotype.
Figure 5 with 1 supplement
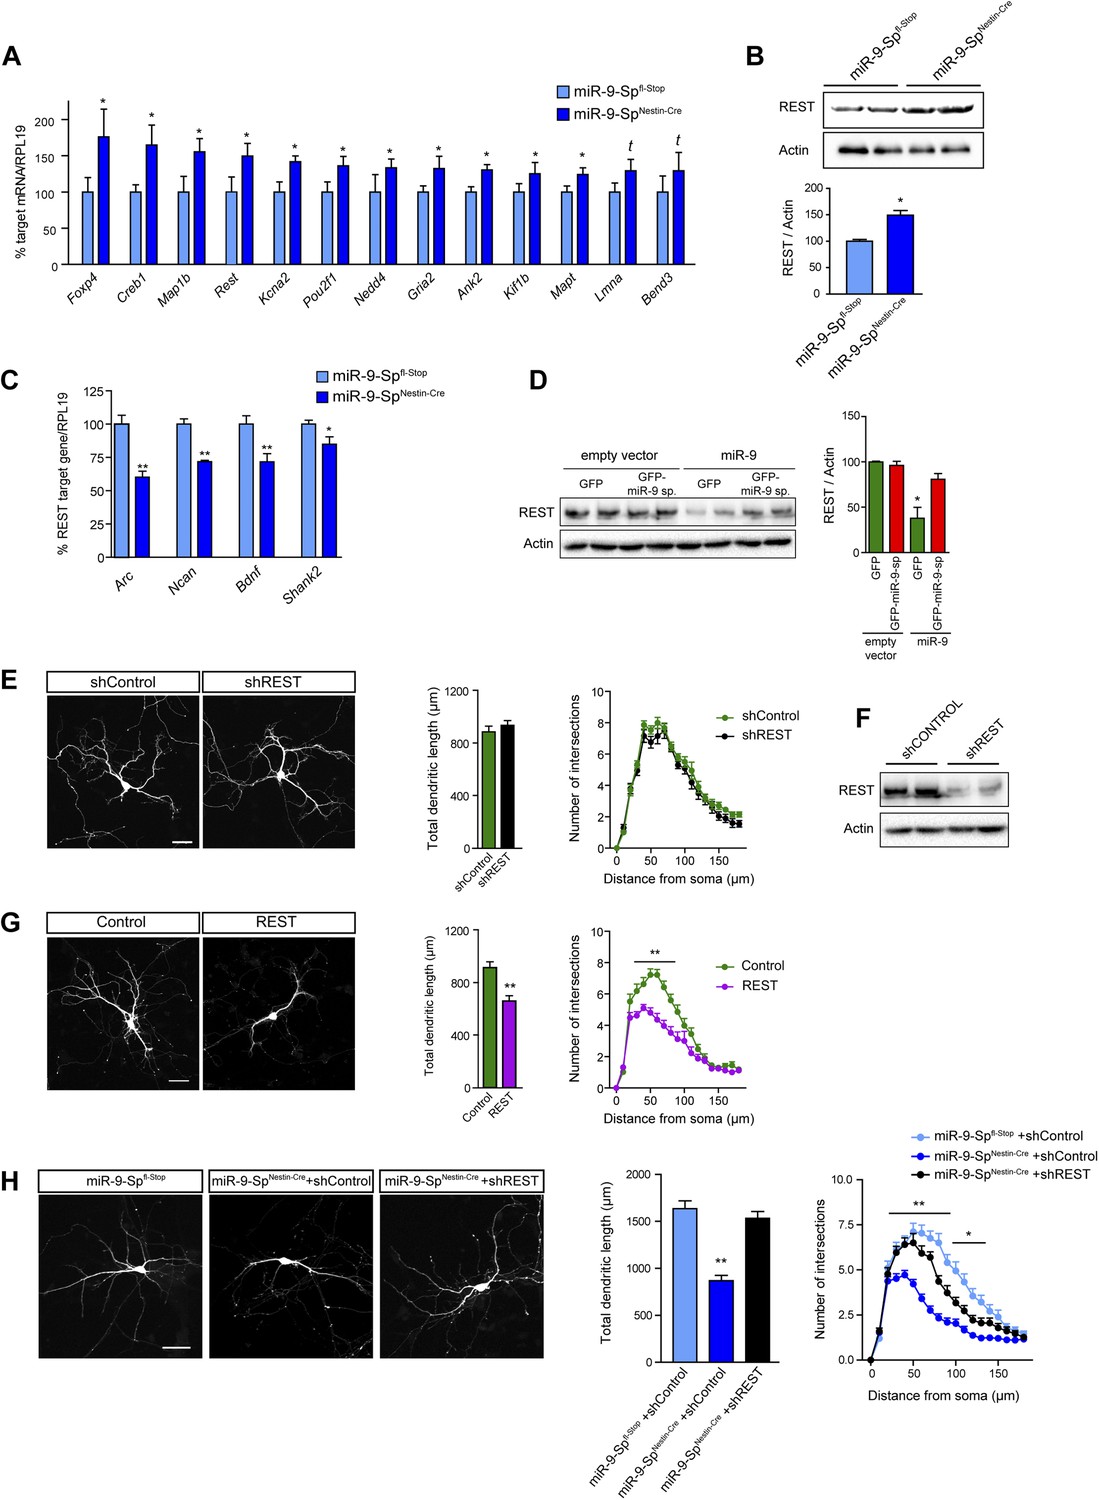
Dendritic growth defects after miR-9 loss are mediated by REST.
(A) Quantitative PCR analysis of predicted miR-9 target mRNAs in hippocampal primary neurons (DIV3) prepared from miR-9-SpNestin-Cre and miR-9 Spfl−Stop (control) E17.5 embryos (mean + SEM, paired Student's t test, n = 4, *p<0.05; Supplementary file 1). (B) Representative immunoblot and quantification of the normalized OD (mean + SEM, Student's t test, n = 3, *p < 0.05). (C) Quantitative PCR analysis of the expression of REST targets in the same neurons as in (A) (mean + SEM, paired Student's t test, n = 4, *p < 0.05; **p < 0.01). (D) Representative immunoblot (left) and quantification (right) showing that FC-miR-9 sponges reversed miR-9-induced silencing of endogenous REST in transfected HEK-293 cells. Note that REST levels are not upregulated in the condition ‘empty vector + GFP-miR-9 sponge’, because miR-9 is not expressed in HEK-293 cells (mean + SEM, one-way ANOVA, and Bonferroni post-test, *p < 0.05, n = 3.). (E) REST knock-down has no effect on dendritic length and complexity. Primary hippocampal neurons were transfected at DIV4 with shRNAs against REST (shREST) or shControl. (F) Efficacy of shREST vectors. Representative immunoblot showing the downregulation of endogenous REST induced by shRNAs against REST in transfected HEK cells. (G) REST overexpression reduces dendritic length and complexity in primary neurons. Primary hippocampal neurons were transfected at DIV4 with REST or empty vector (control). (H) Primary hippocampal neurons were transfected via ex vivo electroporation. (E, G, H) Scale bar 50 μm. RFP was cotransfected for visualization. Values represent mean + SEM, Student's t test (dendritic length) or two-way ANOVA and Bonferroni post-test (Sholl analysis), *p < 0.05, **p < 0.01. (E and G) n ≥ 20 neurons per condition. (H) n ≥ 30 neurons per condition.
Figure 5—figure supplement 1
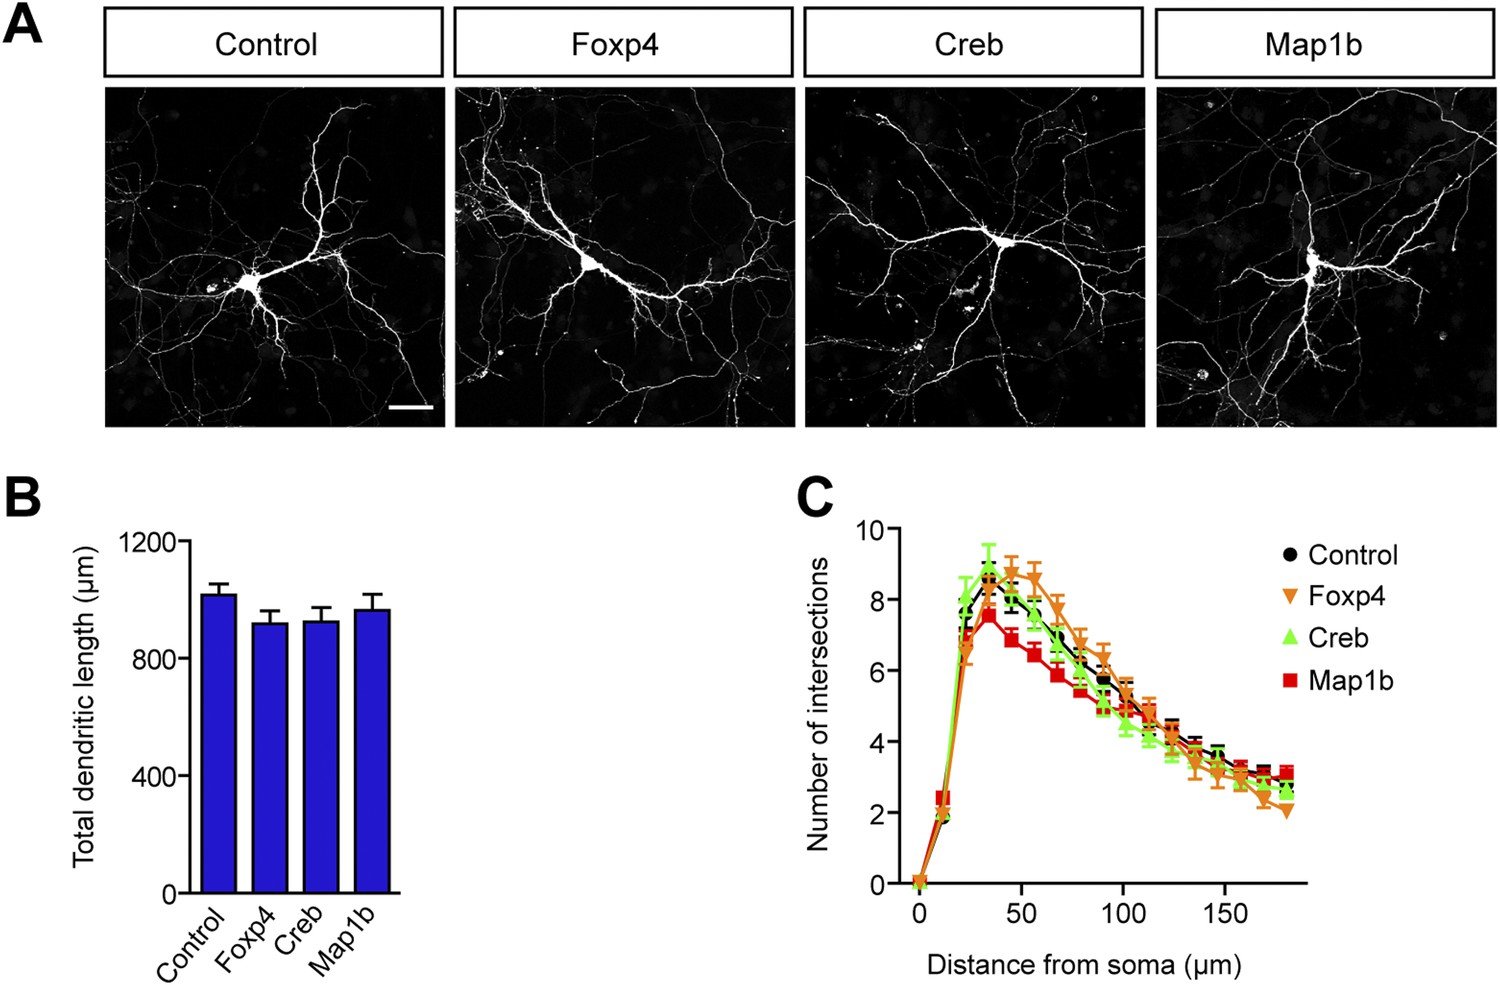
Increased levels of Foxp4, Creb, or Map1b have no impact on dendritic length and complexity.
(A) Representative images of primary hippocampal neurons transiently transfected with the indicated constructs and fixed at DIV10. mRFP was cotransfected for visualization. Scale bar 50 μm. (B) Quantification of the total dendritic length (mean + SEM, one-way ANOVA, n.s) and (C) quantification of dendritic complexity by Sholl analysis (mean + SEM, repeated measures two-way ANOVA, n.s). n ≥ 30 neurons per condition.
Author response image 1
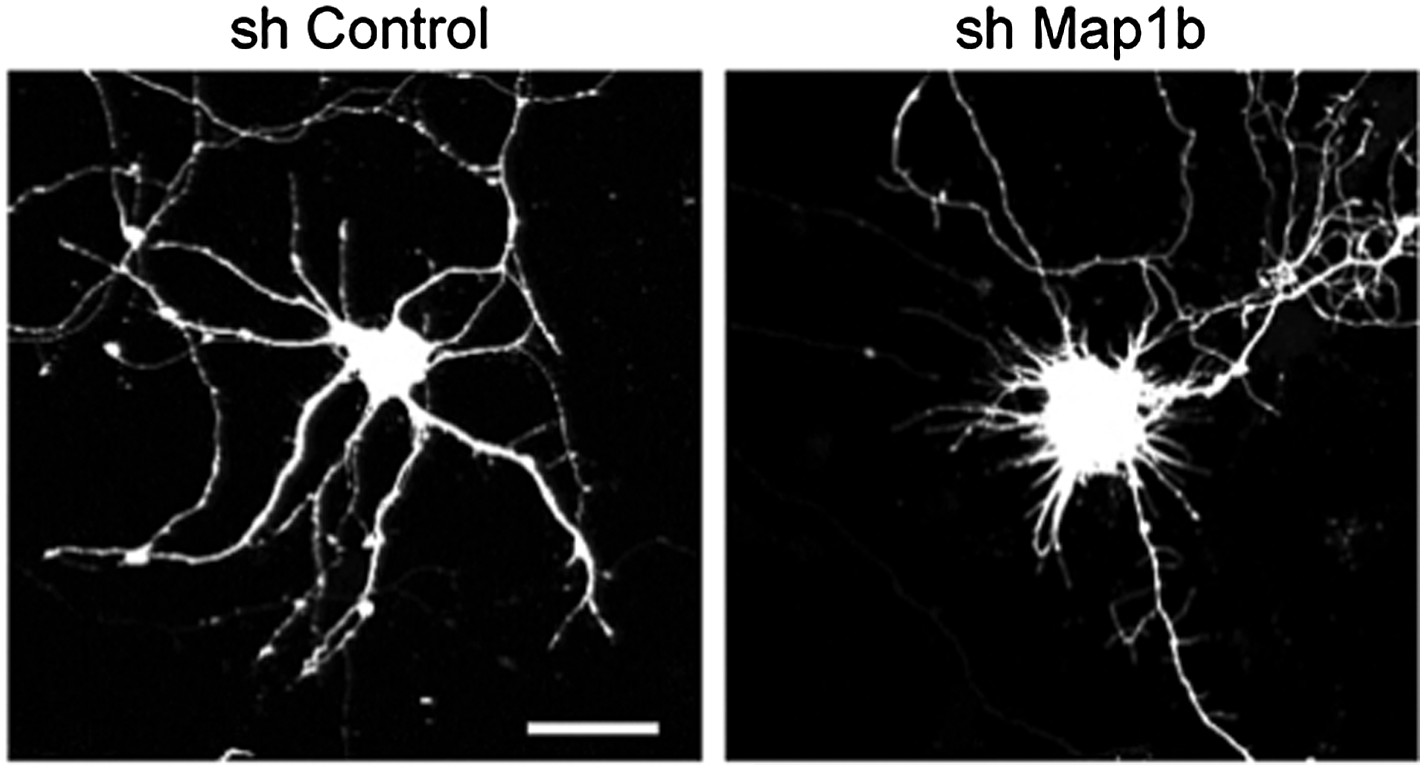
Representative images of primary hippocampal neurons transiently transfected with the indicated constructs and fixed at DIV10. mRFP was cotransfected for visualization. Scale bar 25 μm.
Additional files
-
Supplementary file 1
Predicted miR-9 targets screened in miR-9-SpNestin-Cre mice.
- https://doi.org/10.7554/eLife.02755.017
-
Supplementary file 2
List of primers used in qPCR experiments.
- https://doi.org/10.7554/eLife.02755.018
Download links
A two-part list of links to download the article, or parts of the article, in various formats.
Downloads (link to download the article as PDF)
Open citations (links to open the citations from this article in various online reference manager services)
Cite this article (links to download the citations from this article in formats compatible with various reference manager tools)
MicroRNA-9 controls dendritic development by targeting REST
eLife 3:e02755.
https://doi.org/10.7554/eLife.02755


