Auxin efflux by PIN-FORMED proteins is activated by two different protein kinases, D6 PROTEIN KINASE and PINOID
- Technische Universität München, Germany
- Universität Regensburg, Germany
- Université Evry, France
- University of Vienna, Austria
- Max-Planck-Institute of Molecular Plant Physiology, Germany
- Universität Hohenheim, Germany
Figures
Figure 1 with 2 supplements
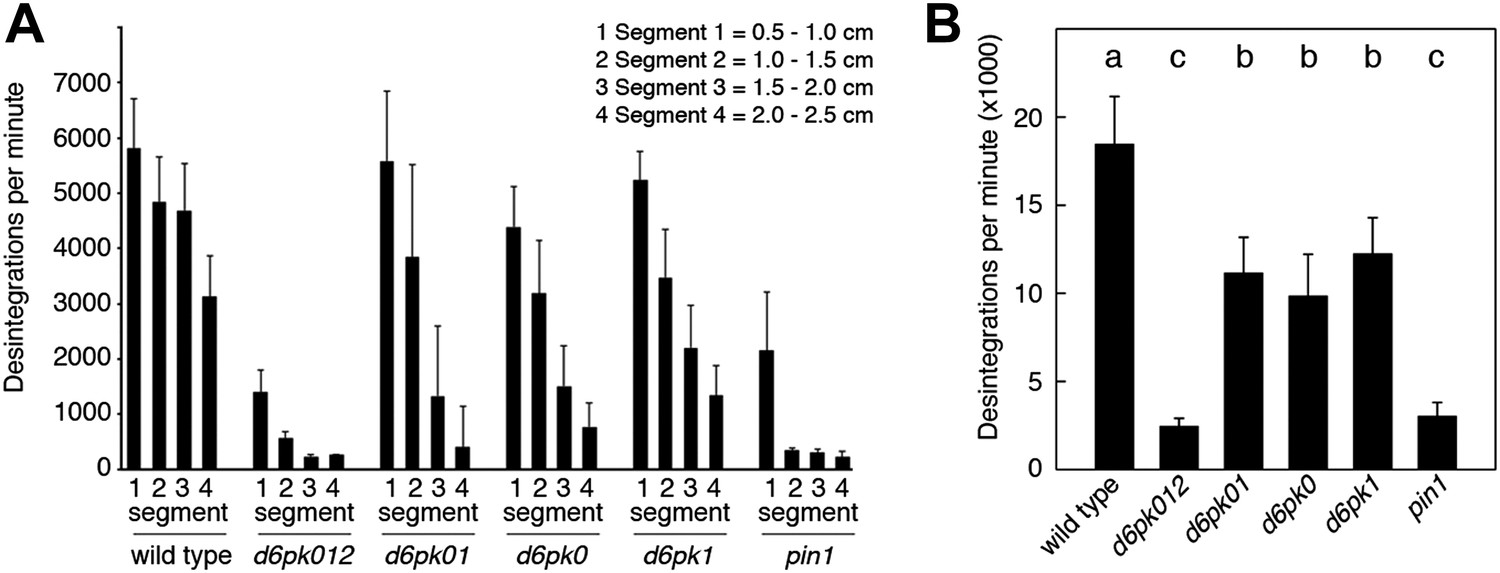
Basipetal auxin transport is impaired in d6pk and pin1 mutants.
(A) Basipetal auxin transport measured in inflorescence stems of 5-week-old Arabidopsis plants. Segment numbers refer to the 5 mm stem segments dissected from the primary inflorescence stem where segment 1 is the 5 mm segment closest to the radiolabeled auxin. The 5 mm segment directly in contact with the radiolabeled auxin is not included. Mutant nomenclature: d6pk0, d6pk-1; d6pk1, d6pkl1-1; d6pk01, d6pk-1 d6pkl1; d6pk012, d6pk-1 d6pkl1 d6pkl2-2. A linear mixed-effects model analysis (fixed factor) revealed statistically significant differences (p<0.01) in the transport rates between the wild type and all mutant genotypes, between the d6pk single mutants and the higher order d6pk mutants as well as between the d6pk01 double mutant and the d6pk012 triple mutant. d6pk012 and pin1 are not significantly different (p=0.43). (B) Amount of radiolabeled auxin found in all segments of the plants shown in (A). An ANOVA revealed highly significant differences between groups (p<0.001). An all-pairwise post hoc analysis (Holm-Sidak) allowed the assignment of three significance levels indicated by letters (p≤0.05 between levels).
Figure 1—figure supplement 1
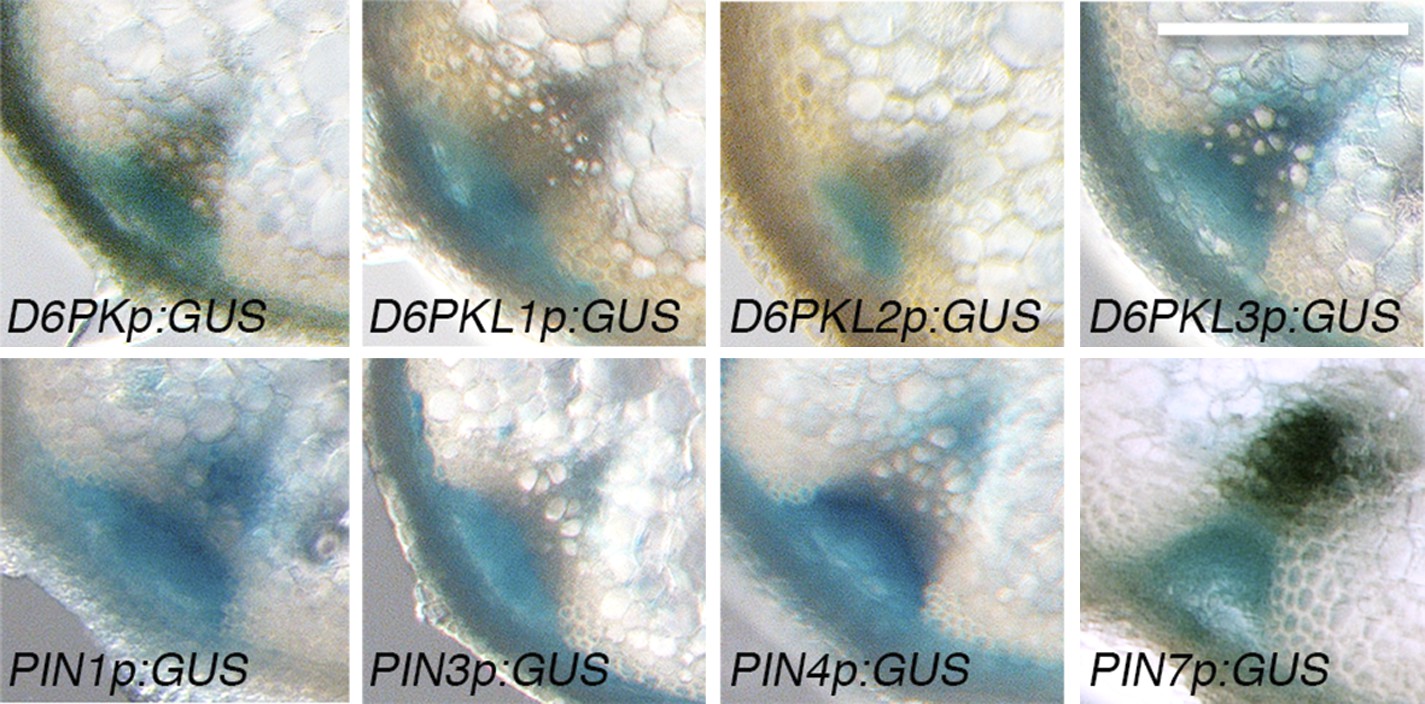
D6PKs and PINs are coexpressed in vascular bundles of inflorescence stems.
Representative GUS-reporter stainings of promoter GUS-fusions of the four D6PK genes and PIN1, PIN3, PIN4 and PIN7 from inflorescence stem sections of 5-week-old plants. Scale bar = 100 µm.
Figure 1—figure supplement 2
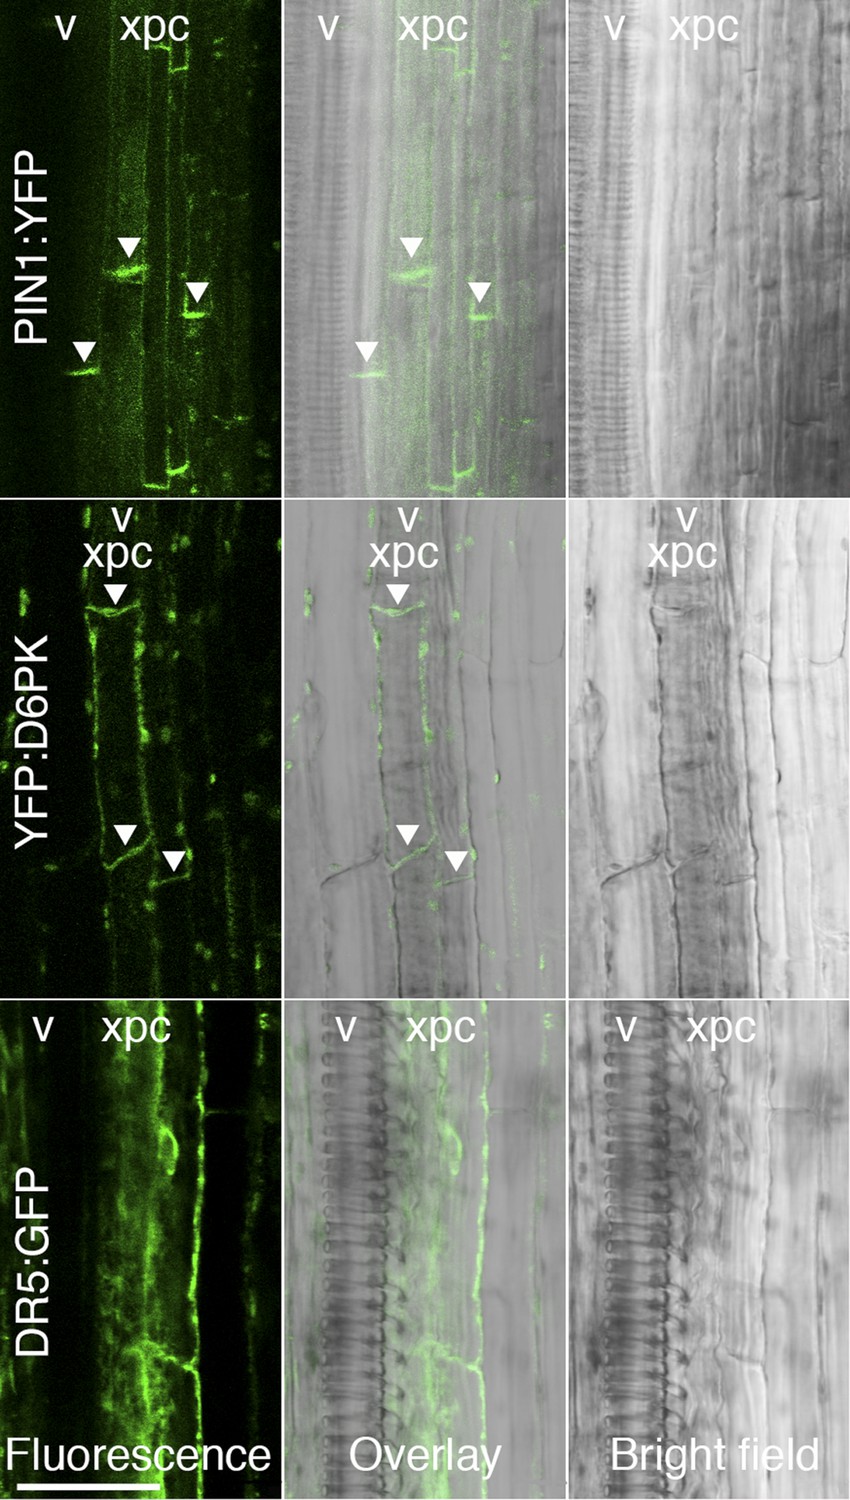
D6PK and PIN1 localize to the basal plasma membrane in xylem parenchyma cells.
Representative confocal images of sectioned inflorescence stems expressing PIN1p:PIN1:YFP (PIN1:YFP), D6PKp:YFP:D6PK (YFP:D6PK) and the auxin response reporter DR5:GFP. Shown are fluorescent images, bright field images, and the overlay of the two images. Arrowheads mark the accumulation of the translational fusions at the basal plasma membrane. Please note that the auxin response reporter is not expected to show polar distribution in these tissues. xpc, xylem parenchyma cell; v, xylem vessel. Scale bar = 30 µm.
Figure 2
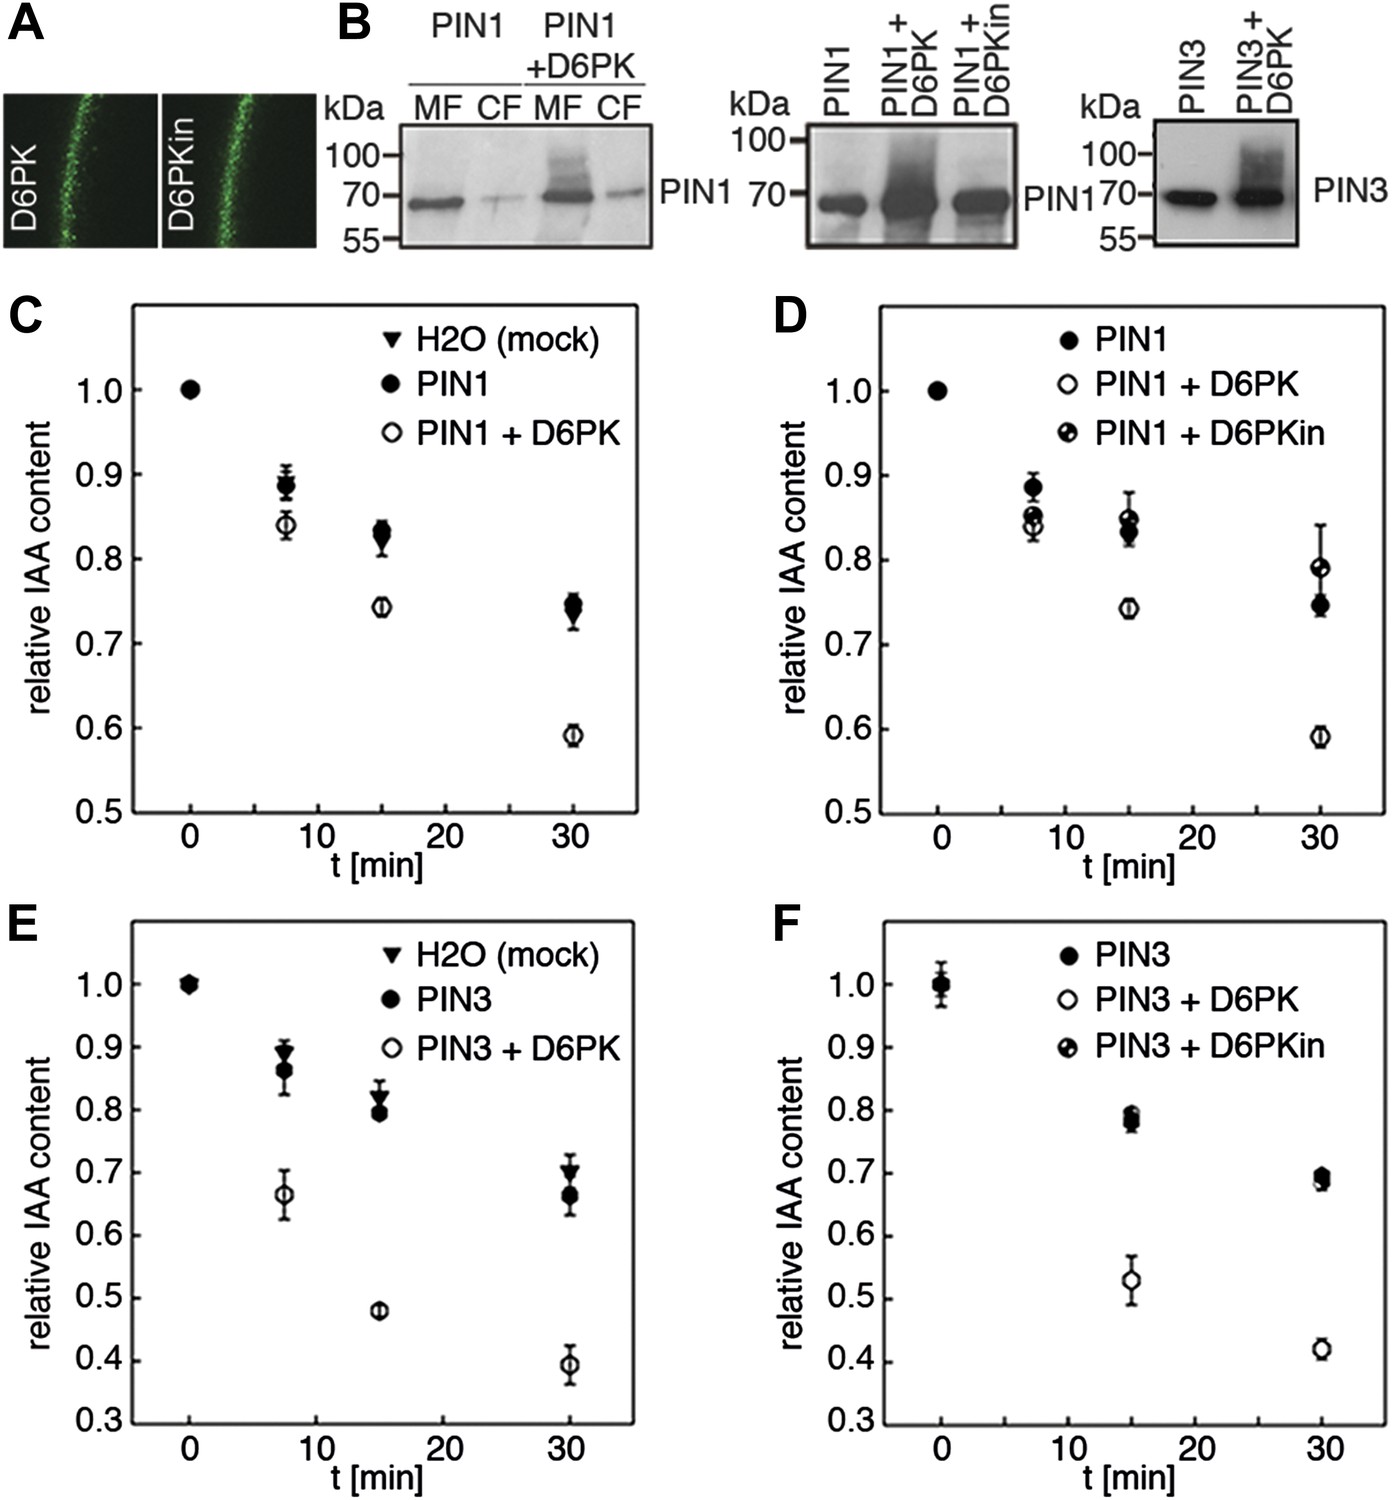
D6PK activates PIN-mediated auxin efflux in Xenopus oocytes.
(A) Representative confocal microscopy images of oocytes expressing YFP:D6PK (D6PK) and YFP:D6PKin (D6PKin) reveals localization of the proteins at the plasma membrane. (B) Anti-PIN immunoblots of protein extracts from microsomal membrane (MF) fractions (and where applicable cytoplasmic fractions [CF]) from oocytes expressing PIN1, PIN3, YFP:D6PK (D6PK) and kinase-dead YFP:D6PK (D6PKin). (C)–(F). Results of representative auxin efflux assays conducted in Xenopus oocytes expressing PIN1, PIN3, YFP:D6PK (D6PK) and kinase-dead YFP:D6PKin as specified. Each data point represents the mean and standard error of at least 10 oocytes.
Figure 3 with 1 supplement
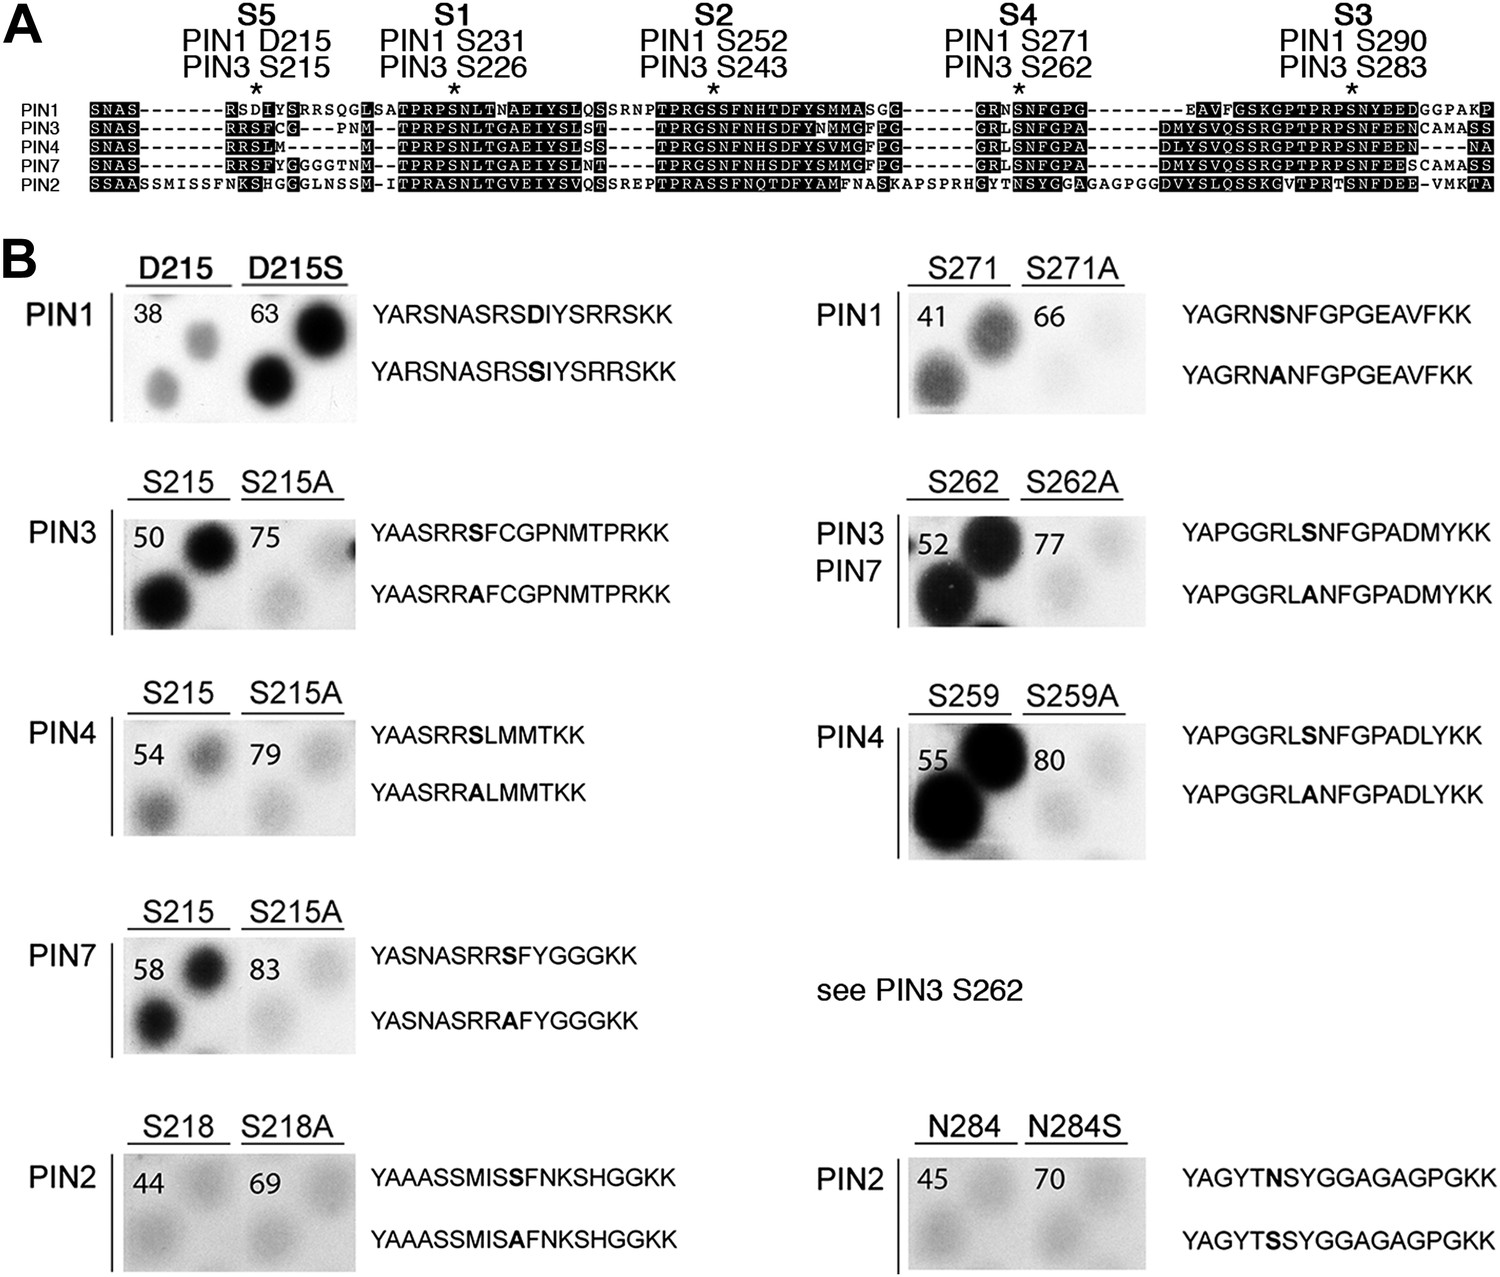
PIN S4 and S5 are phosphorylated by D6PK.
(A) Sequence alignment of PIN cytoplasmic loop fragments indicating the PIN phosphosites identified after in vitro phosphorylation with D6PK. (B) Results of in vitro phosphorylation experiments with synthetic wild type and mutant peptides confirm the D6PK-dependent phosphorylation of sites corresponding to S4 (right panels) and S5 (left panels) in the PINs where the respective sites are conserved. PIN3 and PIN7 are sequence identical at the S4 phosphosite. Each reaction was spotted in duplicate. Amino acid sequences of the respective wild type and mutant peptides are shown on the right of each panel, their peptide identification numbers are shown in the upper left corner (Supplementary file 1B). The amino acid exchange in the respective peptide pair is shown in bold typeface. The N- and C-terminal amino acids Y–A and K–K were added to allow for peptide quantification after synthesis and to facilitate attachment of the peptide to the negatively charged P81 paper.
-
Figure 3—source data 1
Mass spectrometric analyses of PIN cytoplasmic loop phosphorylation by D6PK. List of peptides including the phosphorylation state (PO3H2) of the respectively modified amino acid after phosphorylation of the recombinant PIN1–PIN4 cytoplasmic loops (CL) by D6PK. For each peptide identified from the PIN CLs, mass, charge state, and SEQUEST scores (cross-correlation values, X-corr, and Delta Correlation values, DeltaCN) are listed. For reasons of clarity, posttranslational modifications other than phosphorylation that were considered for peptide identification and mass calculation are not shown.
- https://doi.org/10.7554/eLife.02860.008
Figure 3—figure supplement 1

Summary of the mass spectrometric analyses of PIN cytoplasmic loop phosphorylation by D6PK.
PIN cytoplasmic loop sequences used for the in vitro phosphorylation analyses. Peptides identified by mass spectrometry as listed in Figure 3—source data 1 are presented in color. Different colors are used to distinguish neighboring peptides. Phosphorylated residues as identified in this analysis are marked in bold. The conserved S1–S5 phosphosites are marked in bold and underlined. Please note that phosphosites other than S1–S5 as detected in PIN1 and PIN3 are not conserved among the different PINs and were therefore not considered in our analyses.
Figure 4

In vitro phosphorylation of PIN1 and PIN3.
(A)–(D) Representative experiments with recombinant purified GST:D6PK (D6PK) or GST:PID (PID) and wild type or mutant PIN1 (A and B) or PIN3 (C and D) CL fragments in the presence of radiolabeled [©-32P]ATP. AR, autoradiography; CBB, Coomassie Brilliant Blue-stained gel, loading control. Percentage values represent the amount of radiolabel incorporated into the PIN1 (A) and (B) and PIN3 (C) and (D) mutant proteins relative to the respective wild type protein after normalization to the loading control. Asterisks mark non-specific background bands or degradation products.
Figure 5 with 1 supplement
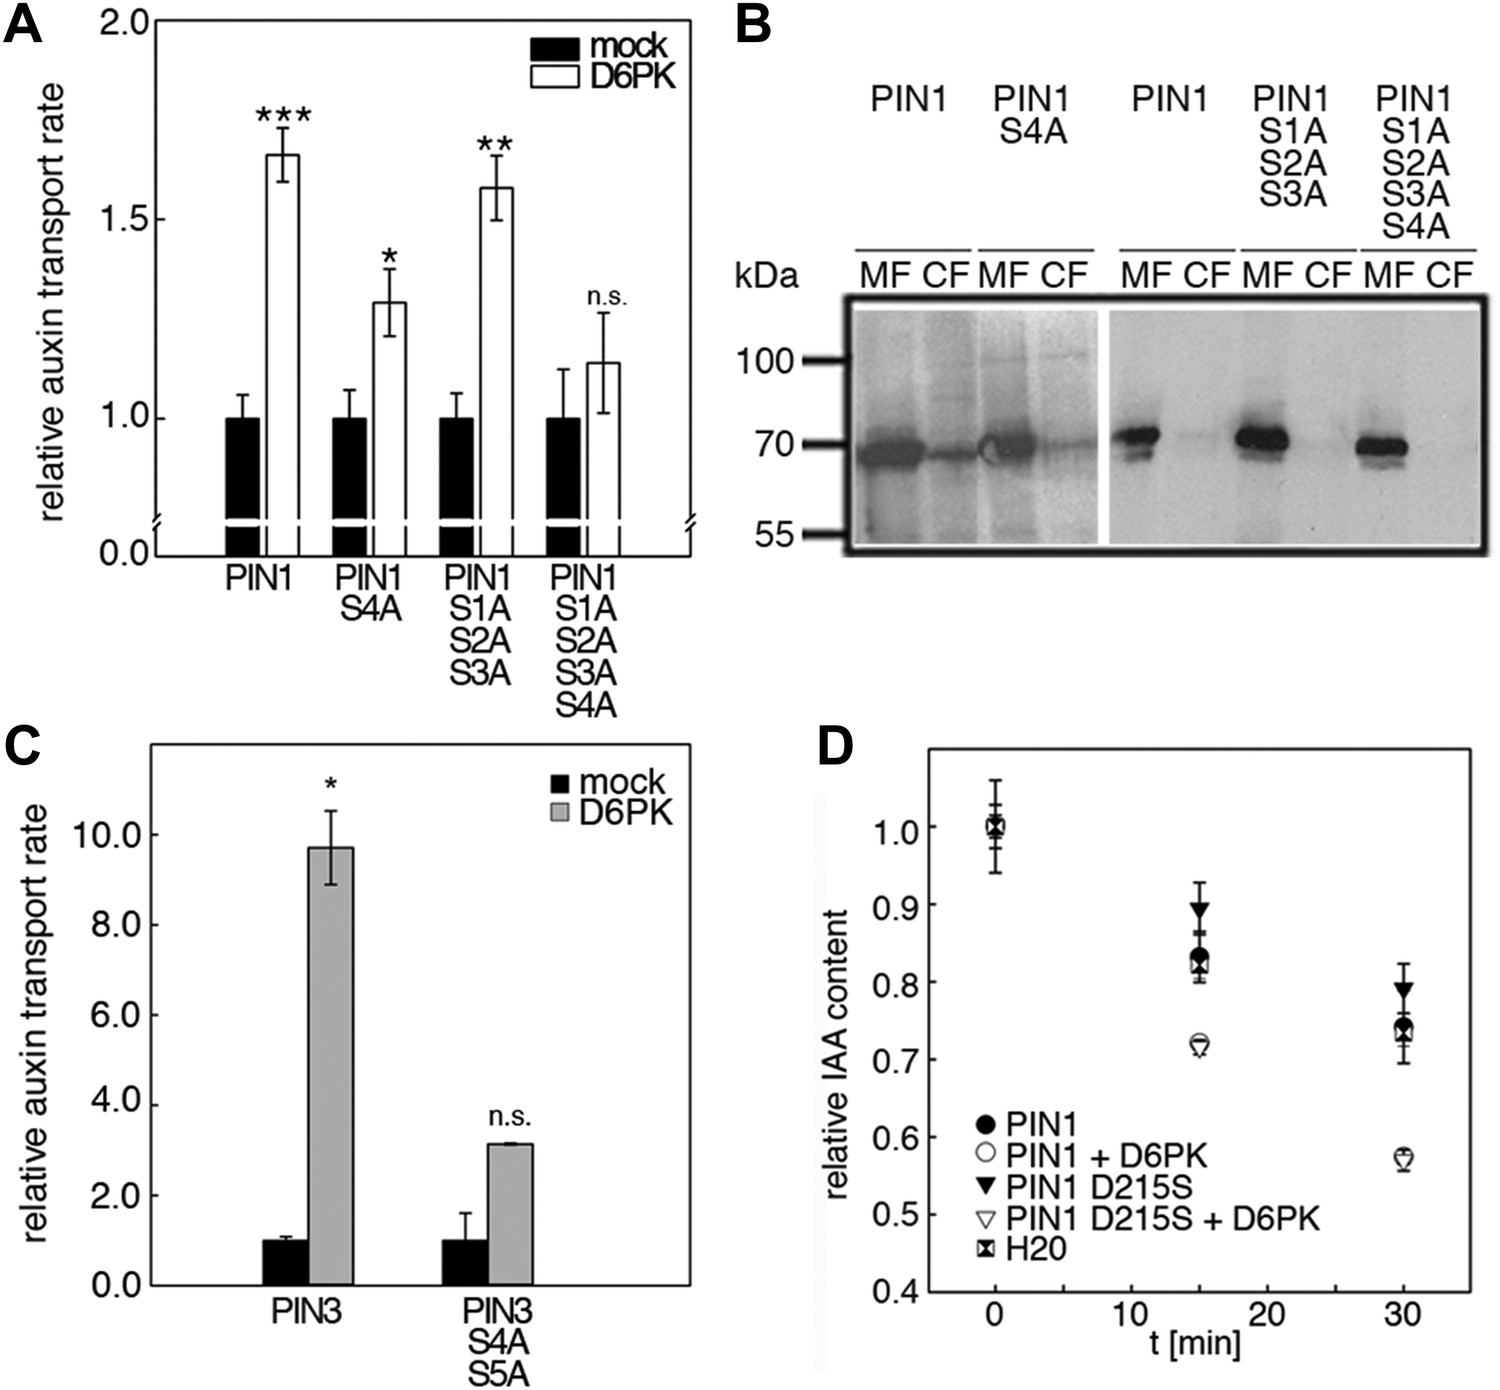
D6PK activates auxin transport through phosphorylation of specific serine residues.
(A) Results of quantitative analyses from oocyte auxin efflux assays with D6PK and wild type or mutant PIN1. The averages of at least three independent measurements are shown after normalization to the mock control. Student's t test: *p=0.022; **p=0.005; ***p<0.001; n.s., not significant. (B) Anti-PIN1 immunoblots of microsomal membrane (MF) and cytoplasmic fractions (CF) of the corresponding oocytes used in (A). (C) PIN3 S4 S5 are required for full activation by D6PK. Results of quantitative analyses from oocyte auxin transport assays with D6PK and wild type PIN3 or the PIN3 S4A S5A mutant. The averages of at least three independent biological replicates are shown after normalization to the mock control. Student's t test *, p=0.016; n.s., not significant. (D) PIN1 D215 does not contribute to the auxin transport activity of PIN1. Results of oocyte auxin efflux assays with wild type and mutant PIN1 together with YFP:D6PK (D6PK) as specified. Each data point represents the mean and standard error of measurements from at least 10 oocytes.
Figure 5—figure supplement 1
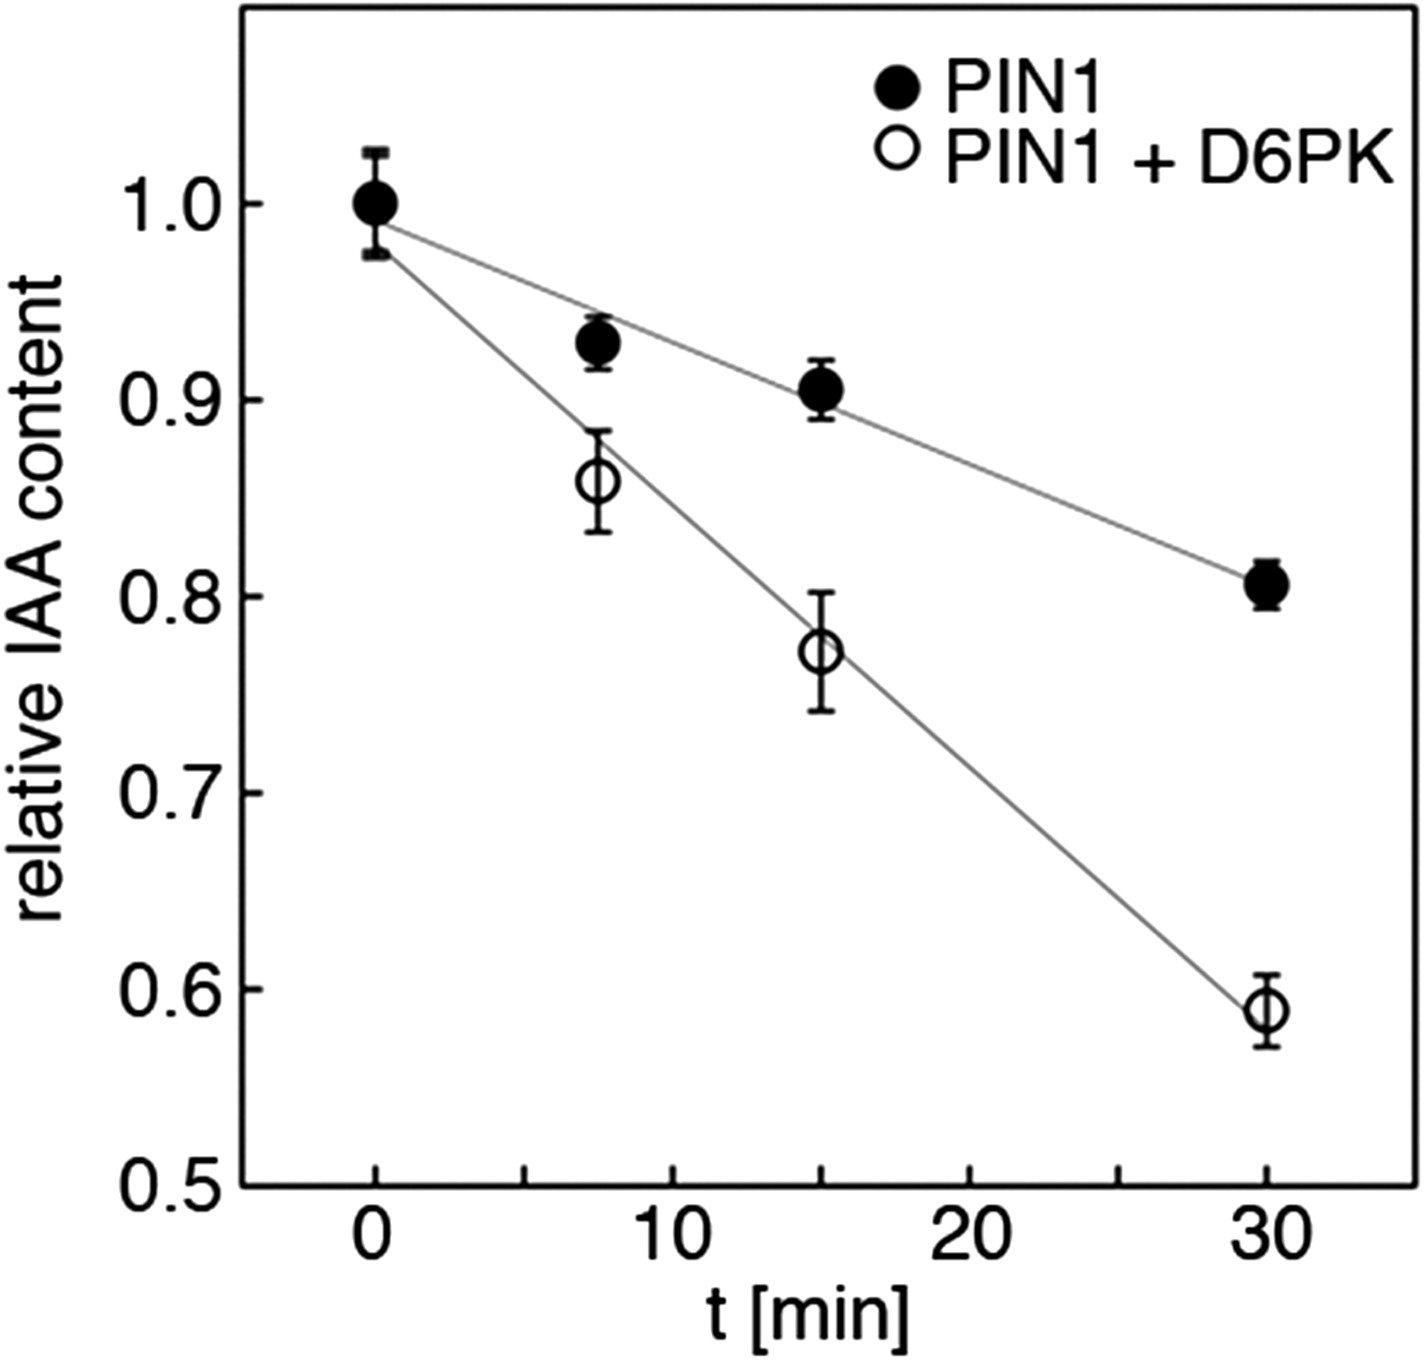
Quantification of auxin efflux in Xenopus oocytes.
Graph of a typical auxin transport experiment conducted in oocytes. Values represent the average of the measurements of at least 10 individual oocytes per time point. Linear regression was performed to calculate the relative efflux rate, that is the change in concentration over time. This rate (n = 1) corresponds to one biological replicate. The bar graphs in Figures 5A,C and 8A,C were calculated based on the efflux rates of at least three biological replicates.
Figure 6 with 1 supplement
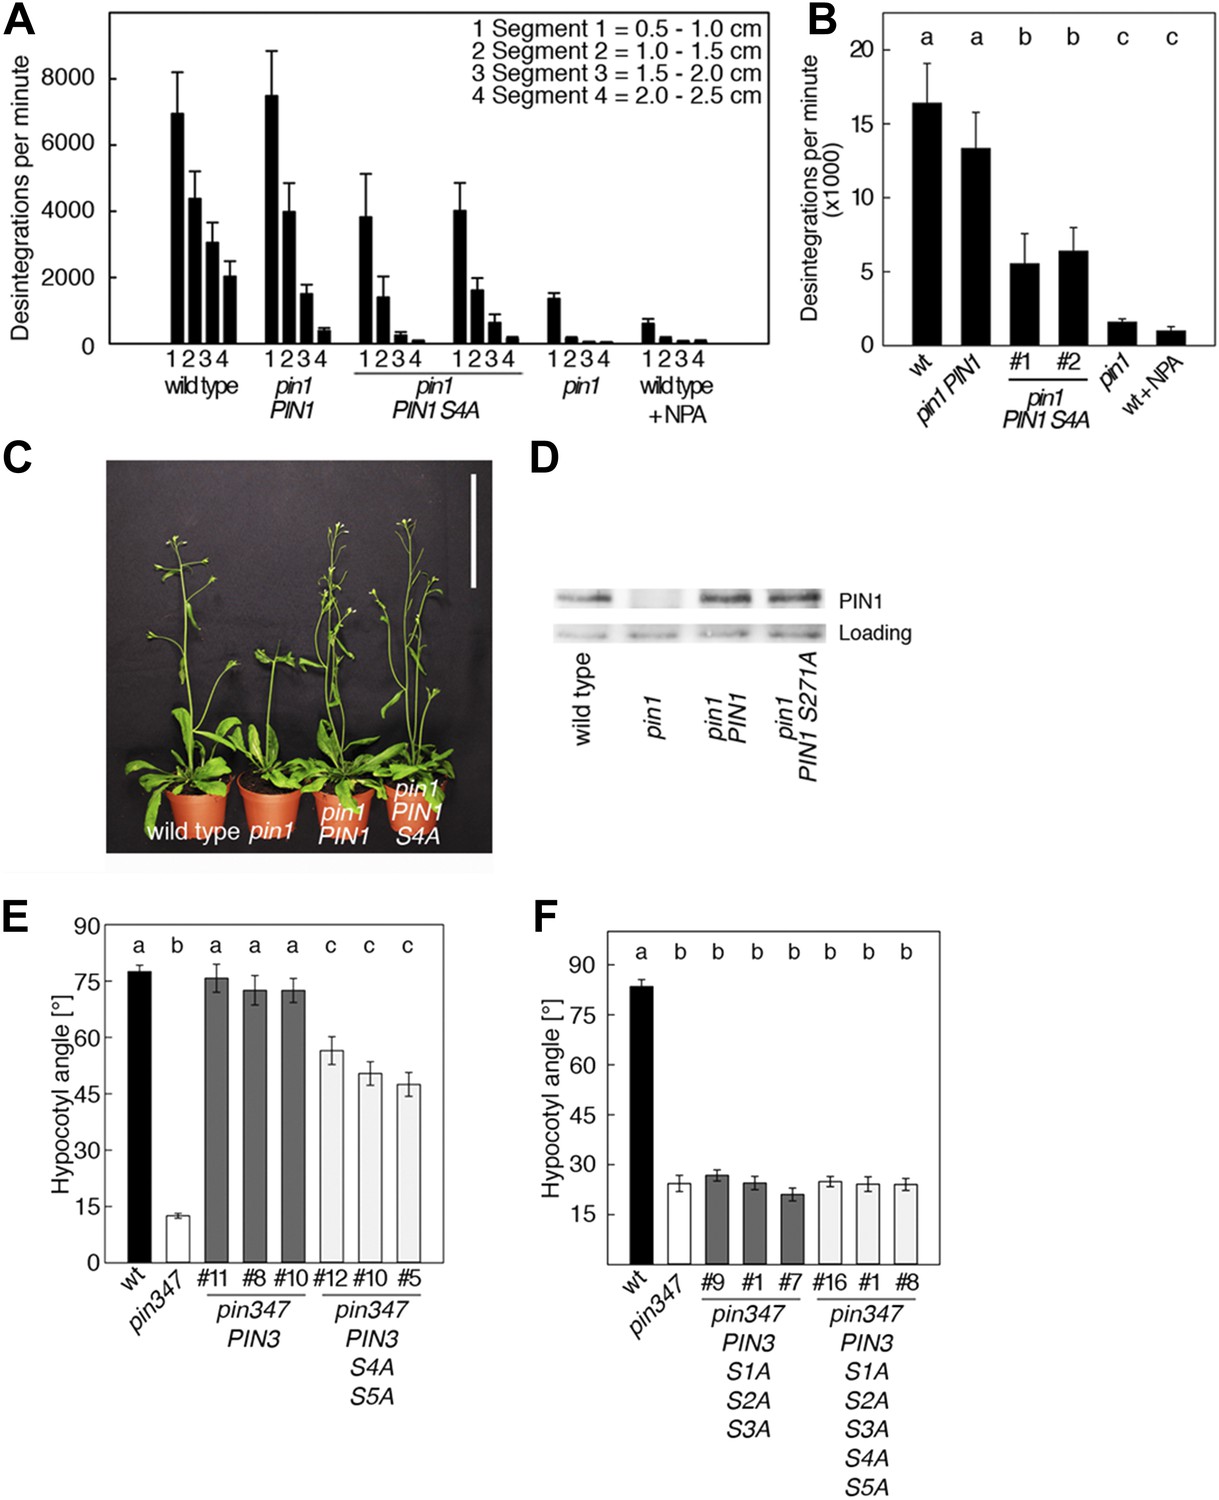
PIN1 S4 and PIN3 S4 S5 are required for full pin mutant complementation.
(A) Basipetal auxin transport measured in inflorescence stems of 5-week-old Arabidopsis plants. Segment numbers refer to the 5 mm stem segments dissected from the inflorescence stem where segment 1 is the 5 mm segment closest to the radiolabeled auxin. The 5 mm segment directly in contact with the radiolabeled auxin was discarded. The values represent the mean and standard error of six biological replicates, except pin1 and NPA-treated wild type (n = 2). A linear mixed-effects model analysis (fixed factor) revealed statistically significant differences (p<0.05) in the transport rates between the plant lines complemented with the PIN1 S4A construct and the other genotypes as indicated by the significance levels in (B). (B) Amount of radiolabeled auxin found in all segments of the plants shown in (A). An ANOVA revealed highly significant differences between groups (p<0.001). An all pairwise post hoc analysis (Holm-Sidak) allowed the assignment of three significance levels indicated by letters (p≤0.036 between levels). (C) Phenotypes of 5-week-old pin1 mutants complemented with a transgenic construct expressing wild type PIN1 and PIN1 S4A under control of a PIN1 promoter fragment. Scale bar = 10 cm. (D) PIN1 immunoblot detects comparable PIN1 protein levels between the wild type and PIN1 transgenic lines. (E) and (F) Analysis for the rescue of phototropic hypocotyl bending defects of a pin3 pin4 pin7 mutant carrying wild type and mutant transgenes for the expression of wild type and mutant PIN3 under control of a PIN3 promoter fragment. Seedlings were exposed for 6 hr (E) or 20 hr (F) to unilateral white light before quantification. To assess differences between genotypes a Kruskal–Wallis ANOVA on ranks was performed. The differences in the median values among the different genotypic groups was highly significant (p<0.001). Different letters in indicate different significance levels (p<0.01) calculated by an all-pairwise multiple comparison (Dunn's Method).
Figure 6—figure supplement 1
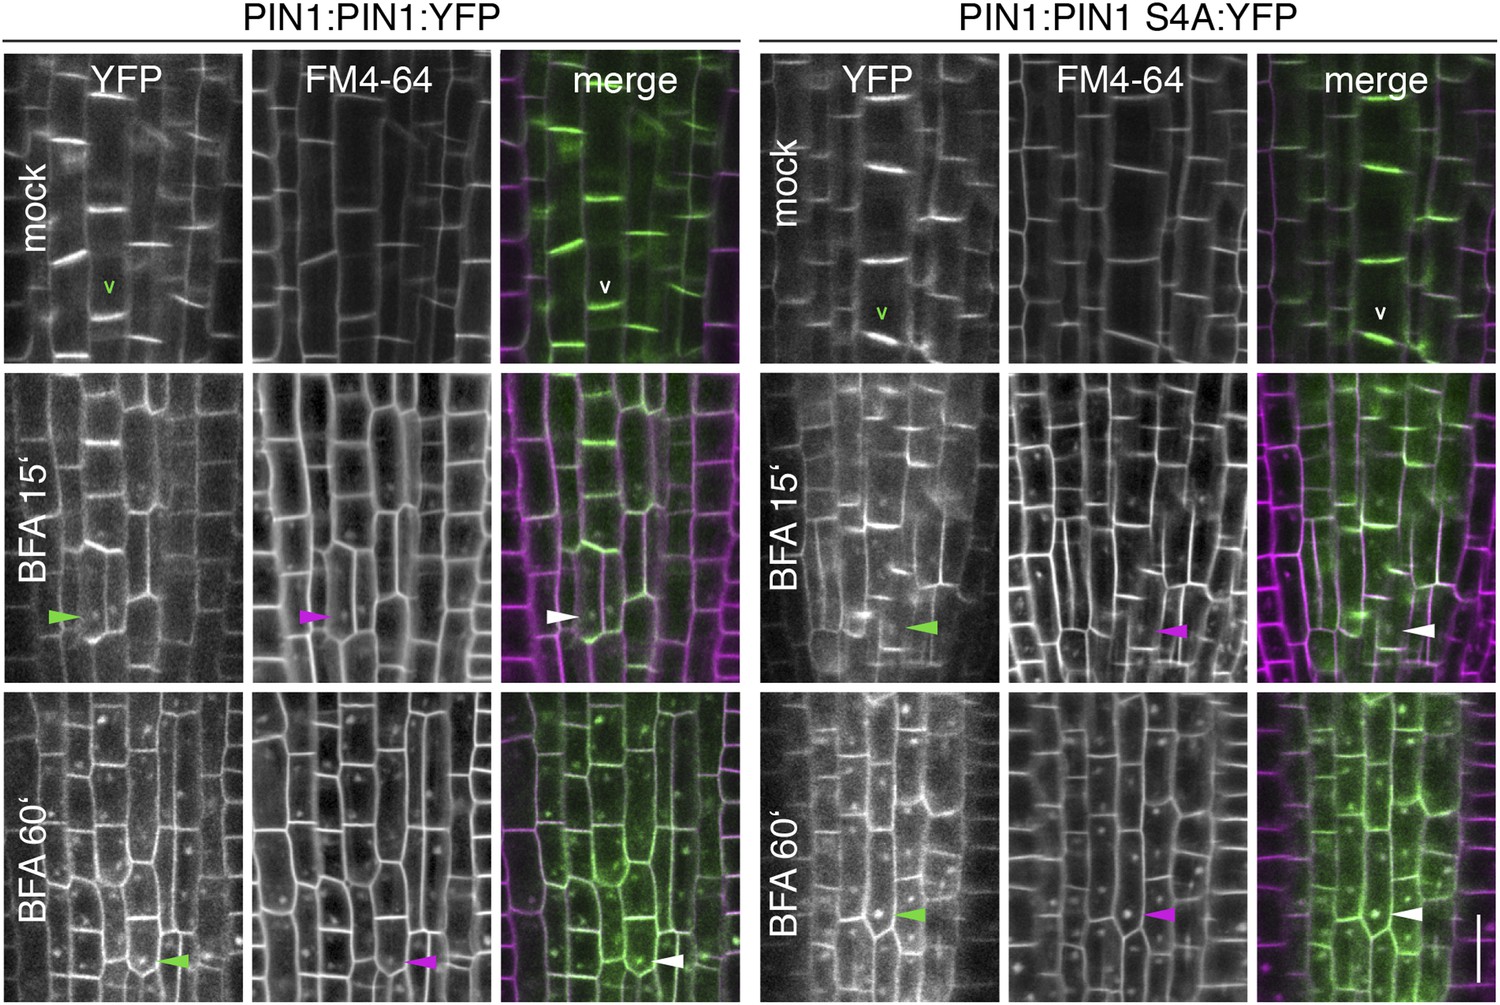
BFA-sensitivity of PIN1 and PIN1 S4A.
Confocal images of root cells from 6 day-old seedlings examining the localization of YFP-tagged PIN1 and PIN1 S4A in a time course experiment (15 min and 60 min) without (mock) and with a BFA [50 μM] treatment. FM4-64 [2 μM] was used as an endocytosis marker and included in all treatments. Shown are the fluorescent images from the YFP and the FM4-64 channels as well as the merged images. The open arrowheads mark the polarly localized PIN1 proteins, the filled arrowheads point at selected BFA-compartments that are detected with both fluorescent proteins after BFA-treatment. To ensure that stele cells are stained at the onset of the treatment, seedlings were stained with FM4-64 for 5 min before BFA-treatment. Scale bar = 10 μm.
Figure 7 with 3 supplements
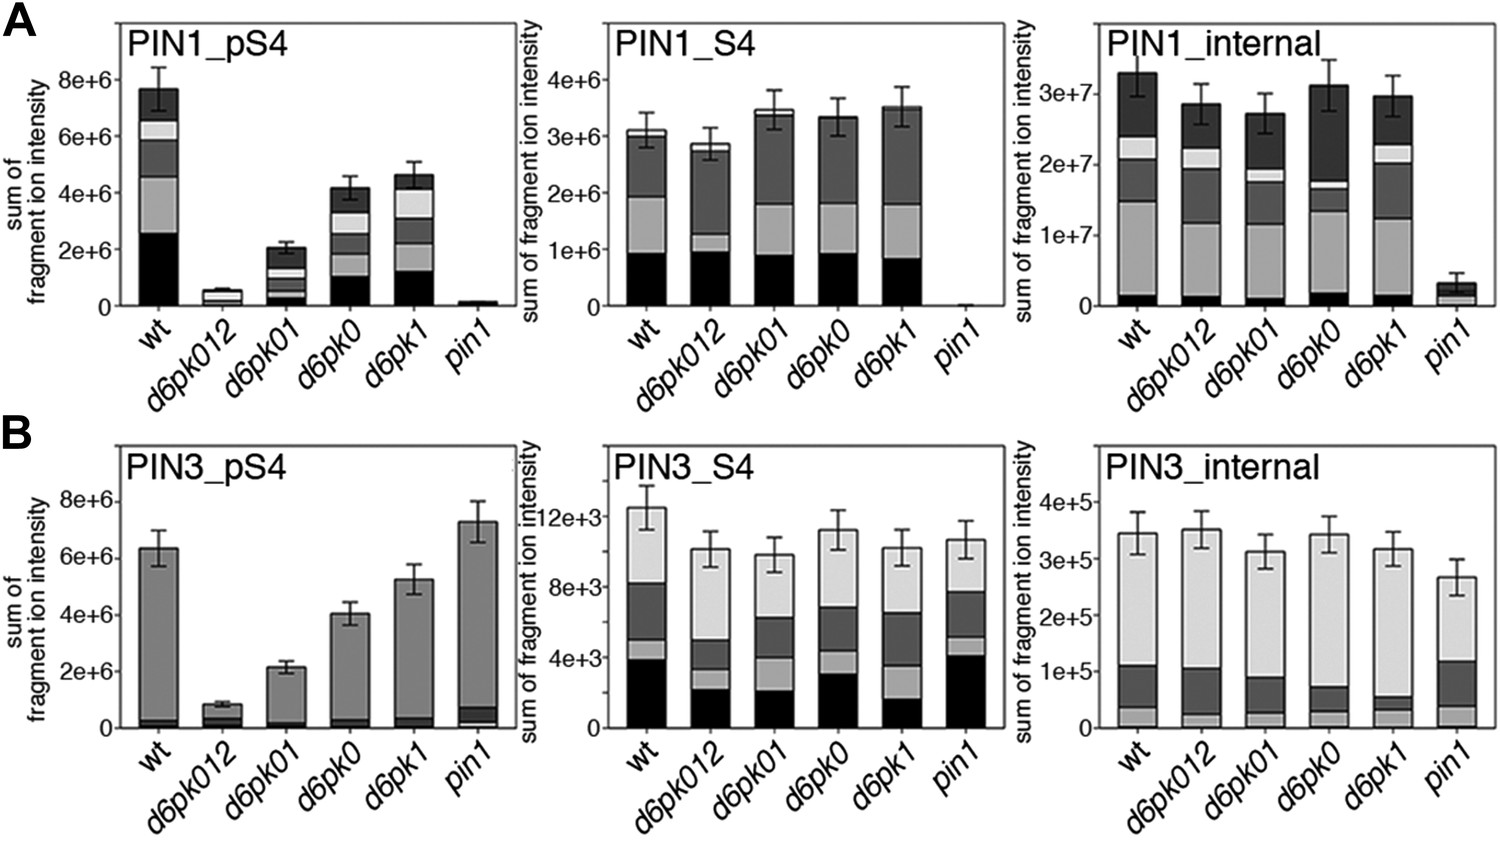
In vivo phosphorylation of PIN1 and PIN3.
(A) and (B) Results of SRM analysis for the quantification of PIN1 S4 and PIN3 S4 phosphorylation in inflorescence tissue of 5-week-old Arabidopsis wild type and d6pk mutant plants (PIN1_pS4, phosphorylated form of PIN1 S4; PIN1_S4, unphosphorylated form etc). Internal peptides allow for an estimation of the overall PIN protein levels, standard deviations were calculated based on average variation of standard peptide abundances across all samples, columns represent the sum of individual fragment ions that are shown in different gray scales.
Figure 7—figure supplement 1
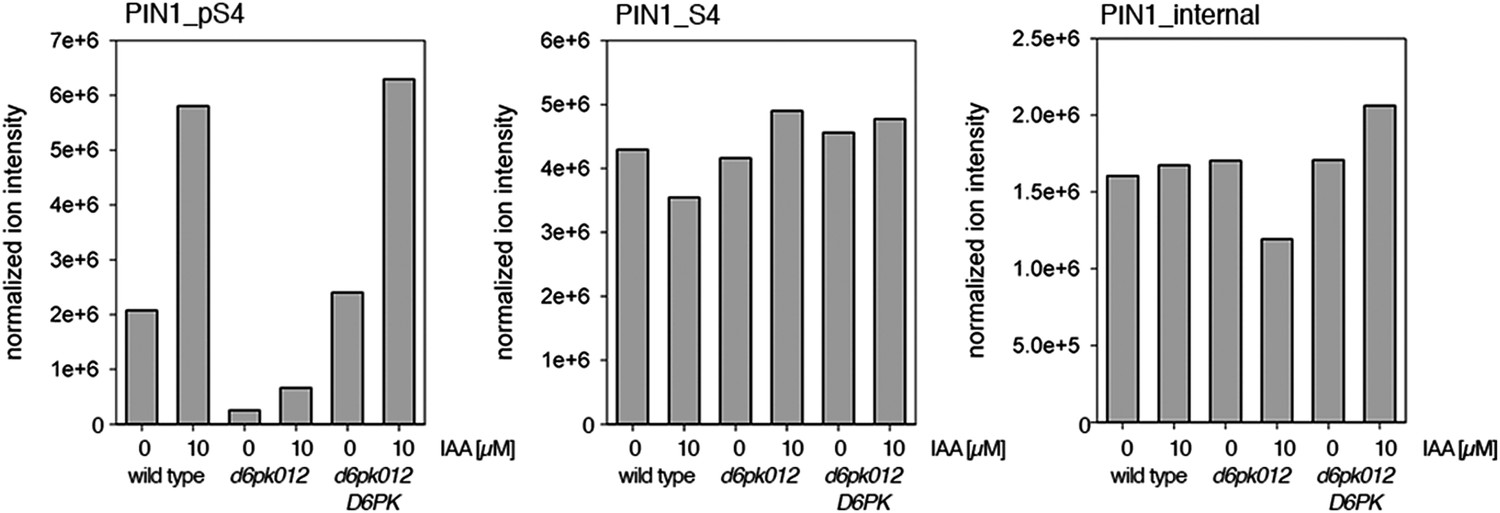
Auxin-dependent phosphorylation at PIN1 S4.
Quantification of PIN1 S4 phosphorylation in IAA-treated [10 µM; 1 hr] inflorescence stem tissue of 5-week-old Arabidopsis plants. PIN1_pS4, phosphorylated form; PIN1_S4, unphosphorylated form. Internal peptides allow for quantification of the overall protein levels.
Figure 7—figure supplement 2
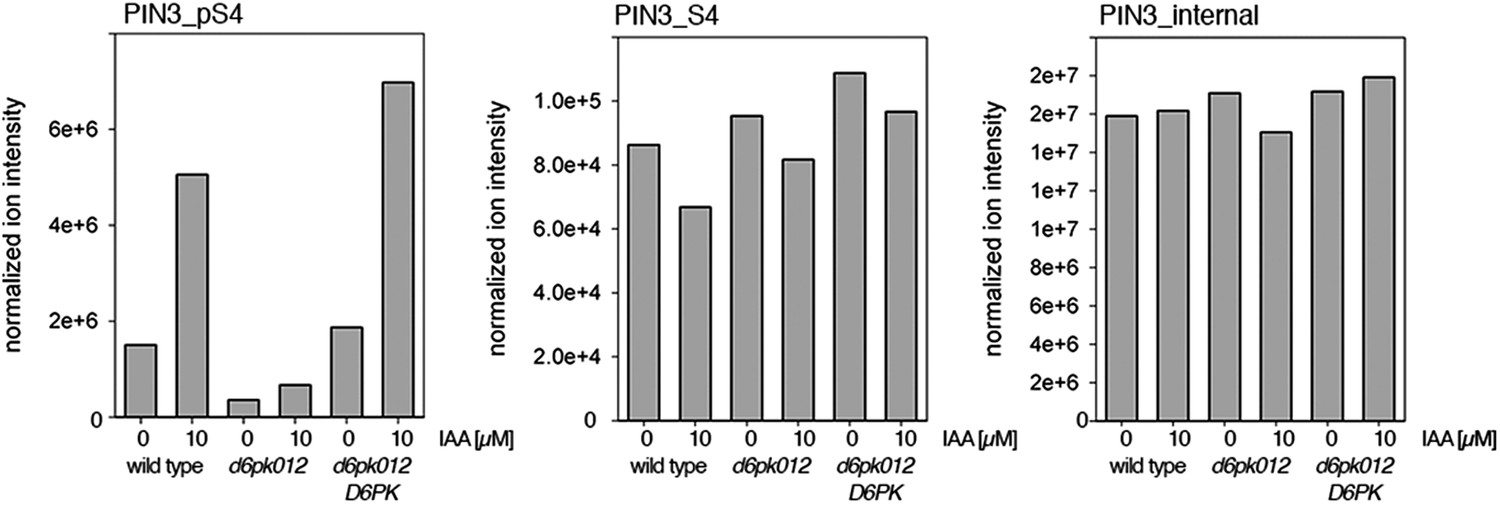
Auxin-dependent phosphorylation at PIN3 S4.
Quantification of PIN3 S4 phosphorylation in IAA-treated [10 µM; 1 hr] inflorescence stem tissue of 5-week-old Arabidopsis plants. PIN3_pS4, phosphorylated form; PIN1_S4, unphosphorylated form. Internal peptides allow for quantification of the overall protein levels.
Figure 7—figure supplement 3
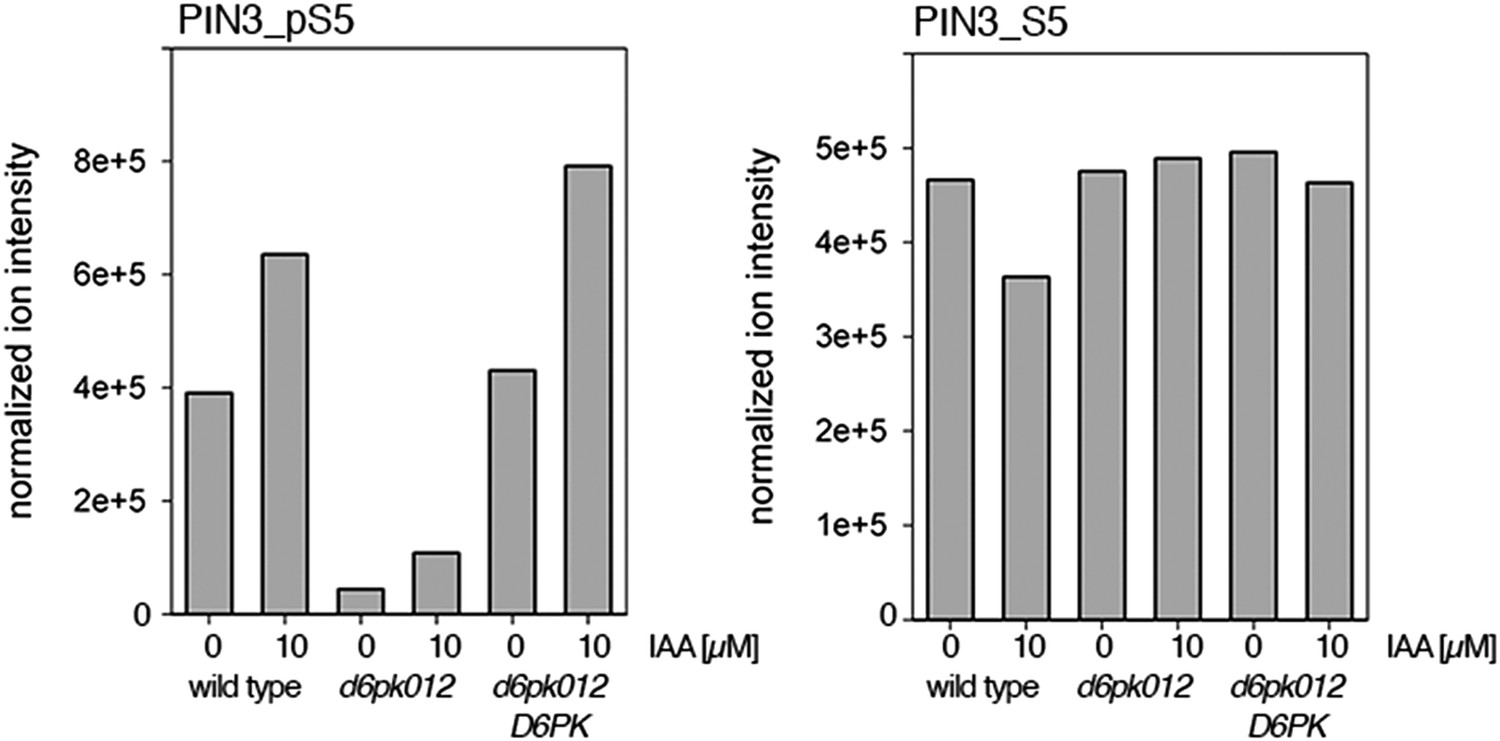
Auxin-dependent phosphorylation at PIN3 S5.
Quantification of PIN3 S5 phosphorylation in IAA-treated [10 µM; 1 hr] inflorescence stem tissue of 5-week-old Arabidopsis plants (PIN3_pS5, phosphorylated form; PIN3_S5, unphosphorylated. Internal peptides controls, shown in Figure 7—figure supplement 2 allow for quantification of the overall protein levels.
Figure 8 with 5 supplements
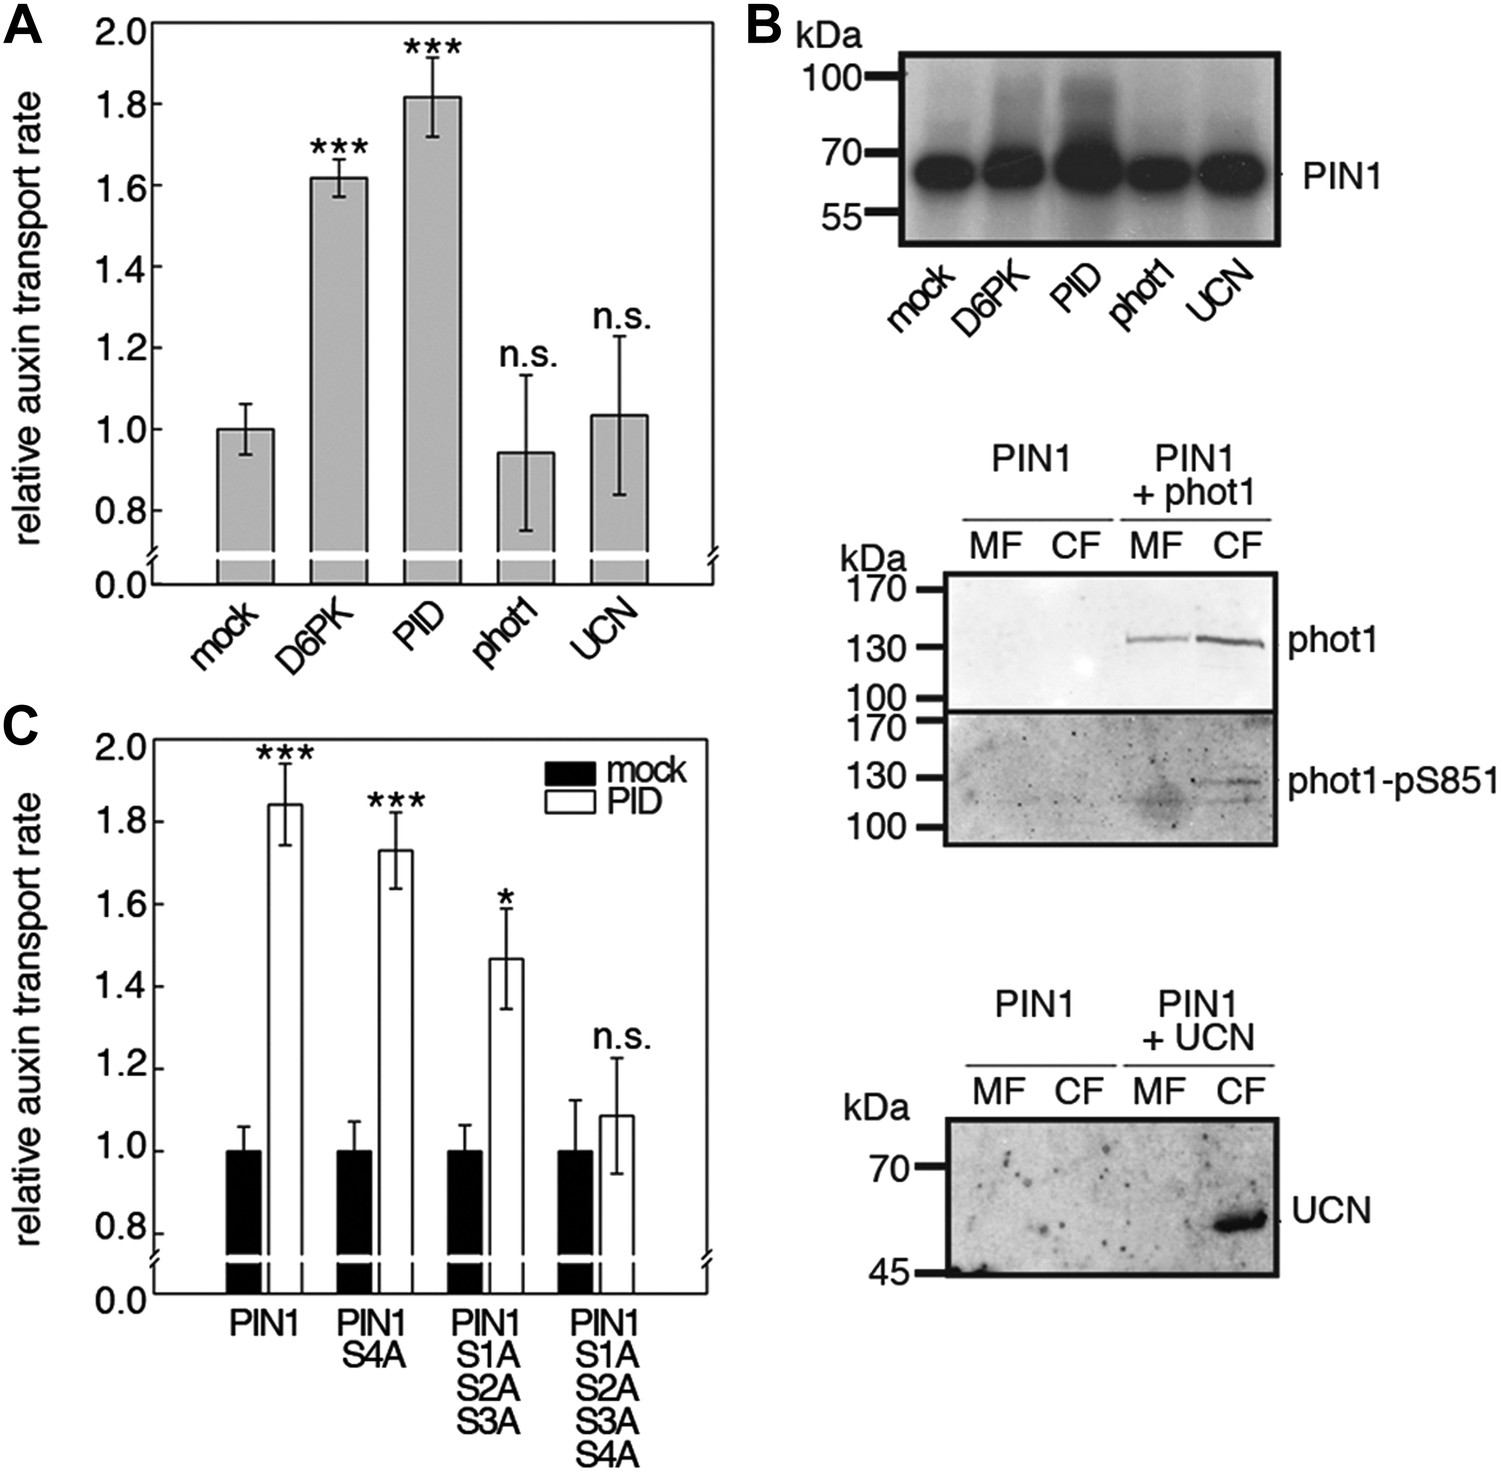
Capability of various AGCVIII kinases to active PIN1-mediated auxin efflux.
(A) and (C) Results of quantitative auxin efflux assays performed in the oocyte system with PIN1 and different AGCVIII kinases (A) or mutant PIN1 and PID (B). The averages of at least three independent measurements, calculated as described in Figure 5—figure supplement 1, are shown after normalization to the mock control. In (A), a one-way ANOVA revealed high differences between groups (p<0.001) and a post hoc analysis (Holm-Sidak) indicated that the D6PK and PID values were significantly different from control oocytes (***p<0.001). In (C), a Student's t-test was performed: *p<0.027; ***p<0.001; n.s., not significant. (B) Immunoblots of total protein extracts prepared from oocytes expressing PIN1 and different AGC kinases. The presence and activation (phot1 only) of the non-effective kinases in the membrane (MF) and cytoplasmic fraction (CF) was confirmed with anti-phot1, anti-phot1-pS851 (for phot1 activation) and anti-UCN.
Figure 8—figure supplement 1
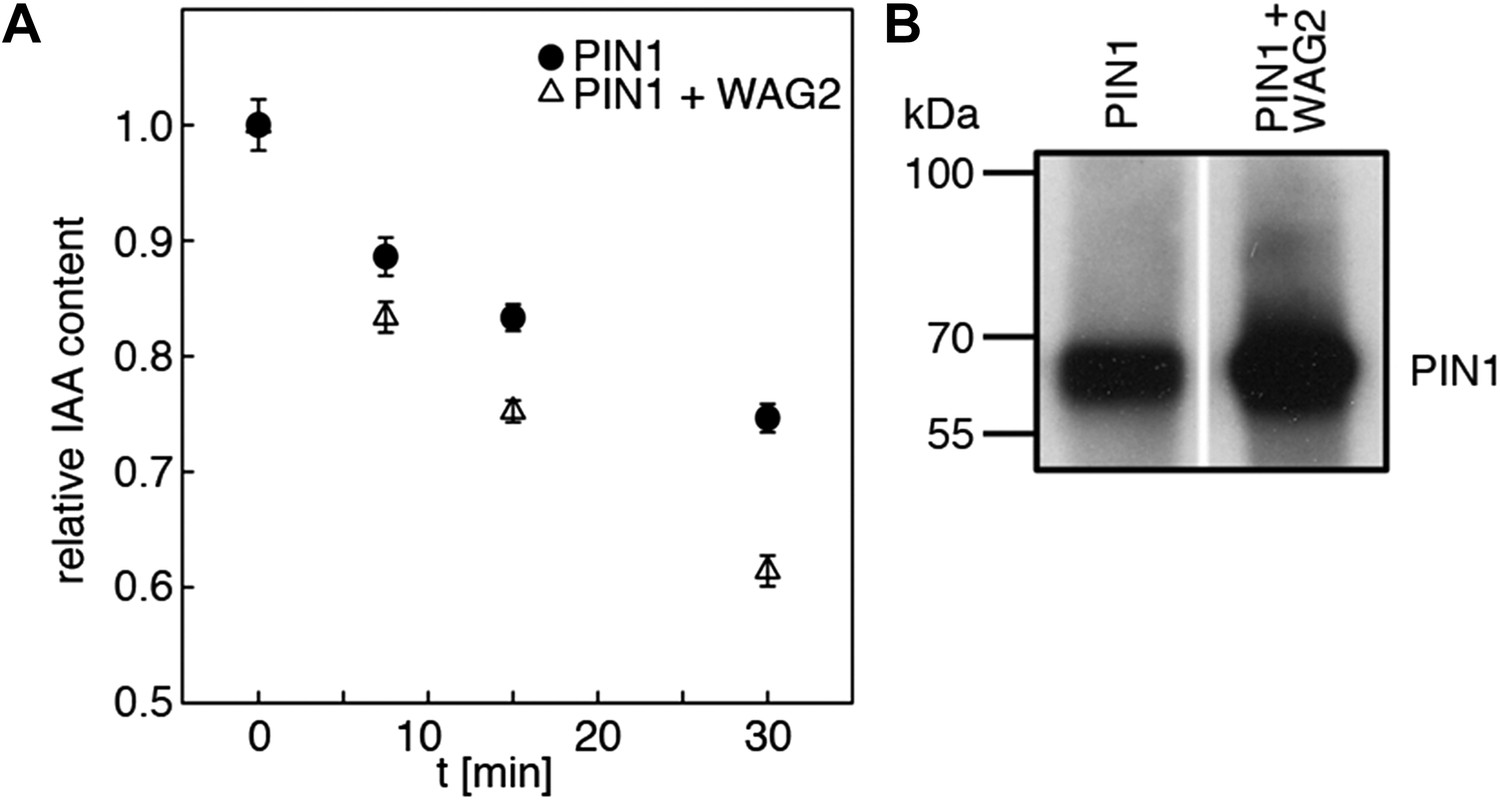
WAG2 activates PIN1-mediated auxin transport.
(A) Results of representative auxin efflux assays conducted in Xenopus oocytes expressing wild type PIN1 alone or together with WAG2 as specified. Each data point represents the mean and standard error of at least 10 oocytes. (B) Immunoblots of total protein extracts prepared from oocytes expressing PIN1 without and with WAG2.
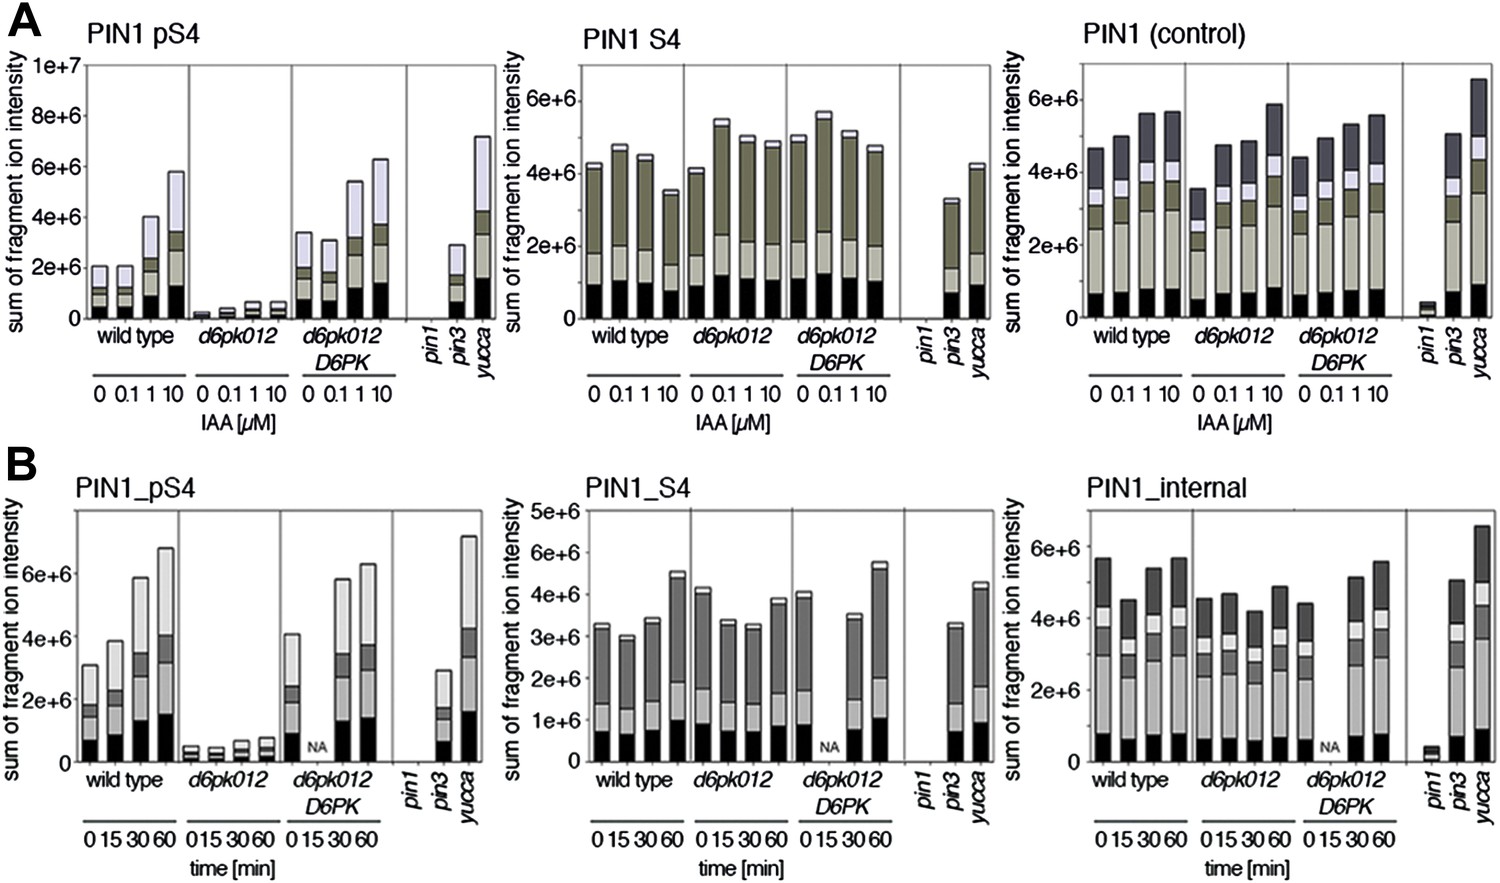
Figure 8—figure supplement 2
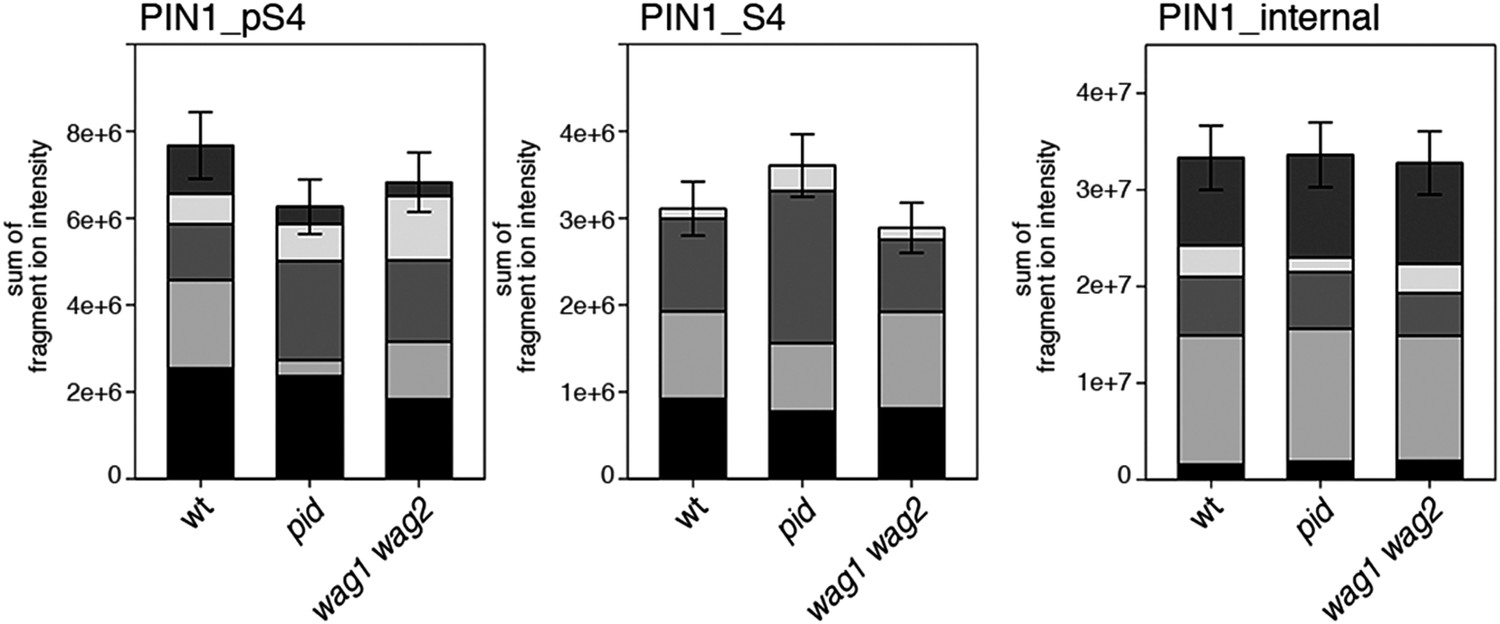
S4 phosphorylation in PIN1 is not strongly reduced in pid and wag1 wag2 mutants.
Results of SRM analysis for the quantification of PIN1 S4 phosphorylation in inflorescence tissue of 5-week-old Arabidopsis wild type and mutant plants. PIN1_pS4, phosphorylated form of PIN1 S4; PIN1_S4, unphosphorylated form. Internal peptides allow for quantification of the overall PIN1 protein levels, standard deviations were calculated based on the average variation of standard peptide abundances, columns represent the sum of individual fragment ions shown in different gray scales.
Figure 8—figure supplement 3
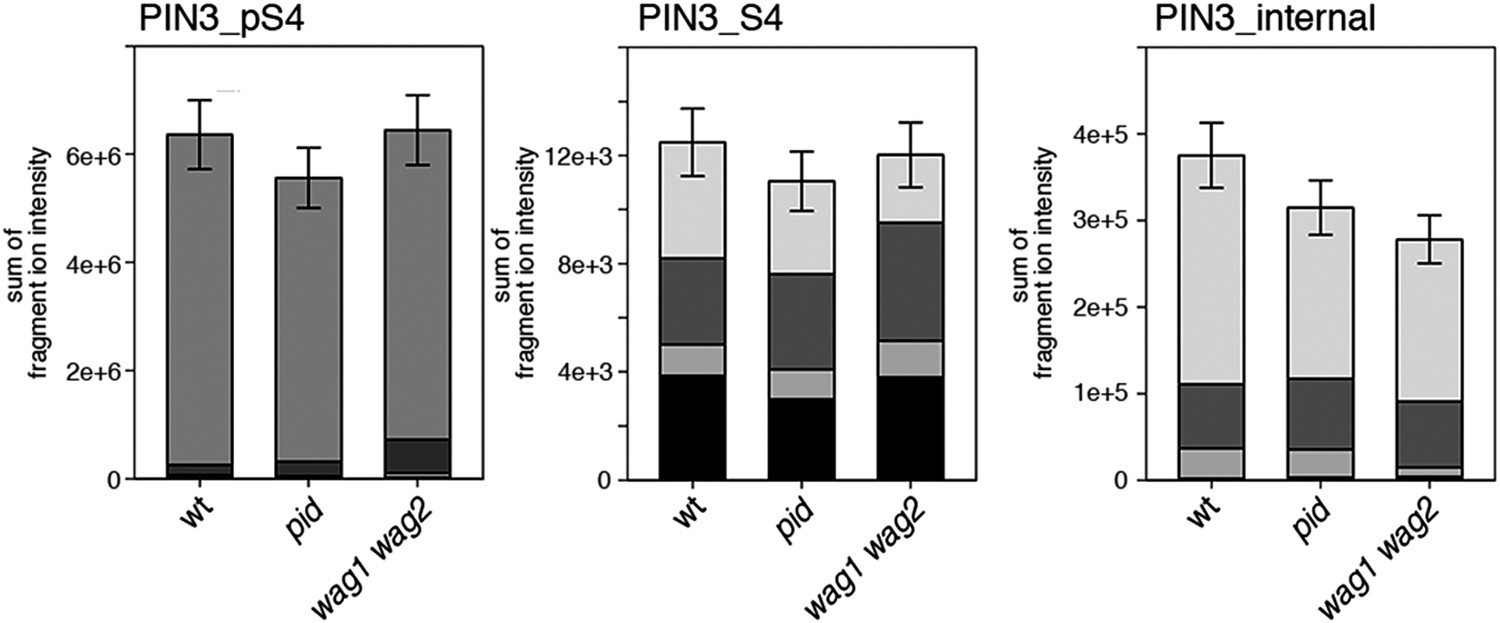
S4 phosphorylation in PIN3 is also not strongly reduced in pid and wag1 wag2 mutants.
Results of SRM analysis for the quantification of PIN3 S4 phosphorylation in inflorescence tissue of 5-week-old Arabidopsis wild type and mutant plants. PIN3_pS4, phosphorylated form of PIN3 S4; PIN3_S4, unphosphorylated form. Internal peptides allow for quantification of the overall PIN3 protein levels, standard deviations were calculated based on the average variation of standard peptide abundances, columns represent the sum of individual fragment ions shown in different gray scales.
Figure 8—figure supplement 4

Auxin-dependent phosphorylation at PIN1 S1.
Quantification of PIN1 S1 phosphorylation in IAA-treated [10 µM; 1 hr] inflorescence stem tissue of 5-week-old Arabidopsis plants. PIN1_pS1, phosphorylated form; PIN1_S1, unphosphorylated form. Internal peptides controls, shown in Figure 7—figure supplement 2 allow for quantification of the overall protein levels.
Figure 8—figure supplement 5
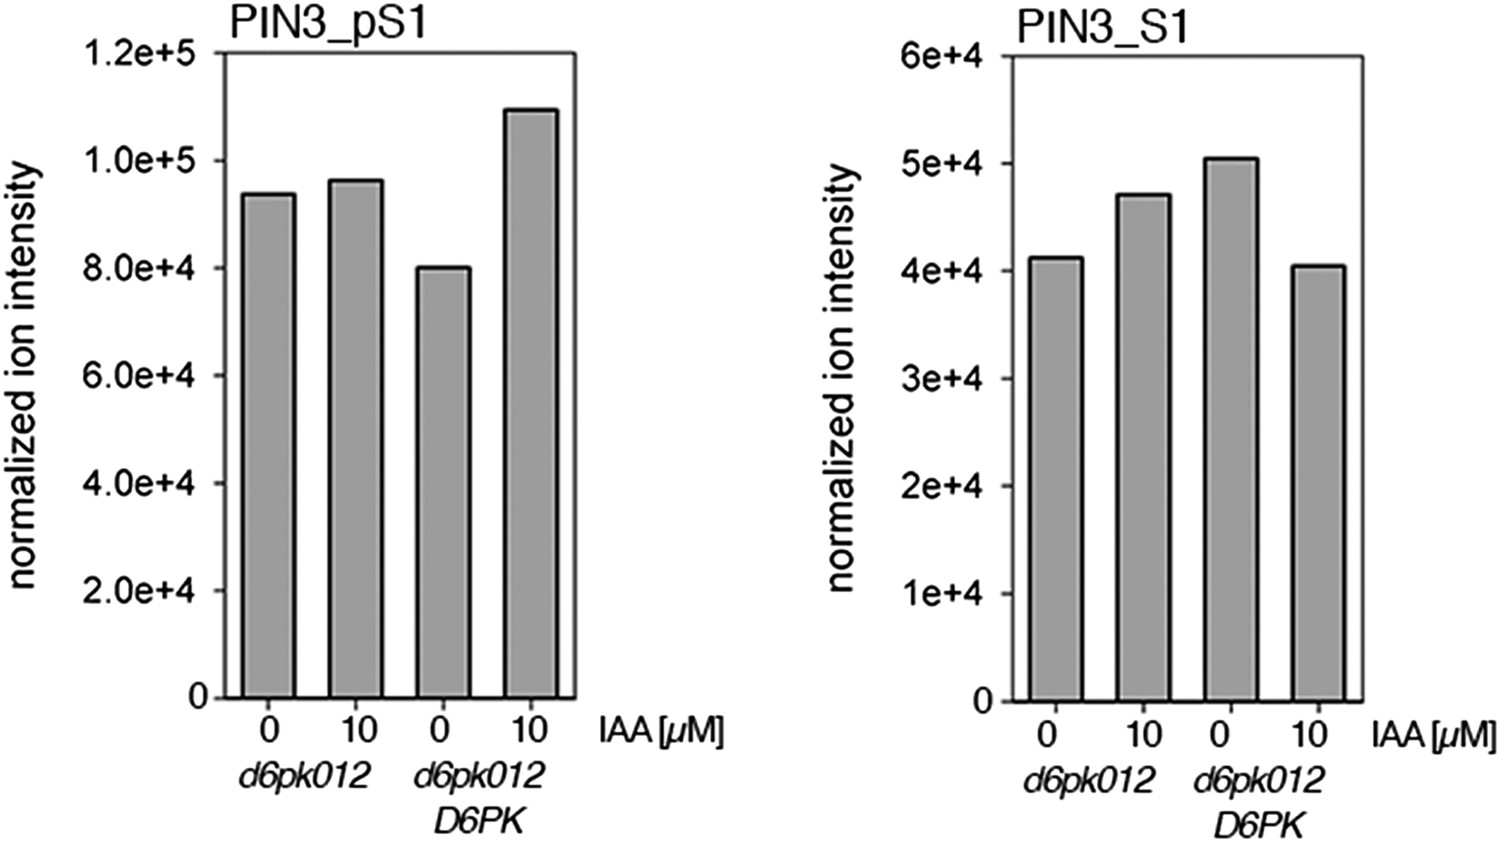
Auxin-dependent phosphorylation at PIN3 S1.
Quantification of PIN3 S1 phosphorylation in IAA-treated [10 µM; 1 hr] inflorescence stem tissue of 5-week-old Arabidopsis plants. PIN3_pS1, phosphorylated form; PIN3_S1, unphosphorylated form. Internal peptides controls, shown in Figure 7—figure supplement 2 allow for quantification of the overall protein levels.
Figure 9
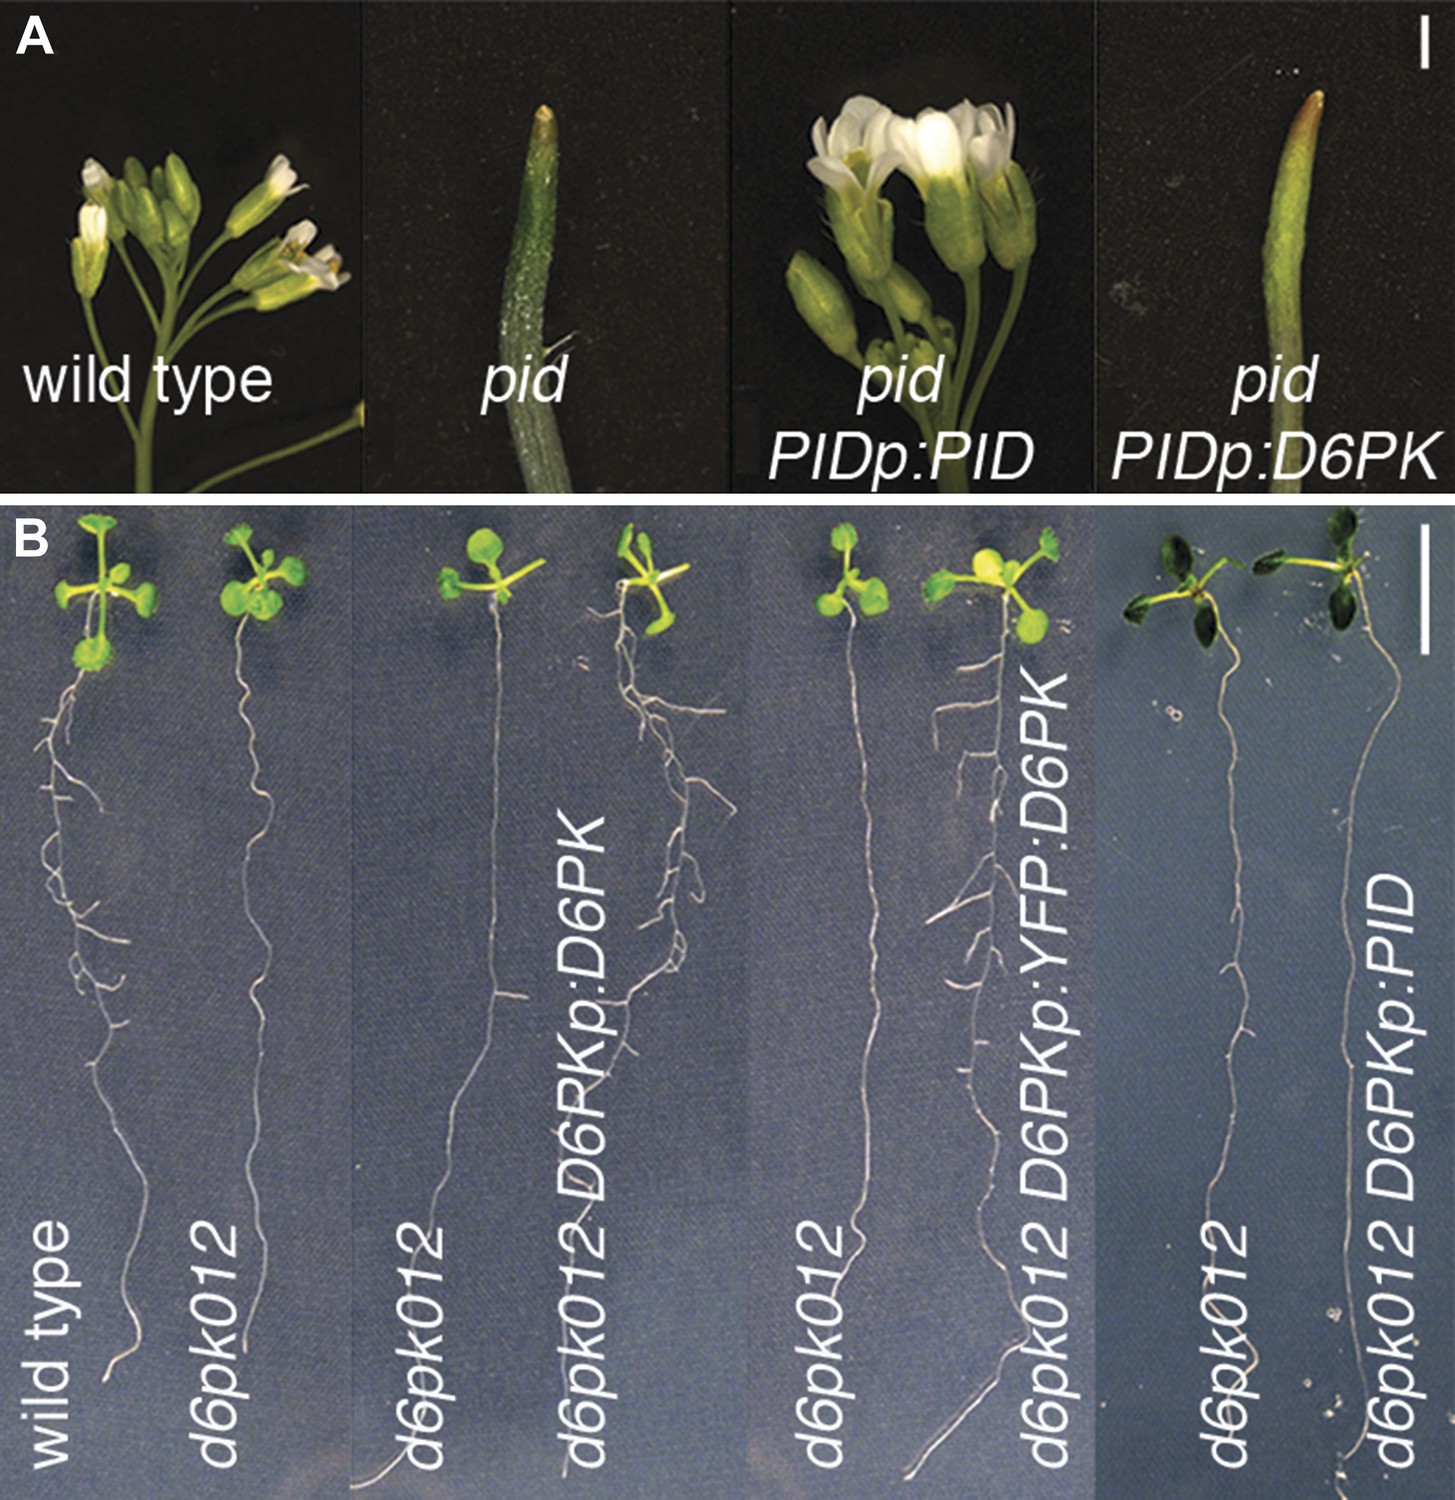
PID and D6PK are functionally non-redundant in vivo.
(A) and (B) Test for genetic suppression of (A) the inflorescence phenotype of the pid mutant (5-week-old plants) and (B) the lateral root formation defect (8 day-old seedlings) of d6pk012 triple mutants with PID and D6PK expressed from the PID (PIDp) and D6PK (D6PKp) promoters. The suppression of d6pk012 by D6PKp:YFP:D6PK demonstrates the functionality of the YFP:D6PK translational fusion employed in other experiments. Scale bars = 1 mm (A) and 1 cm (B).
Figure 10 with 4 supplements
Dose- and time-dependent phosphorylation of PIN1 S4 after auxin treatment.
(A). Quantification of PIN1 S4 phosphorylation in as a function of IAA concentration in inflorescence tissue of 5-week-old Arabidopsis plants. PIN1_pS4, phosphorylated form; PIN1_S4, unphosphorylated form. (B) SRM analysis of time-dependent S4 phosphorylation after IAA [10 µM] treatment of inflorescence tissue of 5-week-old Arabidopsis plants.
Figure 10—figure supplement 1
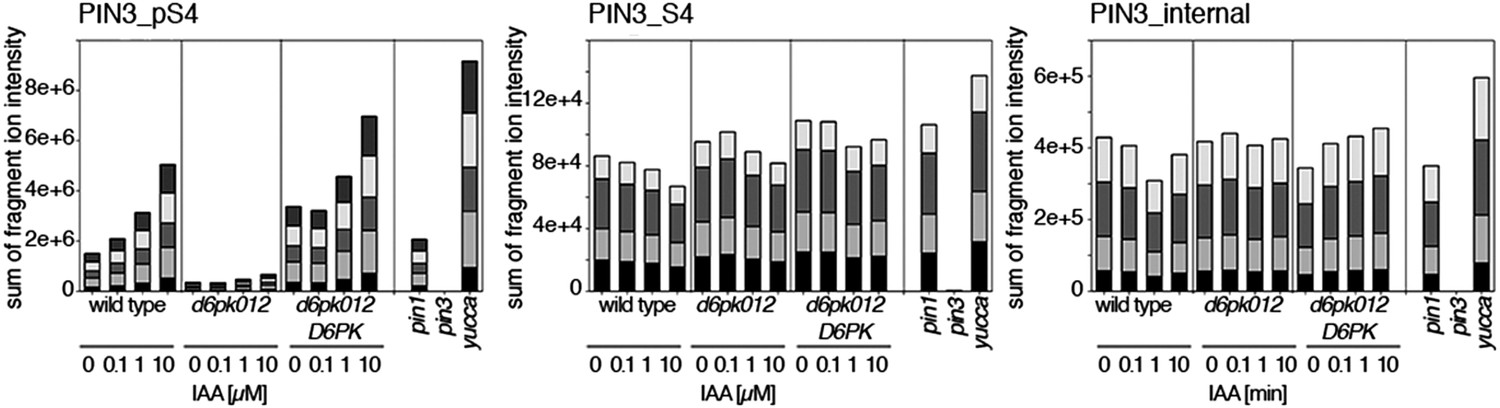
Dose-dependent phosphorylation of PIN3 S4 after auxin treatment.
Quantification of PIN3 S4 phosphorylation as a function of IAA concentration in inflorescence tissue of 5-week-old Arabidopsis plants. PIN3_pS4, phosphorylated form; PIN3_S4, unphosphorylated form. The internal peptide controls allow for quantification of the overall protein levels.
Figure 10—figure supplement 2
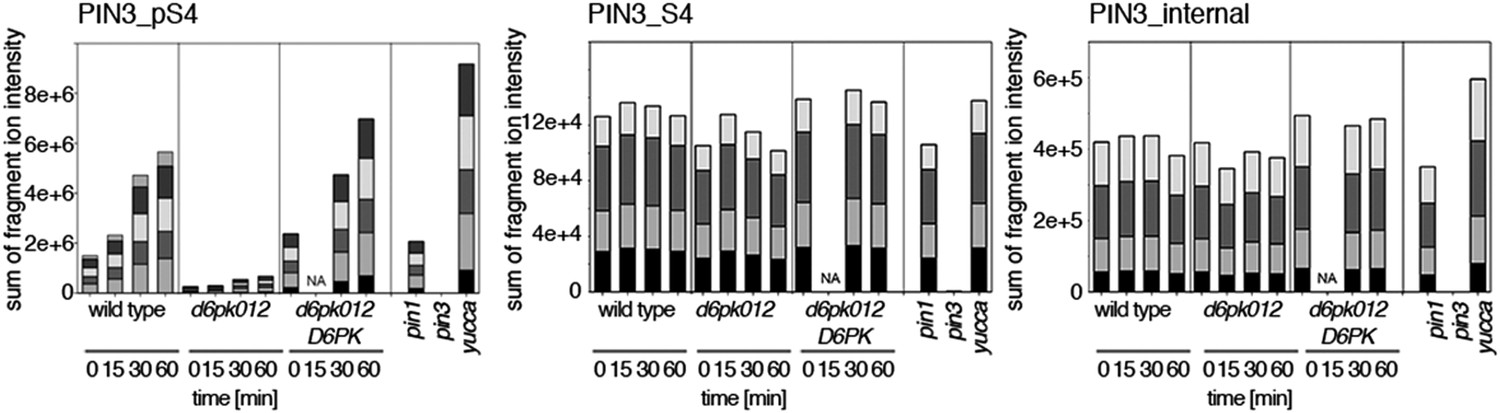
Time-dependent phosphorylation of PIN3 S4 after auxin treatment.
SRM analysis of time-dependent PIN3 S4 phosphorylation after IAA [10 µM] treatment of inflorescence tissue of 5-week-old Arabidopsis plants. PIN3_pS4, phosphorylated form; PIN3_S4, unphosphorylated form. The internal peptide controls allow for quantification of the overall protein levels.
Figure 10—figure supplement 3
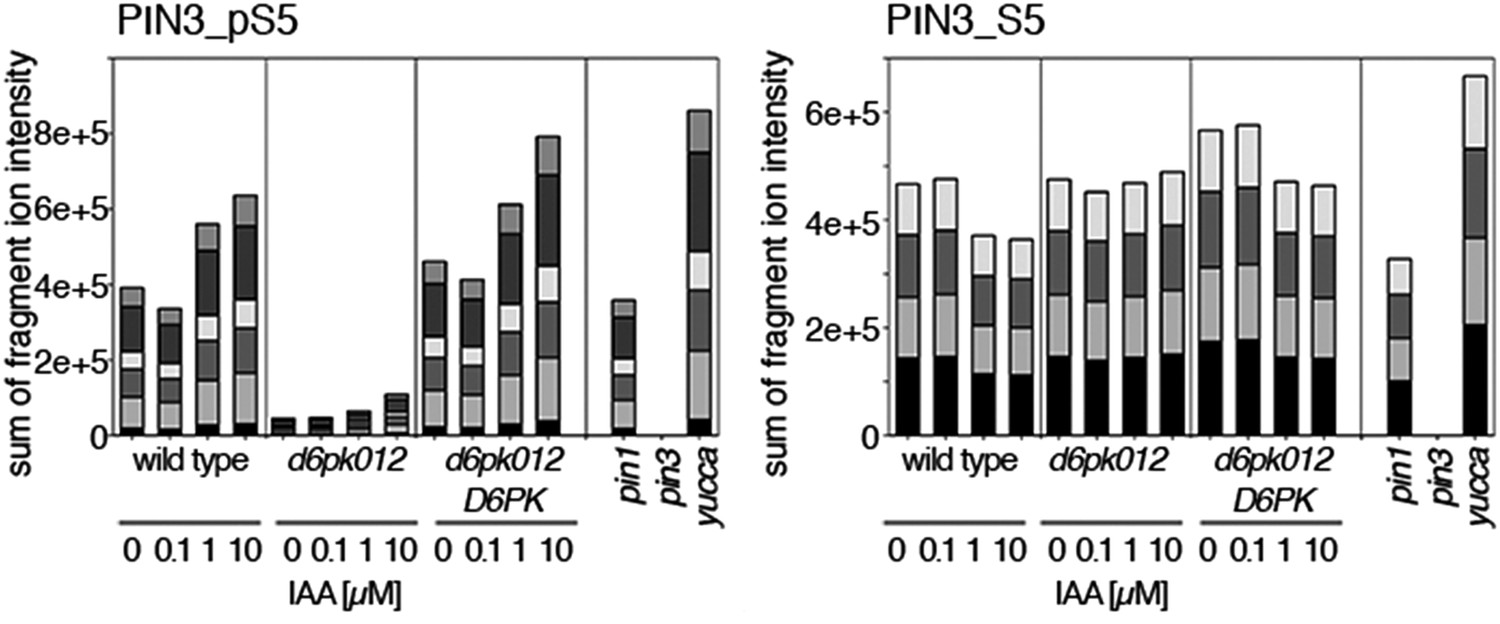
Dose-dependent phosphorylation of PIN3 S5 after auxin treatment.
Quantification of PIN3 S5 phosphorylation as a function of IAA concentration in inflorescence tissue of 5-week-old Arabidopsis plants. PIN3_pS5, phosphorylated form; PIN3_S5, unphosphorylated form. The internal peptide controls, shown in Figure 10—figure supplement 1, allow for quantification of the overall protein levels.
Figure 10—figure supplement 4
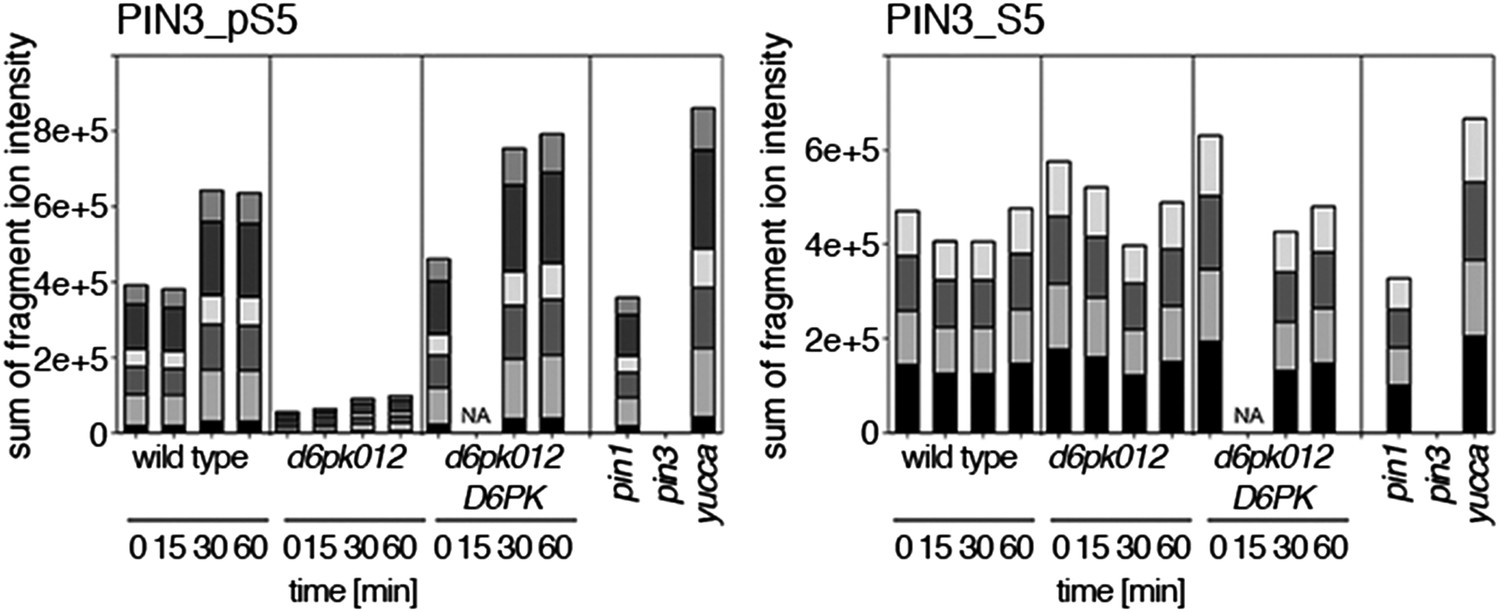
Time-dependent phosphorylation of PIN3 S5 after auxin treatment.
SRM analysis of time-dependent PIN3 S5 phosphorylation after IAA [10 µM] treatment of inflorescence tissue of 5-week-old Arabidopsis plants. PIN3_pS5, phosphorylated form; PIN3_S5, unphosphorylated form. The internal peptide controls, shown in Figure 10—figure supplement 2, allow for quantification of the overall protein levels.
Figure 11 with 1 supplement
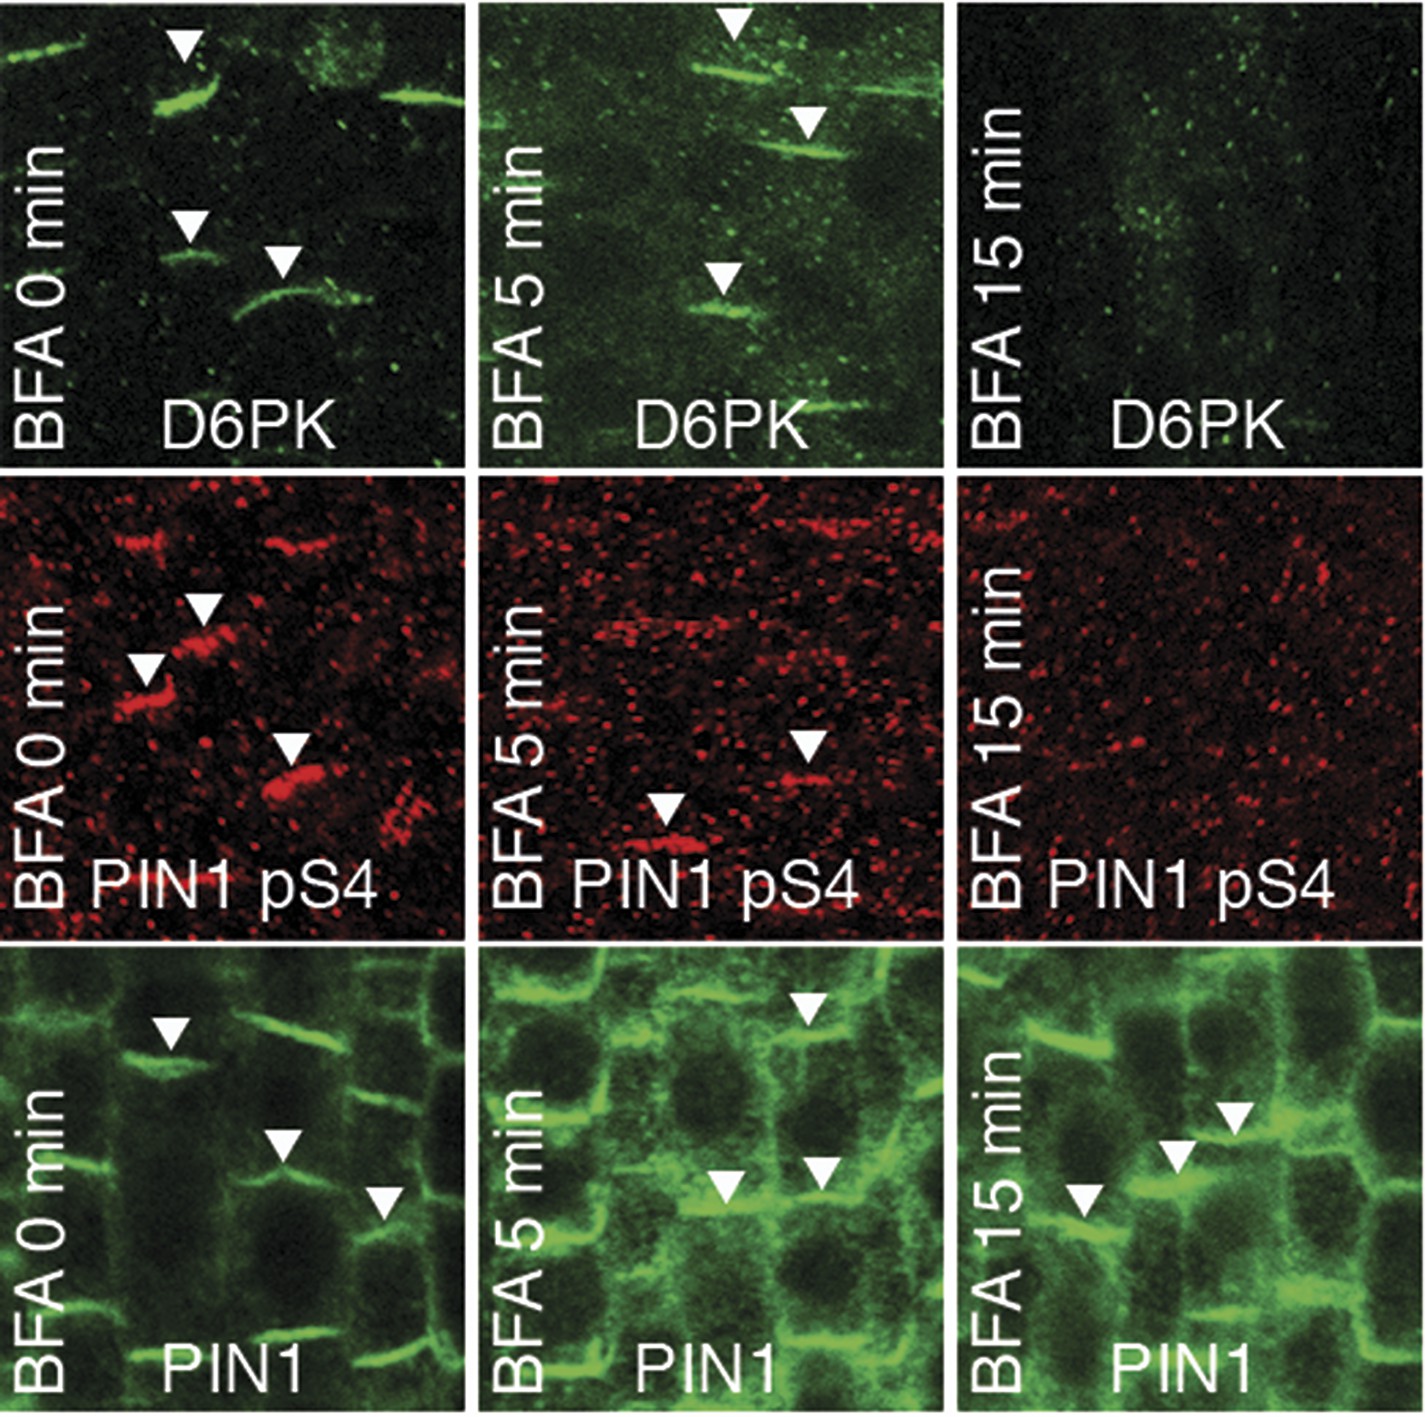
PIN1 pS4 is dependent on D6PK presence at the plasma membrane.
Representative confocal images of root stele cells after immunostaining highlighting (arrowheads) the presence of YFP:D6PK (D6PK), S4-phosphorylated PIN1 (PIN1 pS4) and PIN1 at the plasma membrane before and the absence of D6PK and PIN1 pS4 after BFA treatment. Note that unphosphorylated PIN1 can still readily be detected in a polarized manner after S4-phosphorylation was efficiently removed.
Figure 11—figure supplement 1
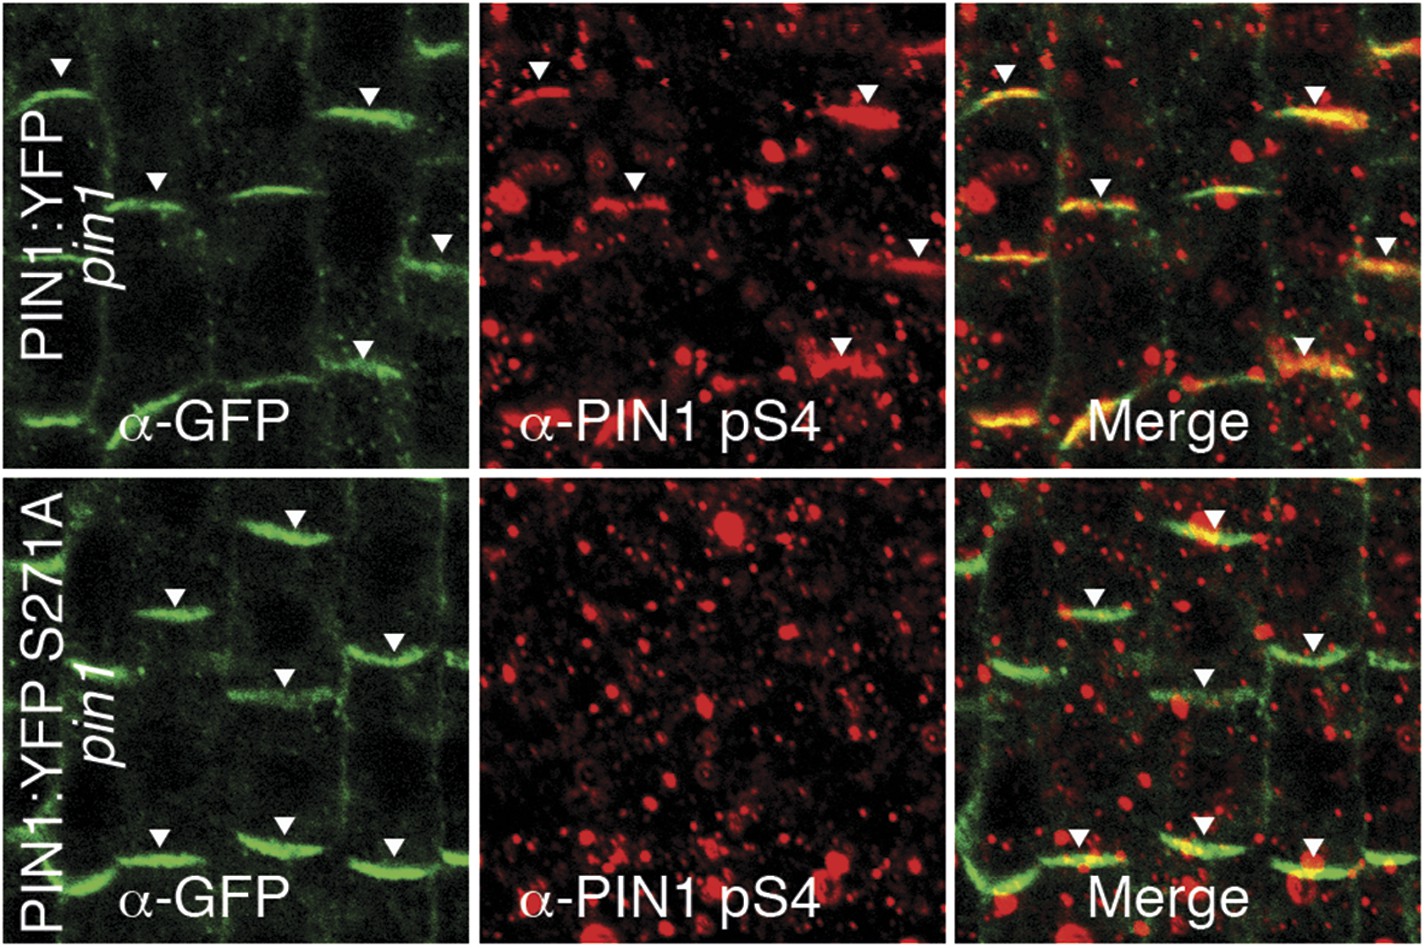
α-PIN1 pS4 is a PIN1 S4 phosphosite-specific antibody.
Representative confocal images of root stele cells after immunostaining, highlighting (arrowheads) the presence and absence of PIN1 and S4-phosphorylated PIN1 (PIN1 pS4) in the wild type and the PIN1 S4A mutant, respectively.
Additional files
-
Supplementary file 1
(A) Primer sequences used in this study. (B) Sequences of peptides used for phosphorylation experiments. (C) Peptides used for SRM analyses.
- https://doi.org/10.7554/eLife.02860.033
Download links
A two-part list of links to download the article, or parts of the article, in various formats.
Downloads (link to download the article as PDF)
Open citations (links to open the citations from this article in various online reference manager services)
Cite this article (links to download the citations from this article in formats compatible with various reference manager tools)
Auxin efflux by PIN-FORMED proteins is activated by two different protein kinases, D6 PROTEIN KINASE and PINOID
eLife 3:e02860.
https://doi.org/10.7554/eLife.02860


