Insect endosymbiont proliferation is limited by lipid availability
- School of Life Sciences, Ecole Polytechnique Fédérale de Lausanne (EPFL), Switzerland
- Platform BioPark Archamps, France
- Université Joseph Fourier, AGIM FRE CNRS, France
Figures
Figure 1 with 1 supplement
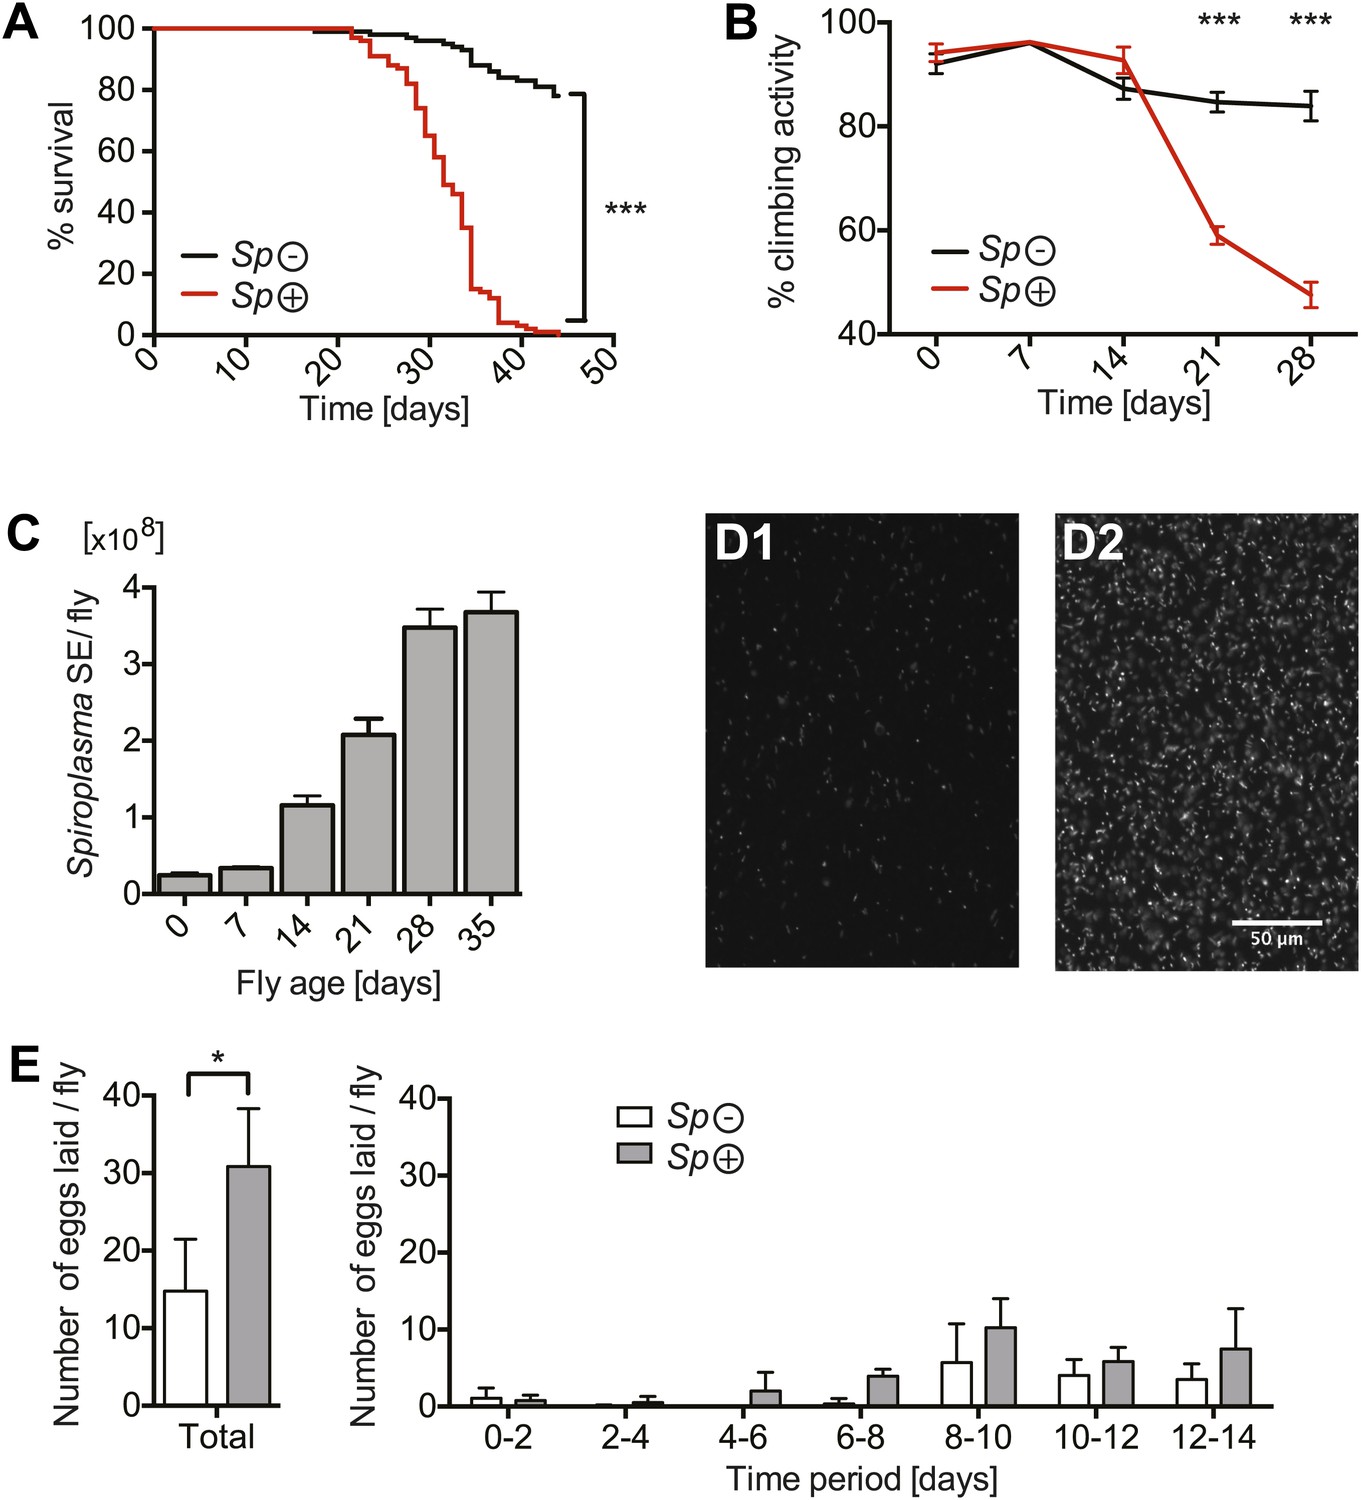
Spiroplasma proliferation is associated with life span reduction.
(A) Life span of virgin flies-harboring Spiroplasma (Sp (+)) relative to control flies that do not harbor Spiroplasma (Sp (−)) when kept on a rich Drosophila diet. ***p<0.0001, N = 50 flies per condition. Shown is one representative experiment out of three independent experiments. (B) The climbing activity of virgin flies-harboring Spiroplasma (Sp (+)) relative to uninfected flies (Sp (−)) over time. ***p<0.0001, N = 20 flies per condition. Shown is one representative experiment out of three independent experiments. (C) qPCR quantification of the titers of Spiroplasma in virgin flies over aging. Values for each timepoint have at least three samples (five flies pooled per sample). Shown is one representative experiment out of three independent experiments. (D) Fluorescent microscopy images depicting SYTO-9 stained Spiroplasma in Drosophila hemolymph at 7 days (D1) and 21 days (D2) of fly age. (E) The number of eggs laid by virgin flies-harboring Spiroplasma (Sp (+)) relative to control flies that do not harbor Spiroplasma (Sp (−)), in total over 14 days (left panel) and in 2-day period over 14 days (right panel). In total, Spiroplasma-infected virgin flies laid significantly more eggs. *p=0.02. Shown is the mean ± SEM of data pooled from four independent experiments, N = 20 flies per experiment.
Figure 1—figure supplement 1
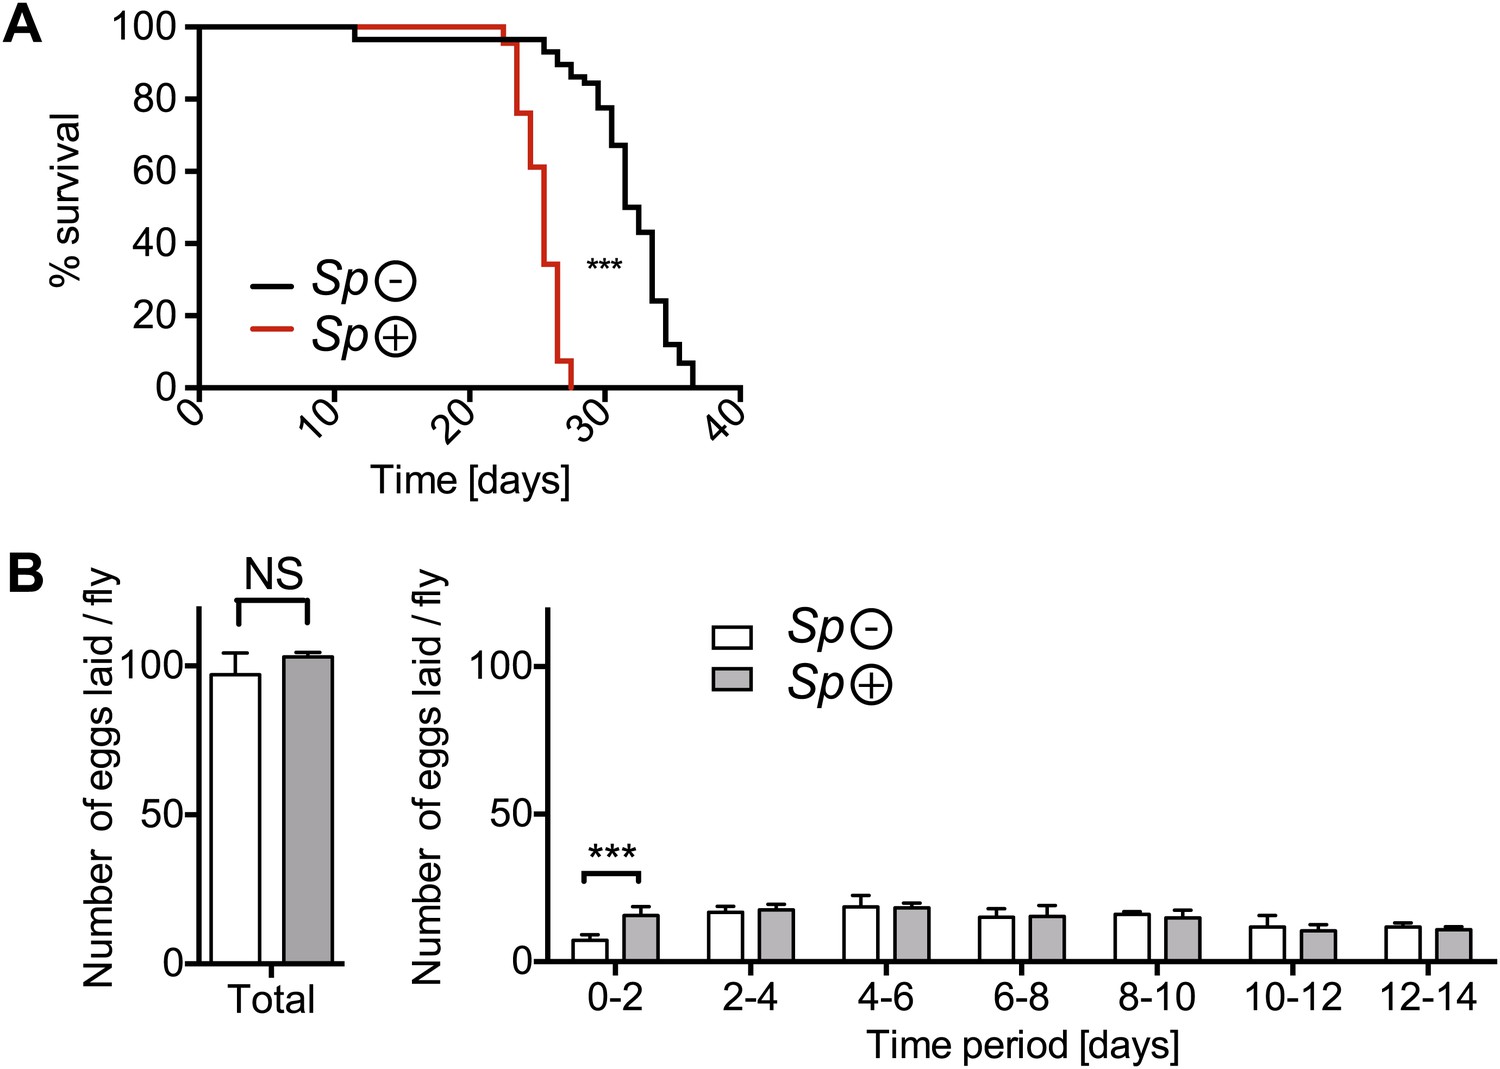
The impact of Spiroplasma infection on survival and egg production by mated females on rich media.
(A) Life span of mated flies-harboring Spiroplasma (Sp (+)) relative to control flies that do not harbor Spiroplasma (Sp (−)) when kept on a rich Drosophila diet. ***p<0.0001, N = 20 flies per condition. Shown is one representative experiment out of three independent experiments. (B) The number of eggs laid by mated flies-harboring Spiroplasma (Sp (+)) relative to control flies that do not harbor Spiroplasma (Sp (−)), in total over 14 days (left panel) and in a 2-day period over 14 days (right panel). In total, there was no significant difference between the number of eggs laid by Spiroplasma-infected and Spiroplasma-uninfected mated flies. *p=0.02 and NS (p=0.16). Over the first 2 days, Spiroplasma-infected mated females produced significantly more eggs than their uninfected counterparts. ***p=0.0005. Shown is the mean ± SEM of data pooled from four independent experiments, N = 20 flies per experiment.
Figure 2 with 2 supplements
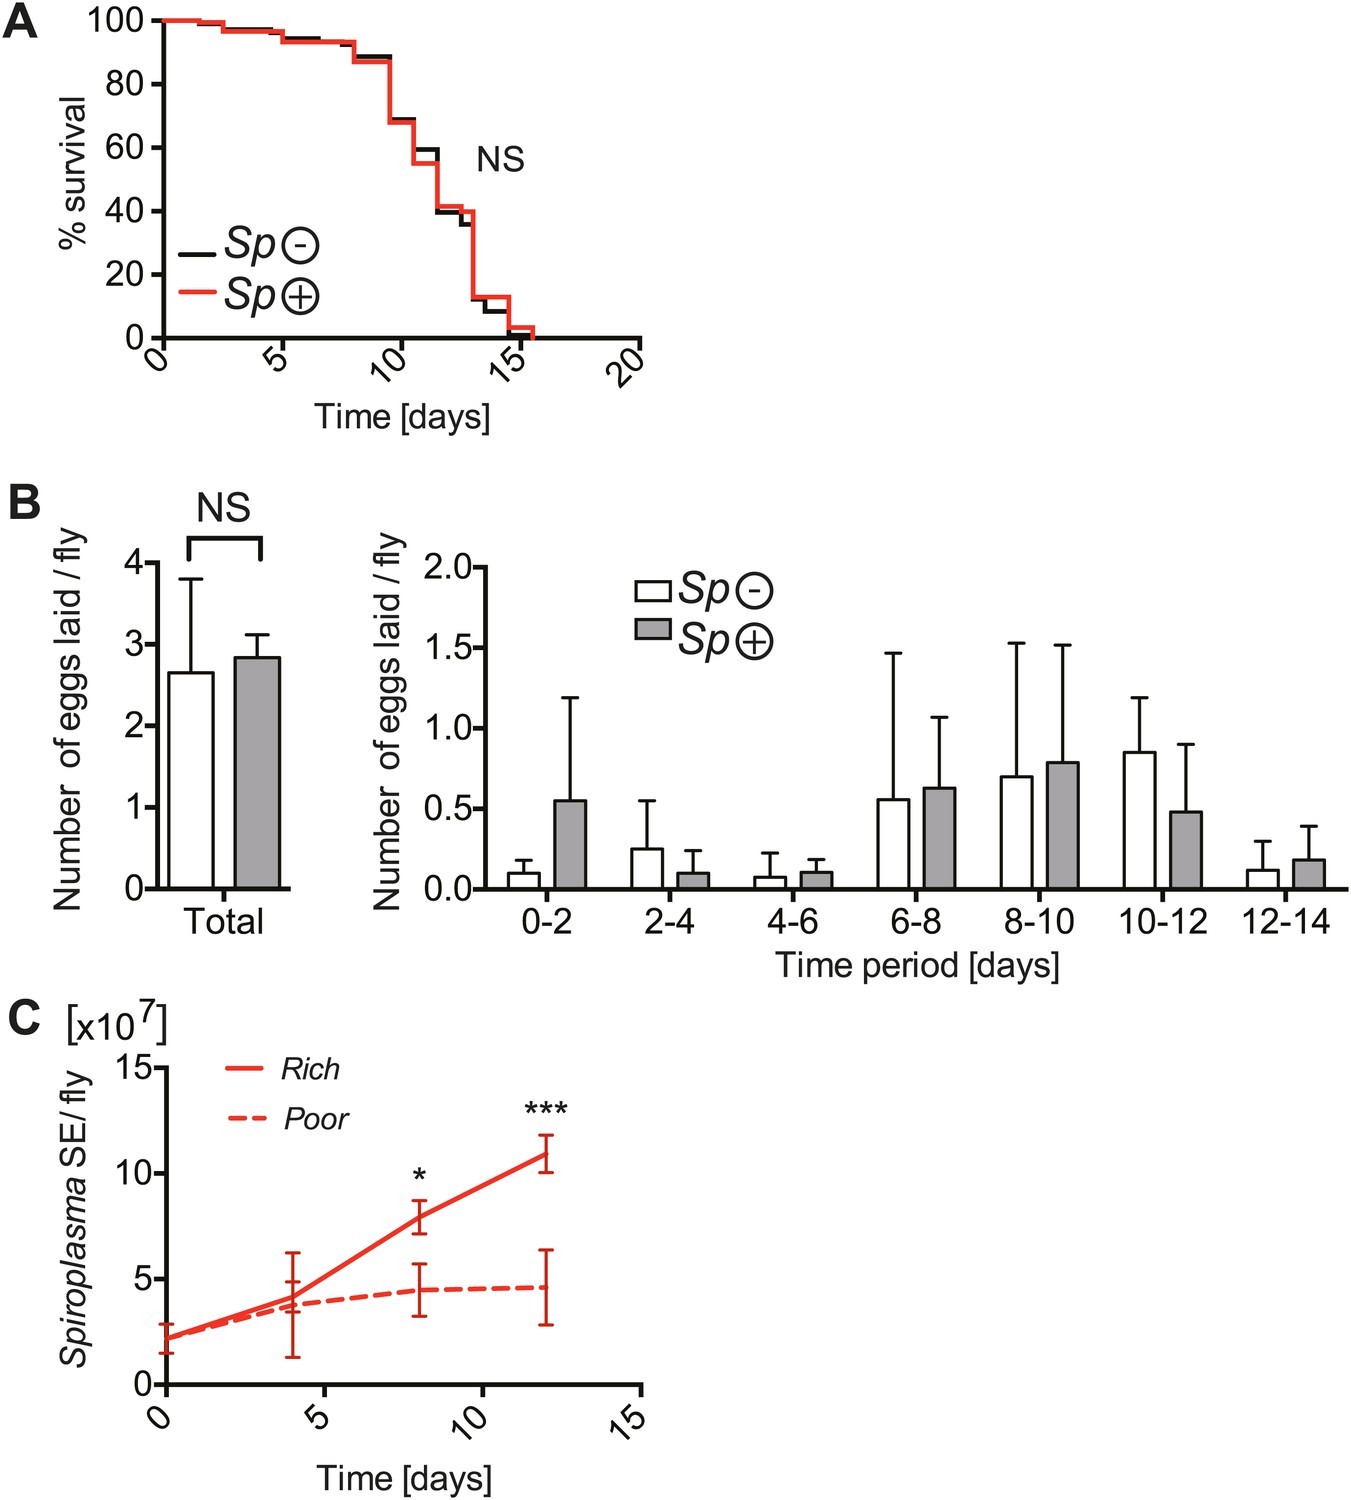
The implications of harboring Spiroplasma under host nutritional depravation.
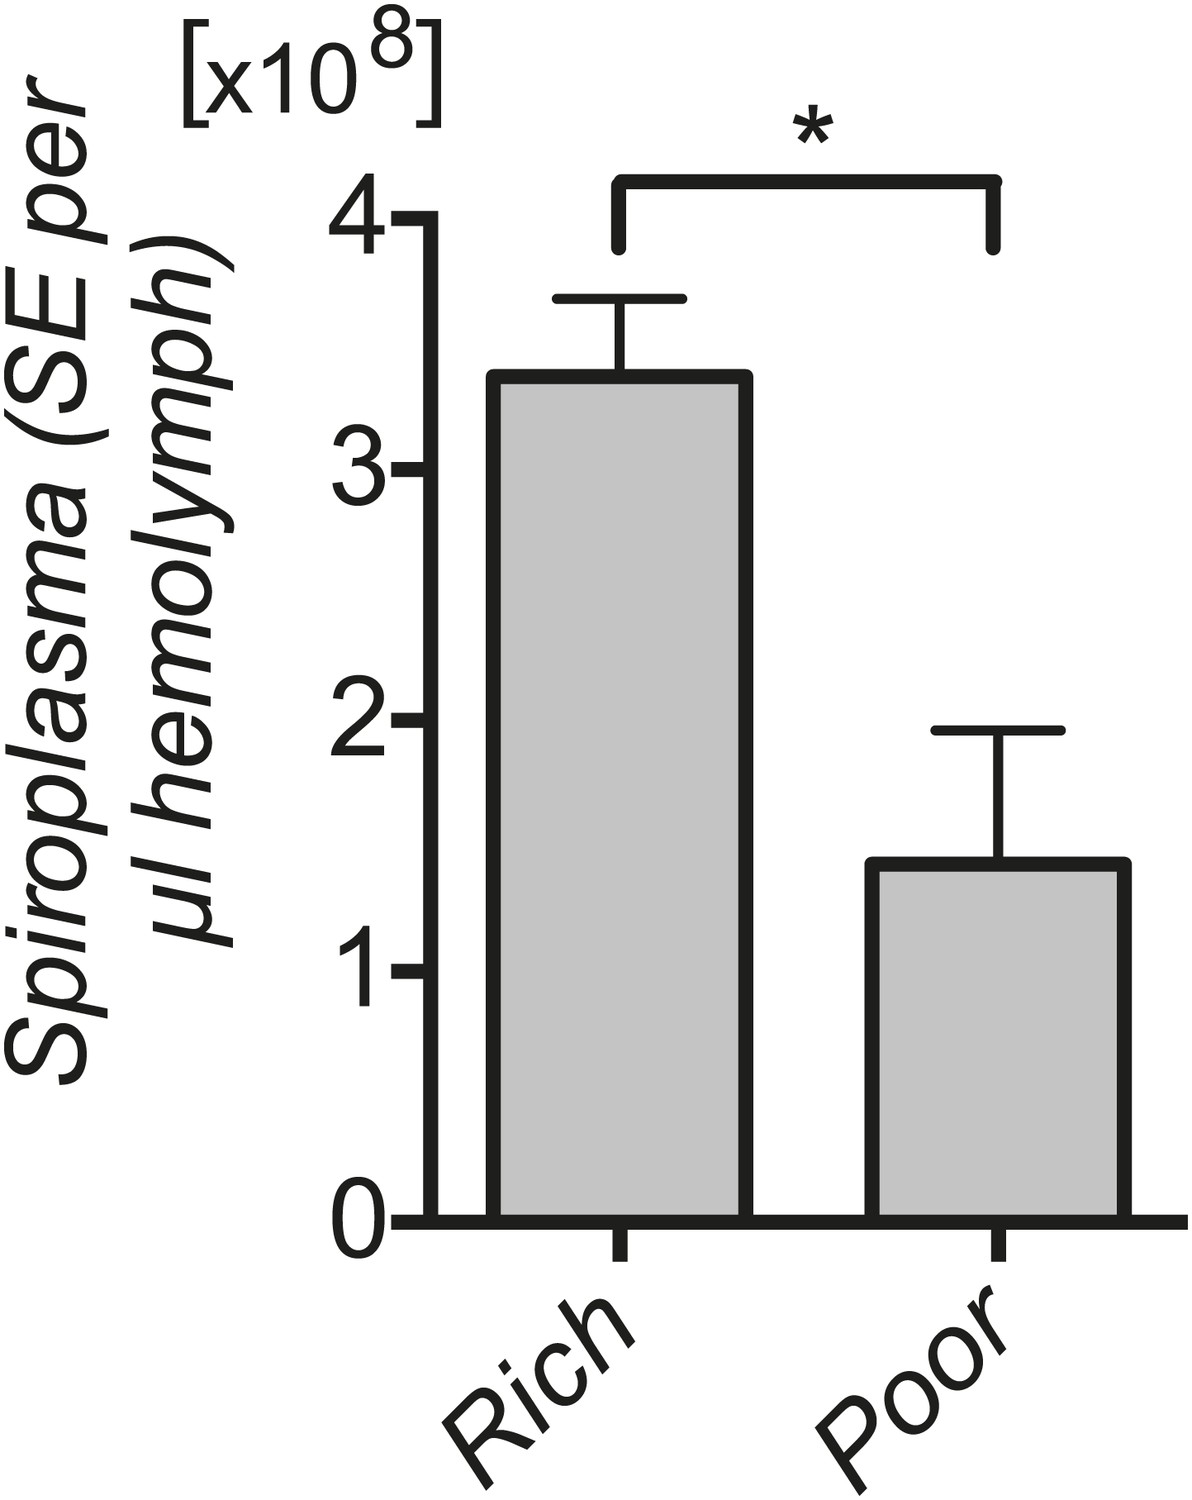
(A) Survival of virgin flies on a nutritionally poor diet. Flies-harboring Spiroplasma (Sp (+)) do not have significantly different mortality from flies that do not harbor Spiroplasma (Sp (−)). NS (p=0.9378). N = 50 flies per condition. Shown is one representative experiment out of three independent experiments. (B) The number of eggs laid by virgin flies-harboring Spiroplasma (Sp (+)) relative to control flies that do not harbor Spiroplasma (Sp (−)), in total over 14 days (left panel) and in 2-day period over 14 days (right panel). Overall, there is no significant difference in the number of eggs laid between Spiroplasma-infected and uninfected virgin flies under nutrient deprivation. NS (p=0.77). Shown is the mean ± SEM of data pooled from four independent experiments, N = 20 flies per experiment. (C) Quantification of Spiroplasma titers by qPCR reveals that virgin female flies maintained on the same nutritionally poor diet as in panel A have significantly lower Spiroplasma titers after 8 and 12 days than flies maintained on a rich diet. *p=0.015 and ***p=0.0002, respectively. Values for each time-point have at least three samples (five flies pooled per sample). Shown is the mean ± SEM of one representative experiment out of the three independent experiments that were conducted.
Figure 2—figure supplement 1
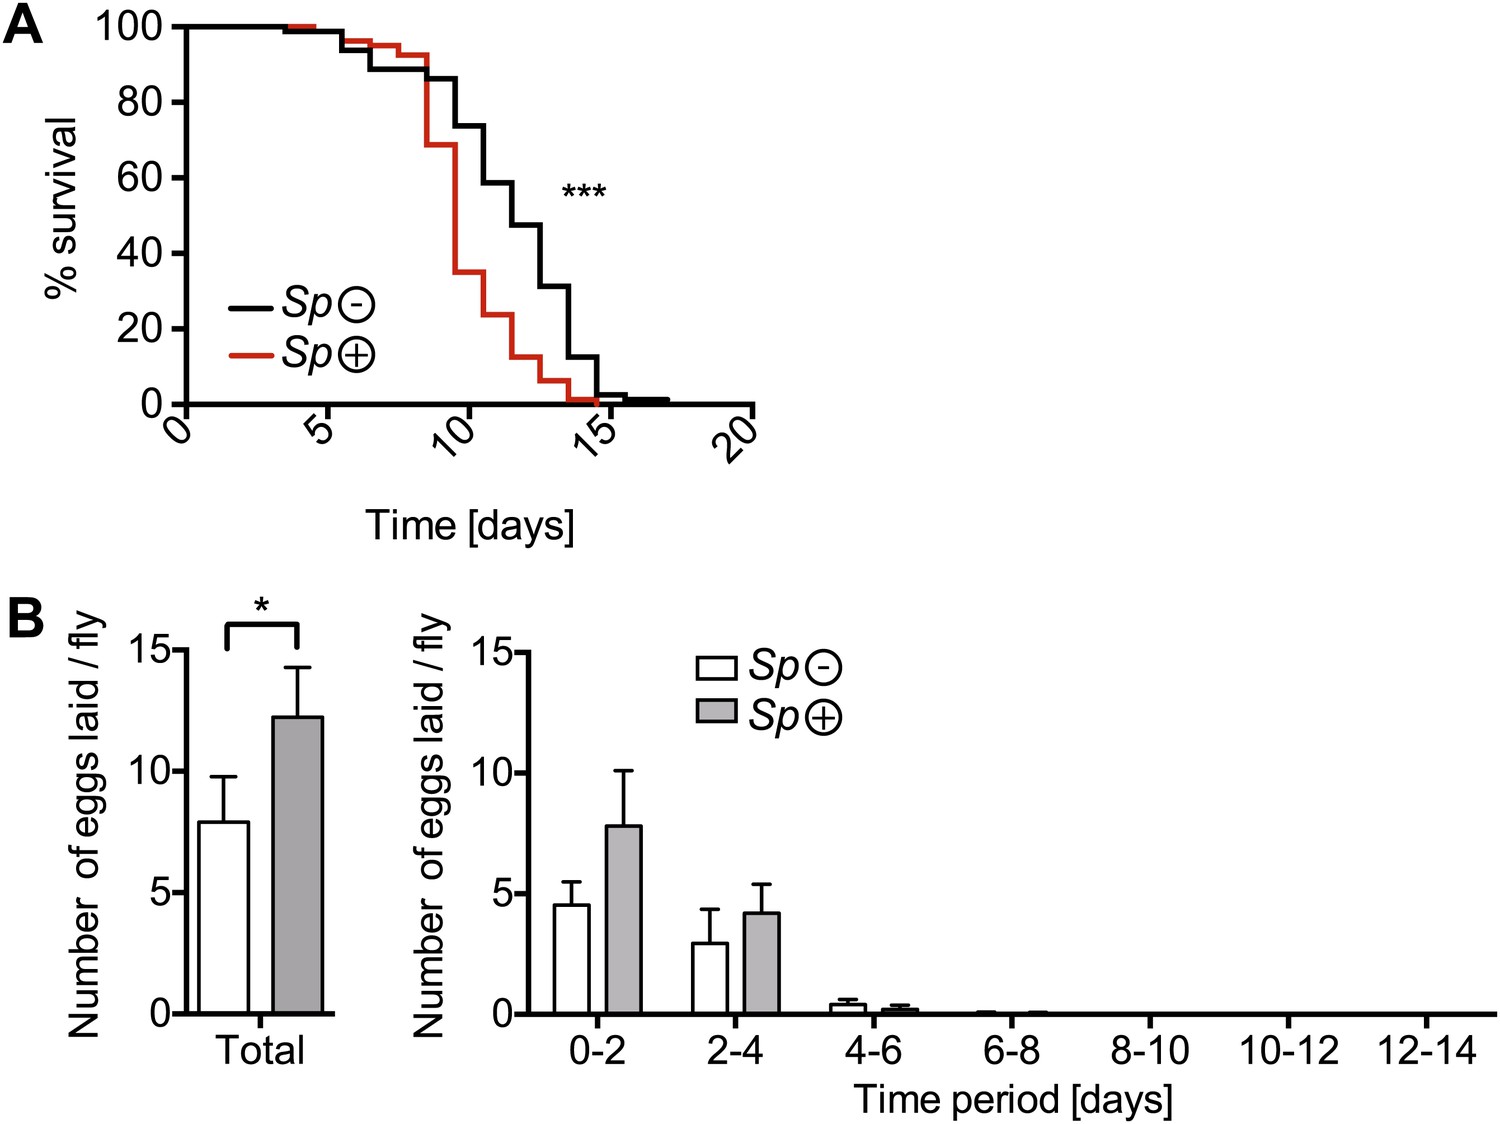
The effects of nutrient deprivation on survival and egg production of Spiroplasma-infected mated females.
(A) Survival of mated flies on a nutritionally poor diet. Mated flies-harboring Spiroplasma (Sp (+)) do have significantly higher mortality relative to mated flies that do not harbor Spiroplasma (Sp (−)) on a nutritionally poor diet. ***p<0.0001. N = 20 flies per condition. Shown is one representative experiment out of three independent experiments. (B) The number of eggs laid by mated flies-harboring Spiroplasma (Sp (+)) relative to control flies that do not harbor Spiroplasma (Sp (−)), on a nutrient poor diet, in total over 14 days (left panel) and in 2-day period over 14 days (right panel). In total, Spiroplasma-infected mated flies laid significantly more eggs. *p=0.02. Shown is the mean ± SEM of data pooled from four independent experiments, N = 20 flies per experiment.
Figure 2—figure supplement 2
Spiroplasma titers in fly hemolymph under nutrient deprivation.
Quantification by qPCR reveals that Spiroplasma titers are significantly lower in the hemolymph of flies maintained on a nutrient poor diet for 12 days than flies maintained on a rich diet. *p=0.04. Values are the mean ± SEM of at least three samples (hemolymph from 12 flies pooled per sample). Shown is one representative experiment out of the three independent experiments that were conducted.
Figure 3 with 1 supplement
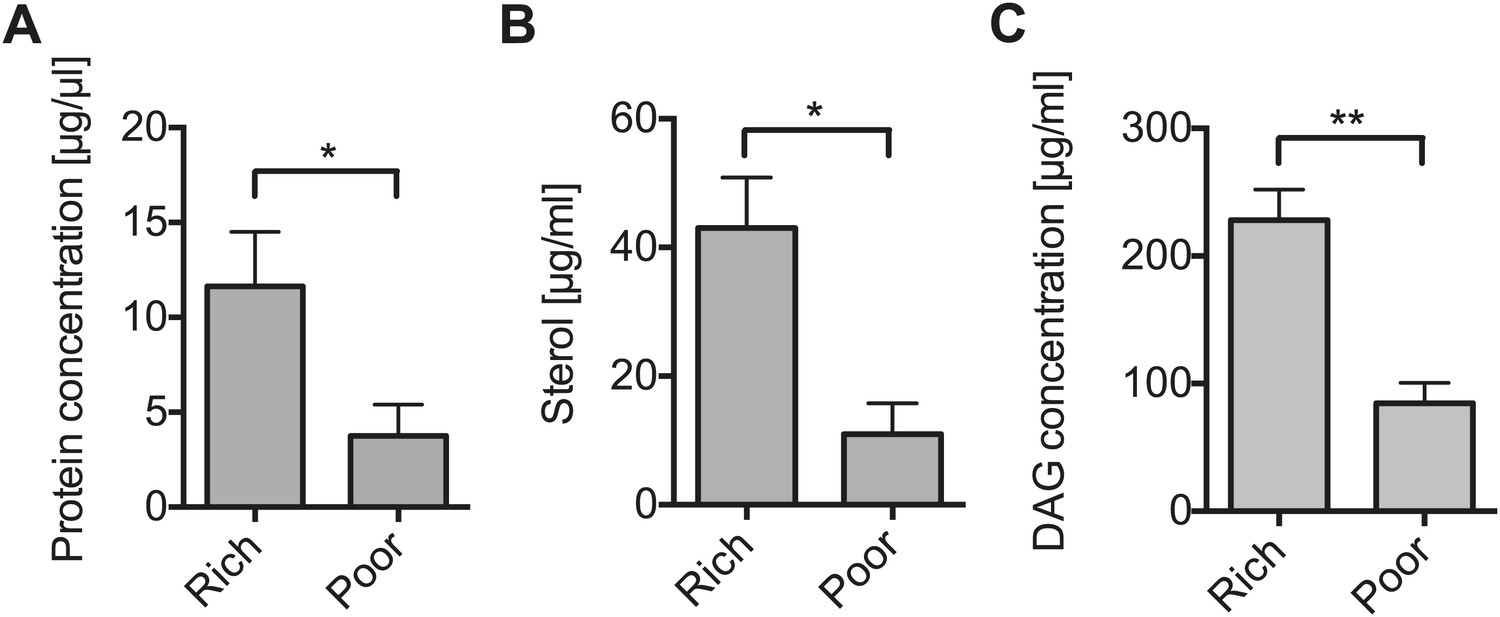
Nutrient deprivation depletes host lipids.
(A–C) The protein (A), sterol (B), and DAG (C) concentration of the hemolymph of flies maintained on nutritionally poor diets for 12 days is significantly lowered relative to flies maintained on a nutritionally rich diet. Mean ± SEM of three independent experiments is shown, *p=0.038, *p=0.023, and **p=0.0018, respectively.
Figure 3—figure supplement 1
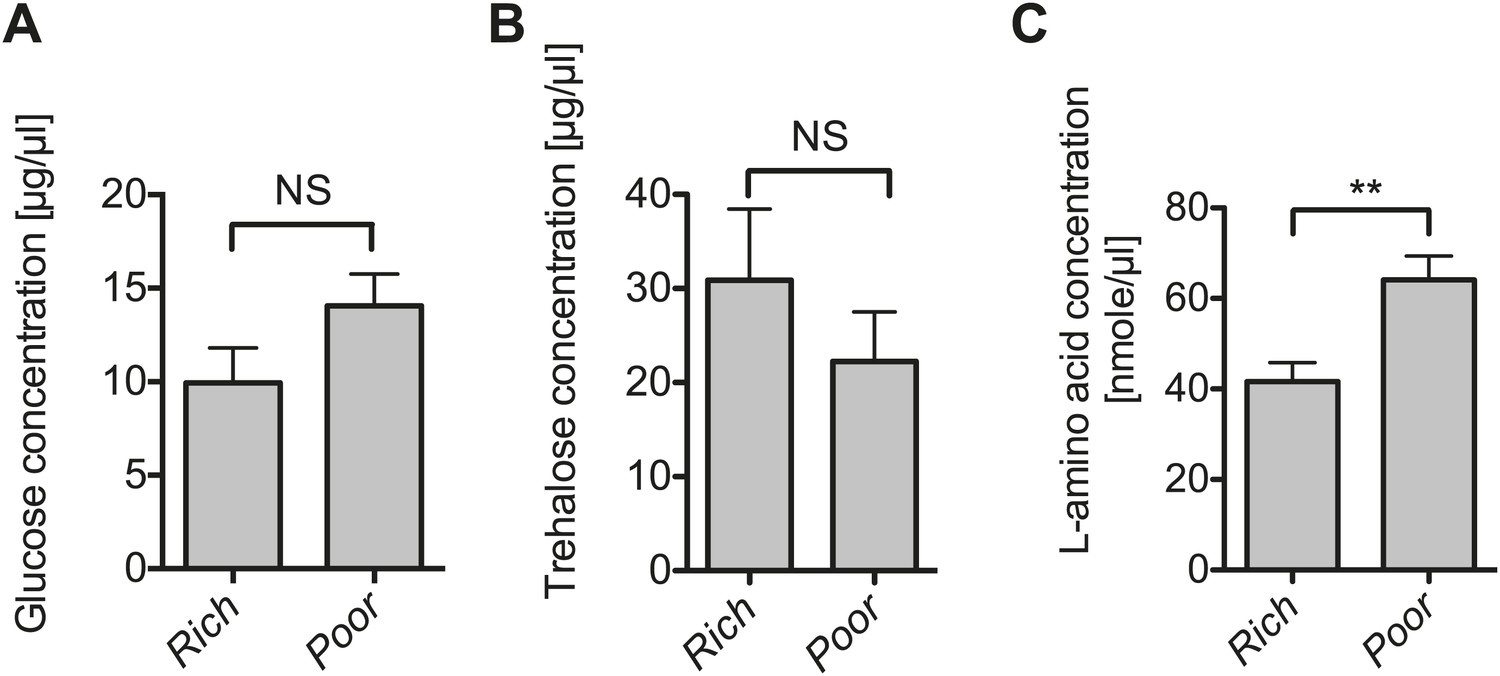
The impact of nutrient deprivation on hemolymph metabolite concentrations.
Quantification of glucose (A), trehalose (B), and L-amino acid (C) concentration of the hemolymph of flies maintained on nutritionally poor diets for 12 days relative to flies maintained on a rich diet. L-amino acid concentration of the hemolymph is significantly higher in nutrient poor media relative to flies maintained under nutrient rich conditions while glucose and trehalose concentrations remain unchanged. Mean ± SEM of three independent experiments is shown, NS (p=0.1319 and p=0.357) and **p=0.0027.
Figure 4

Spiroplasma proliferation is influenced by the nutrient composition of the diet.
Quantification of Spiroplasma titers by qPCR reveals that complementing nutrient poor media with inactivated yeast results in a significant increase in Spiroplasma titers after 12 days. ***p=0.0003. In contrast, complementing nutrient poor media with sucrose does not significantly increase Spiroplasma titers. NS (p=0.5). Values are the mean ± SEM of at least four samples (five flies per sample). Shown is one representative experiment out of the three independent experiments that were conducted.
Figure 5 with 2 supplements
Spiroplasma infection depletes lipids of Drosophila maintained under normal conditions.
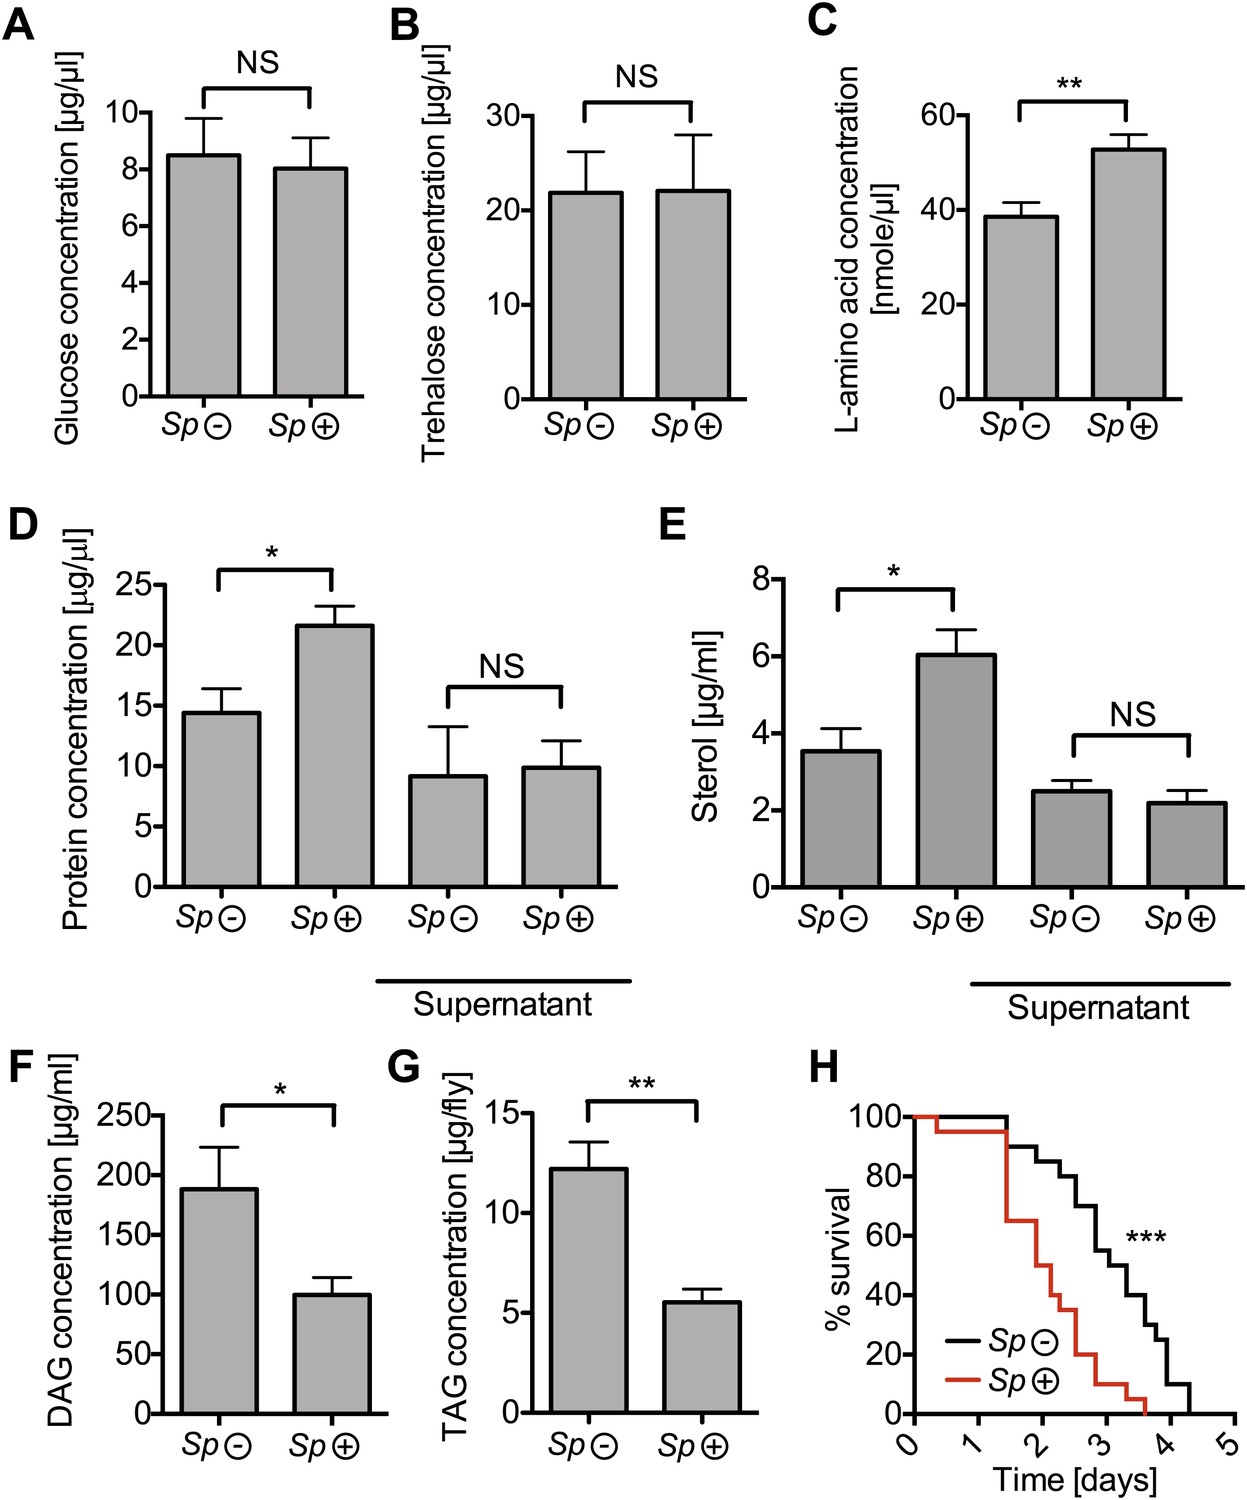
Quantification of metabolites in flies that have been maintained on rich media for 12 days. Glucose (A), trehalose (B), and L-amino acid (C) concentration within the hemolymph of uninfected flies (Sp (−)) and Spiroplasma-infected flies (Sp (+)). L-amino acid concentration in the hemolymph is significantly higher in Spiroplasma-infected flies while glucose and trehalose concentrations remain unchanged. Mean ± SEM of three independent experiments is shown, NS (p=0.798 and p=0.977) and **p=0.0056. (D–E) Quantifications of protein (D) and sterol (E) concentration in hemolymph from flies that harbor Spiroplasma (Sp (+)) and uninfected flies (Sp (−)). Hemolymph samples denoted as ‘supernatant’ have been subjected to an additional centrifugation to remove Spiroplasma cells, whereas all other hemolymph samples contain both Spiroplasma cells and hemolymph. Flies-harboring Spiroplasma have significantly higher total levels of protein and sterol in the hemolymph. Mean ± SEM of three independent experiments is shown, *p=0.04 and *p=0.037. After centrifugation to remove bacteria from the hemolymph, there was no longer any significant difference in protein and sterol concentrations between Spiroplasma-infected and uninfected hemolymph. Mean ± SEM of three independent experiments is shown, NS (p=0.881 and p=0.491, respectively). (F) Quantification of DAG content of hemolymph extracts from flies that harbor Spiroplasma (Sp (+)) and flies that do not (Sp (−)). *p=0.0266. Mean ± SEM of three independent experiments is shown. (G) Quantification of whole-fly (reflecting mainly fat body) TAG levels in flies that harbor Spiroplasma (Sp (+)) and uninfected flies (Sp (−)). **p=0.0043. Mean ± SEM of three independent experiments is shown. (H) Survival of flies subjected to an acute starvation after being maintained on rich media for 12 days. Flies-harboring Spiroplasma (Sp (+)) have significantly greater mortality rate than flies that do not harbor Spiroplasma (Sp (−)). ***p<0.0001. N = 20 flies per condition, shown is one representative experiment out of three independent.
Figure 5—figure supplement 1
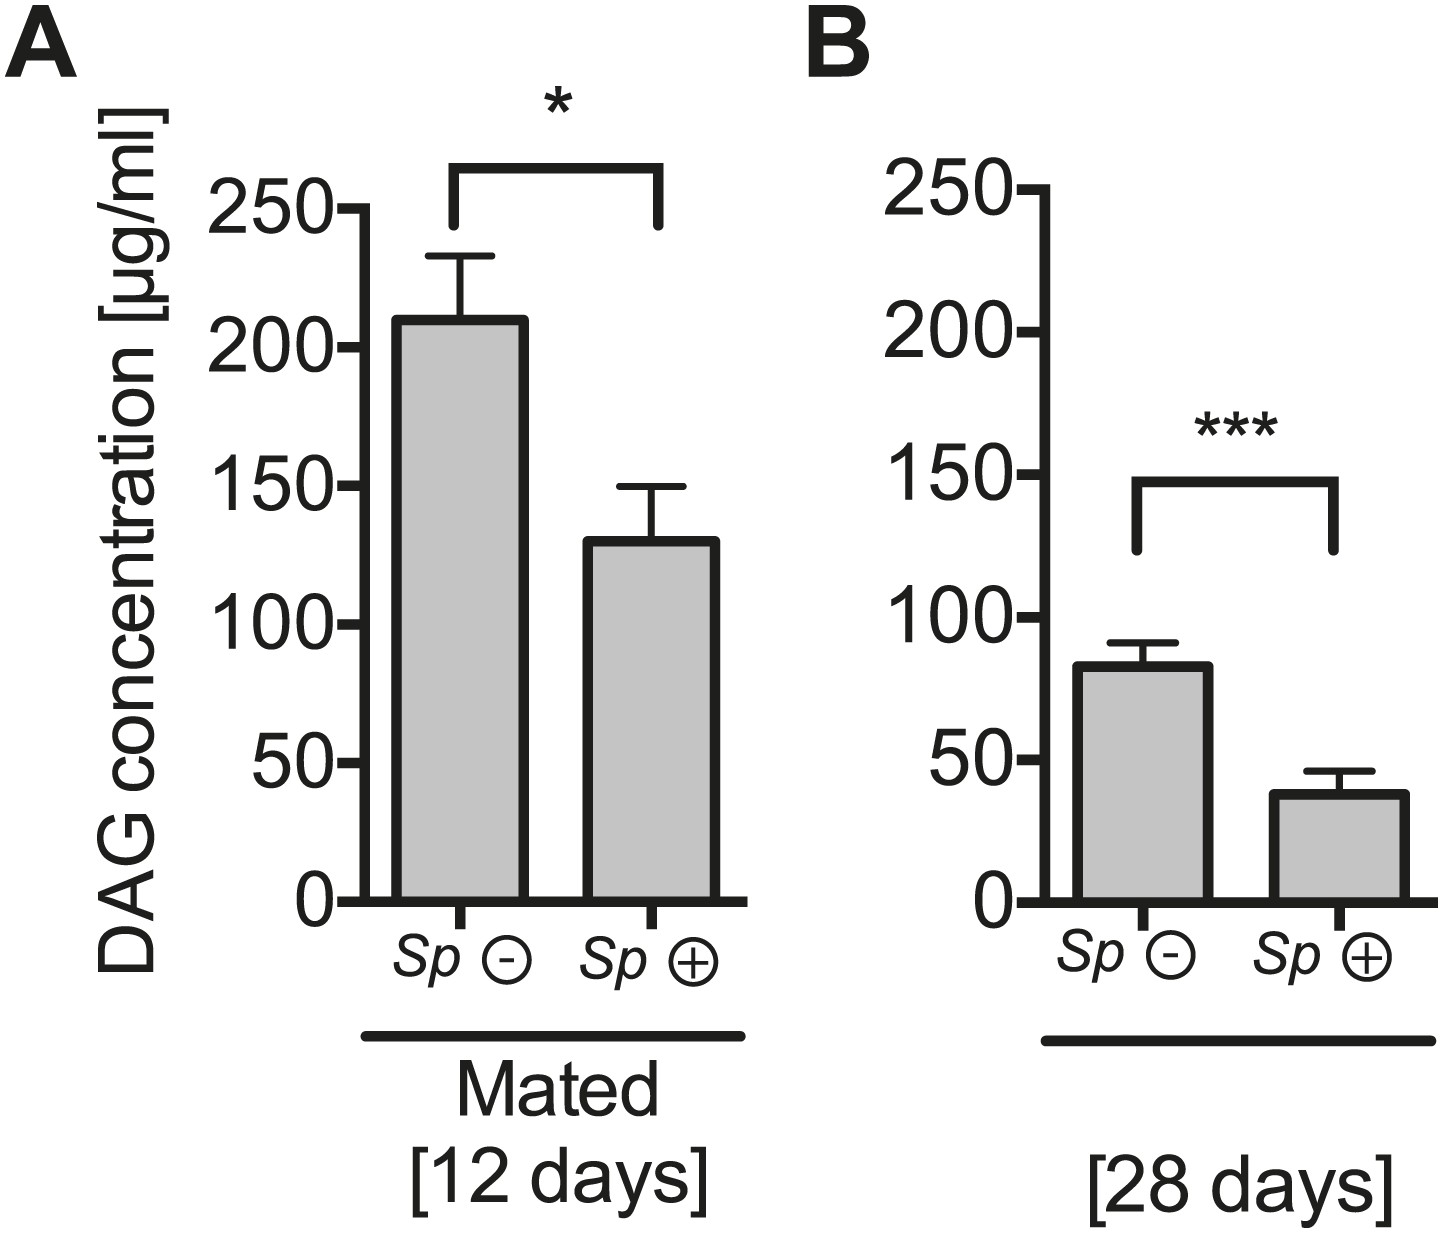
The impact of Spiroplasma proliferation hemolymph DAG concentration in mated flies and old flies.
Quantification of DAG content of hemolymph extracts from 12-day-old mated flies (A) and 28-day-old virgin flies (B) that harbor Spiroplasma (Sp (+)) and flies that do not (Sp (−)). *p=0.03 and **p=0.0008, respectively. Mean ± SEM of three independent experiments is shown.
Figure 5—figure supplement 2
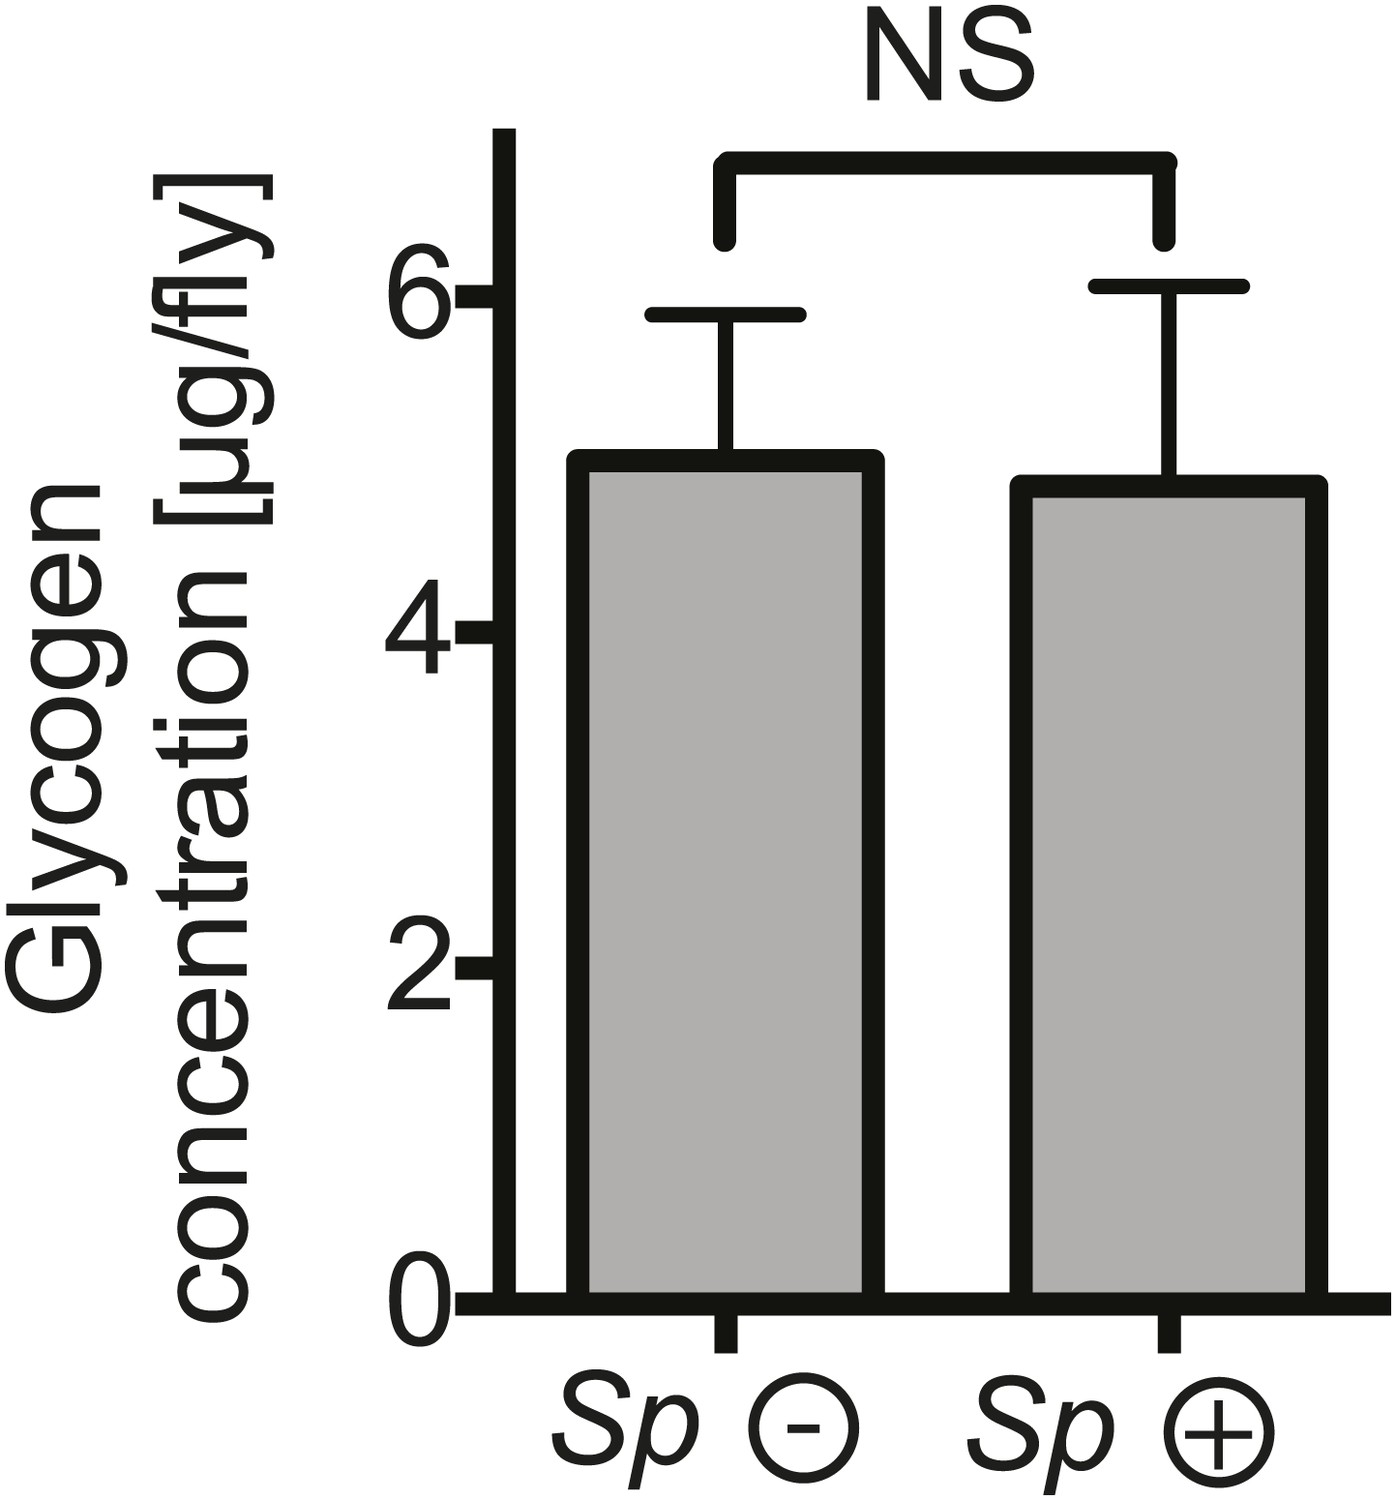
The impact of Spiroplasma proliferation on fat body glycogen stores.
Whole fly (reflecting mainly fat body stores) glycogen concentrations in 12-day-old flies uninfected (Sp (−)) and infected (Sp (+)) with Spiroplasma. Mean ± SEM of three independent experiments is shown, NS (p=0.9226).
Figure 6
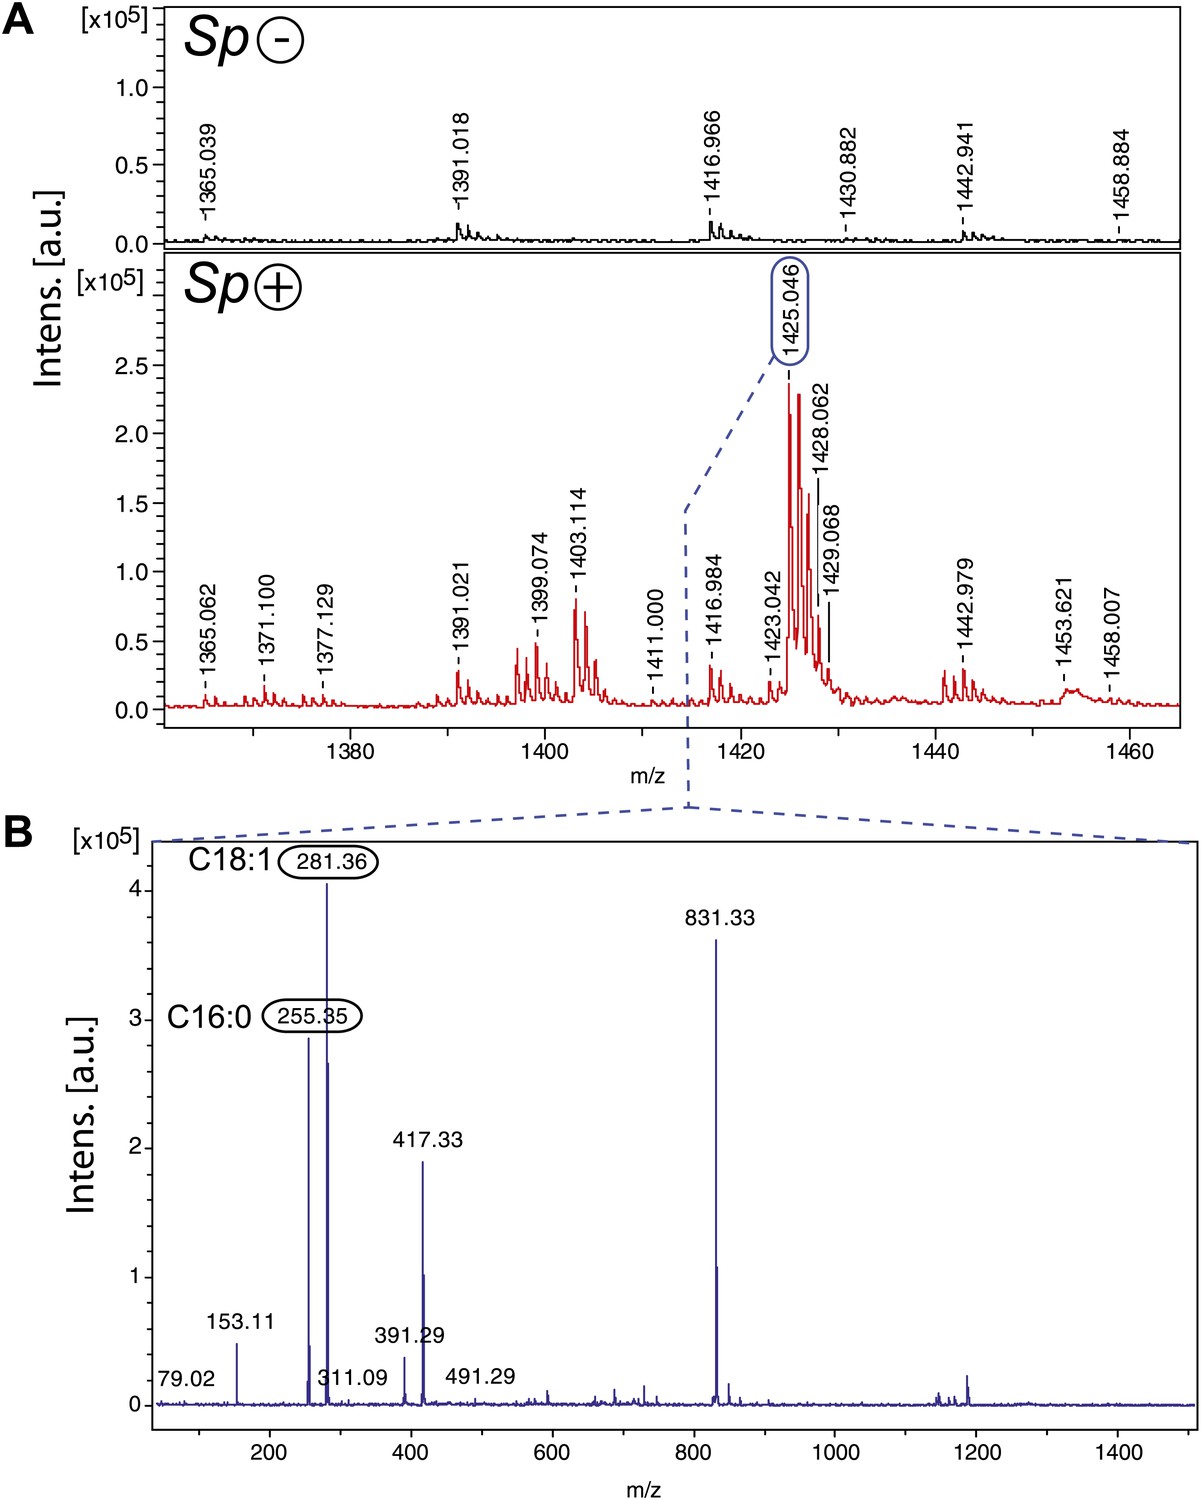
Spiroplasma produces cardiolipin in Drosophila hemolymph.
(A) Negative MALDI-TOF/MS lipid profile of hemolymph from Spiroplasma-uninfected (top) and Spiroplasma-infected flies (bottom). The m/z signal peaks in the 1380–1460 range of Spiroplasma-uninfected hemolymph do not correspond to m/z values of cardiolipin, whereas the peaks in this region for Spiroplasma-infected hemolymph profile (e.g., 1403.11, 1425.05) do correspond to cardiolipin. (B) The isolation and fragmentation of the m/z 1425.05 parent ion resulted in the generation of daughter ions with peaks at m/z 281.36 and 255.35 that have been characterized as oleic acid (C18:1) and palmitic acid (C16:0) using Lipid MS Predict software with an error tolerance set to 0.1 u.m.a. The peak at m/z 79.02 detected in the same experiment corresponds to a phosphate ion. Six additional peaks (m/z 153.11, 311.09, 391.29, 417.33, 491.29 and 831.33) were also detected corresponding to phosphatidyl moieties and the cardiolipin ‘backbone’ (Hsu and Turk, 2006). Altogether, this indicates that the molecular ion corresponds to the cardiolipid species [M-2H+Na]− m/z 1425.05.
Figure 7
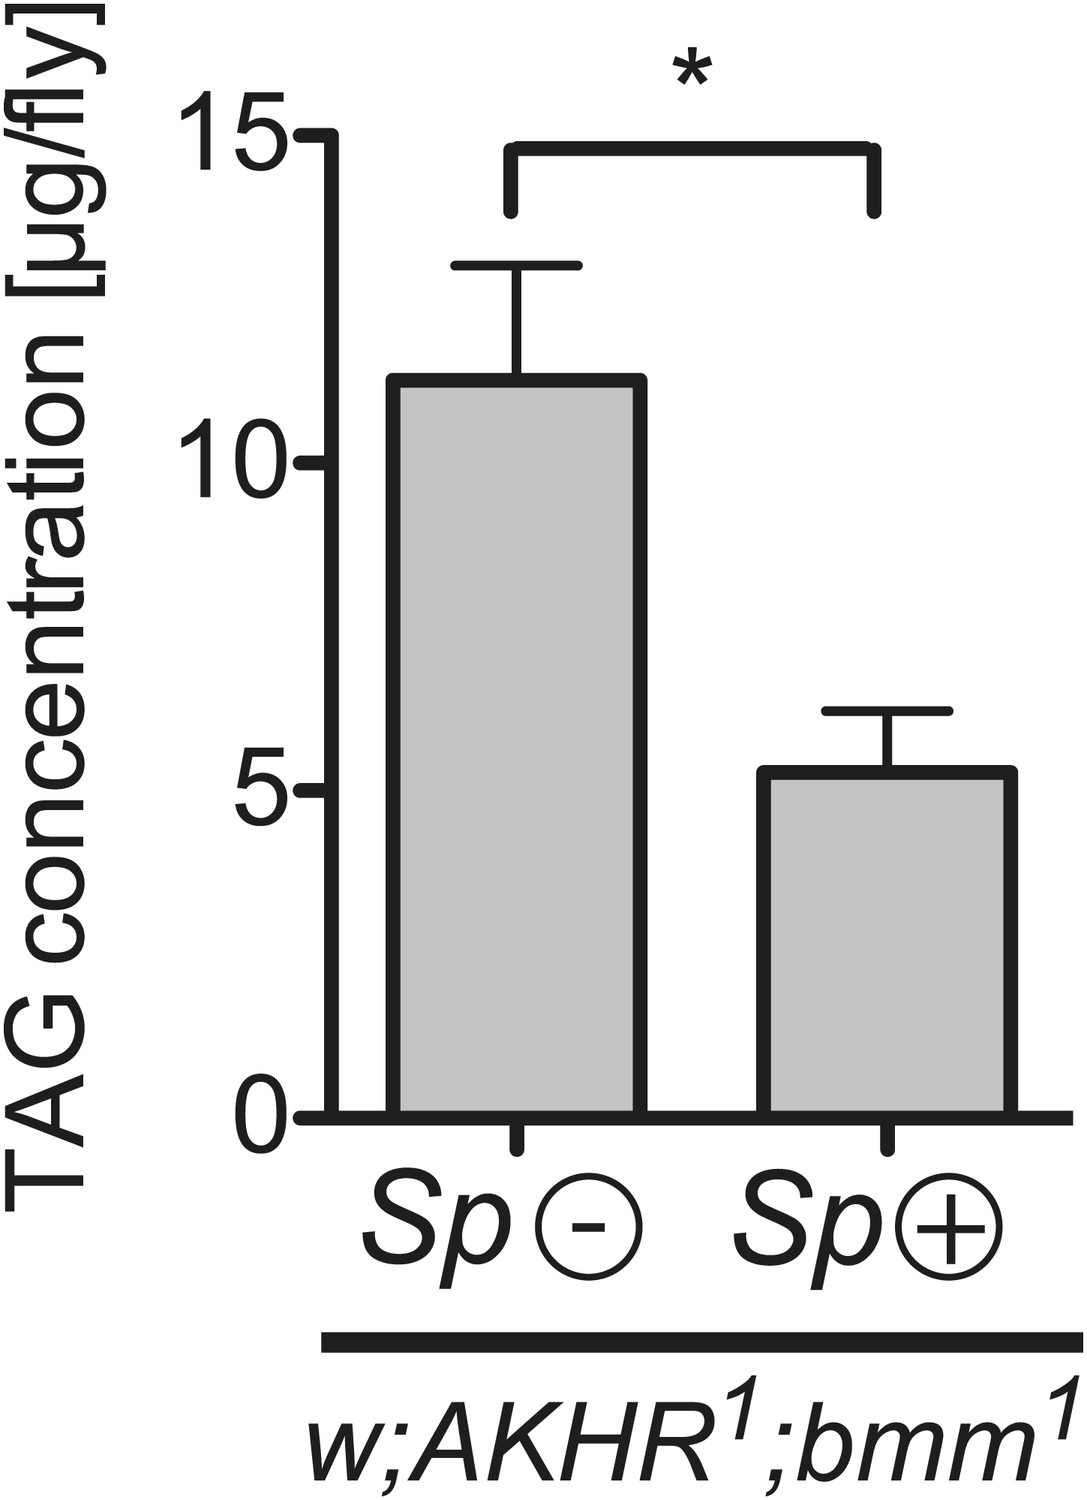
Spiroplasma-induced lipid depletion is not caused by the mobilization of stored lipids.
TAG levels in AKHR1;Bmm1 double mutants that harbor Spiroplasma (AKHR1;Bmm1 Sp (+)) relative to the same genotype without Spiroplasma (AKHR1;Bmm1 Sp (−)). *p<0.0153. Flies were maintained on a rich Drosophila diet for 12 days prior to TAG analysis. Mean ± SEM of three independent experiments is shown.
Figure 8 with 2 supplements
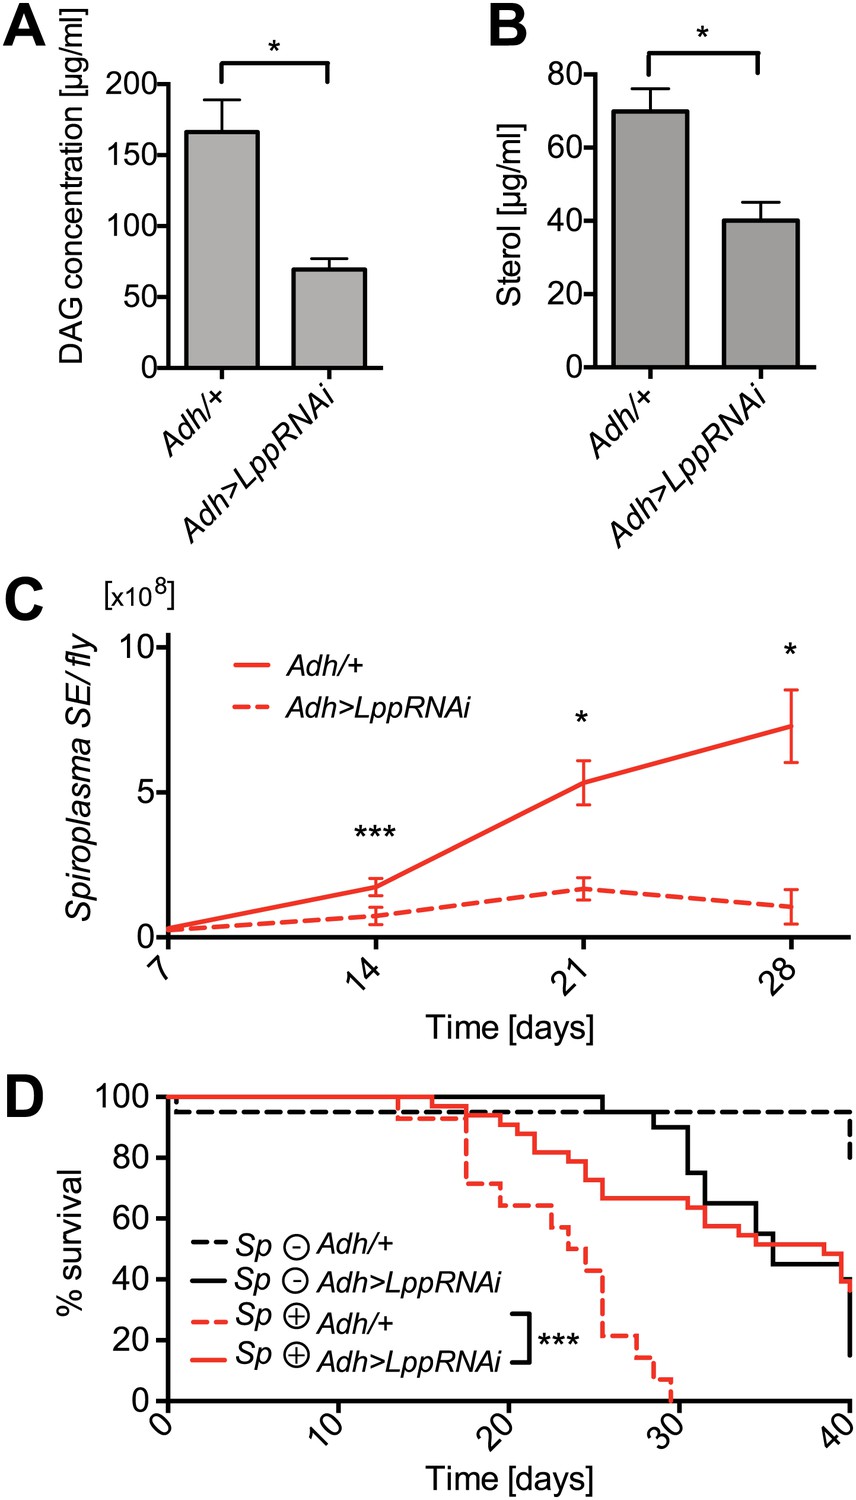
Lpp-lipids are required for Spiroplasma proliferation.
(A) Quantification of DAG levels in hemolymph of 12-day-old flies 8 days after knockdown of Lpp by RNAi. Mean ± SEM of three independent experiments is shown, *p=0.015. (B) Quantification of sterol concentration in hemolymph of 12-day-old flies 8 days after knockdown of Lpp by RNAi. *p=0.0125. Mean ± SEM of three independent experiments is shown. (C) Spiroplasma titers quantified by qPCR in flies which have Lpp expression knocked down by RNAi relative to control flies. Spiroplasma titers were quantified at 7, 14, 21, and 28 days after activation of RNAi. Mean ± SEM of at least three samples is shown (five flies pooled per sample). ***p=0.0005 (14 days), *p<0.01 (21 days), and *p<0.01 (28 days). Shown is one representative experiment out of three independent experiments. (D) The survival of Spiroplasma-infected (Sp (+)) and Spiroplasma-uninfected (Sp (−)) flies with or without RNAi-mediated Lpp knocked down. ***p<0.0001, N = 18 flies per condition. Shown is one representative experiment out of three independent experiments.
Figure 8—figure supplement 1
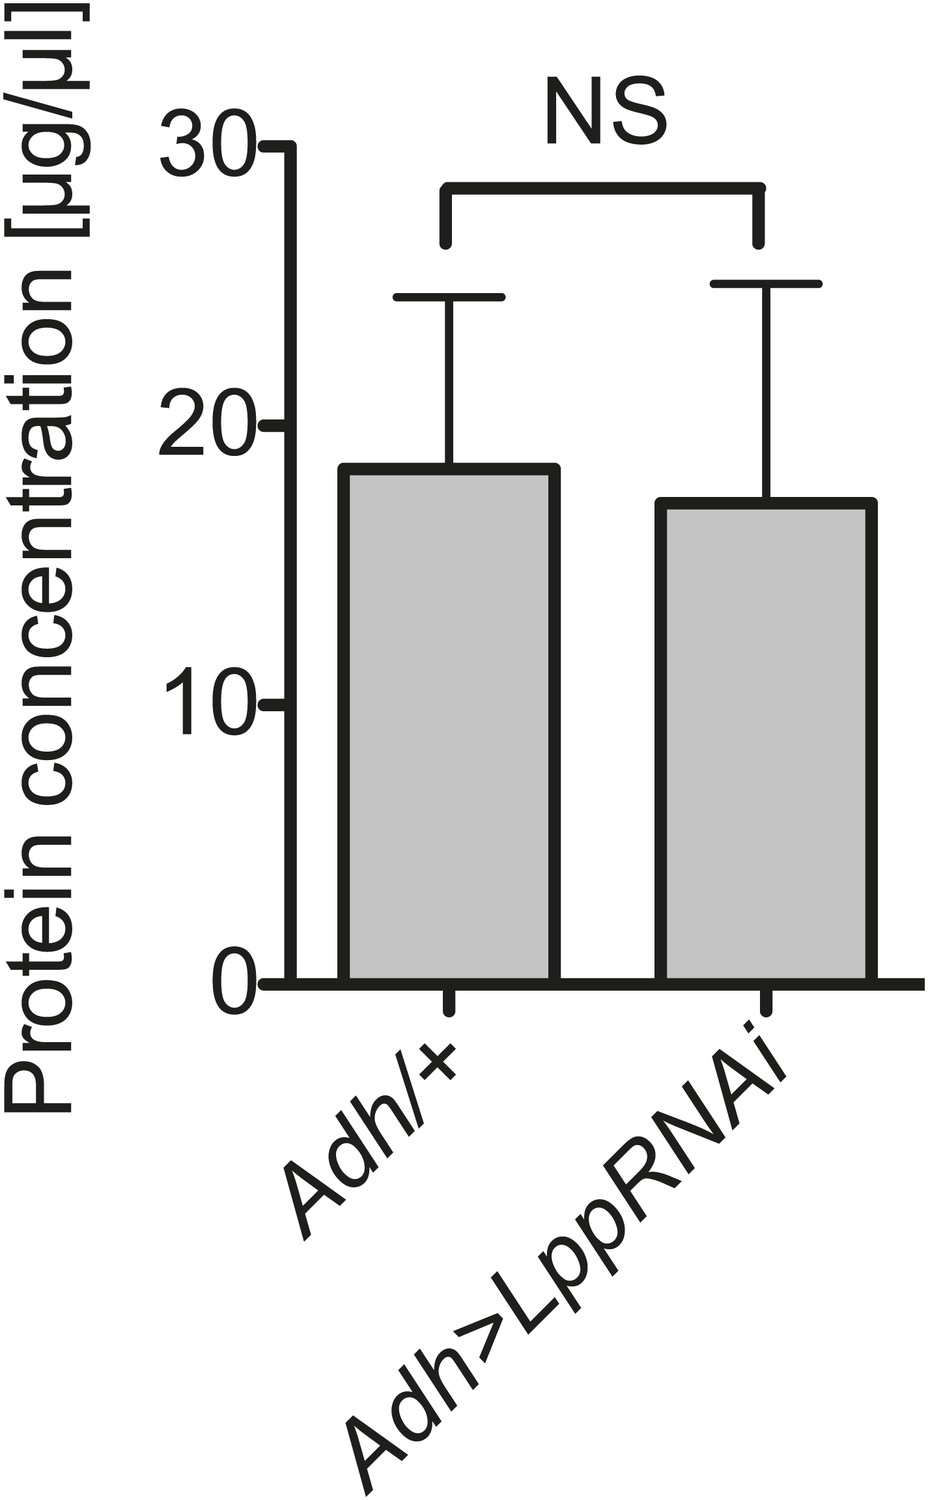
Hemolymph protein is not decreased by Lpp depletion.
Protein concentration in the hemolymph of flies that are 12 days old, 8 days after activation of Lpp-RNAi. NS (p=0.908). Mean ± SEM of three independent experiments is shown.
Figure 8—figure supplement 2
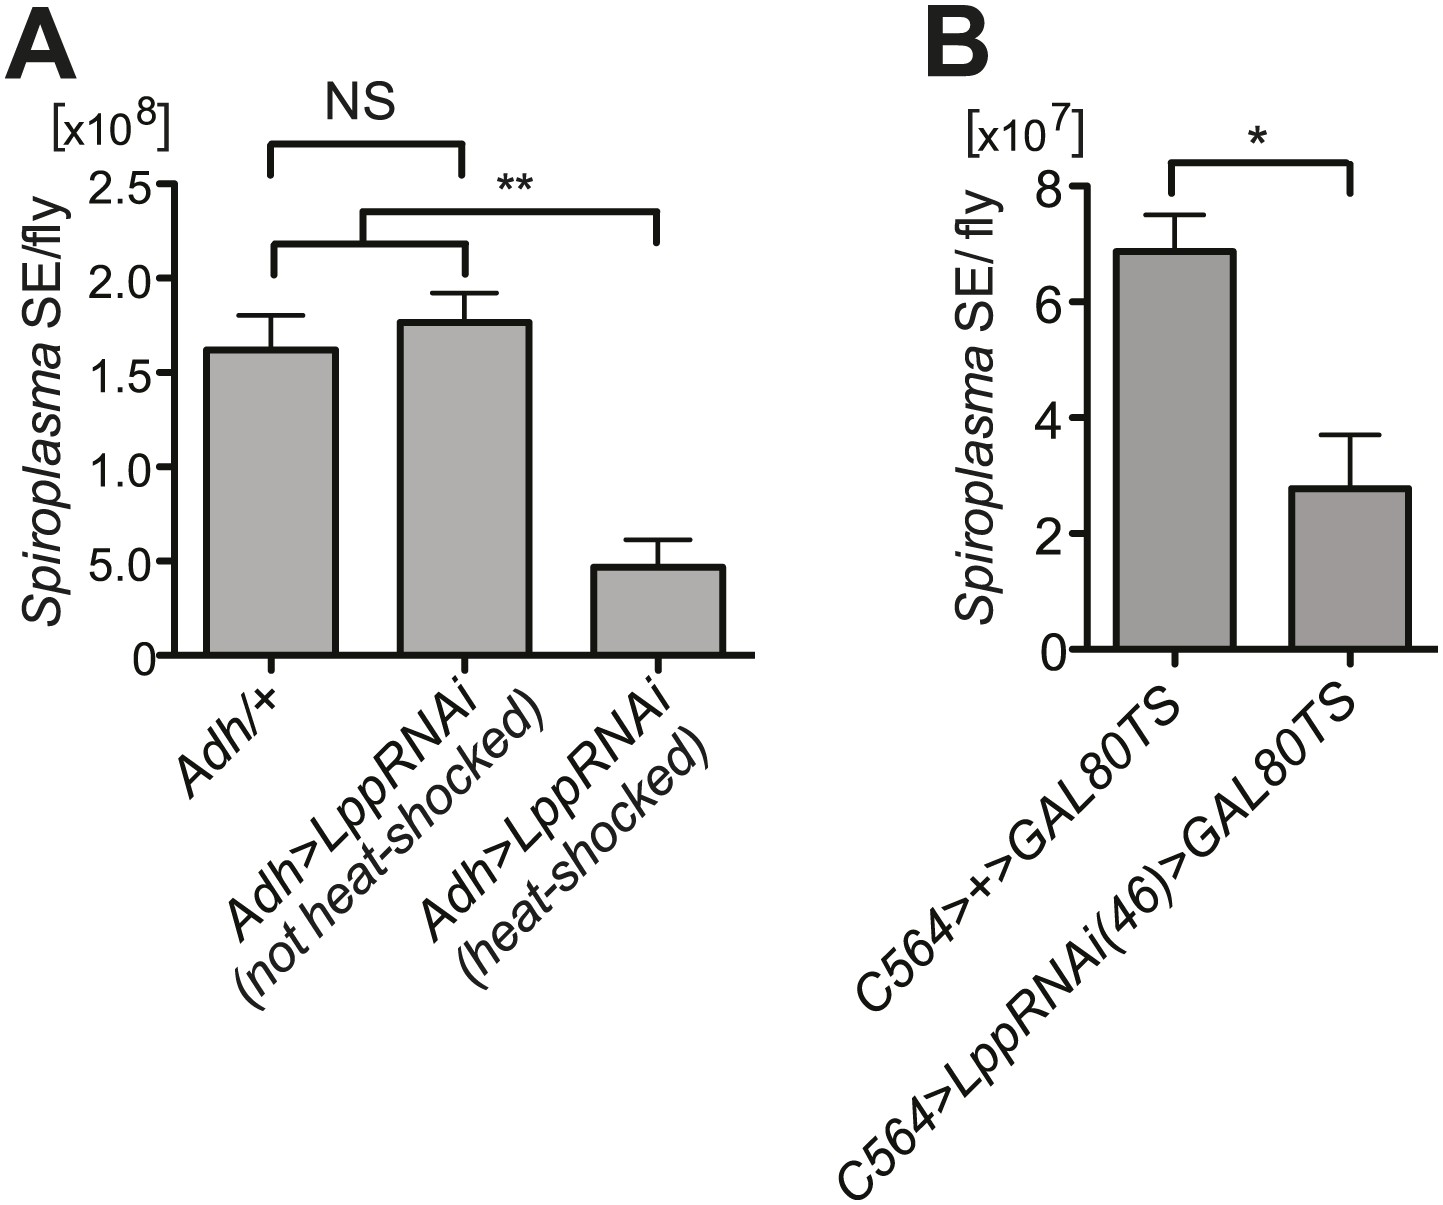
Spiroplasma titers are decreased by Lpp depletion.
(A) Spiroplasma titers quantified by qPCR in flies which have Lpp-RNAi construct which has not been activated by heat shock relative to control flies without the Lpp-RNAi construct, NS (p=0.587), and an additional control where Lpp-RNAi has been activated, **p=0.0037. Spiroplasma titers were quantified at 14 days of fly age. Mean ± SEM of at least three samples is shown (five flies pooled per sample). Shown is one representative experiment out of the three independent experiments. (B) Spiroplasma titers quantified by qPCR in flies in which Lpp has been knocked down by the expression of the UAS-LppRNAi(46) using the C564>gal4TS driver. Flies were raised at the restrictive temperature of 18°C where C564>gal4 activity is repressed by gal80ts and then shifted to 29°C at 4 days post-eclosion (Lpp-RNAi is then activated) where they were maintained for 25 days. *p=0.0215. Mean ± SEM of at least three samples is shown (five flies pooled per sample). Shown is one representative experiment out of the three independent experiments.
Tables
Table 1
Characterization and quantification of hemolymph of DAG species
| Component name | Sp − (µg/ml) | Sp + (µg/ml) | % Of total mass decline |
|---|---|---|---|
| C28:0 DAG | 13.4 | 12.3 | 7 |
| C28:1 DAG | 0.8 | 0.6 | 1.2 |
| C30:2 DAG | 0.7 | 0.5 | 1.2 |
| C30:0 DAG | 0.1 | 0.2 | −1.0 |
| C32:3 DAG | 1.2 | 1.1 | 0.7 |
| C32:2 DAG | 23.1 | 21.8 | 8.2 |
| C32:1 DAG | 19.8 | 15.1 | 30.1 |
| C34:2 DAG | 11.5 | 10.8 | 4.9 |
| C34:1 DAG | 9.7 | 6.9 | 19.3 |
| C34:0 DAG | 1.4 | 0.5 | 5.6 |
| C36:4 DAG | 0.8 | 0.5 | 1.8 |
| C36:3 DAG | 2.9 | 2.2 | 5.3 |
| C36:2 DAG | 4.2 | 2.9 | 9.3 |
| C36:1 DAG | 0.8 | 0.9 | −0.3 |
| C36:0 DAG | 1.7 | 0.7 | 6.9 |
| 92.1 | 77 |
-
Quantification of the absolute concentration of individual DAG species in the hemolymph of Spiroplasma-uninfected (Sp (−)) and Spiroplasma-infected (Sp (+)) mated flies by LC-MS/MS. The % of total mass decline reflects the percentage of the total decline between Spiroplasma-uninfected and infected samples (a total of 15.1 μg/ml or 16.3%) that can be attributed to each DAG species. It is notable that C32:1 and C34:1 DAG species decline to a greater extent than other common DAG species such as C28:0 and C32:2. This suggests that Spiroplasma is preferentially incorporating DAGs that have one saturated and one mono-unsaturated acyl chain. Notably, C34:1 DAGs are likely to be made up of oleic (C18:1) and palmitic (C16:0) acids, which have exactly the same acyl chains that were identified in Spiroplasma-generated cardiolipins (Figure 6B).
Download links
A two-part list of links to download the article, or parts of the article, in various formats.
Downloads (link to download the article as PDF)
Open citations (links to open the citations from this article in various online reference manager services)
Cite this article (links to download the citations from this article in formats compatible with various reference manager tools)
Insect endosymbiont proliferation is limited by lipid availability
eLife 3:e02964.
https://doi.org/10.7554/eLife.02964


