Salmonella Typhi and Salmonella Paratyphi A elaborate distinct systemic metabolite signatures during enteric fever
- Umeå University, Sweden
- The Hospital for Tropical Diseases, Vietnam
- Patan Academy of Health Sciences, Nepal
- Oxford University, United Kingdom
- The London School of Hygiene and Tropical Medicine, United Kingdom
Figures
Figure 1
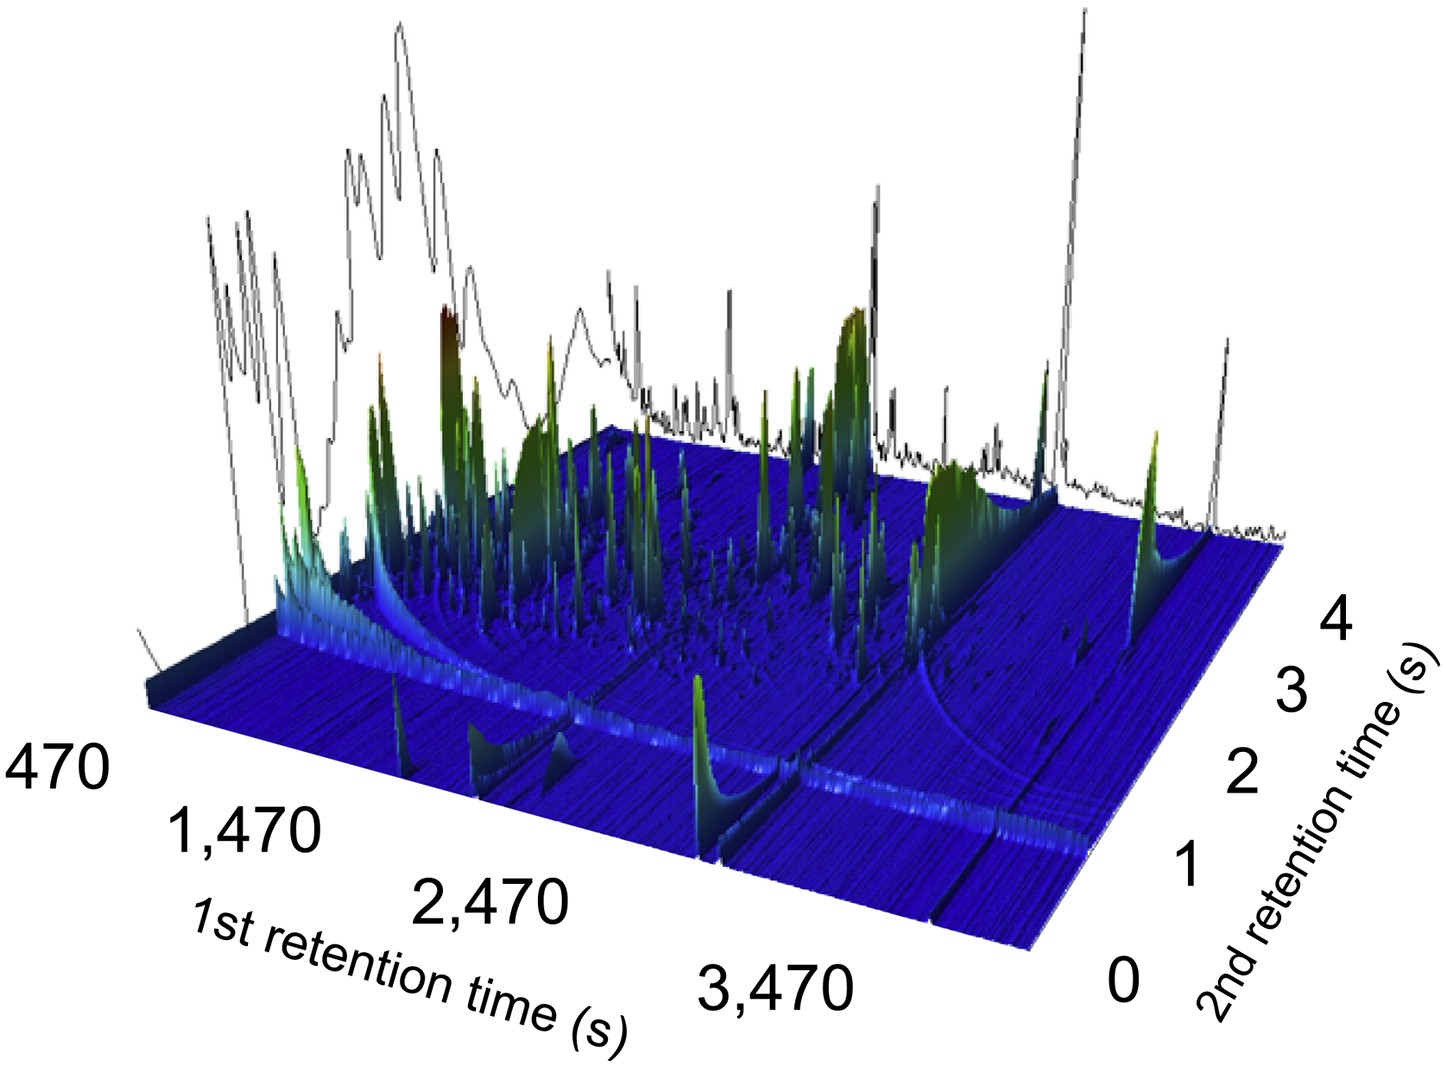
A two-dimensional gas chromatogram mass spectrum of a plasma sample from a patient with enteric fever.
Image shows a two-dimensional ion chromatogram of unprocessed GCxGC/TOFMS data of a plasma sample from a patient with enteric fever. The three-dimensional landscape depicts detected metabolites peaks in the first dimension (seconds–x axis), the second dimension (seconds–y axis), and the concentration intensity of the peak signal (z axis).
Figure 2
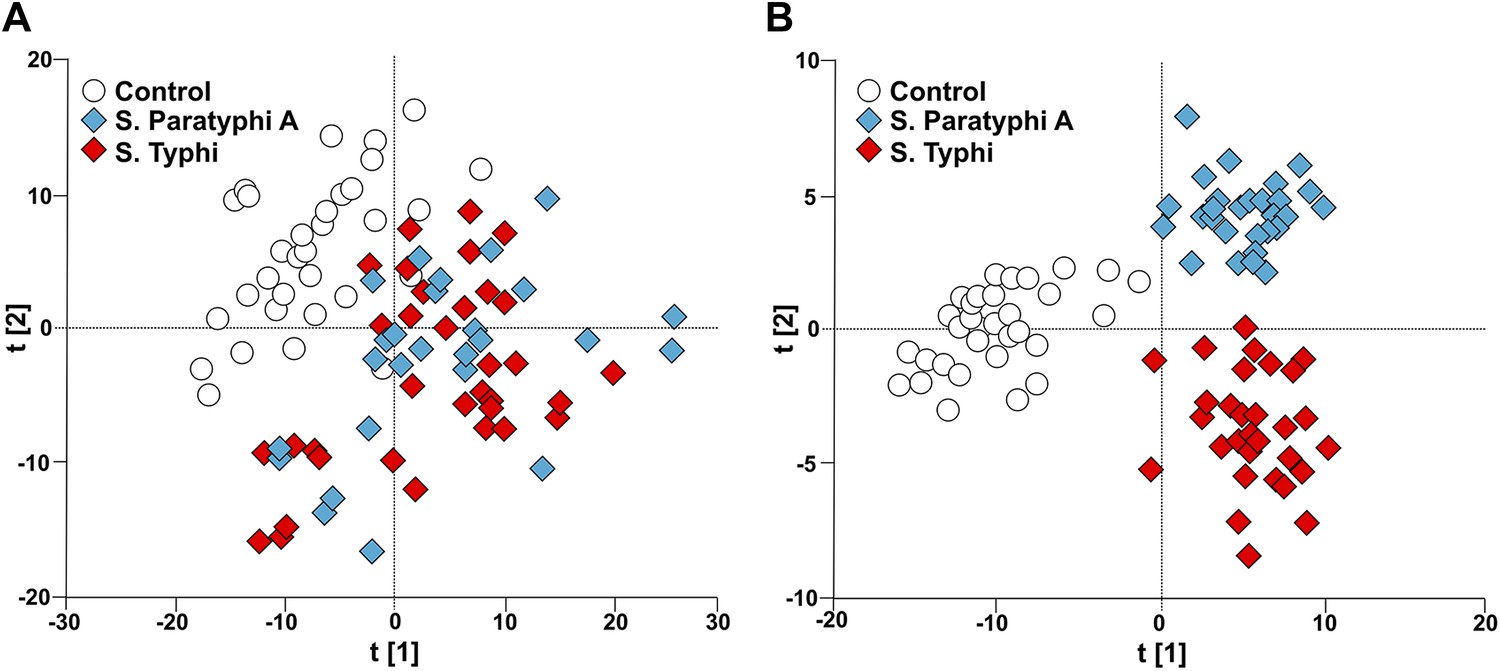
Modeling the variation in the GCxGC/TOFMS data in plasma samples from enteric fever patients and controls.
(A) PCA plot of the first two principal components (t[2] vs t[1]). The PCA plot outlines a separation between the control plasma samples (N = 32; including 7 analytical replicates) and the plasma samples from enteric fever cases (S. Typhi; N = 33 - including 8 analytical replicates, and S. Paratyphi A; N = 29–including 4 analytical replicates). PCA model incorporates 695 metabolites with eight significant principal components (R2X = 0.437, Q2 = 0.255). (B) OPLS-DA scores plot of the two predictive components (tp[2] vs tp[1]; x axis and y axis, respectively) outlining a separation between the control plasma samples (N = 32; including 7 analytical replicates) and the plasma samples from enteric fever cases (S. Typhi; N = 33 - including 8 analytical replicates, and S. Paratyphi A; N = 29 - including 4 analytical replicates). OPLS-DA model includes 695 metabolites with two predictive and two orthogonal components (R2X = 0.269, R2Y = 0.837, Q2 = 0.451, p=1.7 × 10⁻⁶ [CV-ANOVA]).
Figure 3
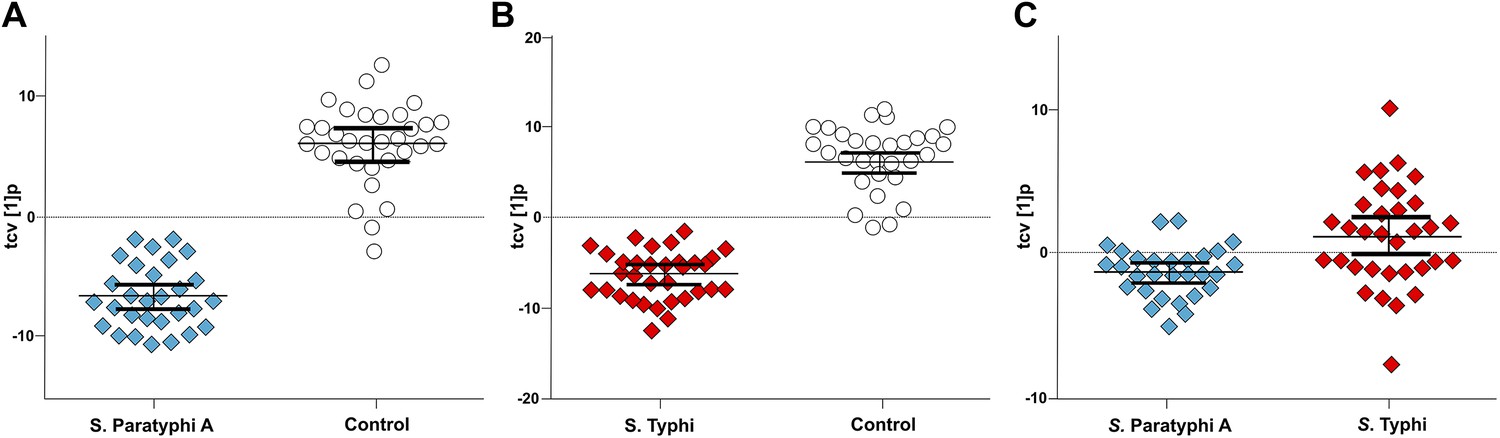
Pairwise OPLS-DA models of GCxGC/TOFMS data in plasma samples from controls, S. Typhi cases, and S. Paratyphi A cases.
Cross-validated OPLS-DA scores plots of the first predictive component (tcv[1]p) showing the separation between; (A) Controls (N = 32, including 7 analytical replicates) and S. Paratyphi A cases (N = 29, including 4 analytical replicates) (p=4.2 × 10⁻¹⁸). (B) Controls and S. Typhi cases (N = 33, including 8 analytical replicates) (p=4.1 × 10⁻²⁰). (C) S. Typhi cases and S. Paratyphi A cases (p=6.7 × 10⁻²). Error bars represent mean score values with 95% confidence intervals. The OPLS-DA model is based on 695 metabolites with one predictive and two orthogonal (A and B), or one predictive and one orthogonal (C) component(s). Additional model information is shown in Table 1.
Figure 4
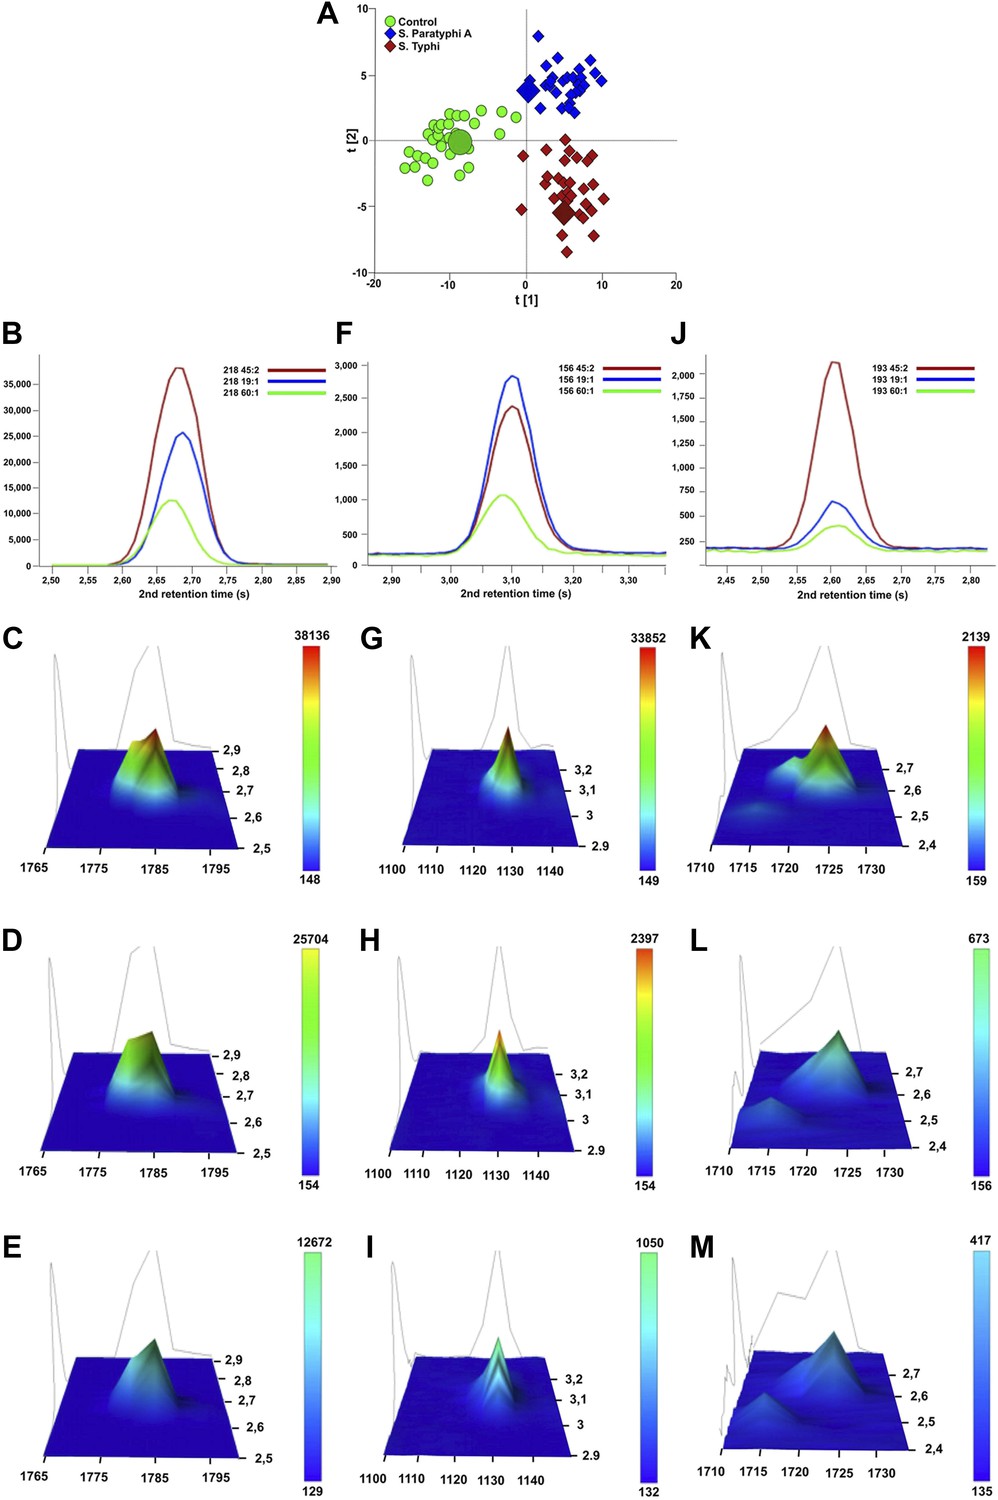
Verification of metabolite signals in plasma samples from a control and patients with S. Typhi and S. Paratyphi A infections.
Three metabolites, in three samples from each sample group that were statistically significant in differentiating between sample classes using pattern recognition modelling, were selected for confirmation using unprocessed chromatographic data. (A) OPLS-DA scores plot (tp[2] vs tp[1]) highlighting the three selected samples (S. Typhi: 45, S. Paratyphi A: 19, and control: 60). Panel B–D show one dimensional chromatographic peaks representing each metabolite from the three unprocessed plasma samples (coloured by sample group). Second dimension retention times (s) are shown along the x-axes and the peak intensities along the y-axes. (B) Phenylalanine (mass: 218, 1st retention time: 1785 s). (C) Pipecolic acid (mass: 156, 1st retention time: 1130 s). (D) 2-phenyl-2-hydroxybutanioc acid (mass: 193, 1st retention time: 1725 s). Panel E–M show the corresponding two dimensional chromatographic peaks with one peak for each sample and metabolite. First and second dimension retention times (s) are shown along the x and y-axes, respectively, and the peak area is shown along the z-axes. The peaks are coloured according to area (colour scale is shown to the right) and the top colour for the two lowest peaks for each metabolite is determined according to the colour scale of the highest peak for the same metabolite. (E, H, K) Phenylalanine for sample 45, 19, and 60, respectively. (F, I, L) Pipecolic acid for sample 19, 4, 5 and 60, respectively. (G, J, M) 2-phenyl-2-hydroxybutanioc acid for sample 45, 19, and 60, respectively.
Figure 5
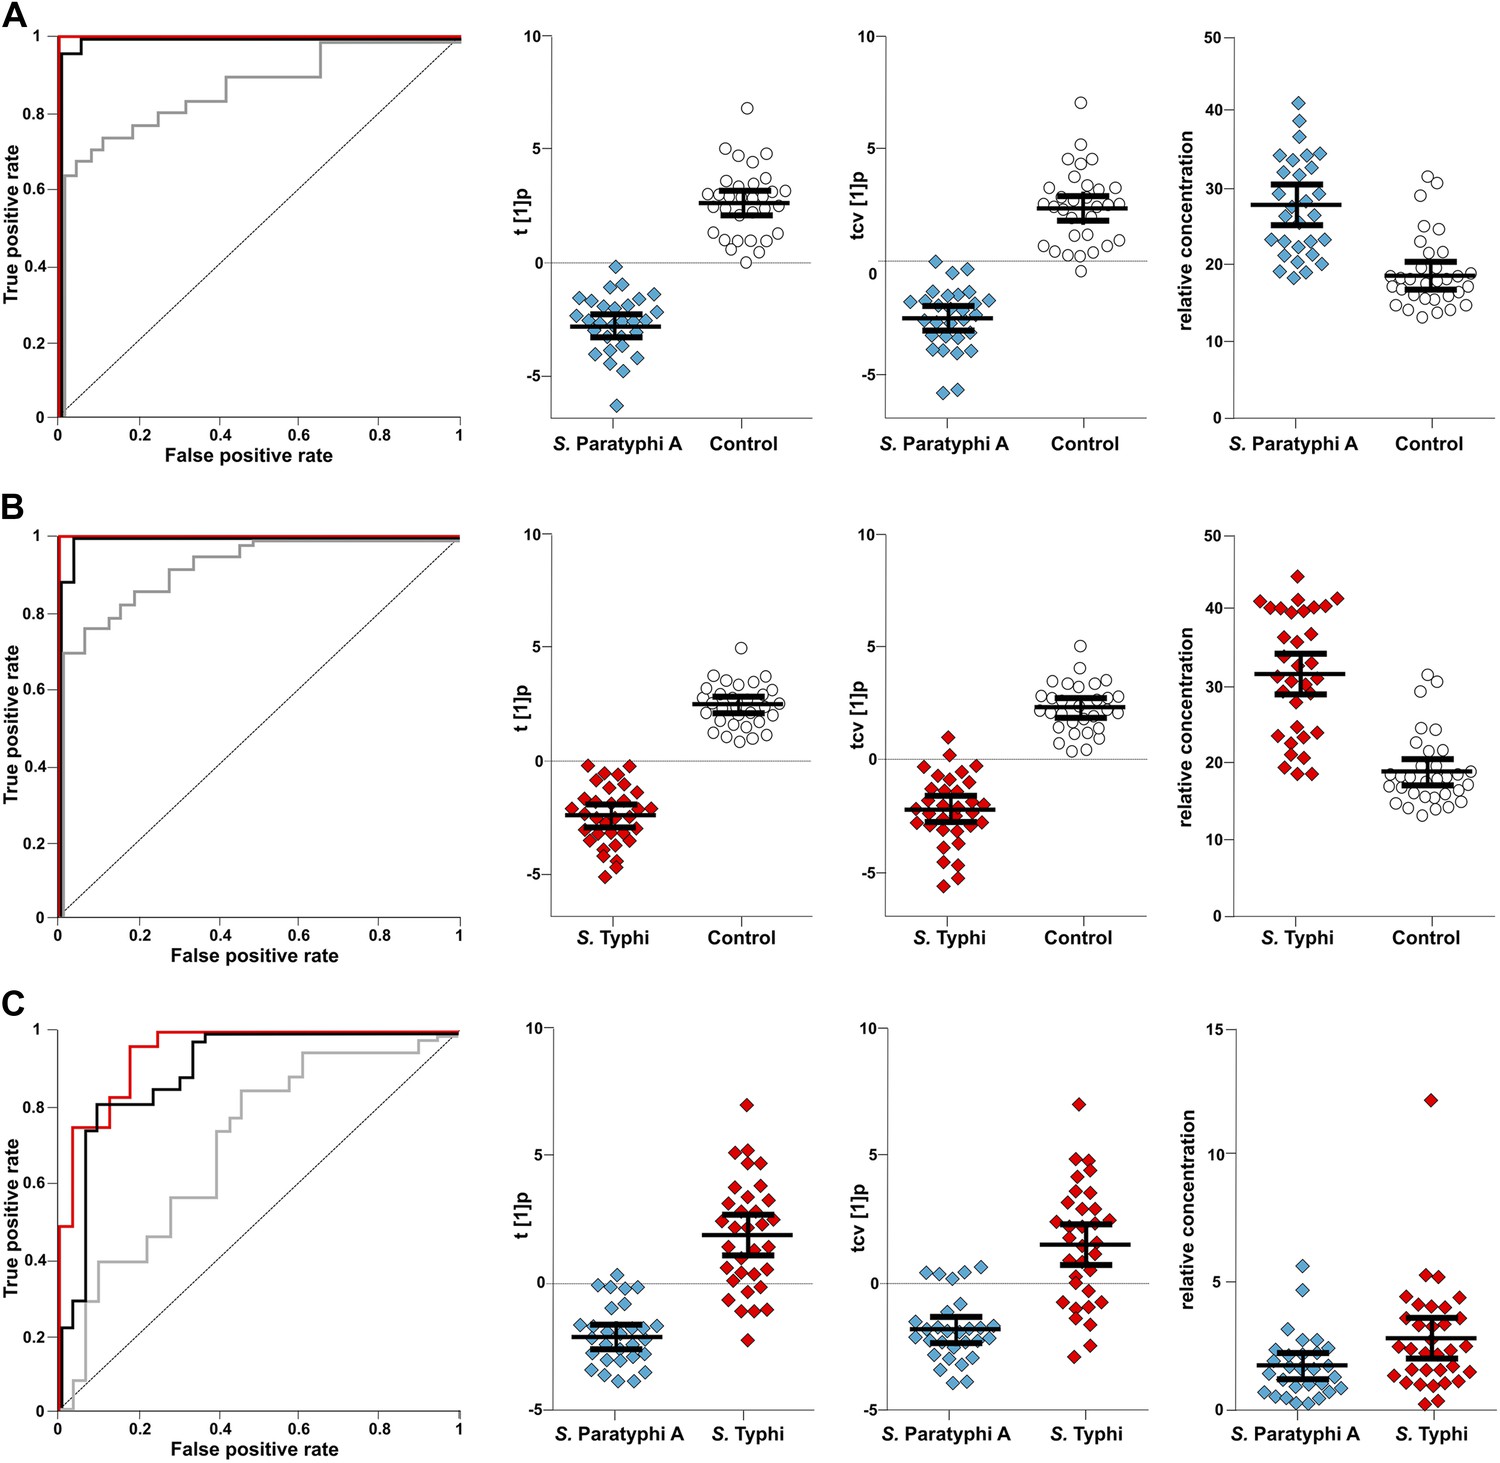
The discriminatory power of 46 metabolites to distinguish between plasma samples from controls, S. Typhi cases, and S. Paratyphi A cases.
Panels on the left show the ROC-curves based on scores (red lines) and cross-validated scores (black lines) from OPLS-DA models using the 46 most statistically significant (S. Typhi against controls and/or S. Paratyphi A against controls) metabolites separating enteric fever samples from control samples and separating S. Typhi samples from S. Paratyphi A samples. The ROC curve showing the best individual discriminating metabolite is shown by the grey line. The scatterplots show pairwise class differences based on scores (t[1]p) (left), cross-validated scores (tcv[1]p) (centre) from OPLS-DA models using the 46 most statistically significant metabolites (as above), and the relative concentration of the best individual discriminating metabolite (right). Data presented for; (A) S. Paratyphi A vs Controls, (AUC scores: 1.0, AUC CV scores: 0.999, AUC best metabolite: 0.884). (B) S. Typhi vs Controls (AUC scores: 1.0, AUC CV scores: 0.996, AUC best metabolite: 0.925). (C) S. Paratyphi A vs S. Typhi (AUC scores: 0.951, AUC CV scores: 0.898, AUC best metabolite: 0.693. Error bars represent mean score values with 95% confidence intervals.
Figure 6
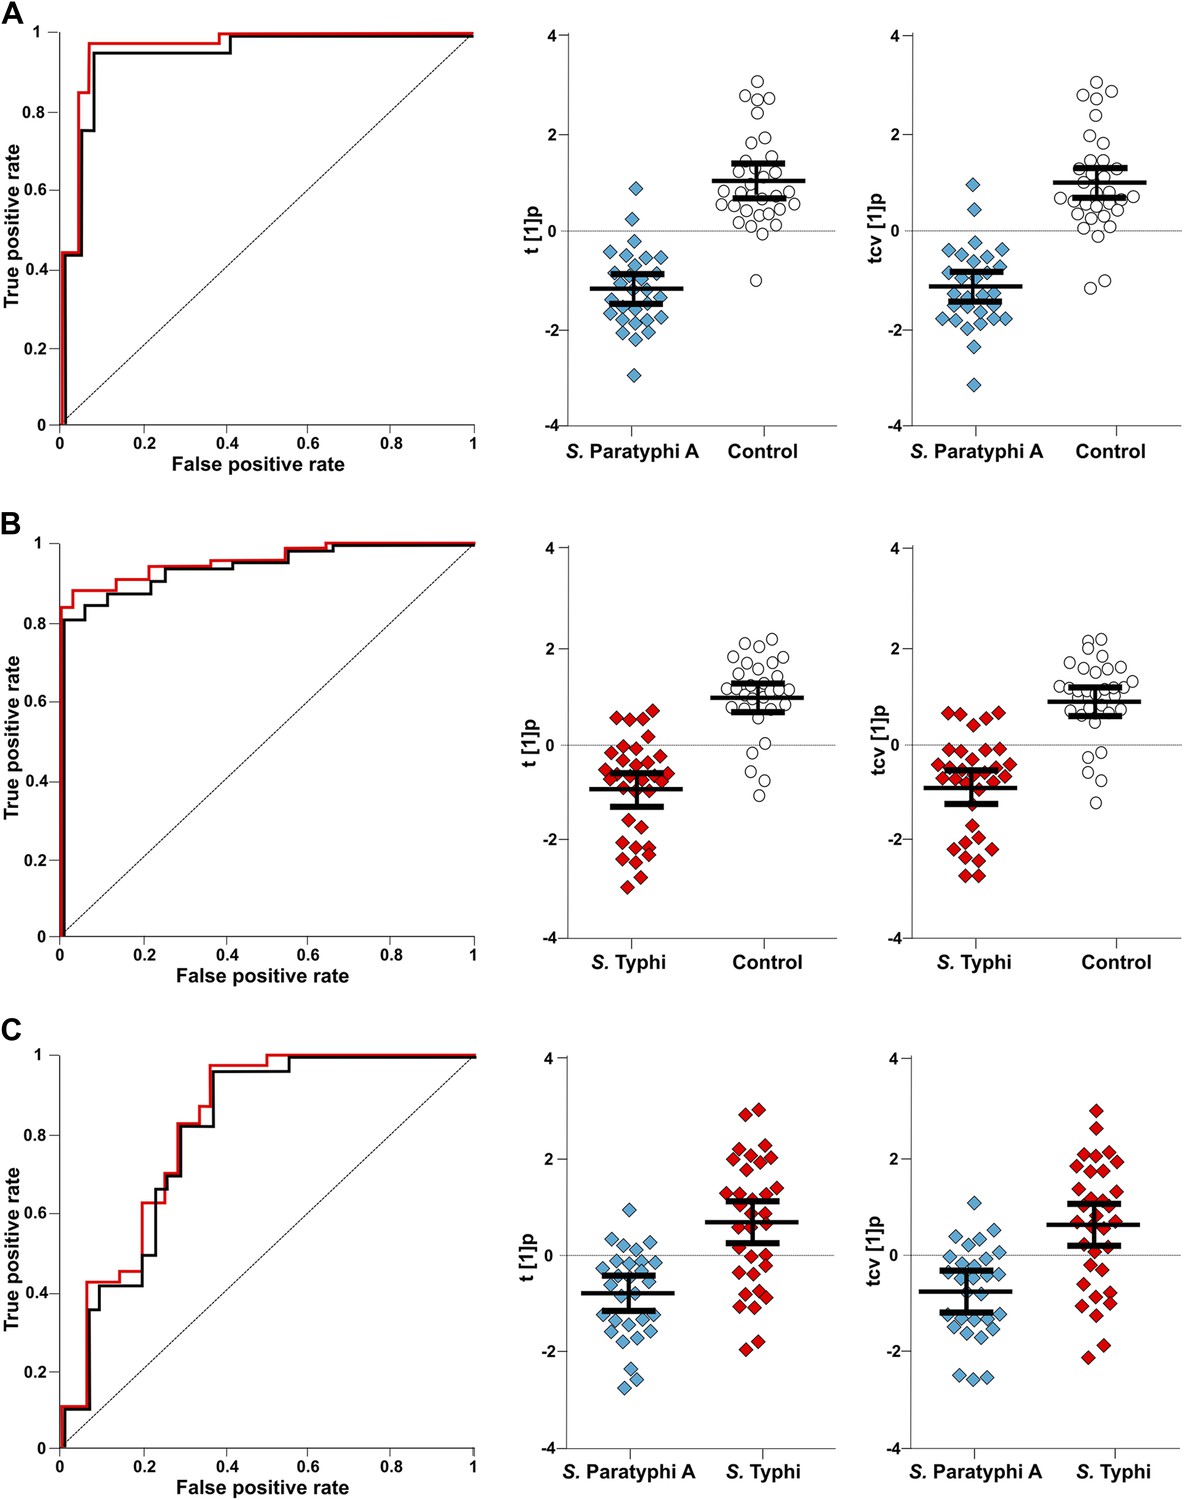
The discriminatory power of six metabolites to distinguish between plasma samples from controls, S. Typhi cases, and S. Paratyphi A cases.
The panels on the left show the ROC-curves based on scores (red lines) and cross-validated scores (black lines) from OPLS-DA models using the six most statistically significant (S. Typhi against controls and/or S. Paratyphi A against controls) metabolites separating enteric fever samples from control samples and separating S. Typhi samples from S. Paratyphi A samples. The scatterplots show pairwise class differences based on scores (t[1]p) (left), cross-validated scores (tcv[1]p) (right) from OPLS-DA models using the 6 most statistically significant metabolites (as above). Data presented for; (A) S. Paratyphi A vs Controls, (AUC scores: 0.964, AUC CV scores: 0.948). (B) S. Typhi vs Controls (AUC scores: 0.934, AUC CV scores: 0.923) and (C) S. Paratyphi A vs S. Typhi (AUC scores: 0.801, AUC CV scores: 0.796). Error bars represent mean score values with 95% confidence intervals.
Tables
Table 1
Multivariate modeling of enteric fever metabolites
| Model * | Number of metabolites included | Number of model components † | R2X ‡ | R2Y ‡ | Q2 ‡ | CV-ANOVA § | AUC scores # | AUC CV scores ¶ |
|---|---|---|---|---|---|---|---|---|
| PCA | 695 | 8 | 0.437 | – | 0.255 | – | – | – |
| S. Paratyphi A, S. Typhi, control | 695 | 2 + 2 | 0.269 | 0.837 | 0.451 | 1.7 × 10⁻⁶ | – | – |
| S. Paratyphi A vs control | 695 | 1 + 2 | 0.261 | 0.961 | 0.815 | 4.2 × 10⁻¹⁸ | 1.0 | 0.997 |
| S. Typhi vs control | 695 | 1 + 2 | 0.251 | 0.965 | 0.824 | 4.1x10⁻²⁰ | 1.0 | 1.0 |
| S. Paratyphi A vs S. Typhi | 695 | 1 + 1 | 0.160 | 0.714 | 0.140 | 6.7 × 10⁻² | 0.996 | 0.735 |
| S. Paratyphi A vs control | 46 | 1 + 1 | 0.416 | 0.794 | 0.718 | 8.8 × 10⁻¹⁵ | 1.0 | 0.999 |
| S. Typhi vs control | 46 | 1 + 1 | 0.305 | 0.823 | 0.749 | 2.2 × 10⁻¹⁷ | 1.0 | 0.996 |
| S. Paratyphi A vs S. Typhi | 46 | 1 + 1 | 0.385 | 0.565 | 0.420 | 2.3 × 10⁻⁶ | 0.951 | 0.898 |
| S. Paratyphi A vs control | 6 | 1 + 1 | 0.543 | 0.627 | 0.567 | 1.2 × 10⁻⁹ | 0.964 | 0.948 |
| S. Typhi vs control | 6 | 1 + 0 | 0.299 | 0.529 | 0.492 | 7.6 × 10⁻¹⁰ | 0.934 | 0.923 |
| S. Paratyphi A vs S. Typhi | 6 | 1 + 0 | 0.318 | 0.300 | 0.253 | 1.8 × 10⁻⁴ | 0.801 | 0.796 |
-
*
All OPLS-DA models apart from the highlighted PCA.
-
†
The number of predictive components followed by the number of orthogonal model components.
-
‡
R2X: The amount of variation in X explained by the model, R2Y: The amount of variation in Y explained by the model, Q2: The amount of variation in Y predicted by the model.
-
§
p-value based on cross-validated scores showing the degree of significance for the separation.
-
#
Area under the curve values from receiver operating curves (ROC) calculated from model scores (t).
-
¶
Area under the curve values from receiver operating curves (ROC) calculated from cross-validated models scores (tcv).
Table 2
Metabolites with discriminatory power for diagnosing enteric fever
| Metabolite * | RT1 † | RT2 † | RI1 † | p-value P vs C | p-value T vs C | p-value P vs T | Change ‡ P vs C | Change ‡ T vs C | Change ‡ P vs T |
|---|---|---|---|---|---|---|---|---|---|
| 2,4-dihydroxybutanoic acid | 1256.4 | 3.22 | 1429.6 | 6.6 × 10⁻³ | 4.9 × 10⁻⁴ | 4.7 × 10⁻² | P | T | T |
| 2-phenyl-2-hydroxypropanoic acid | 1724.9 | 2.61 | 1692.6 | 3.7 × 10⁻² | 1.5 × 10⁻⁴ | 1.6 × 10⁻² | P | T | T |
| 4-methyl-pentanoic acid | 627.6 | 2.40 | 1092.8 | 3.1 × 10⁻² | 5.9 × 10⁻¹ | 1.1 × 10⁻² | P | – | P |
| Cysteine | 1580.0 | 2.96 | 1607.6 | – | 1.7 × 10⁻² | 3.8 × 10⁻² | - | T | T |
| Ethanolamine | 880.0 | 3.88 | 1233.6 | 1.2 × 10⁻³ | – | 7.8 × 10⁻³ | P | – | P |
| Gluconic acid | 1985.0 | 0.16 | 1851.7 | 3.3 × 10⁻² | 1.4 × 10⁻⁴ | 1.2 × 10⁻² | P | T | T |
| Glucose-6-phosphate/Mannose-6-phosphate | 2615.3 | 3.65 | 2303.1 | 6.7 × 10⁻⁴ | 5.9 × 10⁻⁵ | 4.1 × 10⁻² | P | T | T |
| Isoleucine | 1012.2 | 3.32 | 1302.9 | 1.1 × 10⁻² | – | 4.3 × 10⁻² | P | – | P |
| Monosaccharide_137 | 1622.5 | 4.87 | 1633.8 | 6.0 × 10⁻³ | – | 6.1 × 10⁻³ | C | – | T |
| Pentitol-3-desoxy | 1490.0 | 4.22 | 1557.9 | 4.4 × 10⁻⁹ | 5.5 × 10⁻¹³ | 1.1 × 10⁻² | P | T | T |
| Phenylalanine | 1784.1 | 2.68 | 1728.4 | 3.0 × 10⁻⁷ | 1.3 × 10⁻¹⁰ | 2.4 × 10⁻² | P | T | T |
| Pipecolic acid | 1130.0 | 3.10 | 1363.1 | 2.4 × 10⁻⁵ | 2.5 × 10⁻³ | 3.0 × 10⁻² | P | T | P |
| Saccharide_181 | 2529.1 | 3.99 | 2237 | 1.6 × 0−5 | 4.3 × 10⁻² | 2.7 × 10⁻² | C | C | T |
| Serine | 1070.0 | 2.60 | 1332.1 | 1.7 × 10⁻² | – | 4.8 × 10⁻² | P | – | P |
| Unknown_230 | 549.2 | 2.32 | 1036.8 | 1.7 × 10⁻³ | – | 9.5 × 10⁻³ | P | – | P |
| Unknown_231 | 1090.0 | 2.42 | 1342.3 | 2.8 × 10⁻³ | – | 4.3 × 10⁻² | P | – | P |
| Unknown_242 | 1550.0 | 2.94 | 1590.5 | 4.0 × 10⁻⁵ | 1.9 × 10⁻² | 4.4 × 10⁻² | C | C | T |
| Unknown_268 | 1895.0 | 3.64 | 1796.1 | – | 1.1 × 10⁻² | 2.2 × 10⁻² | – | T | T |
| Unknown_270 | 626.4 | 3.90 | 1093.1 | 1.7 × 10⁻² | – | 3.2 × 10⁻³ | P | – | P |
| Unknown_281 | 680.0 | 3.38 | 1124.1 | 2.7 × 10⁻³ | – | 3.1 × 10⁻² | P | – | P |
| Unknown_294 | 725.1 | 2.18 | 1148.5 | 2.1 × 10⁻³ | – | 1.7 × 10⁻² | P | – | P |
| Unknown_303 | 1900.0 | 2.57 | 1798.5 | 9.1 × 10⁻³ | 1.5 × 10⁻⁴ | 2.0 × 10⁻² | P | T | T |
| Unknown_334 | 2790.0 | 2.15 | 2443.5 | 1.9 × 10⁻⁵ | 2.8 × 10⁻⁸ | 7.8 × 10⁻³ | P | T | T |
| Unknown_341 | 523.5 | 2.21 | 1018.4 | 2.5 × 10⁻³ | – | 2.7 × 10⁻² | P | – | P |
| Unknown_364 | 775.1 | 2.25 | 1176.3 | 6.8 × 10⁻³ | – | 2.3 × 10⁻² | P | – | P |
| Unknown_377 | 961.1 | 2.43 | 1275.6 | 1.9 × 10⁻³ | – | 3.1 × 10⁻⁴ | P | – | P |
| Unknown_384 | 1010.1 | 2.48 | 1301.4 | 4.9 × 10⁻³ | – | 2. × 10−2 | P | – | P |
| Unknown_397 | 1144.9 | 2.75 | 1370.6 | 2.1 × 10⁻² | – | 2.8 × 10⁻² | P | – | P |
| Unknown_467 | 1550.4 | 2.92 | 1590.7 | 1.6 × 10⁻⁴ | 2.4 × 10⁻² | 4.7 × 10⁻² | C | C | T |
| Unknown_470 | 1570.0 | 4.02 | 1602.4 | 2.3 × 10⁻² | – | 1.9 × 10⁻² | C | – | T |
| Unknown_490 | 1660.6 | 2.27 | 1654.6 | – | 1.1 × 10⁻³ | 2.1 × 10⁻² | – | T | T |
| Unknown_495 | 1695.0 | 3.26 | 1675.4 | 2.9 × 10⁻⁵ | 2.3 × 10⁻⁶ | 2.0 × 10⁻² | P | T | T |
| Unknown_547 | 1995.0 | 2.33 | 1859.6 | – | 1.2 × 10⁻² | 3.1 × 10⁻² | – | T | T |
| Unknown_604 | 2349.5 | 3.27 | 2102.0 | 1.9 × 10⁻² | – | 3.6 × 10⁻² | P | – | P |
| Unknown_637 | 2560.7 | 3.99 | 2261.3 | 8.9 × 10⁻⁶ | 4.5 × 10⁻³ | 4.0 × 10⁻² | C | C | T |
| Unknown_638 | 2561.3 | 2.67 | 2260.7 | – | 3.2 × 10⁻³ | 7.7 × 10⁻³ | – | T | T |
| Unknown_676 | 2870.0 | 3.28 | 2511.6 | 1.9 × 10⁻⁷ | 2.5 × 10⁻³ | 4.0 × 10⁻² | C | C | T |
| Unknown_681 | 2938.1 | 2.75 | 2570.3 | 6.6 × 10⁻⁴ | – | 5.3 × 10⁻³ | C | – | T |
| Unknown_745 | 770.0 | 3.17 | 1174.0 | 1.6 × 10⁻³ | – | 3.1 × 10⁻² | P | – | P |
| Unknown_798 | 855.0 | 2.36 | 1219.7 | 4.6 × 10⁻³ | – | 1.0 × 10⁻² | P | – | P |
| Unknown_811 | 1445.0 | 2.93 | 1532.2 | 3.0 × 10⁻² | 3.6 × 10⁻⁴ | 2.5 × 10⁻² | P | T | T |
| Unknown_914 | 3194.9 | 2.61 | 2802.5 | – | 1.1 × 10⁻³ | 3.2 × 10⁻² | – | C | P |
| Unknown_949 | 2661.8 | 2.07 | 2339.1 | 7.1 × 10⁻⁶ | 1.9× 10⁻⁹ | 1.3× 10⁻² | P | T | T |
| Unknown_961 | 2065.4 | 2.71 | 1905.4 | 2.8× 10⁻² | 6.6× 10⁻⁴ | 2.2× 10⁻² | P | T | T |
| Unknown_963 | 1045.1 | 2.32 | 1319.1 | 1.3× 10⁻⁵ | 3.6× 10⁻⁵ | 4.0× 10⁻² | P | T | P |
| Unknown_981 | 2748.2 | 2.05 | 2408.5 | 1.8× 10⁻⁴ | 4.9× 10⁻⁸ | 2.1× 10⁻² | P | T | T |
-
*
Metabolites with statistically significant differences in two or three pairwise comparisons according to univariate p-values (≤0.05) and covariance loadings w* (<|0.03|). T vs C; S. Typhi vs control, P vs T; S. Paratyphi A vs S. Typhi and P vs C; S. Paratyphi A vs controls.
-
†
RT1; 1st dimension retention time (s), RT2; 2nd dimension retention time (s), RI1; 1st dimension retention index.
-
‡
Change in metabolite concentration for each of the pairwise comparisons where P indicates higher concentration in S. Paratyphi A samples, T indicates a higher concentration in S. Typhi samples, and C indicates a higher concentration in control samples.
Additional files
-
Supplementary file 1
Statistically significant metabolites in pairwise comparisons.
- https://doi.org/10.7554/eLife.03100.011
Download links
A two-part list of links to download the article, or parts of the article, in various formats.
Downloads (link to download the article as PDF)
Open citations (links to open the citations from this article in various online reference manager services)
Cite this article (links to download the citations from this article in formats compatible with various reference manager tools)
Salmonella Typhi and Salmonella Paratyphi A elaborate distinct systemic metabolite signatures during enteric fever
eLife 3:e03100.
https://doi.org/10.7554/eLife.03100


