Ecology and evolution of viruses infecting uncultivated SUP05 bacteria as revealed by single-cell- and meta-genomics
- University of Arizona, United States
- University of British Columbia, Canada
- U.S Department of Energy Joint Genome Institute, United States
- Bigelow Laboratory for Ocean Sciences, United States
Figures
Figure 1 with 3 supplements
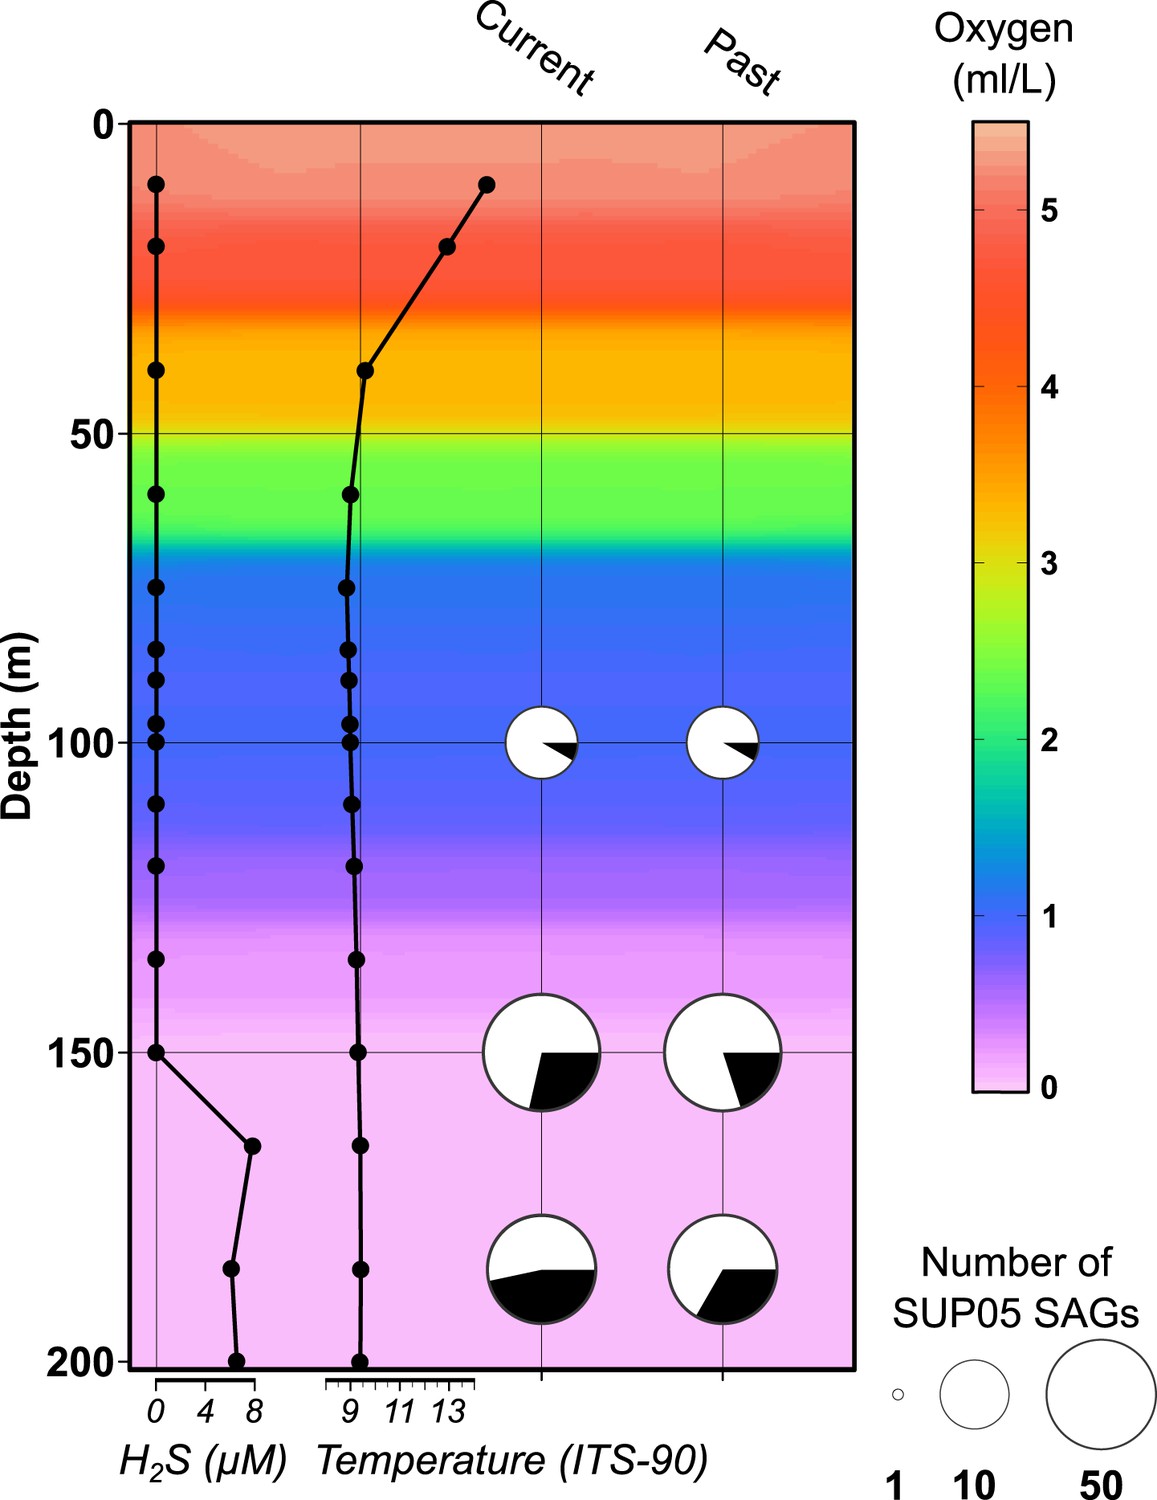
Saanich Inlet water column characteristics and SUP05 infection frequency on the SAG sampling date (August 2011).
Key abiotic measurements are represented as background coloring (oxygen levels) and black lined graphs at left (hydrogen sulfide and temperature). SUP05 viral infections determined from 127 SAGs are indicated at right by black slices in pie charts where current infections were delineated from intact viral contigs and past infections were inferred from identification of defective prophages and CRISPR loci.
-
Figure 1—source data 1
Number of SUP05 viral sequences detected at the three different depths sampled.
For each depth, the count of SAG where viral sequence were detected (‘infected’ SAG) is indicated, alongside the number of SAGs for which two different viruses were retrieved, the number of SAGs with CRISPR spacer detected and the number of SAGs with a defective prophage identified.
- https://doi.org/10.7554/eLife.03125.004
Figure 1—figure supplement 1
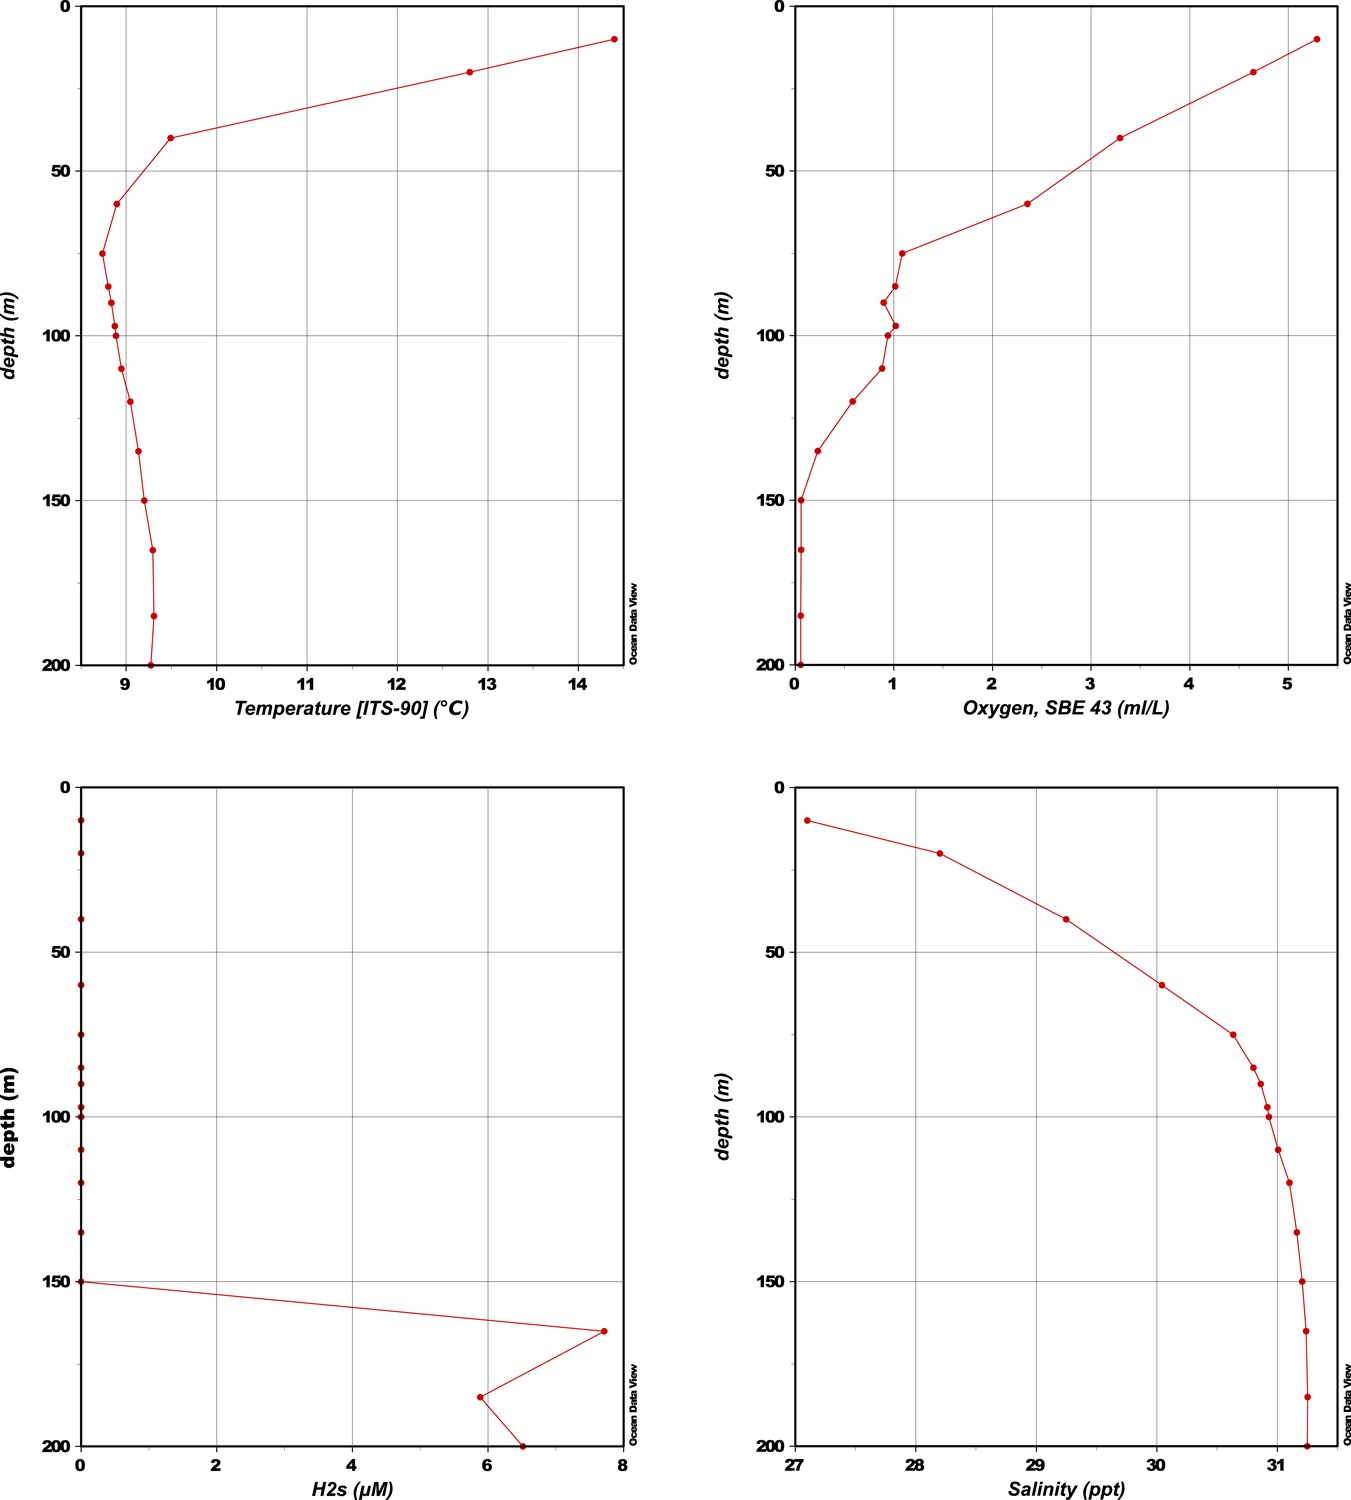
CTD measurements of oxygen concentration, temperature, salinity, and H2S concentration in the water column of Saanich Inlet at the time of sampling (August 2011).
https://doi.org/10.7554/eLife.03125.005
Figure 1—figure supplement 2
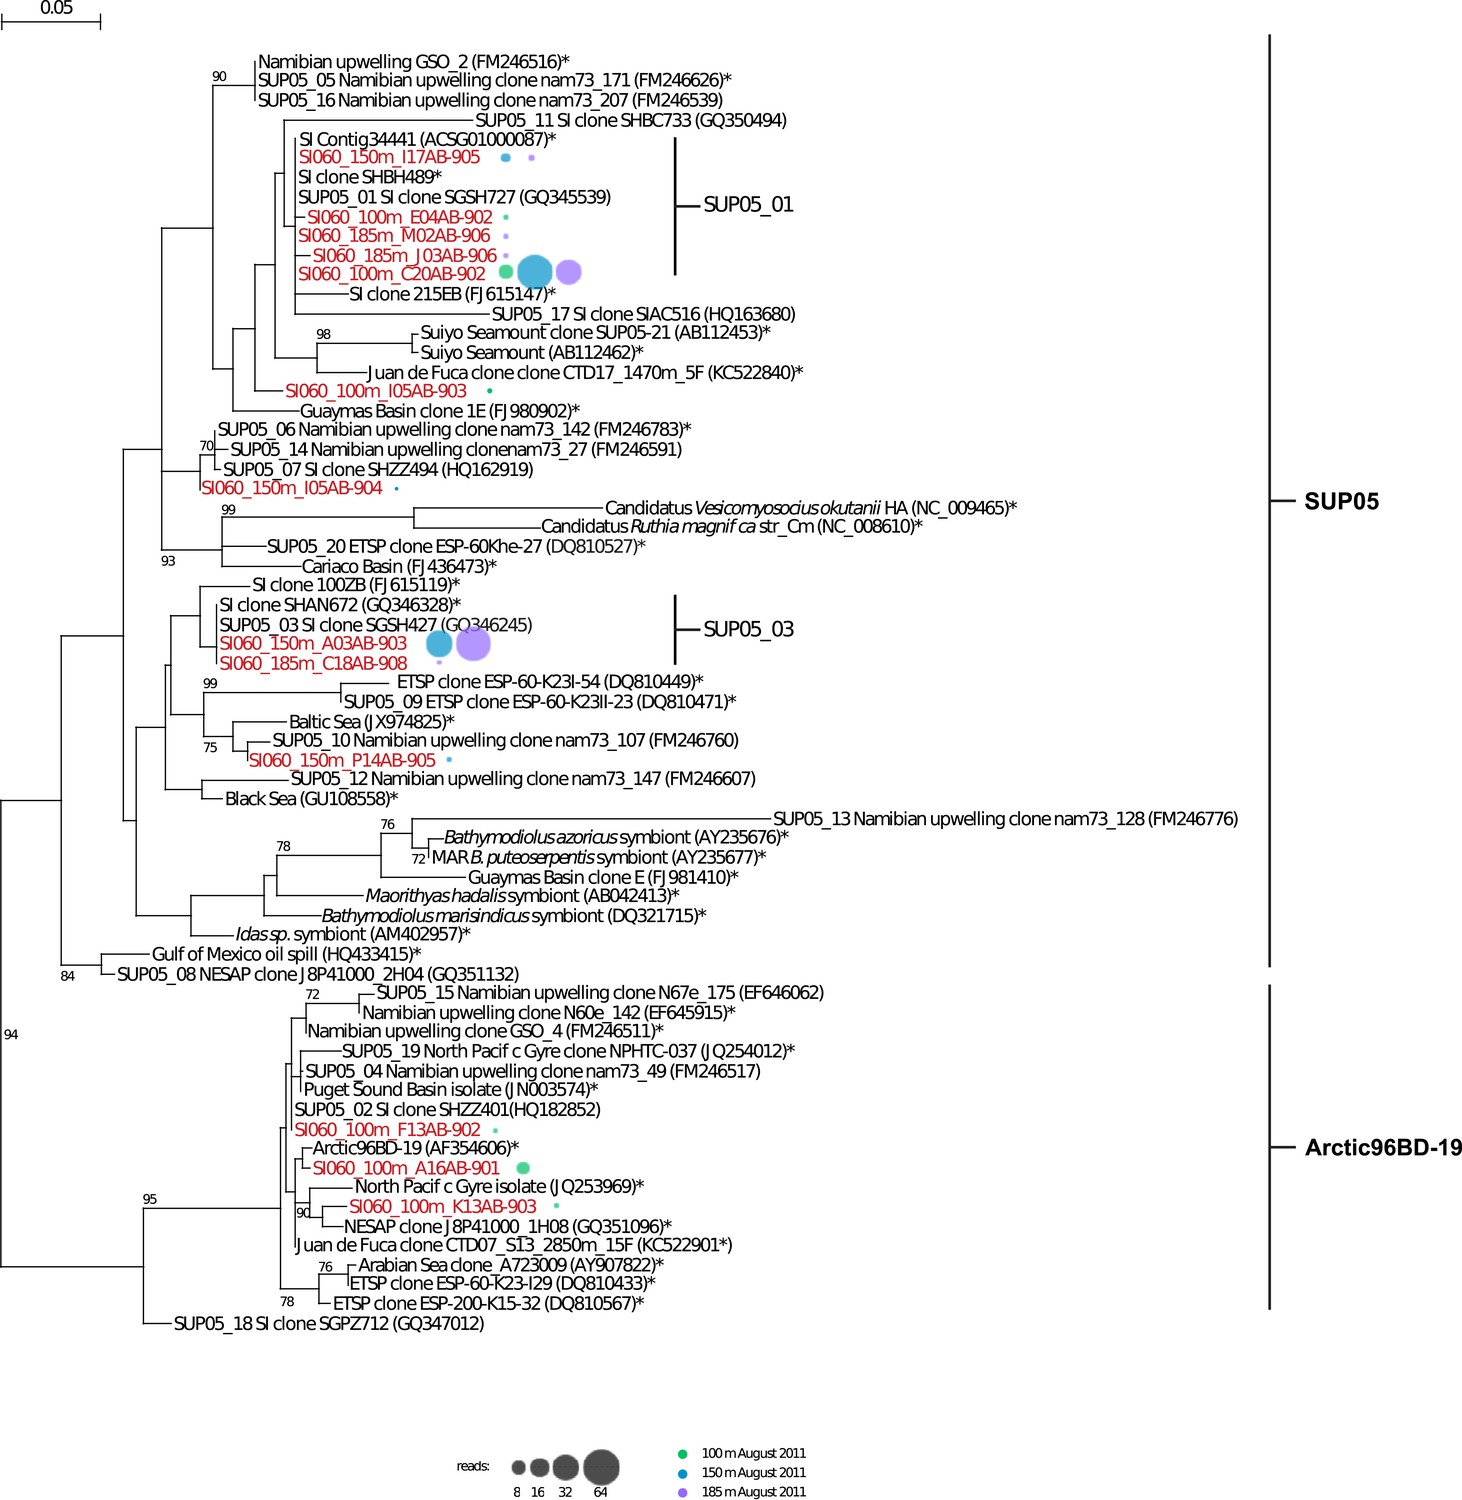
Phylogenetic tree of SUP05 and Arctic96BD-19 lineages based on comparative SSU ribosomal RNA gene analysis.
The tree was inferred using maximum-likelihood implemented in PHYML. The percentage (≥70%) of replicates in which the associated taxa clustered together in the bootstrap test (1000 replicates) is shown next to the branches. Reference sequences for both lineages are marked with a star. Representative sequences for SUP05 and Arctic96BD-19 clusters are labeled ‘SUP05_cluster number’ followed by the name of the sequence according to NCBI. SAG representative sequences are shown in red, SAG sequences distribution with depth is represented by colored circles (100 m: green, 150 m: blue, 200 m: purple) whose circumference indicated the total number of SAG sequences (reads) within the cluster.
Figure 1—figure supplement 3
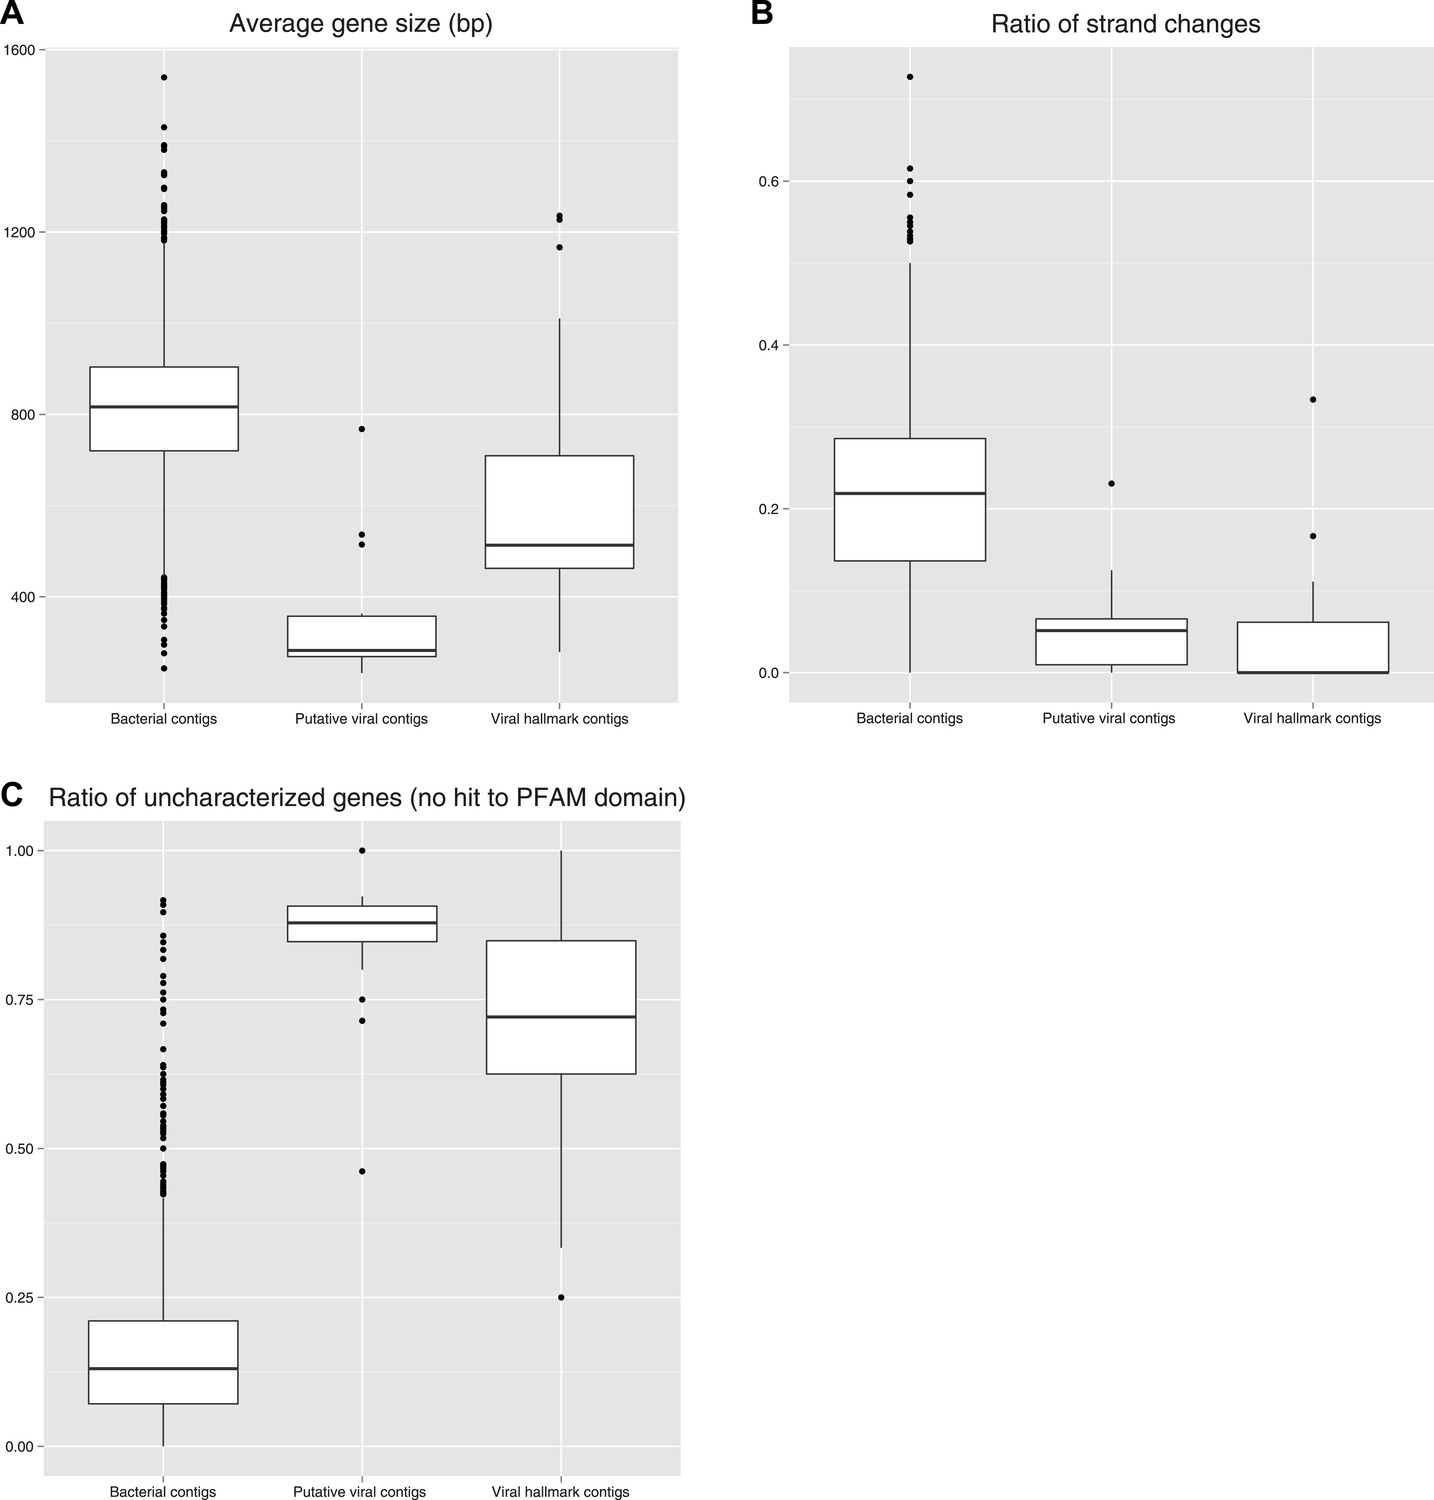
Metrics measured on SUP05 SAG contigs classified as ‘Microbial’, ‘Viral hallmark contigs’ (Supplementary file 1 A, B, C) and ‘Putative viral contigs’ (Supplementary file 1 D).
For each set of contigs, the distribution of average gene size (A), ratio of strand changes (number of strand changes between two consecutive genes divided by the total number of genes on the contig, B), and ratio of uncharacterized genes (number of genes with no significant hit in PFAM database divided by the total number of genes on the contig, C) are displayed.
Figure 2 with 3 supplements
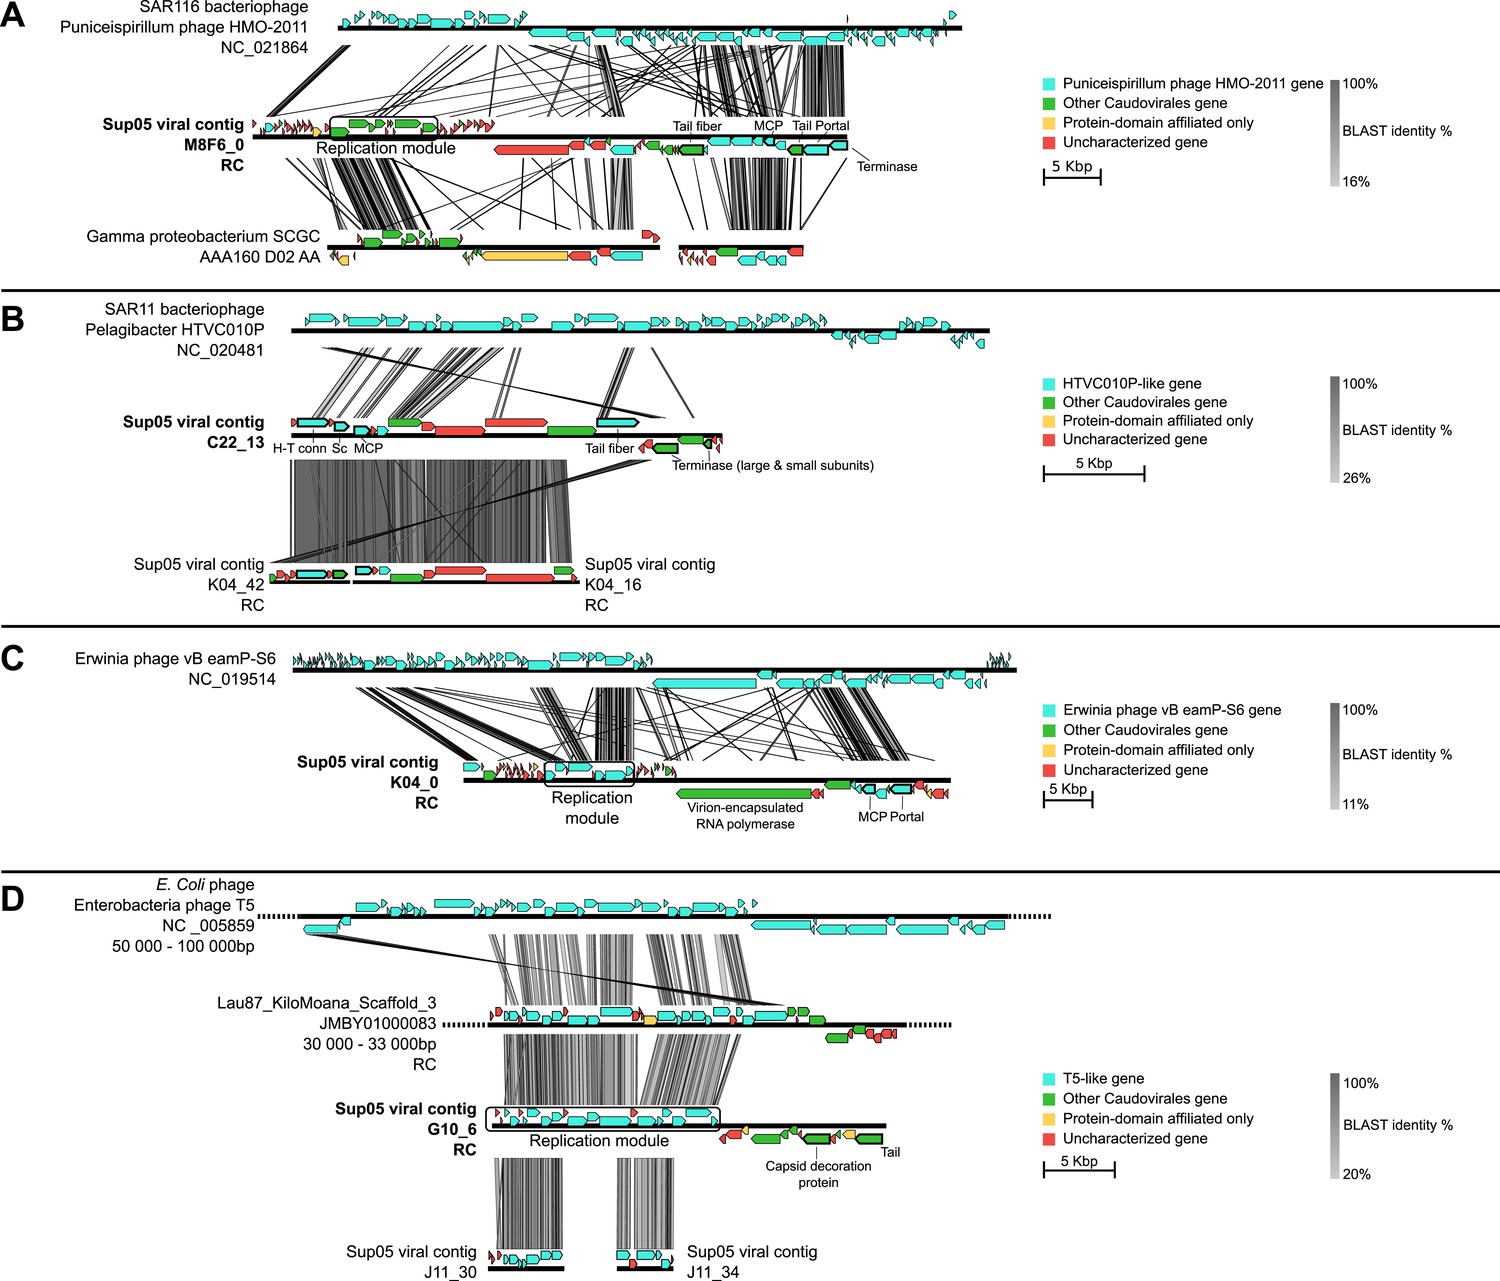
Genetic map and synteny plots for the four references SUP05 Caudovirales contigs M8F6_0 (A), C22_13 (B), K04_0 (C) and G10_6 (D) (highlighted in bold).
Viral hallmark genes are underlined and identified on plots (MCP: major capsid protein, Sc: scaffolding protein, H-T conn.: head-tail connector). Sequence similarities were deduced from a tBLASTx comparison. For clarity sake, several sequences including SUP05 viral contig M8F6_0, K04_0, and G10_6 are reverse-complemented (noted RC).
-
Figure 2—source data 1
Summary of best BLAST hit affiliation for the predicted genes of the five SUP05 reference viral contigs.
For each contig, taxonomic and functional affiliation are indicated with the group or category and the number of genes affiliated to this group. The category ‘virion formation’ includes all genes associated to the formation of the capsid and the genome encapsidation.
- https://doi.org/10.7554/eLife.03125.009
Figure 2—figure supplement 1
Phylogenetic tree of SUP05 Podoviridae contigs, derived from major capsid protein sequences with PhyML (maximum-likelihood tree, LG model, CAT approximation of gamma parameter).
All SUP05 contigs affiliated to the Podoviridae and harboring the major capsid protein gene are included in the tree and highlighted in bold. The three SUP05 Podoviridae reference contigs (longer than 15 kb) are noted with a star. SH-like branch supports are indicated on the tree, and all branches with a support lower than 0.5 were collapsed.
Figure 2—figure supplement 2
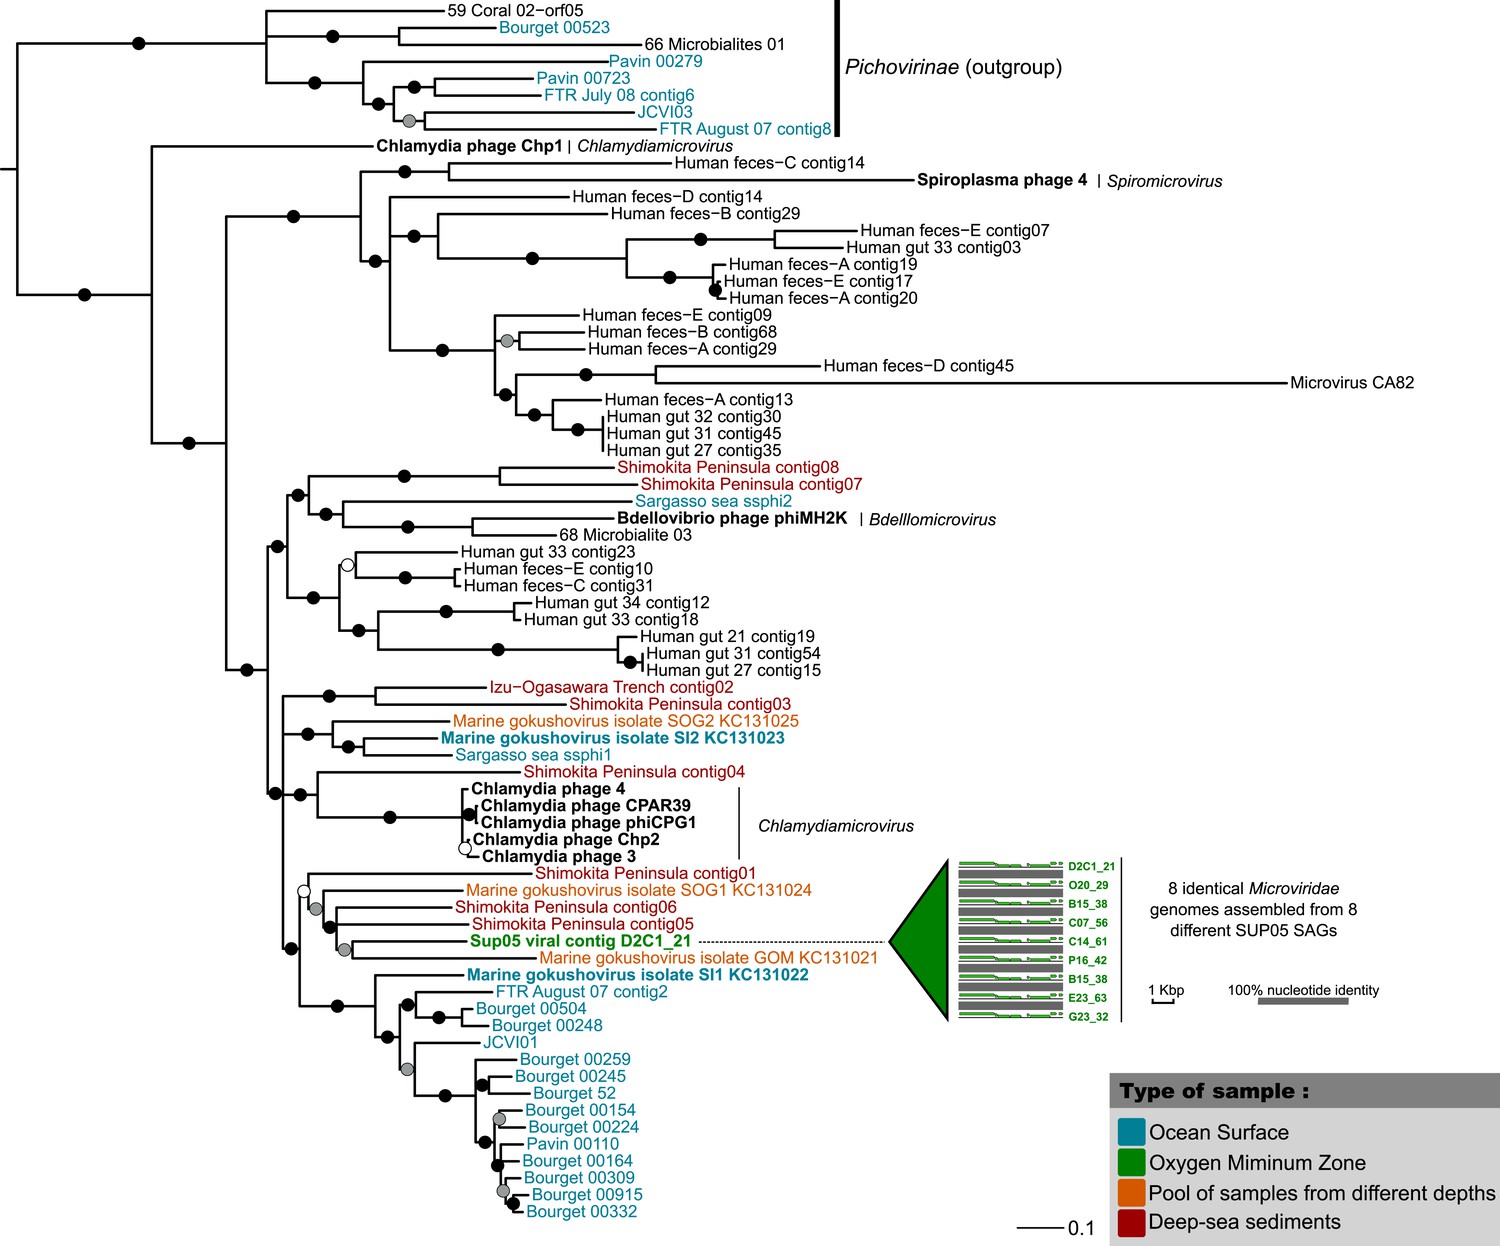
Phylogenetic tree for the SUP05 Microviridae (major capsid protein).
Tree was computed with PhyML (maximum-likelihood tree, LG model, gamma parameter estimated with CAT approximation), and SH-like supports are indicated for each branch. All branches with support lower than 0.50 were collapsed. The tree is focused around the Gokushovirinae subfamily and includes the Pichovirinae subfamily as an outgroup. Aquatic Gokushovirinae are colored according to their type of sample, and Saanich Inlet sequences are highlighted in bold. Cultivated Gokushovirinae are noted in black and highlighted in bold, with the associated genus associated in italic. All the other sequences are non-cultivated and currently affiliated to ‘Unclassified Gokushovirinae’.
Figure 2—figure supplement 3

Genetic map and synteny plots for the SUP05 Microviridae reference.
Viral hallmark genes are labeled on the plot. Associated sequence ‘Marine Gokushovirus isolate SOG1-KC131024’ was sampled from Strait of Georgia (Labonté and Suttle 2013b), on which the Saanich Inlet fjord is opening.
Figure 3 with 3 supplements
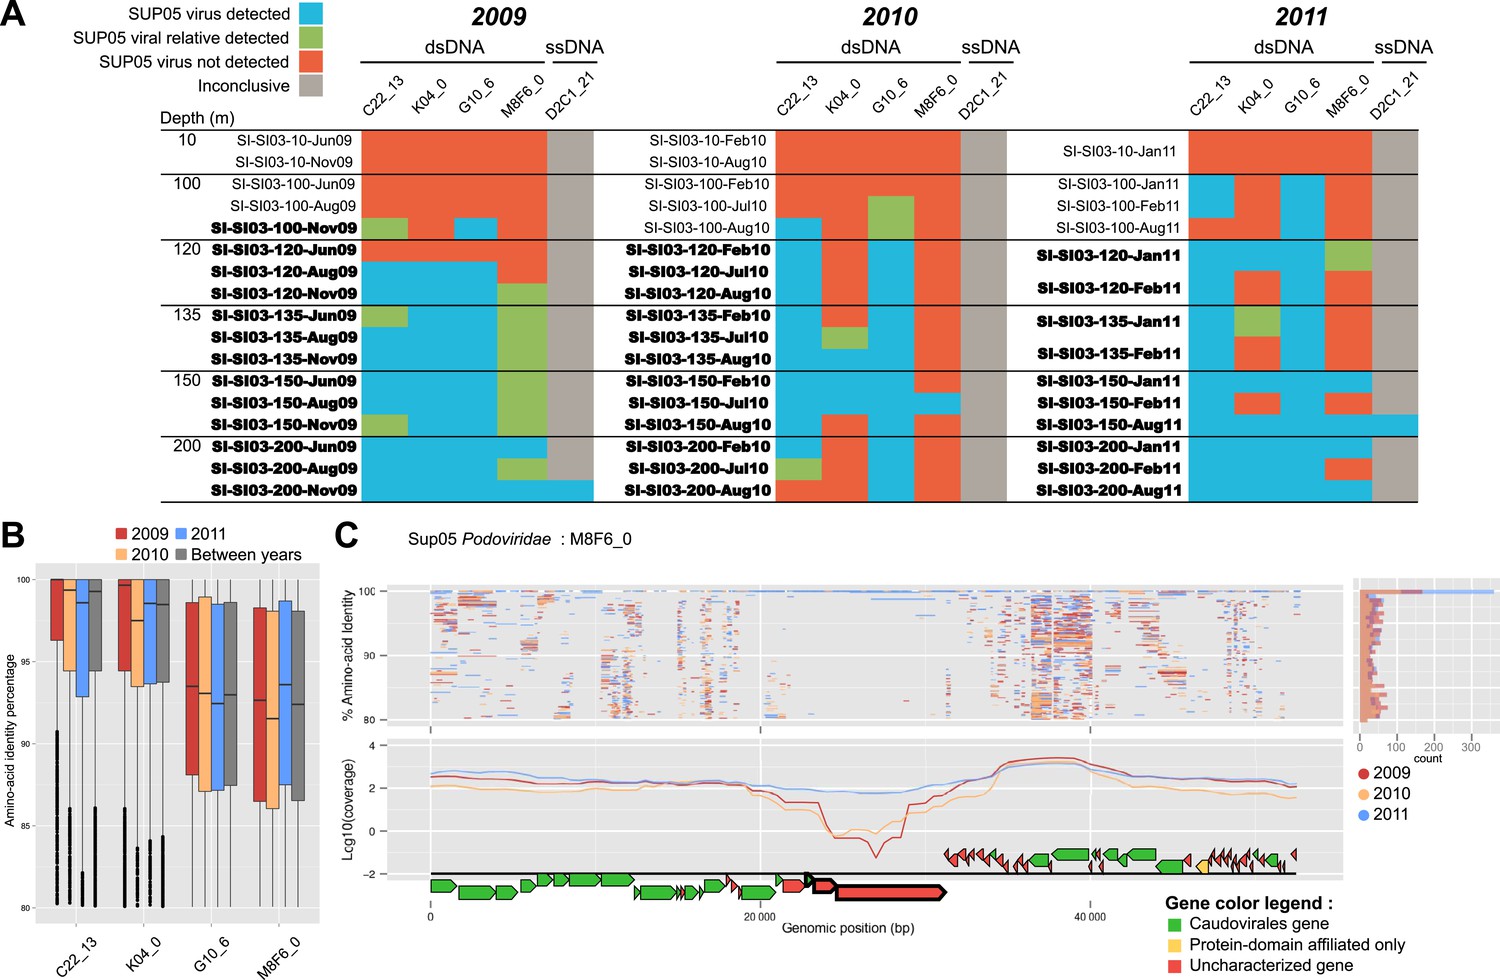
Spatiotemporal dynamics of SUP05 viral reference genomes in Saanich Inlet.
(A) SUP05 viral presence in Saanich Inlet microbial metagenomes with OMZ sample names bolded. Four categories indicate the SUP05 virus was detected (>75% of viral genes detected at >80% amino-acid identity; light blue), a SUP05 viral relative was detected (>75% of viral genes detected at 60–80% amino-acid identity; light green), no SUP05 virus was detected (red) or detection was inconclusive (e.g., Microviridae in HiSeq Illumina data sets that strongly select against ssDNA sequences; gray). (B) SUP05 viral reference genomes had differing sequence conservation among recruited metagenomic reads. Upper and lower ‘hinges’ correspond to the first and third quartiles (the 25th and 75th percentiles), while outliers are displayed as points (values beyond 1.5 * Inter-Quartile Range of the hinge). (C) One SUP05 viral reference genome with low sequence conservation revealed evolution in action whereby a genomic region (see ∼21–30 kb) appears to sweep through the population.
Figure 3—figure supplement 1
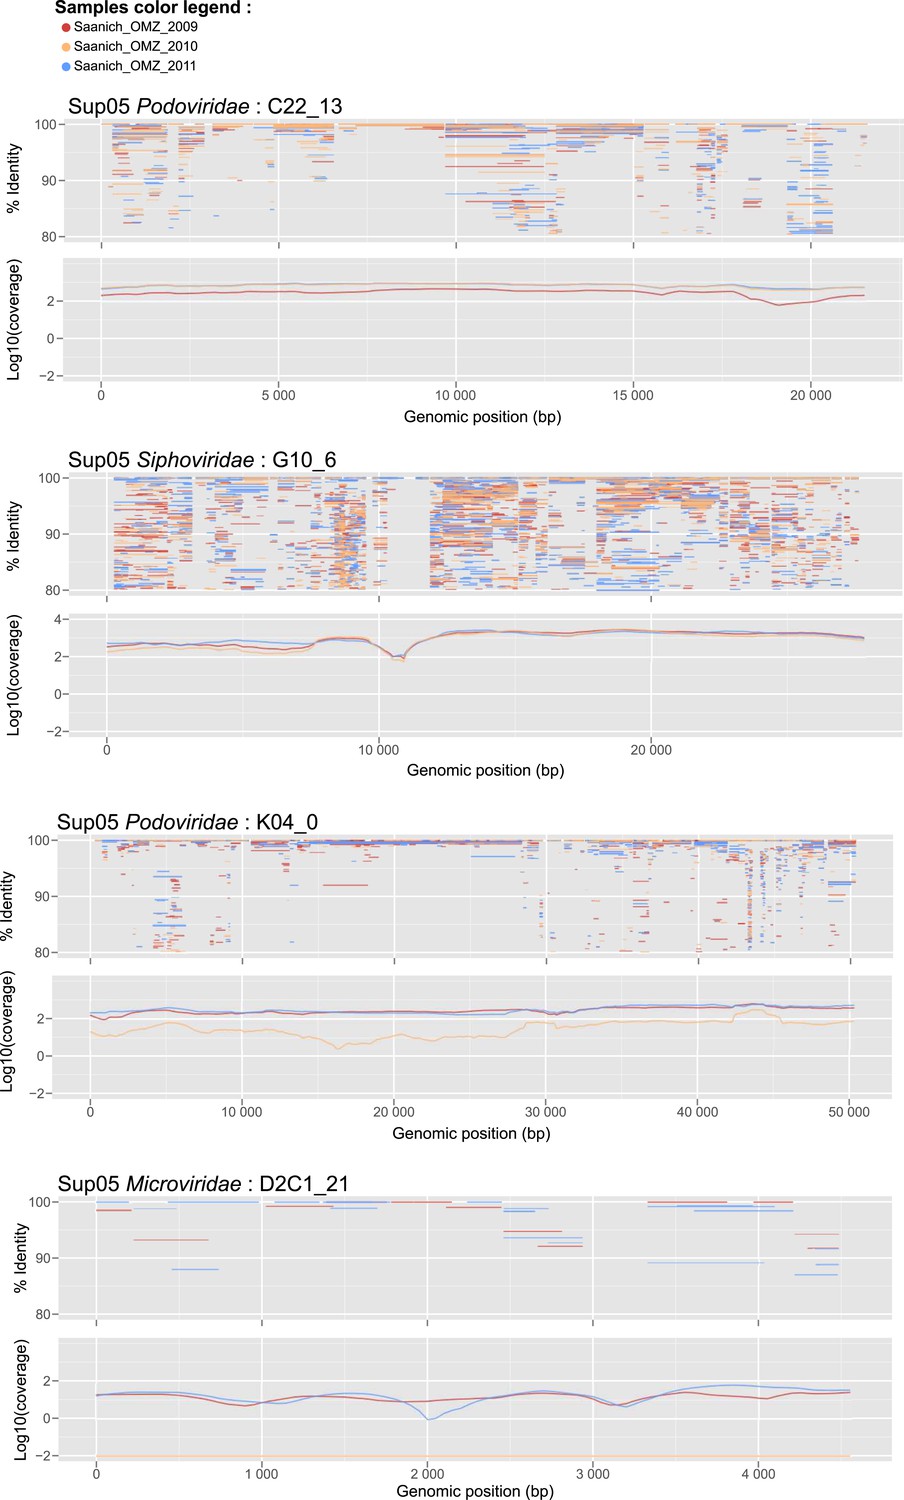
Recruitment and coverage plot of SUP05 viral genome fragments by Saanich Inlet datasets sampled in 2009, 2010, and 2011.
Each dot correspond to a match between a metagenome predicted gene and a gene from the SUP05 viral genome fragment, displayed according to the coordinate on the genome (x-axis) and the protein identity percentage (y-axis). For each genome, plots were only generated for data sets in which the genome was detected. Only hits with more than 80% amino-acid identity were considered.
Figure 3—figure supplement 2
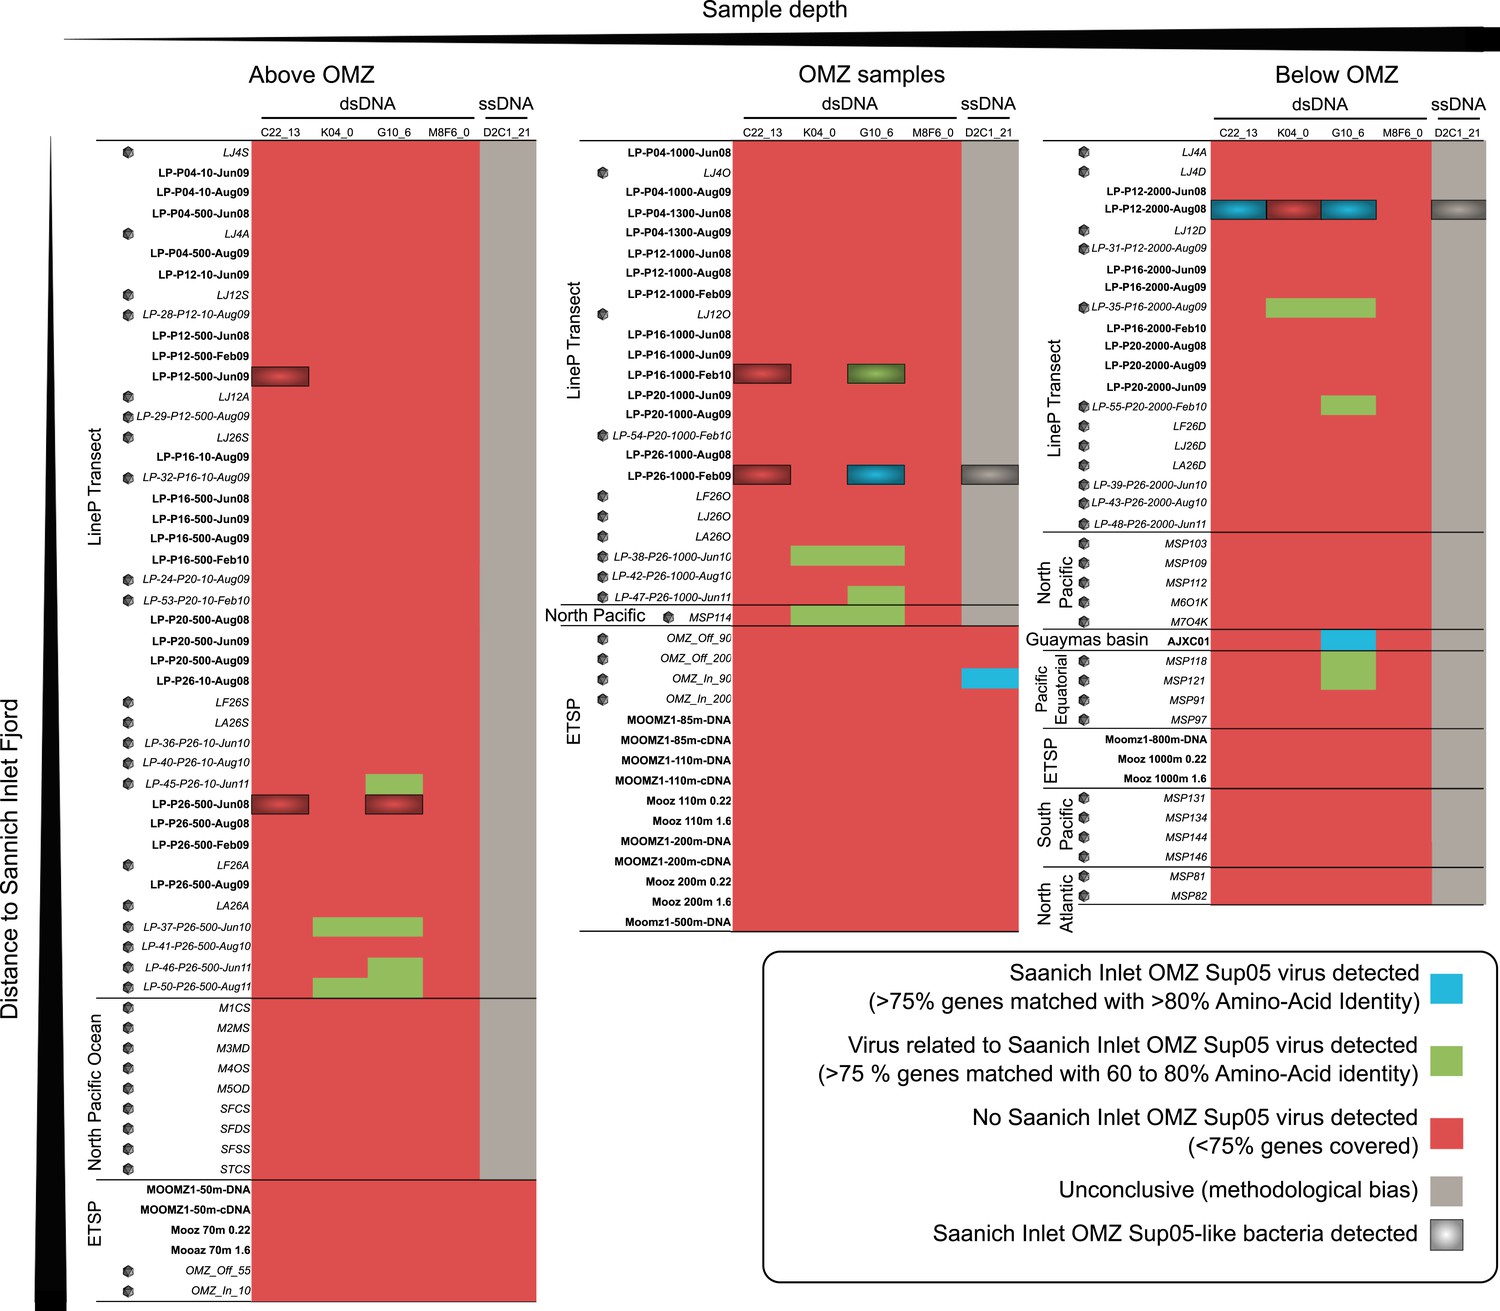
Heatmap of detection of SUP05 viruses in oceanic data sets.
Metagenomes are classified from left to right based on the sampling depth as ‘Above the OMZ’, ‘OMZ’, and ‘Below the OMZ’, and vertically ordered based on the geographical sampling region, from the samples closest to Saanich Inlet (on top) to the one farthest from Saanich Inlet (at the bottom). Viral metagenomes are noted with a gray capsid symbol. Each metagenome—viral genome association was classified based on the number of viral genes detected and the amino-acid percentage identity of the BLAST hits associated. The viral genome was thought to be in the sample when more than 75% of the genes were detected at more than 80% of identity in the metagenome (blue cells), when the same ratio of genes detected at lower percentage (60–80%) indicates the presence of a related but distinct virus (green cells). We considered that less than 75% of the genes detected meant that this virus was likely absent from the sample (red cells), except for the detection of the ssDNA Microviridae in HiSeq-Illumina-sequenced viromes, where the procedure used to process samples prior to sequencing is likely to select against the amplification of ssDNA templates (gray cells). Metagenomes in which the associated SUP05 host was detected are highlighted in black (>75% genes on SAG microbial contigs covered with Average Nucleotide Identity > 95%).
Figure 3—figure supplement 3
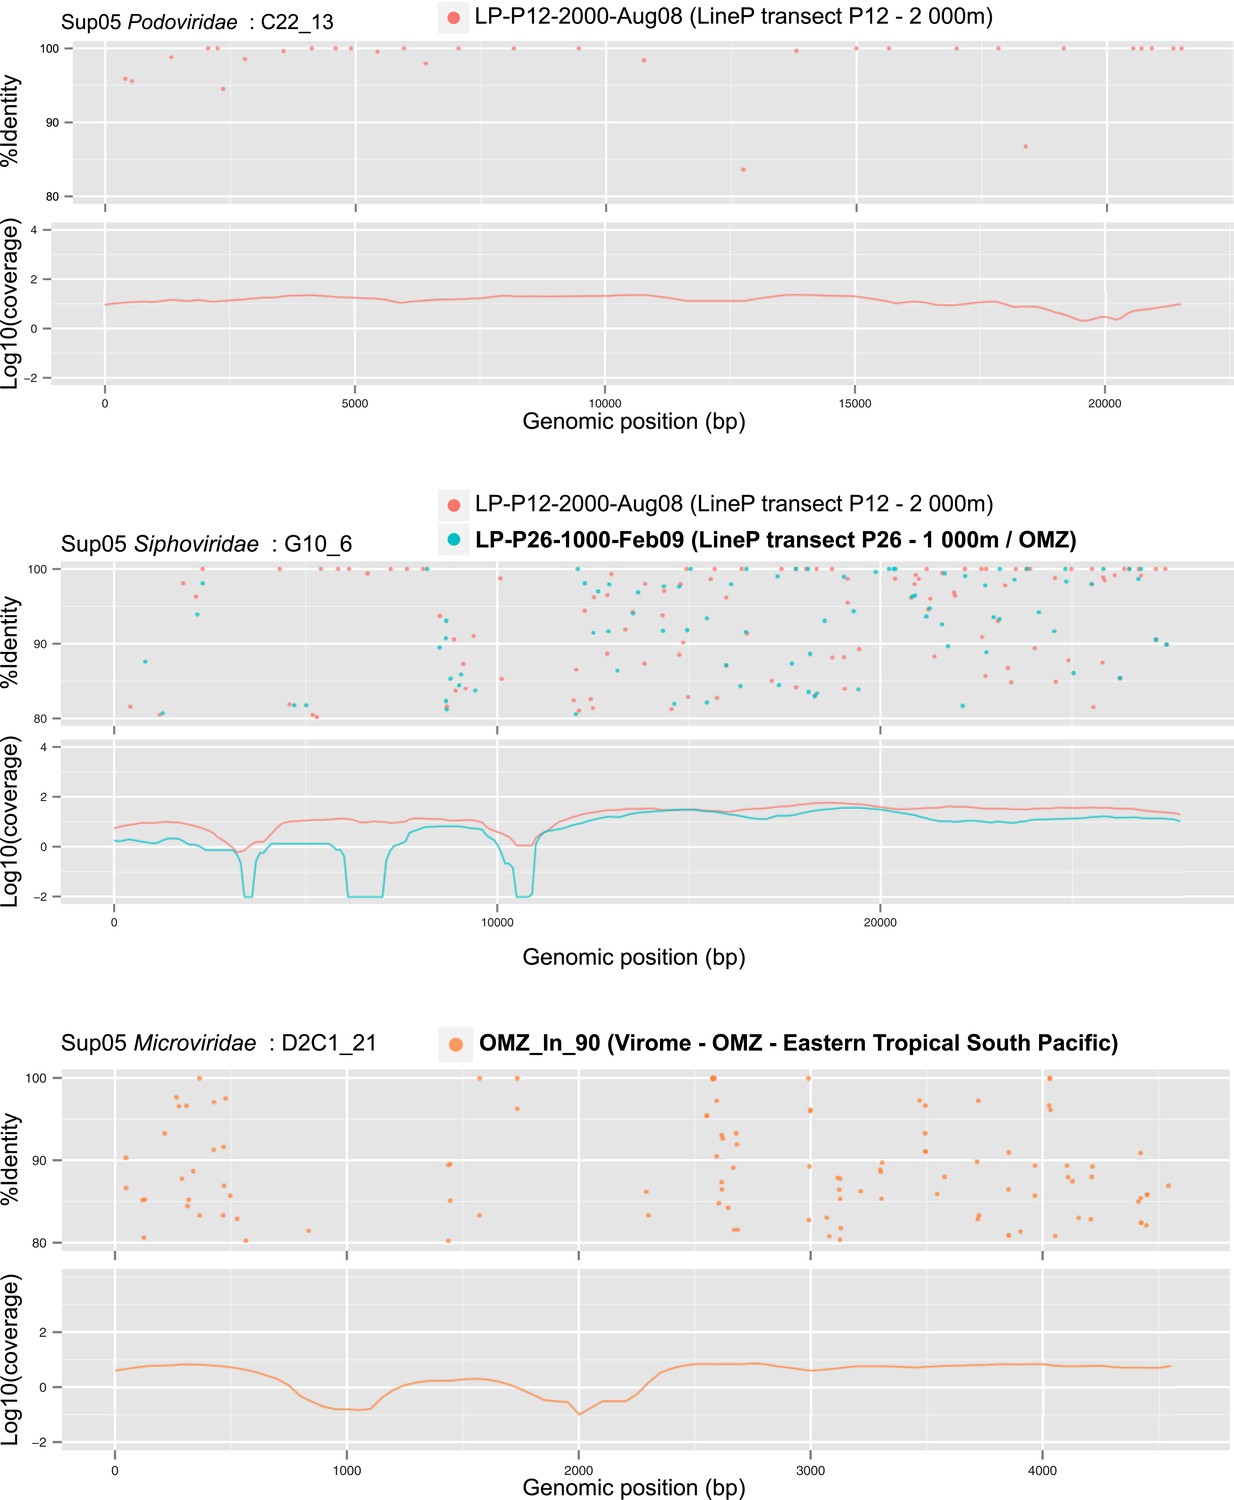
Recruitment and coverage plot of SUP05 viral genomes by data sets sampled outside of Saanich Inlet fjord.
Each dot correspond to a match between a metagenome predicted gene and a gene from the SUP05 viral genome fragment, displayed according to the coordinate on the genome (x-axis) and the protein identity percentage (y-axis). For each genome, plots were only generated for data sets in which the genome was detected. Only hits with more than 80% amino-acid identity were considered.
Figure 4
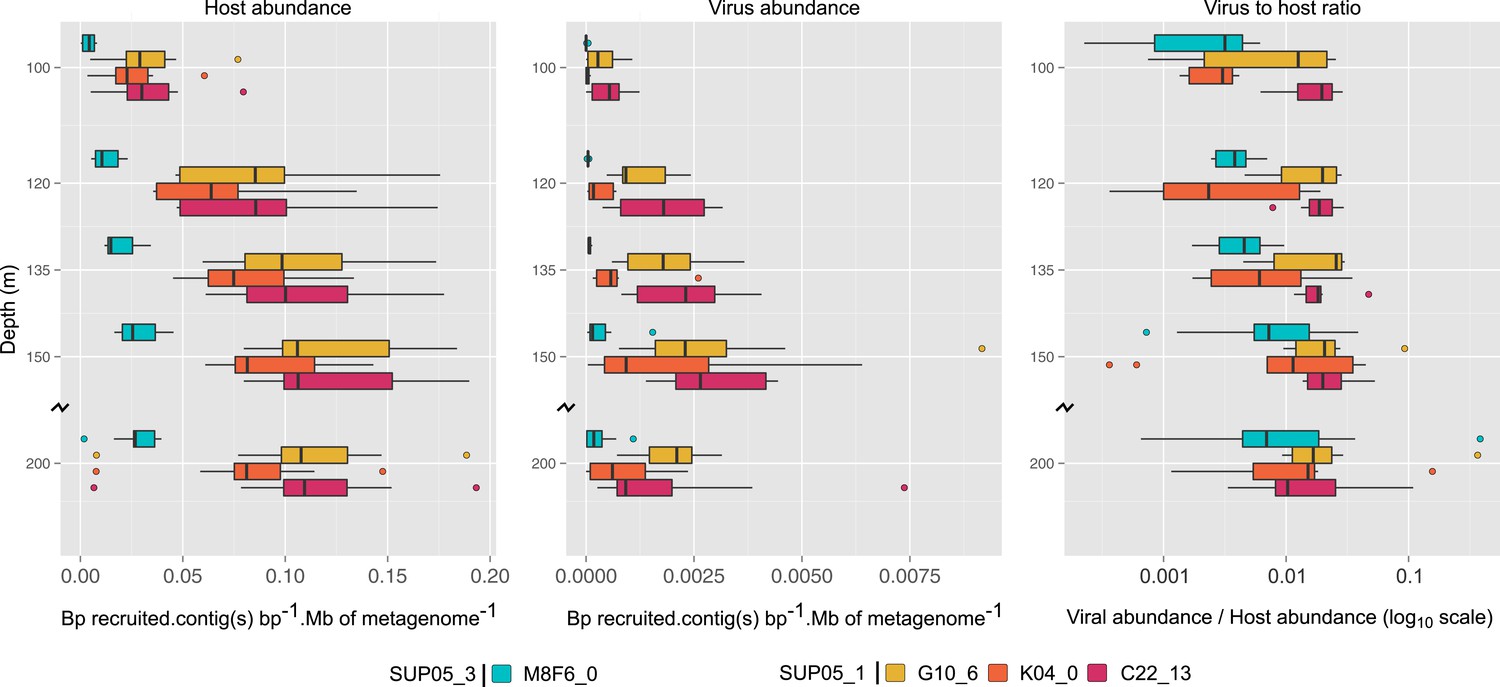
Uncultivated SUP05 lineage-specific virus–host ecology.
Fragment recruitment from Saanich Inlet microbial metagenomes to microbial (95% nucleotide identity) and viral (100% amino-acid identity) reference contigs normalized by contig and metagenome size was used as a proxy for abundance. Hence, the relative abundance of microbial and viral genome is indicated as number of metagenomic bases recruited by contig(s) base pairs (bp) by megabase (Mb) of metagenome. Upper and lower ‘hinges’ of the relative abundance distribution correspond to the first and third quartiles (the 25th and 75th percentiles), while outliers are displayed as points (values beyond 1.5 * Inter-Quartile Range of the hinge). A virus-to-host ratio was then calculated for each SAG (i.e., each virus-host pair) as the ratio of relative abundance of viral contigs to the relative abundance of microbial contigs from the same SAG.
Figure 5 with 2 supplements
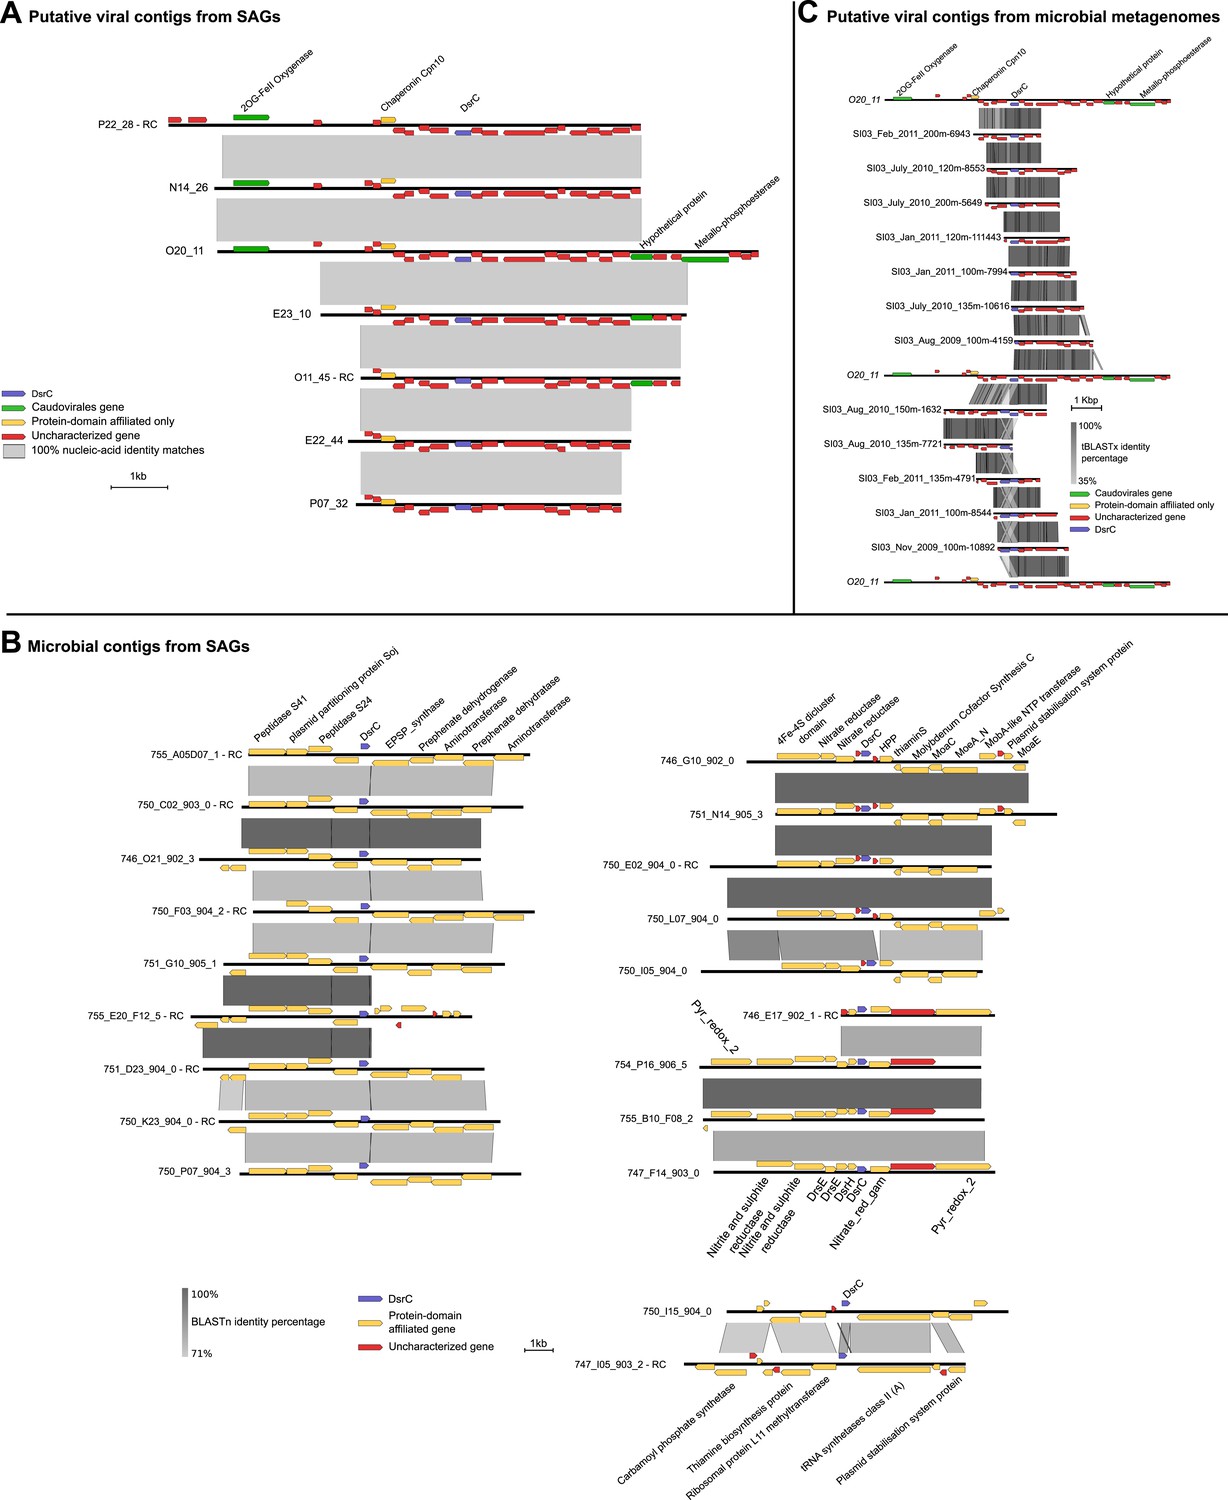
Maps of DsrC-containing contigs.
(A) Seven contigs including dsrC-like gene detected as viral based on non-reference metrics (ratio of uncharacterized genes, strand coding bias). (B) Genomic context in which dsrC-like genes are retrieved in SUP05 microbial contigs from SAG. All contigs above 50 kb containing a dsrC-like gene were selected and compared to get a summary of the different regions in which dsrC-like genes are found in SUP05 genomes. (C) Map of dsrC-containing Contigs assembled from Saanich Inlet metagenomes. One viral-like contig from SAG (020_11) is included for comparison.
Figure 5—figure supplement 1
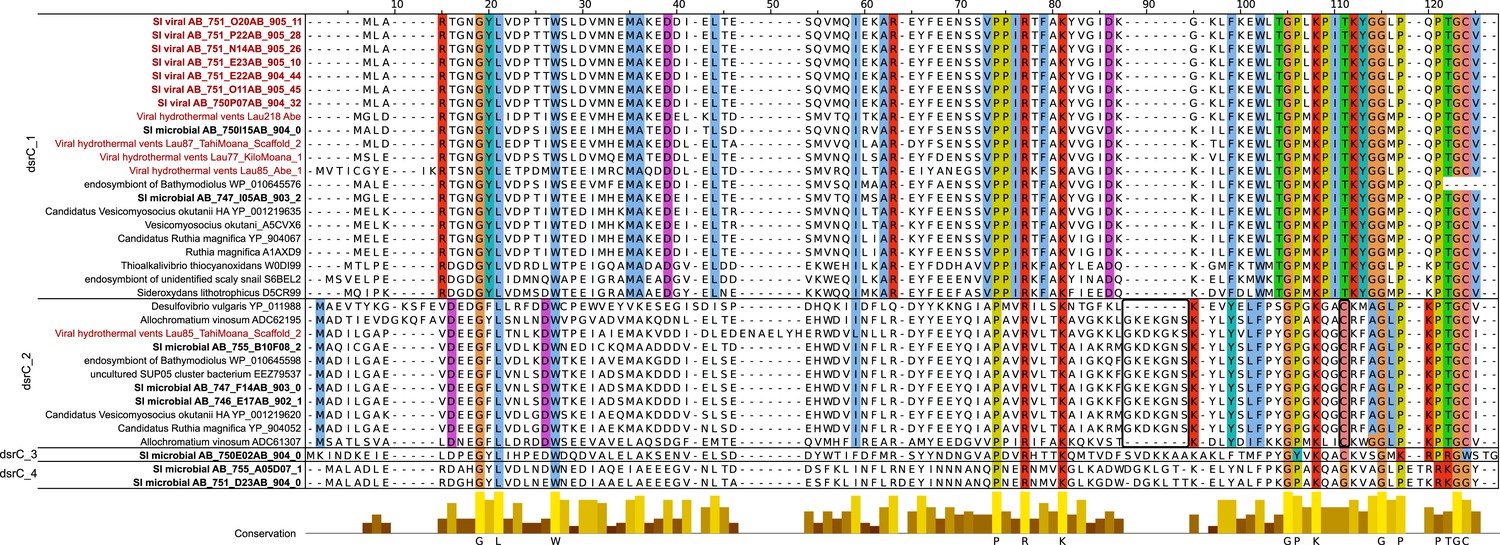
Multiple alignment of dsrC-like genes from Saanich Inlet microbial and viral contigs, hydrothermal vent phages, and microbial genomes.
Viral sequences are highlighted in red, Saanich Inlet sequences in bold. Four groups could be distinguished within this set of sequences (dsrC_1 to 4). The main residues most likely needed for the protein to function as rDsrC are colored across all groups and indicated below the alignment. The specific insertion and second C-terminal cysteine, thought to be required for the dsrC function, and only retrieved in the group dsrC_2, are highlighted with a black frame. Other conserved residues are colored within each group, except for groups 3 and 4 where too few sequences are available.
Figure 5—figure supplement 2
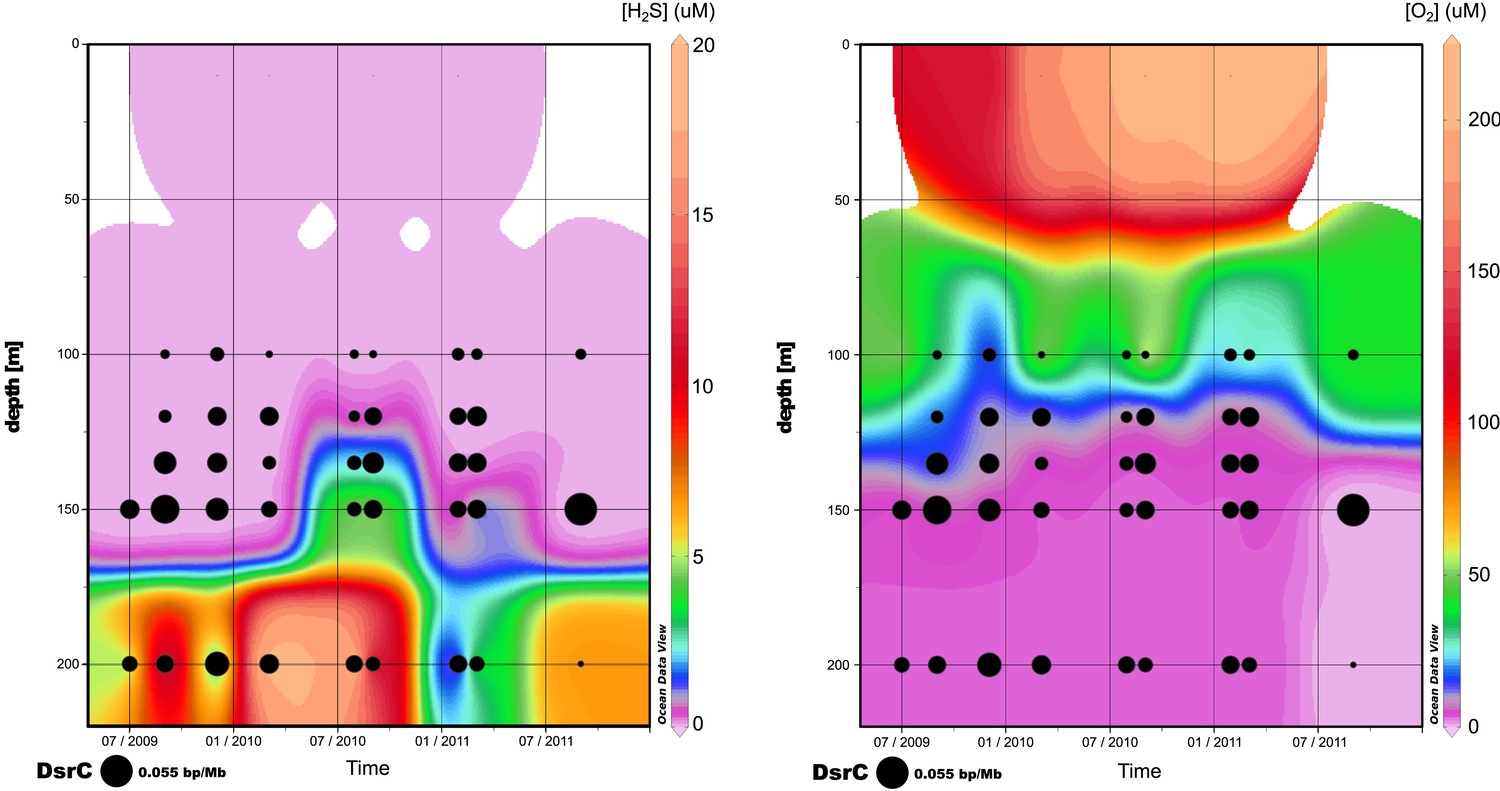
Relative abundance of viral dsrC gene on the 3 years of sampling in Saanich Inlet compared to the concentration of H2S (left) and O2 (right).
https://doi.org/10.7554/eLife.03125.020Additional files
-
Supplementary file 1
List of viral sequences and defective prophages retrieved in SUP05/Arctic SAGs. Upper part of the table displays the 12 ‘SUP05 viral reference’ sequences detected from the presence of viral hallmark gene and their size greater than 15 kb or circularity (A), then the 19 SUP05 short viral contigs (B), with taxonomic affiliation based on viral hallmark genes. The bottom part displays the 19 other sequences retrieved through the second screening (C), based on the first set as references (including contigs previously detected as ‘SUP05 short viral contigs’), and the 18 other putative viral contigs (D), which affiliation to the viral kingdom is uncertain since they lack a viral hallmark gene. Estimated genome sizes are based on the size of the most closely related phage genomes, or in the case of the Microviridae on the length of the circular contigs.
- https://doi.org/10.7554/eLife.03125.021
-
Supplementary file 2
List of contigs containing a putative defective prophage (A) or a CRISPR locus (B).
- https://doi.org/10.7554/eLife.03125.022
-
Supplementary file 3
Number of genes shared between contigs of Single-Amplified Genome (SAG) with a Gokushovirinae genome and the contigs of the five most closely related SAGs. For each SAG with a Gokushovirinae genome, the five SAGs displaying the most identical genes (100% amino-acid identity) are indicated. The number and ratio of identical genes is displayed for each pair of SAGs, alongside the number and ratio of genes similar but non identical (BLASTp hit with bit score greater than 50, e-value lower than 0.001, and identity percentage greater than 30%). Matching SAGs which also display a Gokushovirinae genome are noted with a star.
- https://doi.org/10.7554/eLife.03125.023
-
Supplementary file 4
List of viral sequences detected for each SUP05 SAGs with at least one viral contig or defective prophage. For the detection of viral contigs, full-length contigs are indicated by a cross (x), partial matches (short contigs matching the full-length sequence) are noted with a dash (−). For the short contigs not similar to any SUP05 viral reference sequence, the number of different contigs identified is indicated for each cell.
- https://doi.org/10.7554/eLife.03125.024
-
Supplementary file 5
List of metagenomic data sets used in this study. Viral metagenomes were used for both viral contig detection and recruitment plots, whereas microbial metagenomes were only included in the recruitment plot computation. OMZ samples are highlighted in bold.
- https://doi.org/10.7554/eLife.03125.025
-
Supplementary file 6
List of PFAM domains detected in the 68 viral sequences identified. The four putative Auxiliary Metabolism Genes are highlighted in bold.
- https://doi.org/10.7554/eLife.03125.026
-
Supplementary file 7
Number of genes shared between contigs of Single-Amplified Genome (SAG) with a DsrC gene on a viral contig and the contigs of the five most closely related SAGs. For each SAG with a DsrC gene on a viral contig, the five SAGs displaying the most identical genes (100% amino-acid identity) are indicated. The number and ratio of identical genes is displayed for each pair of SAGs, alongside the number and ratio of genes similar but non identical (BLASTp hit with bit score greater than 50, e-value lower than 0.001, and identity percentage greater than 30%). Matching SAGs which also display a similar DsrC gene on a viral contig are indicated with a star.
- https://doi.org/10.7554/eLife.03125.027
-
Source code 1
Set of perl scripts used to (i) evaluate metrics (gene size, strand bias, ratio of uncharacterized genes) and detect phage sequences in the SAG dataset, (ii) compute relative abundance of phages and hosts and generate recruitment plots from BLAST comparison of metagenomes and SAG contigs, and (iii) evaluate the genetic diversity within reads recruited to a phage contig.
- https://doi.org/10.7554/eLife.03125.028
Download links
A two-part list of links to download the article, or parts of the article, in various formats.
Downloads (link to download the article as PDF)
Open citations (links to open the citations from this article in various online reference manager services)
Cite this article (links to download the citations from this article in formats compatible with various reference manager tools)
Ecology and evolution of viruses infecting uncultivated SUP05 bacteria as revealed by single-cell- and meta-genomics
eLife 3:e03125.
https://doi.org/10.7554/eLife.03125


