Vocalization–whisking coordination and multisensory integration of social signals in rat auditory cortex
- Humboldt University of Berlin, Germany
Figures
Figure 1 with 1 supplement
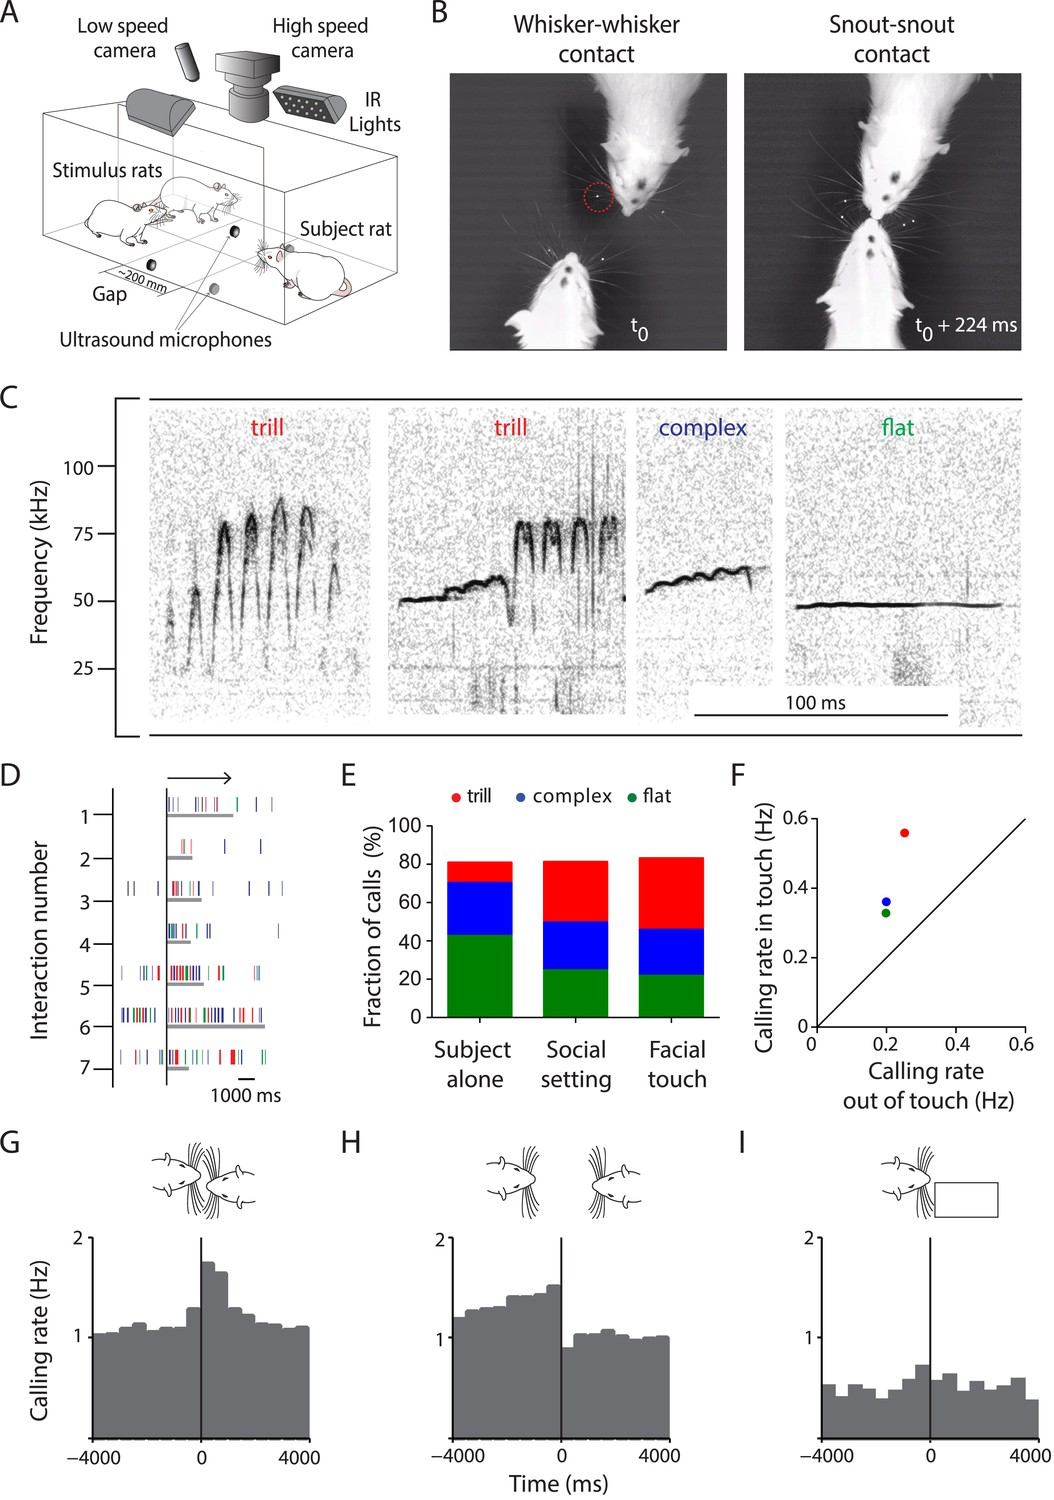
Facial touch is associated with increased ultrasonic vocalizations.
(A) Social interactions between subject and stimulus rats placed across a gap were documented using low- (30 Hz) and high-speed (250 Hz) cameras under infra-red (IR) illumination. USVs were recorded using four ultrasound microphones. (B) Facial touch consists of whisker (left) and snout contacts (right). Whisker tracking was facilitated by the use of tags (red circle; t0 = time of first whisker contact). (C) Representative spectrograms of three major 50 kHz USV call categories emitted during social interactions, that is, trill, complex, and flat calls. (D) Raster plot indicating the relationship between facial touch episodes (gray bars, aligned to start, indicated by arrow) and individual USVs (vertical rasters) in a sample session. (E) USVs emitted in three scenarios, by the ‘Subject alone’, by all interacting partners after introduction of stimulus rats (‘Social setting’), and during ‘Facial touch’ were predominantly trill, complex, and flat calls. The proportion of trills (red) increased in the social contexts while flats (green) showed a reverse trend. Complex calls (blue) remained constant. (F) All call types were vocalized at a higher rate during facial touch compared to outside of it (even though stimuli were present). (G) Population PSTH aligned to the onset of facial touch indicates an increase in vocalization associated with whisker contact (bin size: 500 ms). (H) The end of whisker contact is associated with a sharp decrease in vocalization (bin size: 500 ms). (I) Interactions with non-social stimuli (objects/plastinated rats) had lower calling rates and no touch-associated modulation (bin size: 500 ms).
Figure 1—figure supplement 1
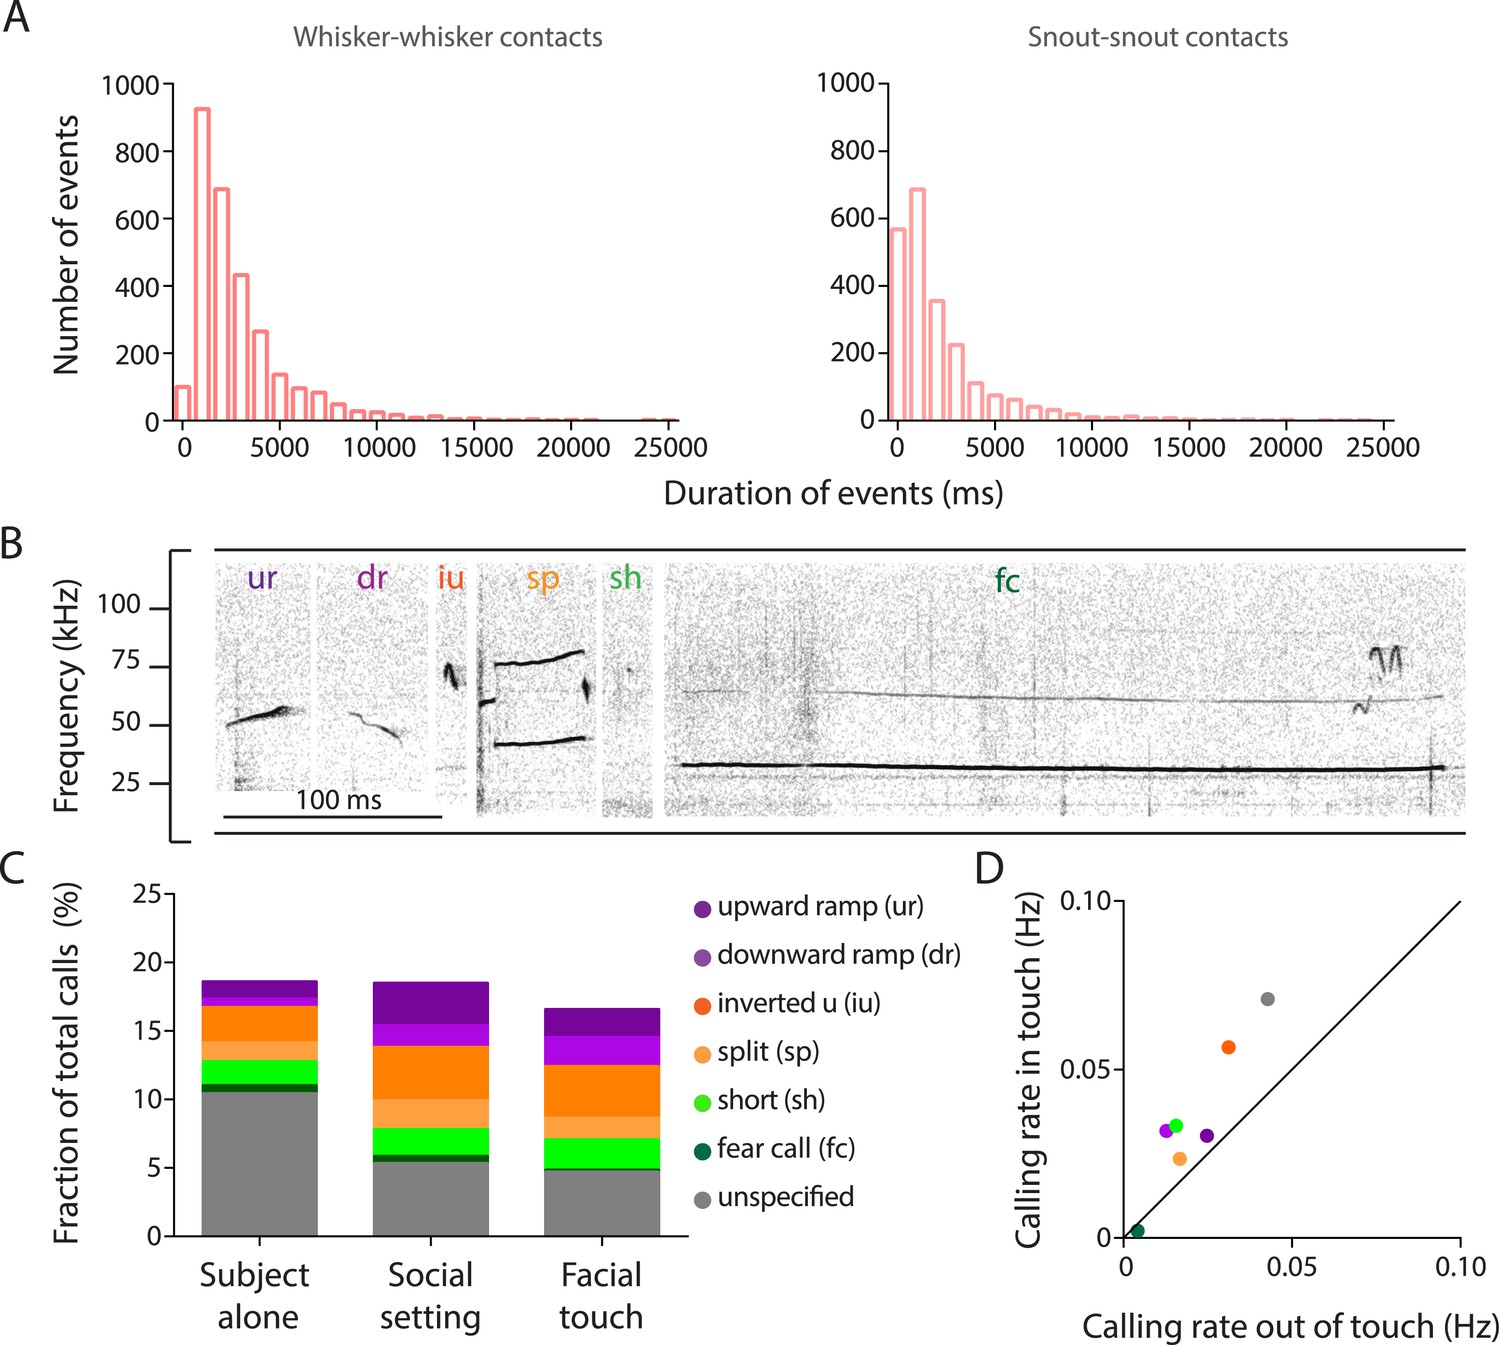
Facial touch is associated with increased ultrasonic vocalizations.
(A) Distribution of durations of whisker-to-whisker (mean ± SD: 2.86 ± 2.68 s; left) and snout-to-snout (mean ± SD: 2.15 ± 2.7 s; right) episodes during facial touch when rats interact with conspecifics in the gap paradigm. (B) Representative spectrogram of upward ramp (ur), downward ramp (dr), inverted u (iu), split (sp), short (sh), and fear call (fc) emitted during social interactions (also present with the fear call is another overlapping call towards the end). (C) Histogram showing proportions (%) of various call categories emitted by the ‘Subject alone’ during baseline period, after introduction of stimulus rats (‘Social setting’), and during ‘Facial touch’. (D) Calling rates for various call categories during facial touch vs outside of touch showing a generalized increase in calling rates.
Figure 2
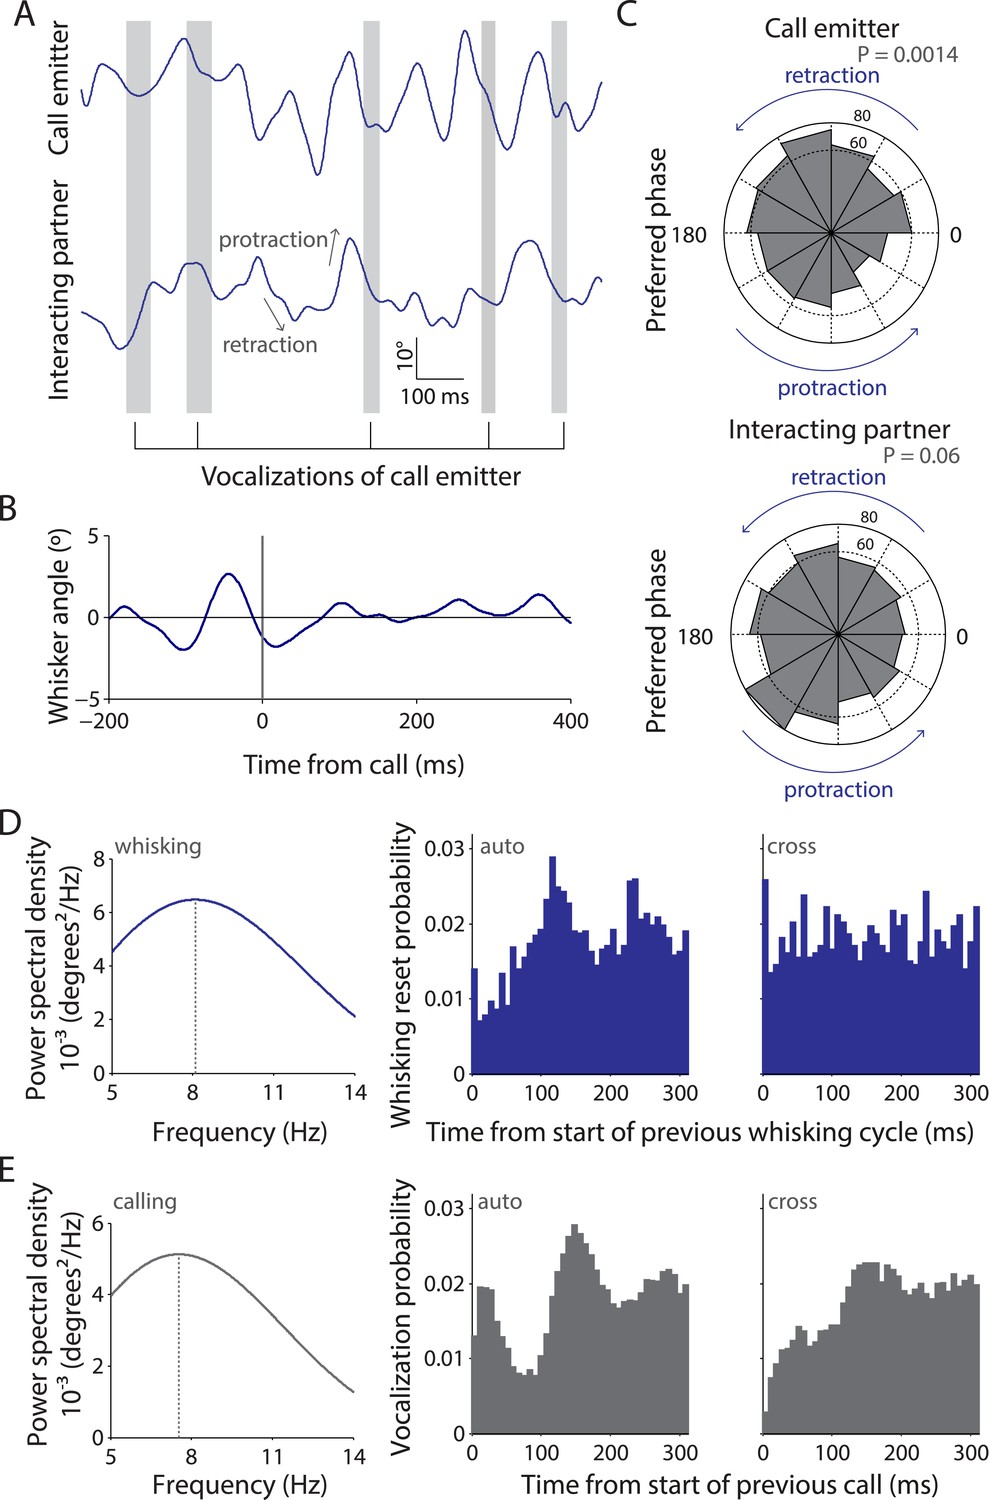
Whisking and vocalization are coordinated during facial touch.
(A) Sample whisker traces of a call emitter (top) when aligned to its own vocalizations (gray bars) indicate a correlation with the retraction phase of the whisker. This was not the case with the whisker trace of the interacting partner (bottom). (B) Call-triggered whisking average wherein the average of all whisking traces is aligned with respect to the emitter's call onset. (C) Distribution of call onsets were significantly non-uniform (Hodges–Anje test) relative to whisking cycle of emitter itself (top) but not for the interacting partner (bottom). There appears to be a substantial bias for calls during the retraction phase of the emitter's whisking (top) unlike for calls during the interacting partner's whisking (bottom). (D) Predominant whisking rates determined by power spectral density of whisker traces during social touch is 8.1 Hz (left). Distribution of time intervals between whisking cycles within one animal (auto) correspondingly shows a peak at ca. 112 ms (middle). Points of maximum protraction were used for binning. Inter-animal (cross) whisking interval distribution suggests that the interacting animals do not whisk with a fixed phase relationship (right). (E) Power spectral density analysis to determine the predominant calling rates revealed a 7.6 Hz predominant frequency component (left). The distribution of time intervals between start of two subsequent vocalizations peaks around 144 ms (‘auto’, middle). The effect is not as pronounced when triggering to calls that were assigned to a different animal (‘cross’, right).
Figure 3 with 5 supplements
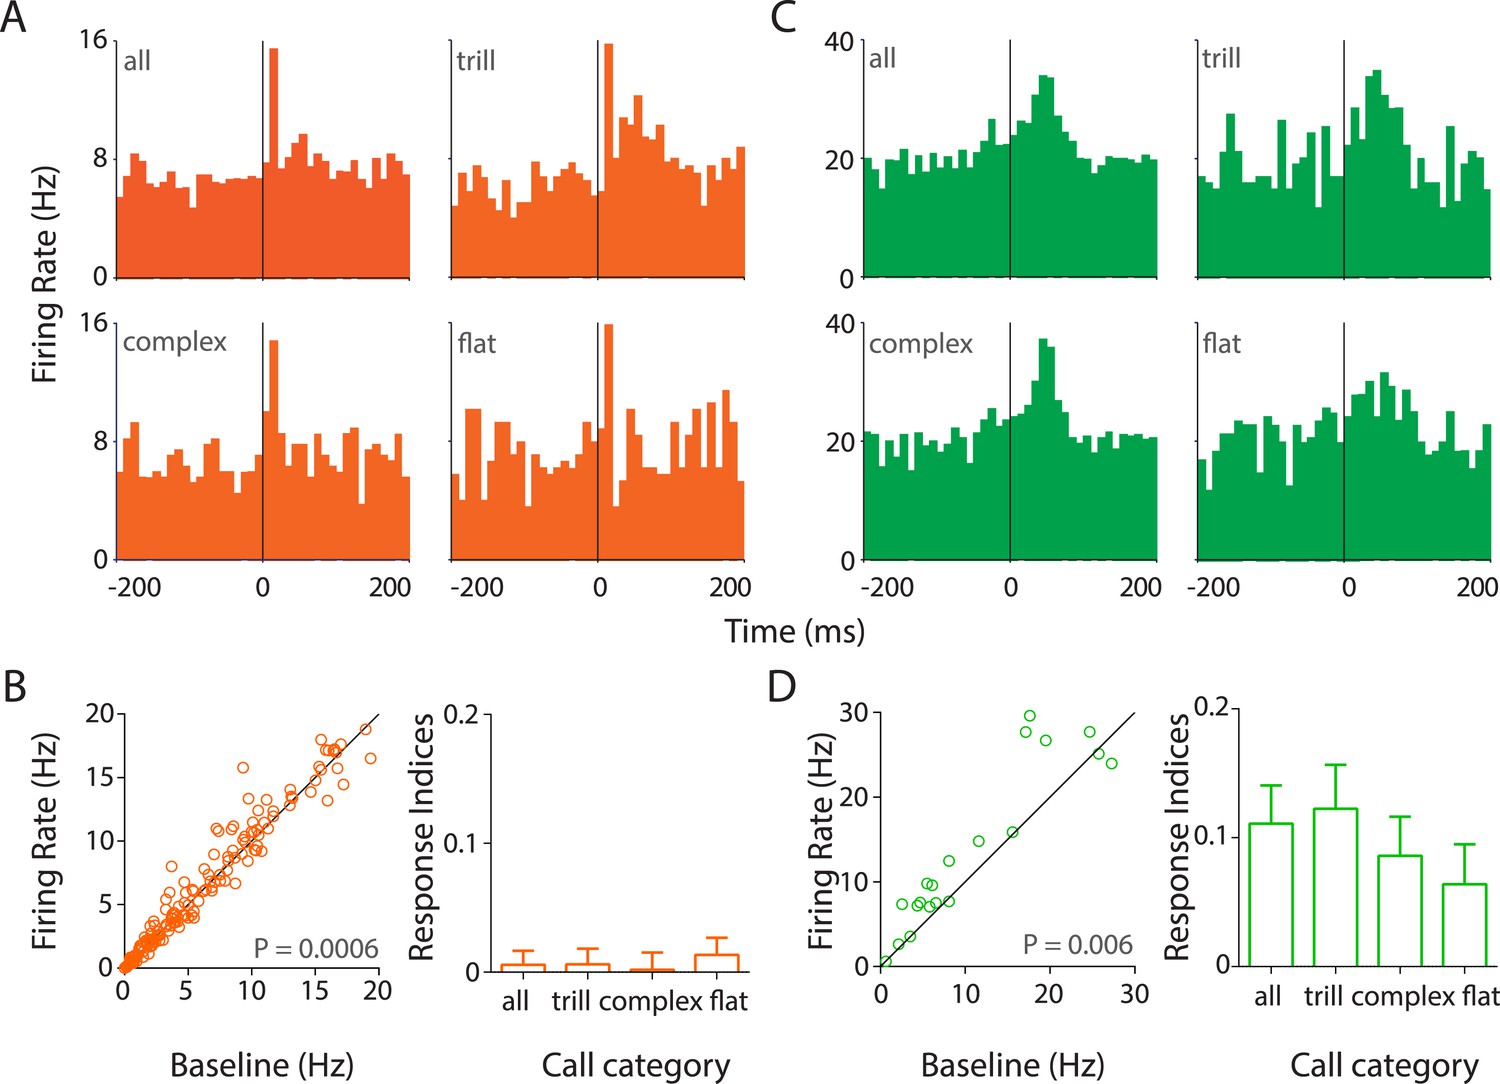
Responses to USVs in auditory cortex are excitatory and cell-type dependent.
(A) Representative PSTHs showing the response of a RS neuron to all USVs (top left) and to individual call categories that is, trill (top right), complex (bottom left), and flat (bottom right) (bin size: 10 ms). (B) Population data showing responses of RS neurons plotted as firing rate in response to USVs vs baseline (left, Wilcoxon signed rank test). The population showed a significant modulation in firing rate in response to USVs. The mean response indices ± SEM to either all calls or the major call categories also reveal little or no overall modulation (right). (C) Response of a representative FS neuron showing a stronger modulation to all calls and also to complex and trill calls (bin size: 10 ms). (D) Almost all FS neurons were also significantly upregulated by USVs (left, Wilcoxon signed rank test) and this was evident in their mean response indices ± SEM to all calls and to the various call categories (right).
Figure 3—figure supplement 1
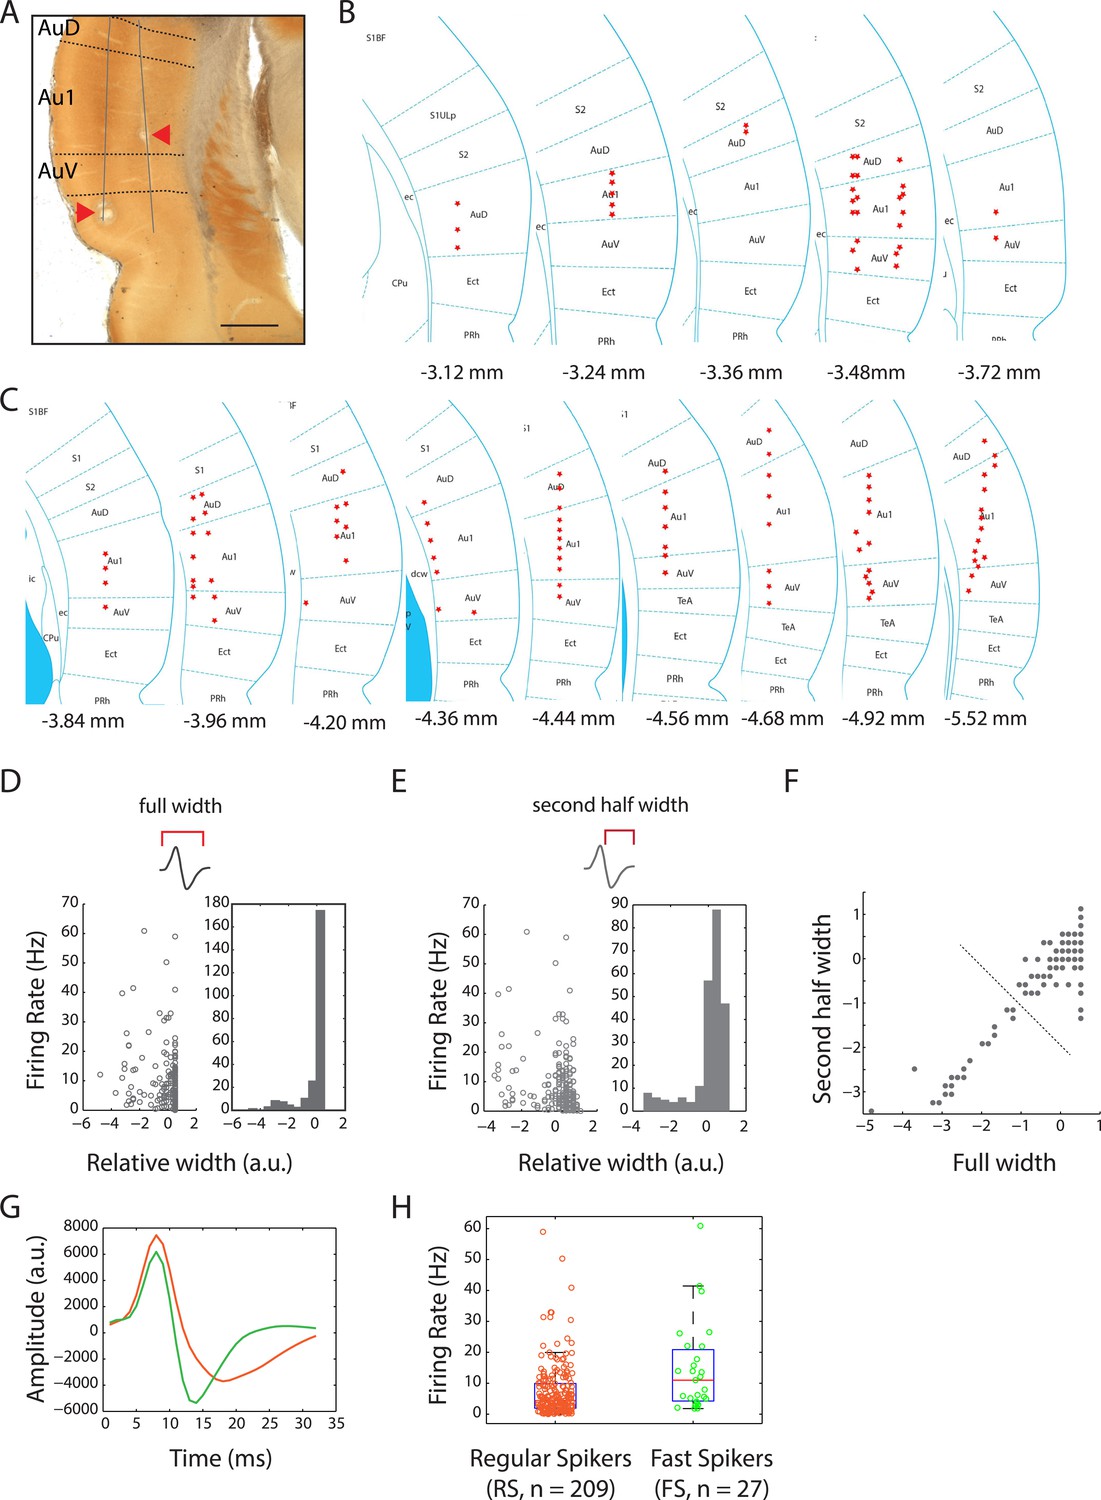
Locations of recording sites in the auditory cortex and cell-type classification.
(A) Photomicrograph of cytochrome oxidase stained brain section showing electrolytic lesions (arrowheads) along two tetrode tracts (solid lines) passing through the auditory cortex (bregma: −3.72 mm; magnification: 2×; scale bar: 1 mm). Dotted lines demarcate the sub-regions: auditory cortex dorsal (AuD), primary auditory cortex (Au1), and auditory cortex ventral (AuV). (B) Locations of recording sites across the auditory cortices of four female and four male subject rats. Bregma positions are as indicated in the rat brain atlas (reproduced with permission from Paxinos and Watson, 2007, The Rat Brain in Stereotaxic Coordinates, sixth Edition, copyright Elsevier 2007, All Rights Reserved). (C) Location of recording sites as in (B). (D) Comparison of firing rates with full spike width indicated a bi-modal distribution of auditory cortex units. (E) A similar comparison with the second half width also resulted in a bi-modal distribution. (F) Using these features, k-means clustering of units with two clusters resulted in well separated populations (indicated by dotted line). (G) Spikes from these two populations resulted in well-defined average spike shapes, with the longer waveforms (orange) being classified as putative regular-spiking (RS) neurons and the thinner waveforms (green) classified as putative fast-spiking (FS) neurons. (H) Overall firing rates of these two classes were also highly differentiated (median firing rates: RS: 4.4 Hz vs FS: 11.1 Hz).
Figure 3—figure supplement 2
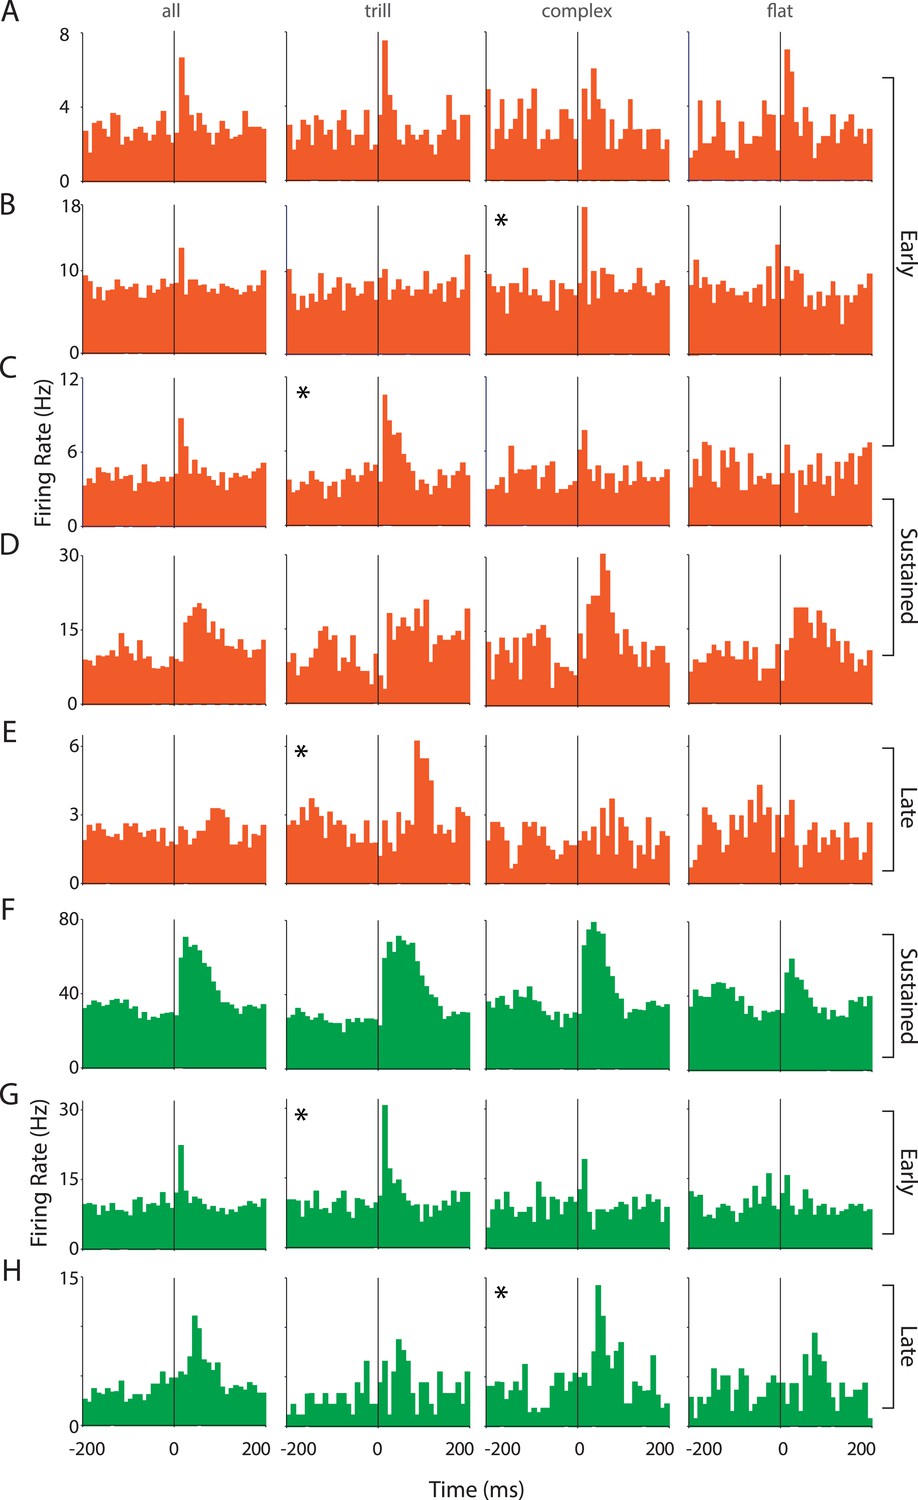
Responses of auditory cortex neurons to ultrasonic vocalizations are heterogeneous.
(A–E) Representative PSTHs showing the response of RS neurons to all USVs and to individual call categories that is, trill, complex, and flat (bin size: 10 ms). (F–H) Representative PSTHs showing the response of FS neurons to all USVs and to individual call categories that is, trill, complex, and flat (bin size: 10 ms). Neurons that appear to be more strongly modulated by one call category than others are indicated by an asterisk (*).
Figure 3—figure supplement 3
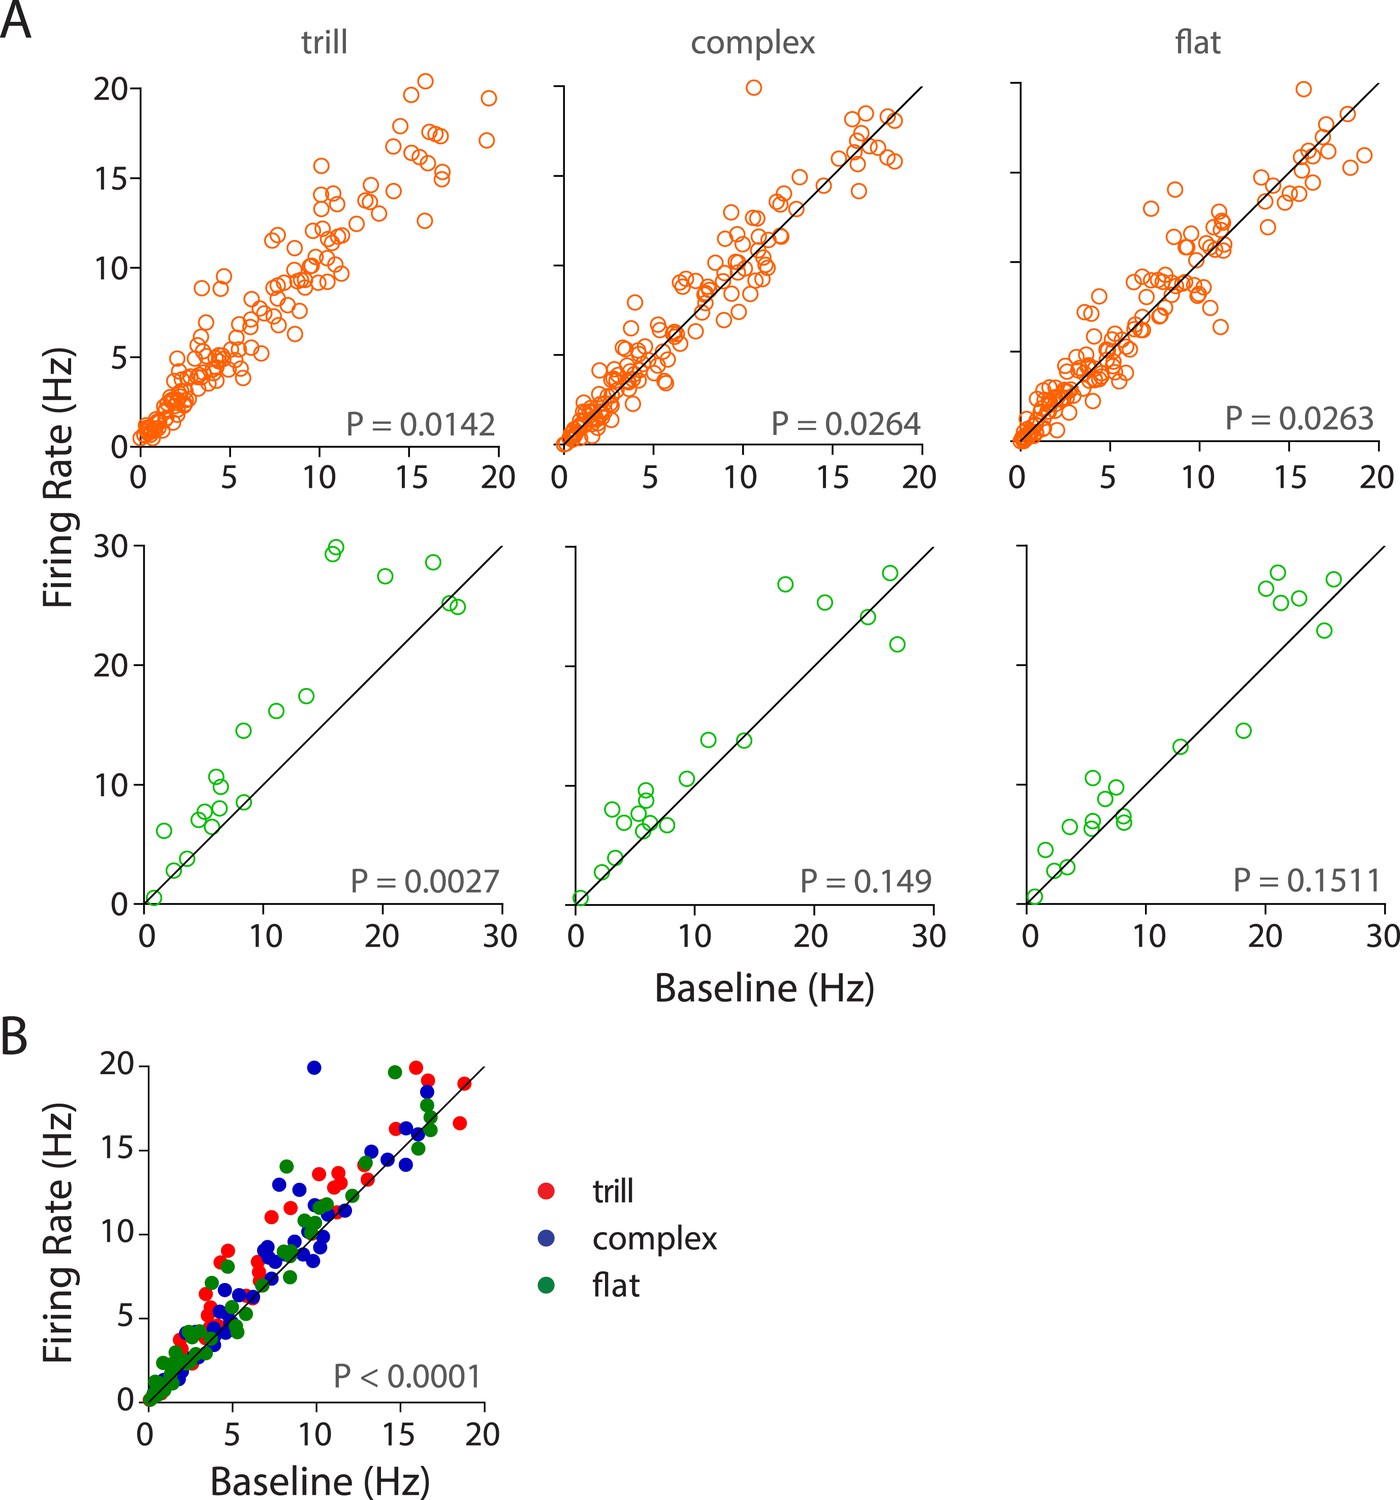
Population responses of auditory cortex neurons to different USV call categories.
(A) Population response of RS neurons (top) to various call categories compared to baseline firing rates showed significant modulation by trill, complex, and flat categories (Wilcoxon signed rank test). FS neurons (bottom) were also significantly modulated by trill category. (B) Scatter plot showing significant response of RS neurons to the ‘best call’, that is, maximal excitatory response when compared to the baseline firing rate (Wilcoxon signed rank test).
Figure 3—figure supplement 4
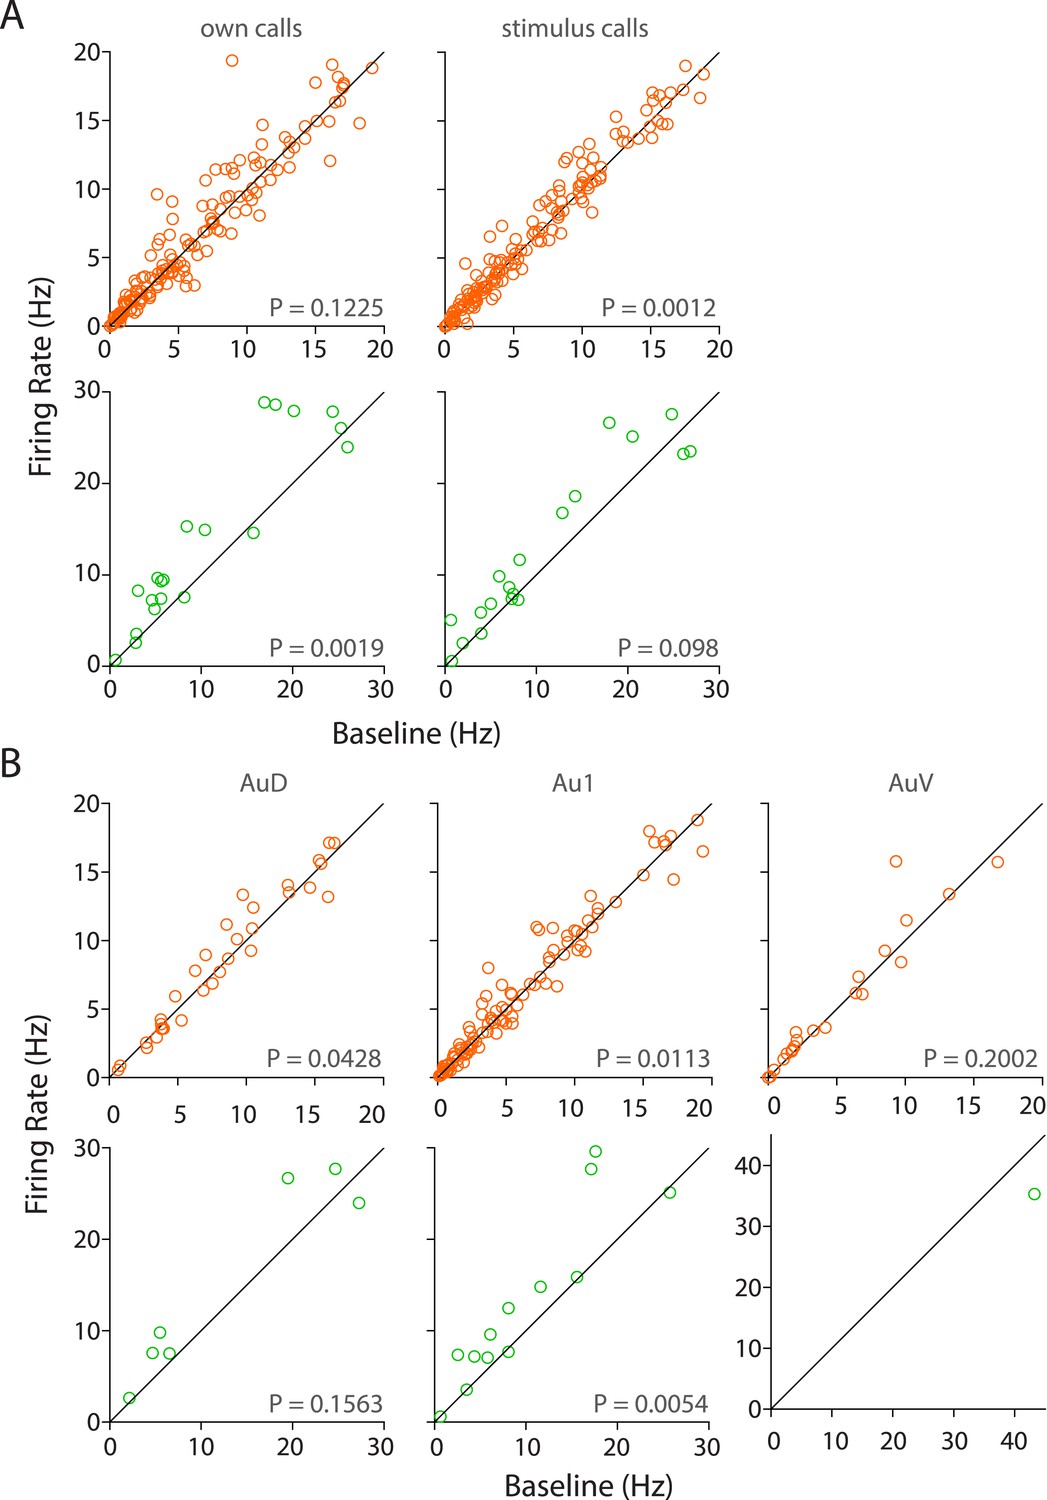
Population responses to own vs stimulus calls and in various sub-regions of the auditory cortex.
(A) RS neurons showed significant modulation to USVs of stimulus but not own calls (top) whereas FS neurons are modulated by own but not stimulus calls (bottom, Wilcoxon signed rank test). (B) Sub-region-wise comparison showed that AuD and Au1 RS neurons were significantly modulated by USVs (top) whereas Au1 FS neurons alone were modulated by USVs (bottom, Wilcoxon signed rank test).
Figure 3—figure supplement 5
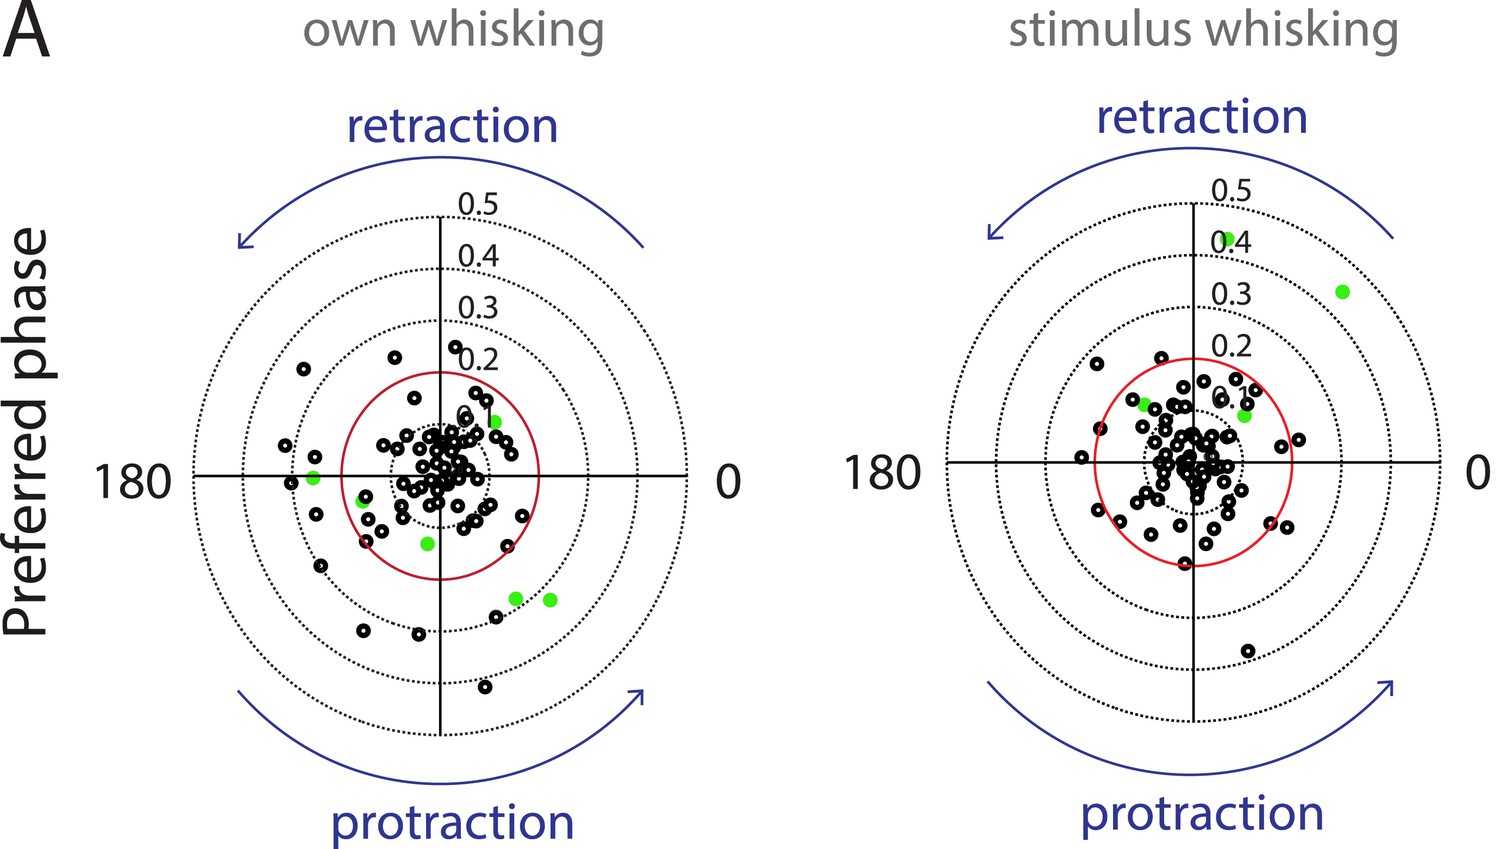
Auditory cortex neurons do not show any locking to the phase of whisking.
(A) Polar plots showing the preferred phase of auditory cortex neurons triggered to own (left) and stimulus whisking (right, Rayleigh vector lengths 0.1–0.5 with 0.2 indicated in red). Neurons that passed the shuffling test criteria are indicated in green. At the individual level neurons that have a Rayleigh vector length >0.2 and have passed the shuffling test are considered to be locked to whisking. At the population level, there appears to be no significant locking of spiking with either the retraction or protraction phase of whisking.
Figure 4 with 1 supplement
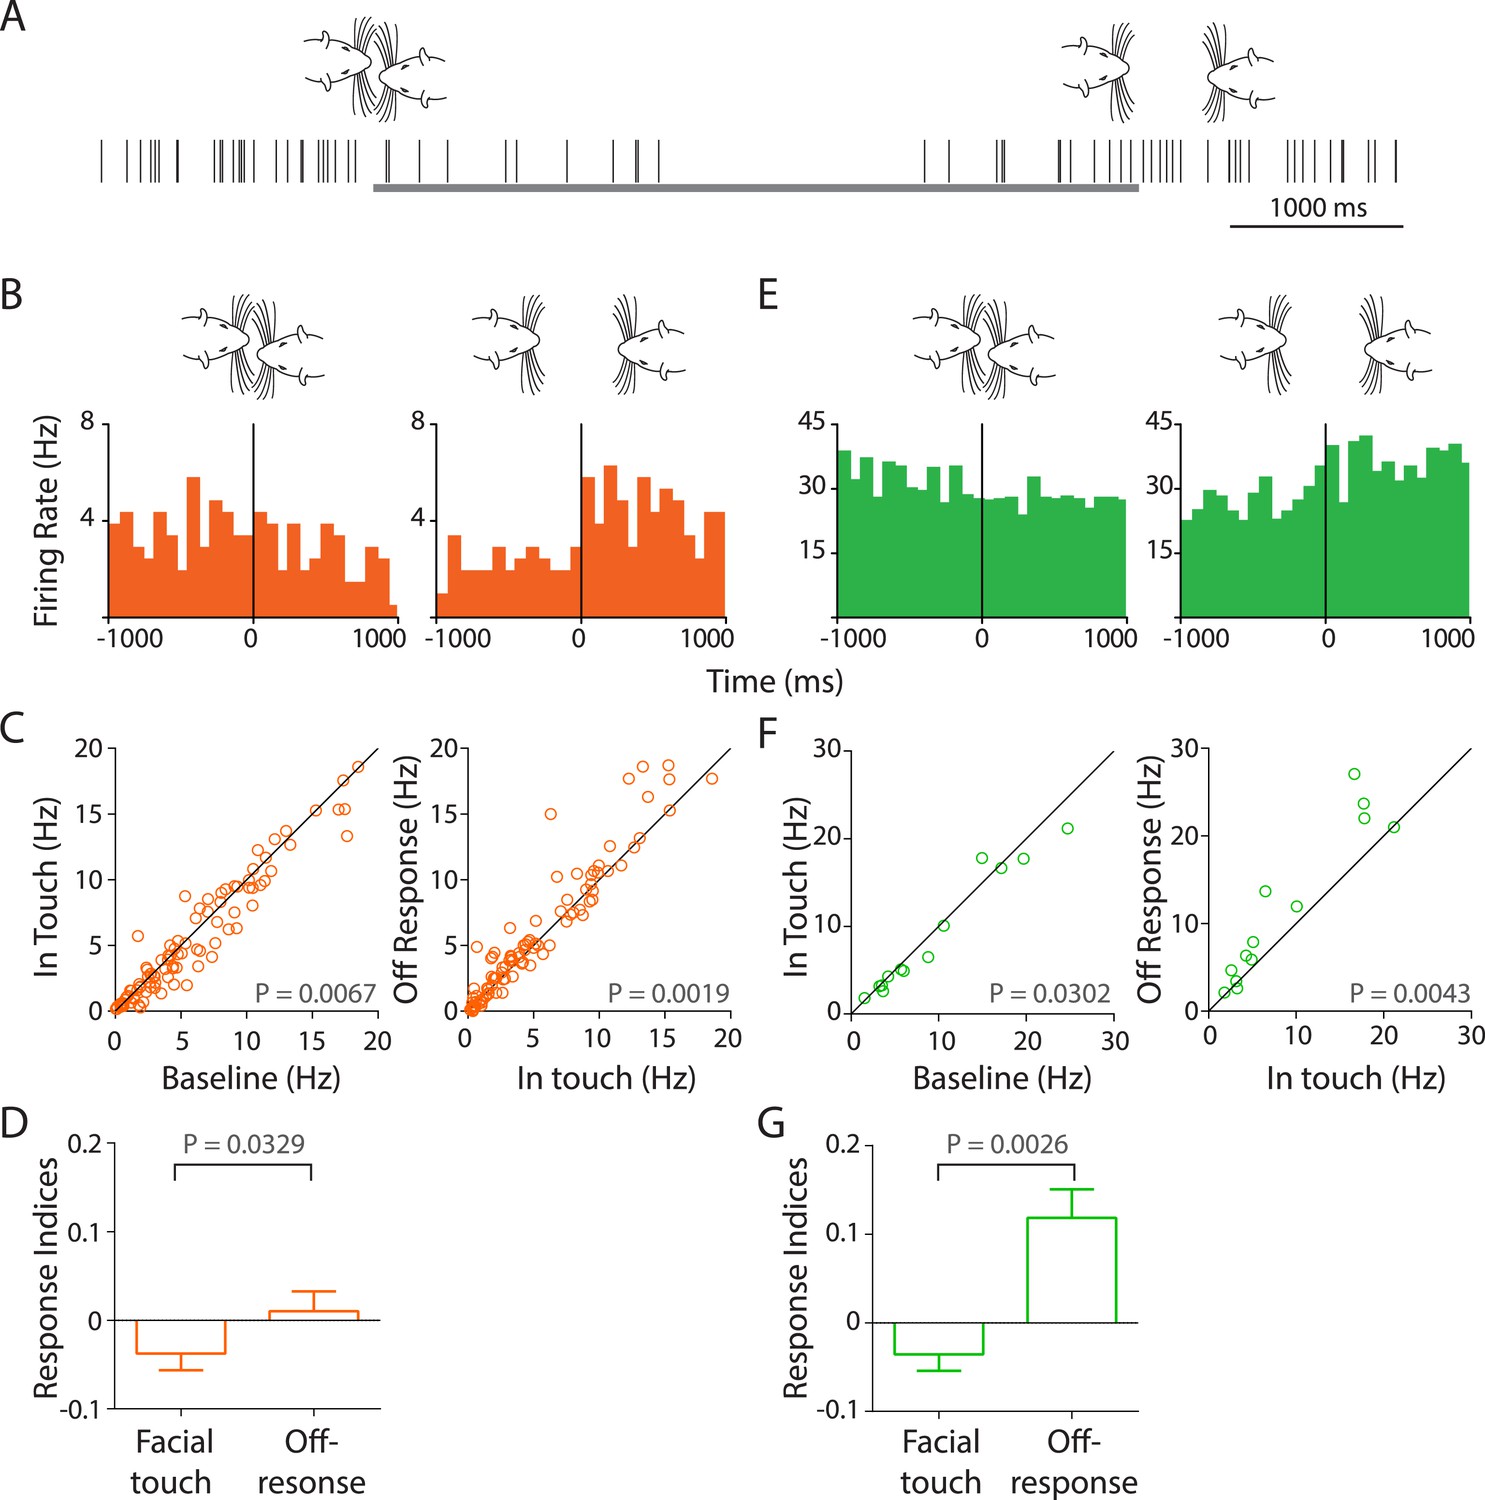
Facial touch evokes inhibition and off-responses in primary auditory cortex (Au1).
(A) Schematic showing the spiking activity (rasters) of a representative Au1 RS neuron aligned to a facial touch episode (gray bar). Facial touch onset results in an inhibition in firing rate and is associated with an increase upon the end of touch. (B) Representative PSTHs of a RS neuron triggered to onset (left) and offset (right) of facial touch demonstrating the inhibitory effect during touch and an off-response at the end of touch (bin size: 77 ms). (C) Population response of RS neurons plotted as firing rate after touch onset vs baseline (left) shows a significant inhibition due to facial touch. However, the off-response (in a 200 ms window after the end of facial touch) led to an increase in firing rate which was significantly higher than in touch (right, Wilcoxon signed rank test). (D) Mean response indices ± SEM of RS neurons during facial touch and off-response were significantly different (Wilcoxon signed rank test). (E) Representative PSTHs of a FS neuron triggered to facial touch onset (left) and offset (right) demonstrating a similar inhibitory effect due to touch and the off-response at the end of touch (bin size: 77 ms). (F) Population response of FS neurons showing a significant inhibition (Wilcoxon signed rank test) due to touch (left) that was released at the end of touch (right). (G) Mean response indices ± SEM of FS neurons were also significantly different (Wilcoxon signed rank test) between facial touch and off-response windows.
Figure 4—figure supplement 1
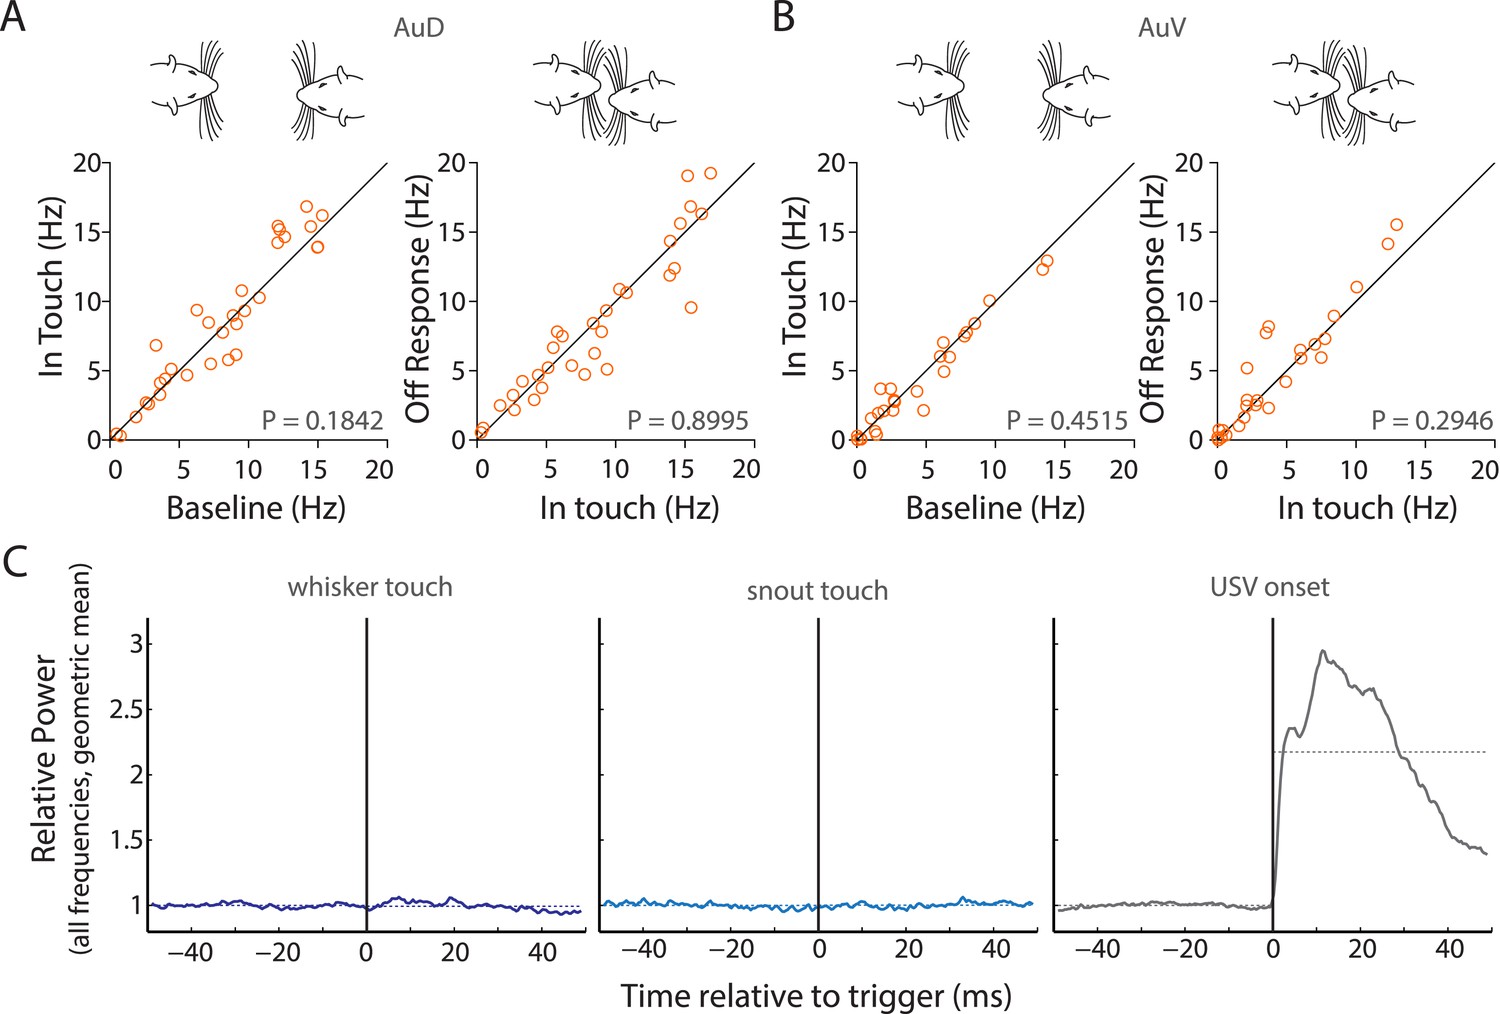
Facial touch does not elicit inhibition in AuD and AuV; whisker/snout touch does not lead to measurable changes in sound intensities.
(A) Facial touch onset-associated inhibition (left) and offset associated increase in firing rate (right) do not occur in AuD RS neurons. (B) Similarly, these phenomena were also not observed in AuV RS neurons. (C) Plots of change in relative power measured during social interactions revealed no change when triggered to whisker touch (left) and snout touch (middle), whereas when triggered to USVs (right) a large increase was observed. Dotted lines denote the pre- and post-triggered averages.
Figure 5 with 1 supplement
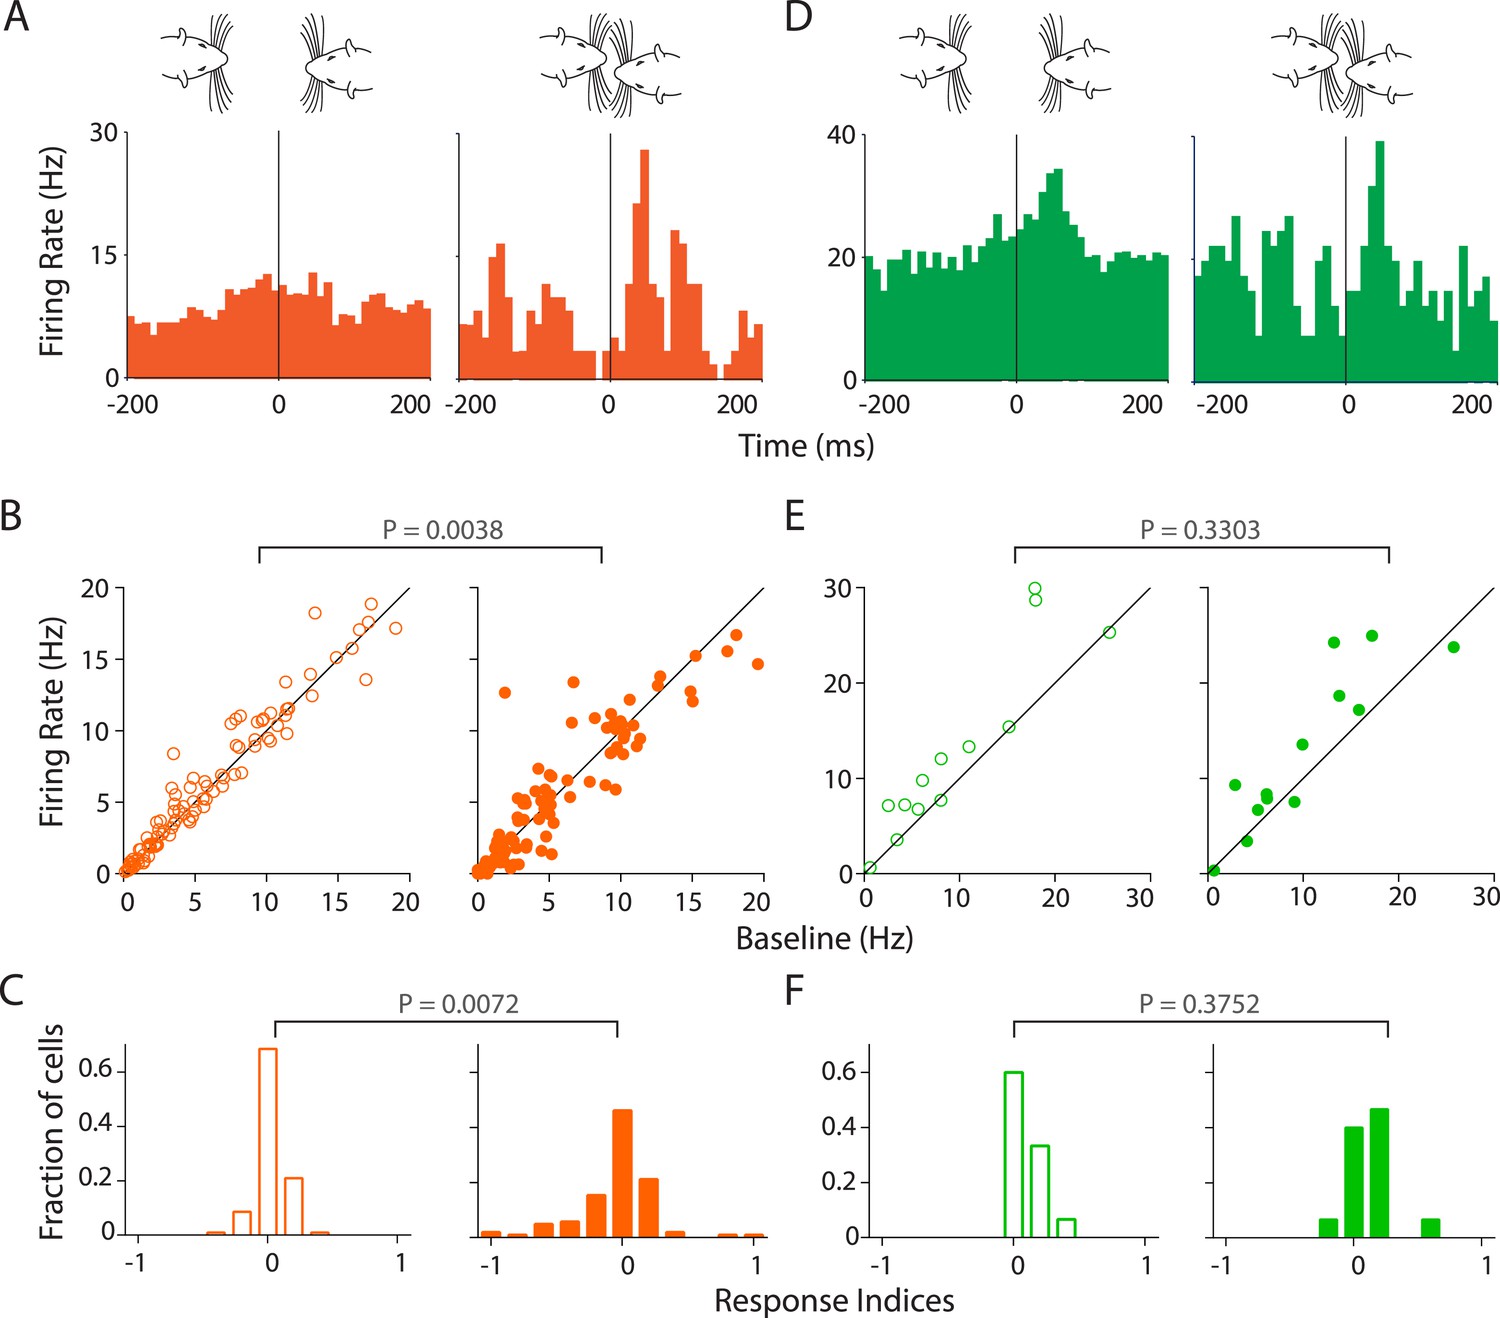
Stronger and variable modulation of responses to vocalizations by facial touch.
(A) Representative PSTHs of a RS neuron showing a stronger response to vocalizations during facial touch (right) compared to out of touch (left, bin size: 10 ms). (B) Population response of RS neurons also demonstrated an increased modulation to vocalizations (both excitation and inhibition) during touch (right) compared to outside of it (left), which were significantly different when subjected to a pair-wise comparison (Wilcoxon signed rank test). (C) Distribution of response indices showed that a large fraction of RS neurons were not modulated by vocalizations when out of touch (left) while a significant amount of modulation occurred during touch (right, Kolmogorov–Smirnov test). (D) Representative PSTHs of a FS neuron showing a higher response to vocalizations during touch (right) compared to the response when out of touch (left, bin size: 10 ms). (E) Population response of FS neurons however did not show any significant difference (Wilcoxon signed rank test) in modulation to vocalizations either in (right) or out (left) of touch. (F) Distribution of response indices in FS neurons also did not show any significant differences in modulation (Kolmogorov–Smirnov test) either in (right) or out (left) of touch.
Figure 5—figure supplement 1
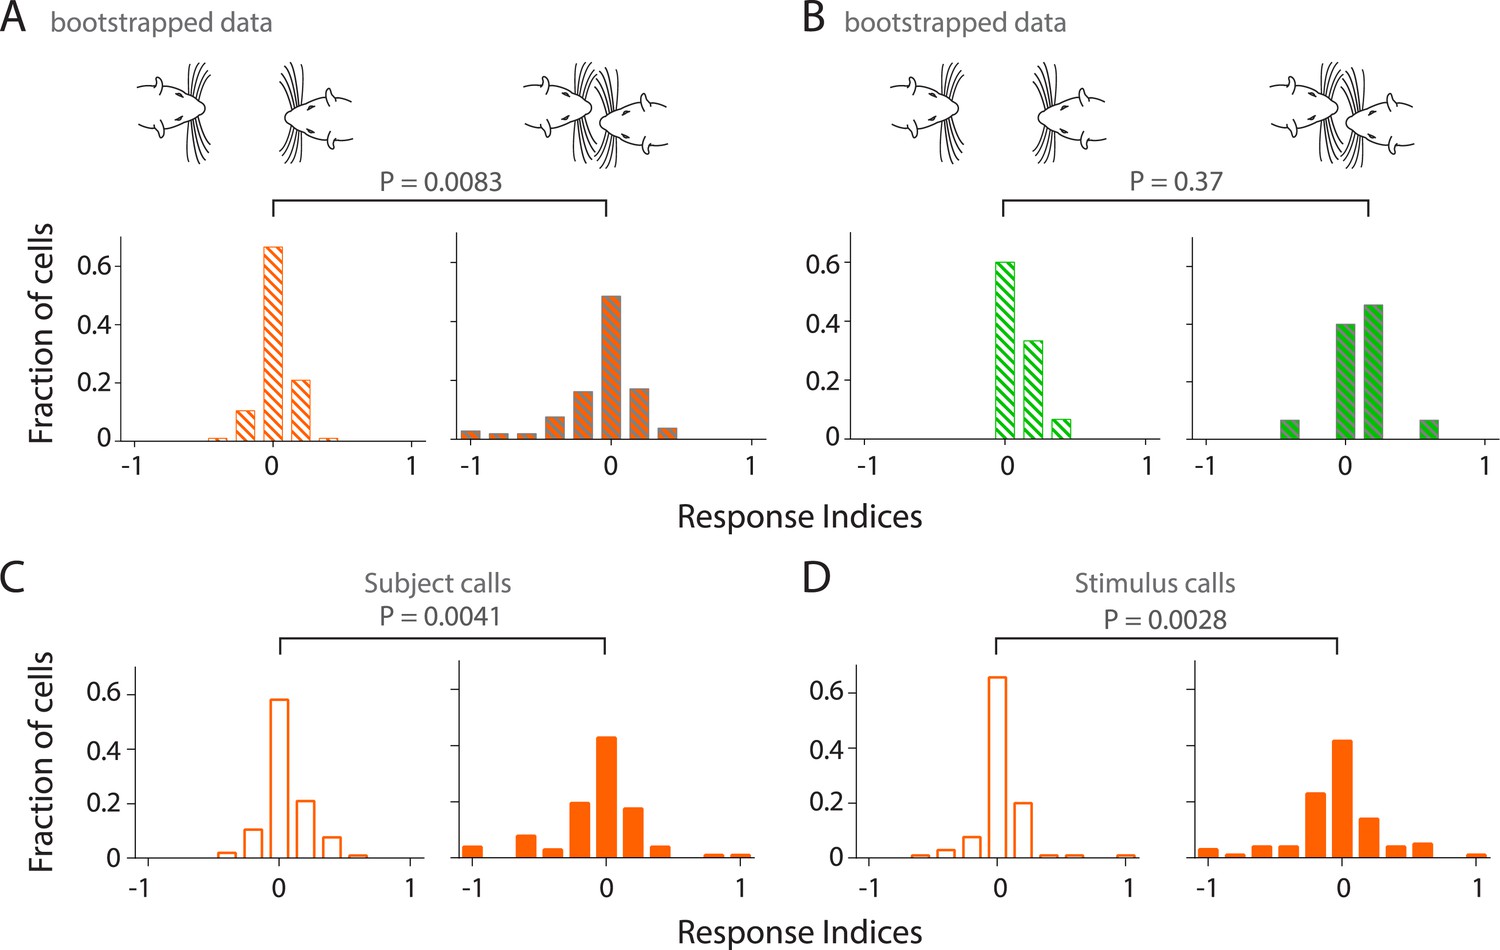
Sampling bias does not account for modulation of responsiveness to calls during touch; calls both from own and stimulus animals lead to increased modulation in primary auditory cortex during touch.
(A) Distribution of response indices from bootstrapped data out of touch (left) shows that a large fraction of RS neurons are not modulated by vocalizations. This was significantly different (Kolmogorov–Smirnov test) from the response during facial touch (right) where many cells showed increased modulation. (B) Similar analysis of the distribution of response indices of FS neurons revealed that there was no significant differences (Kolmogorov–Smirnov test) between bootstrapped out of touch (left) and in touch (right) data. (C) Distribution of response indices shows that many RS neurons exhibit higher modulation to own calls during touch (right), which was significantly different (Kolmogorov–Smirnov test) from the modulation to calls out of touch (left). (D) A similar distribution of responses indices to stimulus calls was also observed in RS neurons out of (left) and in (right) touch (Kolmogorov–Smirnov test).
Videos
Video 1
Temporal coordination of whisking and vocalization.
During facial touch in the gap paradigm, rats engage in extensive whisker-to-whisker and snout-to-snout contacts (representative high-speed video slowed down by a factor of 16, bottom panel). In addition, ultrasonic vocalizations produced by the subject rat (left) are shown as spectrograms (slowed down by a factor of 16, top panel). The stimulus animal (right) was anaesthetized to remove confounds of the source of sound. Whiskers of the subject rat were tracked and whisking angles were calculated. A trace of the whisking angle indicates protraction (positive angles) and retraction (negative angles, middle panel). Onsets of individual ultrasonic vocalizations are indicated as vertical rasters in the whisker trace, indicating that vocalization and whisking appear to be temporally coordinated, with a bias towards the retraction phase of the whiskers.
Tables
Table 1
Properties of USV categories emitted during social interactions.
| Call type | n | Frequency (kHz) | Band width (kHz) | Duration (ms) | ||||||
|---|---|---|---|---|---|---|---|---|---|---|
| Mean | ± SEM | 20th, 80th quantiles | Mean | ± SEM | 20th, 80th quantiles | Mean | ± SEM | 20th, 80th quantiles | ||
| Trill | 16,549 | 63.1 | 0.2 | 51.7, 76.9 | 10.3 | 0.1 | 5.1, 12.6 | 50.9 | 0.2 | 30.2, 67.1 |
| Complex | 13,662 | 54.8 | 0.1 | 48.1, 62.9 | 7.8 | 0.1 | 3.9, 8.7 | 39.0 | 0.2 | 23.8, 49.9 |
| Flat | 13,656 | 49.0 | 0.1 | 38.6, 56.0 | 5.2 | 0.1 | 2.7, 5.3 | 44.1 | 0.3 | 21.7, 56.4 |
| Upward ramp | 1280 | 51.6 | 0.4 | 45.7, 59.8 | 6.5 | 0.2 | 3.5, 8.4 | 26.8 | 0.3 | 15.9, 36.5 |
| Downward ramp | 258 | 48.0 | 1.0 | 31.7, 59.7 | 5.5 | 0.4 | 3.2, 6.8 | 19.9 | 0.8 | 11.6, 25.6 |
| Inverted u | 501 | 55.5 | 0.7 | 45.0, 67.4 | 5.7 | 0.2 | 3.2, 7.2 | 16.4 | 0.5 | 11.0, 18.4 |
| Short | 26 | 49.6 | 3.1 | 36.1, 65.1 | 4.1 | 0.3 | 3.1, 5.4 | 13.7 | 0.9 | 10.9, 15.6 |
| Split | 1072 | 45.2 | 0.5 | 34.0, 57.2 | 7.4 | 0.5 | 3.1, 7.3 | 68.1 | 1.4 | 38.9, 87.8 |
| Fear call | 299 | 28.0 | 0.5 | 22.9, 31.0 | 2.4 | 0.5 | 1.1, 2.3 | 206.5 | 16.6 | 30.2, 353.7 |
Additional files
-
Source code 1
USV Classification.
Custom-written MATLAB codes to generate spectrograms from multi-channel ultrasonic recordings. The codes also enable semi-automatic identification and manual classification of rat ultrasonic vocalisations.
- https://doi.org/10.7554/eLife.03185.018
-
Source code 2
Whisker Tracking.
Custom-written MATLAB codes to manually track rat whisker and head positions to compute whisking parameters (angle, phase etc).
- https://doi.org/10.7554/eLife.03185.019
Download links
A two-part list of links to download the article, or parts of the article, in various formats.
Downloads (link to download the article as PDF)
Open citations (links to open the citations from this article in various online reference manager services)
Cite this article (links to download the citations from this article in formats compatible with various reference manager tools)
Vocalization–whisking coordination and multisensory integration of social signals in rat auditory cortex
eLife 3:e03185.
https://doi.org/10.7554/eLife.03185


