High temperature sensitivity is intrinsic to voltage-gated potassium channels
- University of California, Davis School of Medicine, United States
Figures
Figure 1
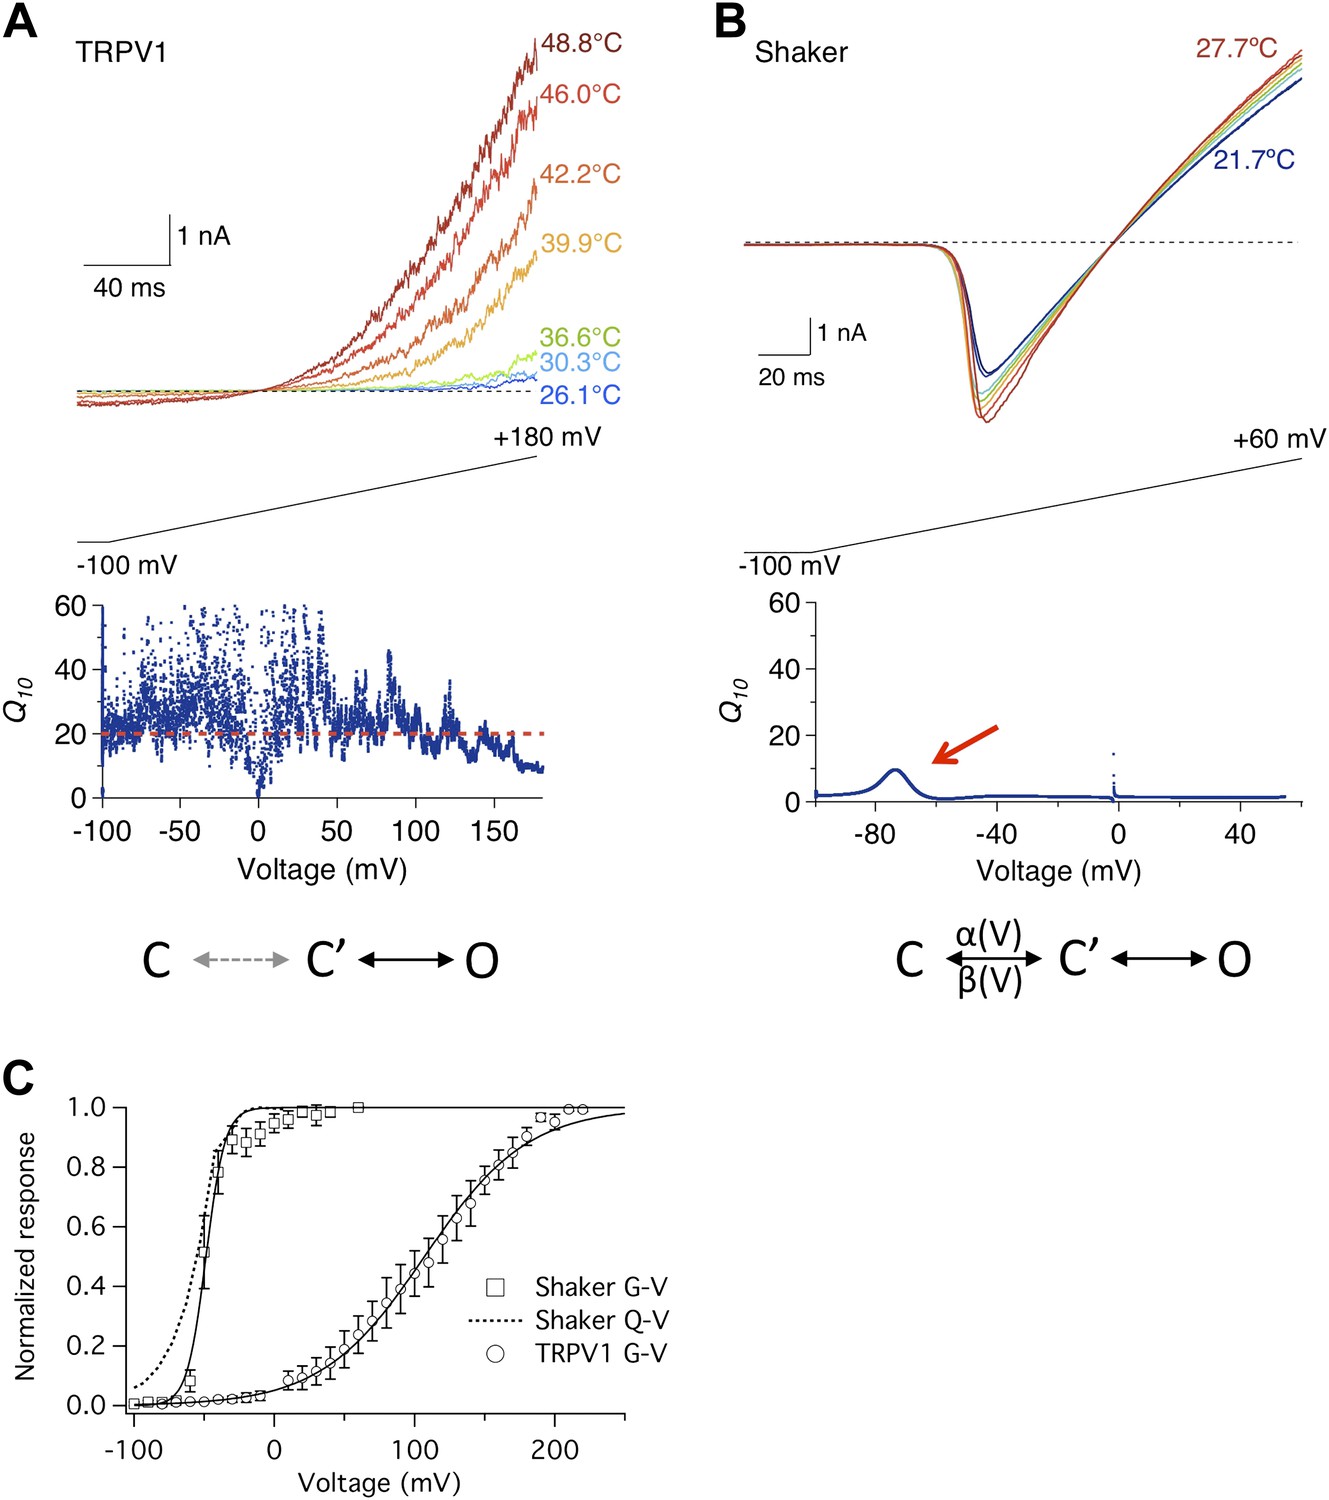
Heat sensitivity of TRPV1 and Shaker channel exhibits distinct voltage dependence.
(A) TRPV1 current was elicited by a voltage ramp at varying temperatures (upper panel). Q10, quantified between 36.6°C and 46.0°C, remains high across the entire voltage range from −100 mV to +150 mV (lower panel). (B) Shaker channels exhibit a low heat sensitivity at most voltages as quantified by Q10 between 22.4°C and 27.7°C. However, Q10 transiently peaks (red arrow) around the voltage (−70 mV) where the channel just starts to open. Simplified gating schemes involving two transitions are shown on the bottom. The C→C′ transition is weakly voltage-dependent for TRPV1 but highly voltage-dependent for Shaker. (C) TRPV1 and Shaker channels show distinct voltage-dependent activation behaviors. TRPV1 conductance (open circle) has a shallow voltage dependence (with an apparent gating charge of 0.76 ± 0.06 e0, n = 4) that occurs in a highly depolarized range (V1/2 = 114.9 ± 10.9 mV, n = 4). Shaker activation has a steep voltage dependence (with an apparent gating charge 5.1 ± 1.3 e0, n = 5) that occurs at hyperpolarized voltages (V1/2 = −54.2 ± 4.7 mV, n = 5). The Q-V curve for Shaker (dotted curve) is reproduced from a published study (Schoppa and Sigworth, 1998).
Figure 2
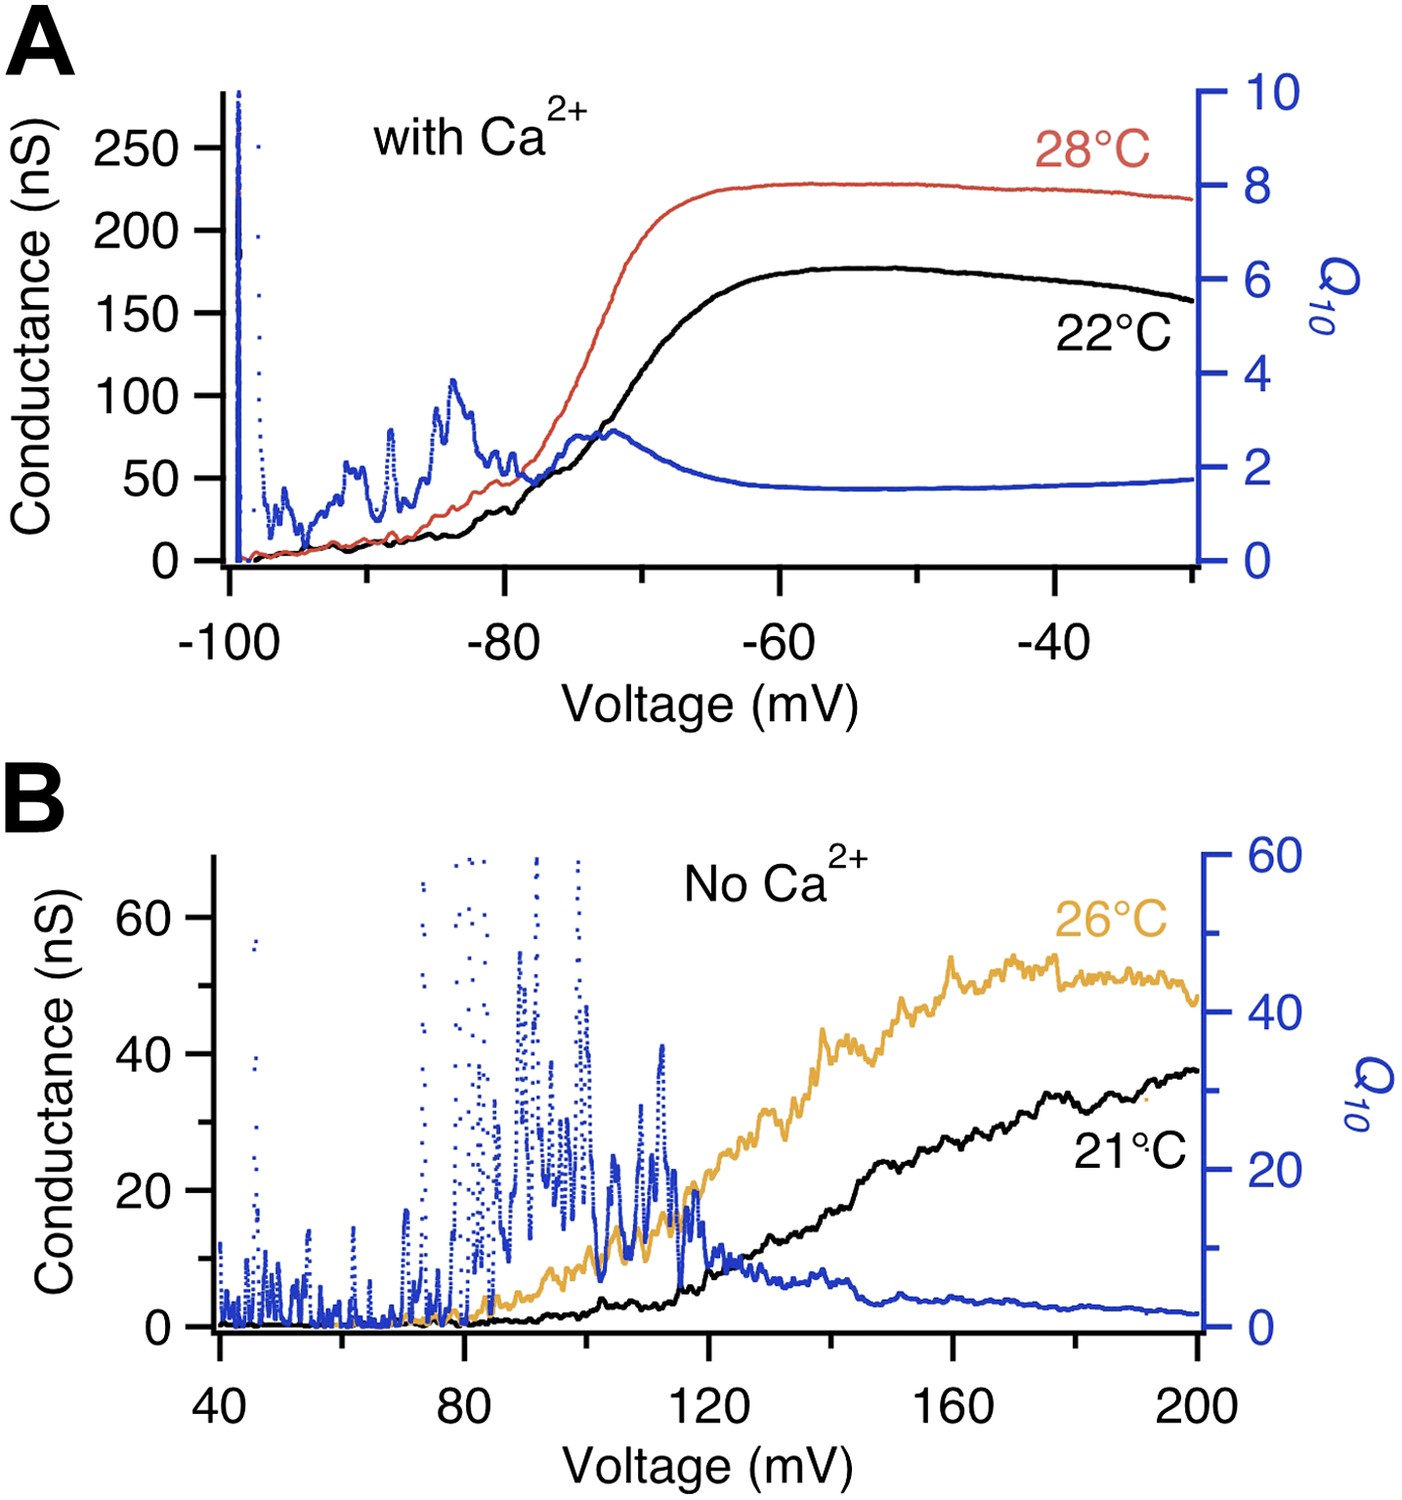
Voltage dependence of BK channel temperature sensitivity shifts with intracellular Ca2+.
Q10 (blue trace, right axis) calculated from temperature-dependent changes in the G-V curves at labeled temperatures (left axis) measured in the absence of Ca2+ (lower panel) are larger in value and shifted more to the right in voltage dependence compared to those measured in presence of saturating Ca2+ (200 μM, upper panel).
Figure 3 with 1 supplement
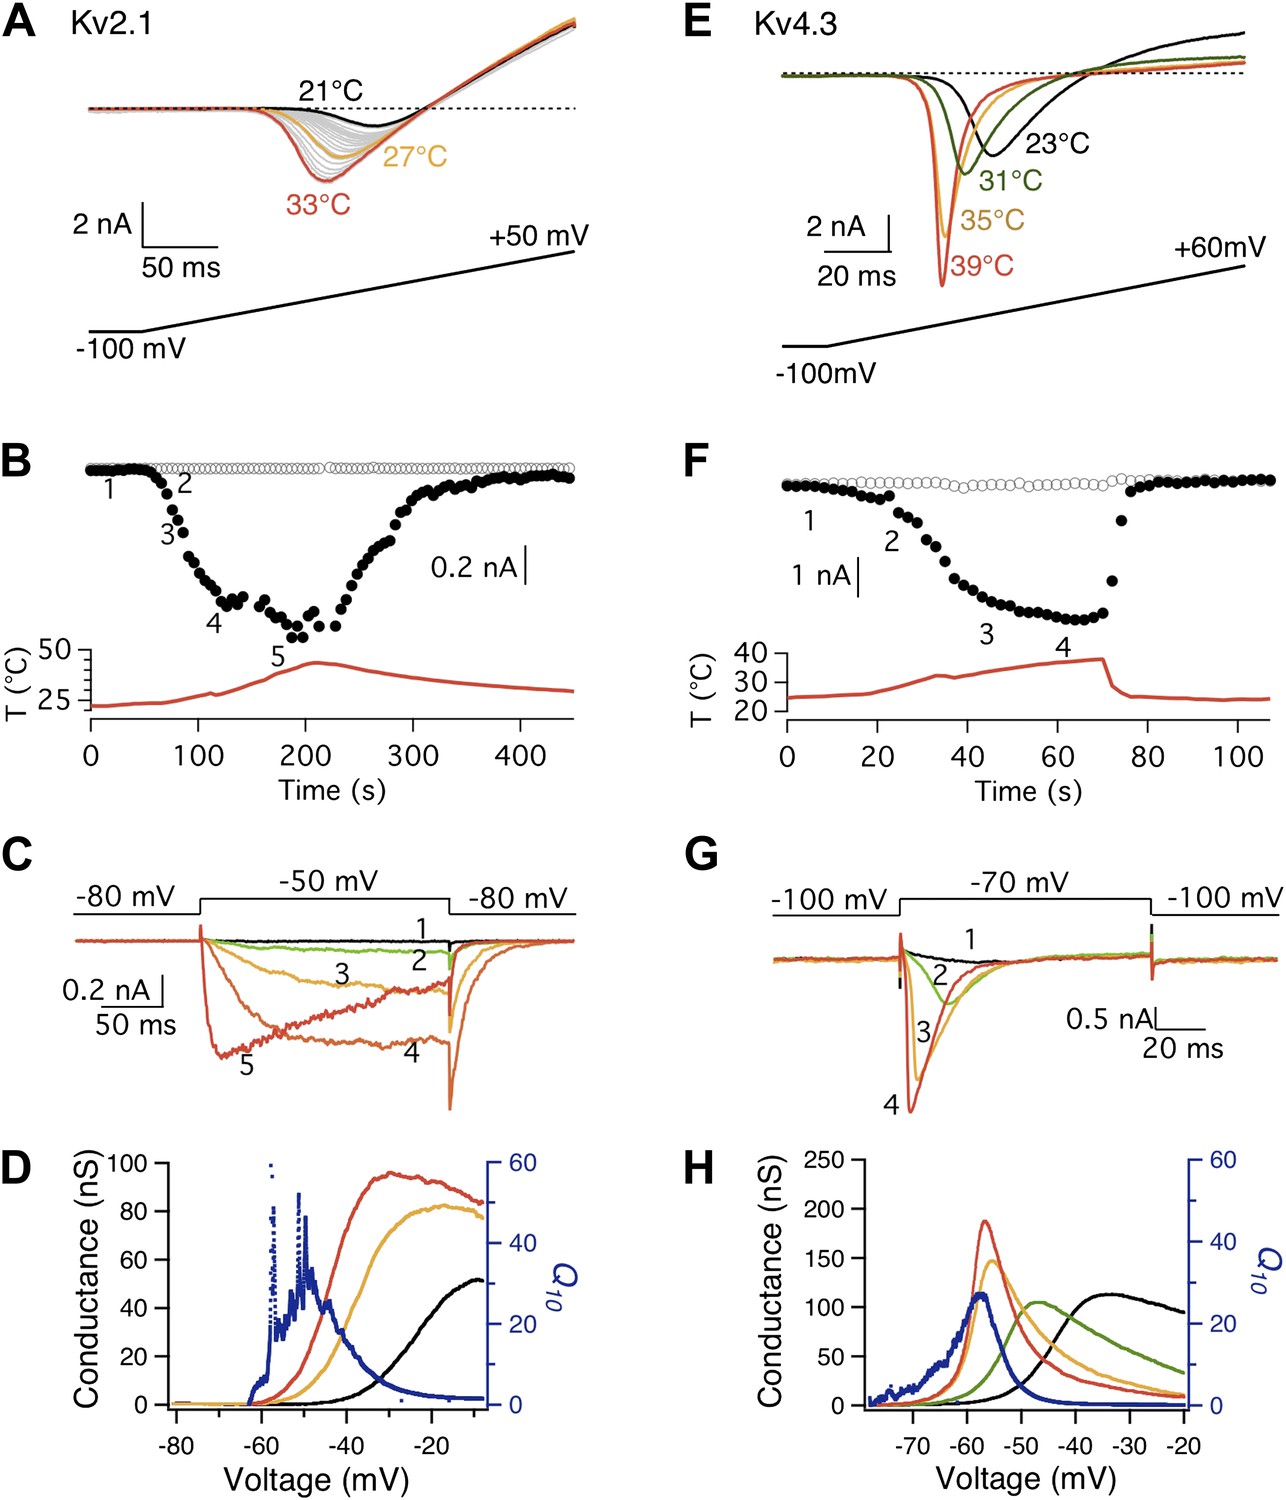
Both Kv2.1 and Kv4.3 channels are highly heat-sensitive within a narrow voltage range.
(A) and (E) Large increases in current were observed from both Kv2.1 and Kv4.3 when temperature was raised. (B) Kv2.1 channels were substantially activated by heat at −50 mV (filled circles) but not at −80 mV (open circles). (C) Representative current traces at time points shown in (B). (F) and (G) Similar behaviors as Kv2.1 were observed with Kv4.3. (D) and (H) Voltage dependence of G-V curves (left axis) and Q10 (right axis) for Kv2.1 (D) and Kv4.3 (H). G-V curves are color-coded as in (A) and (E), respectively. Q10 peaks in the range where the channel just starts to be voltage-activated.
Figure 3—figure supplement 1
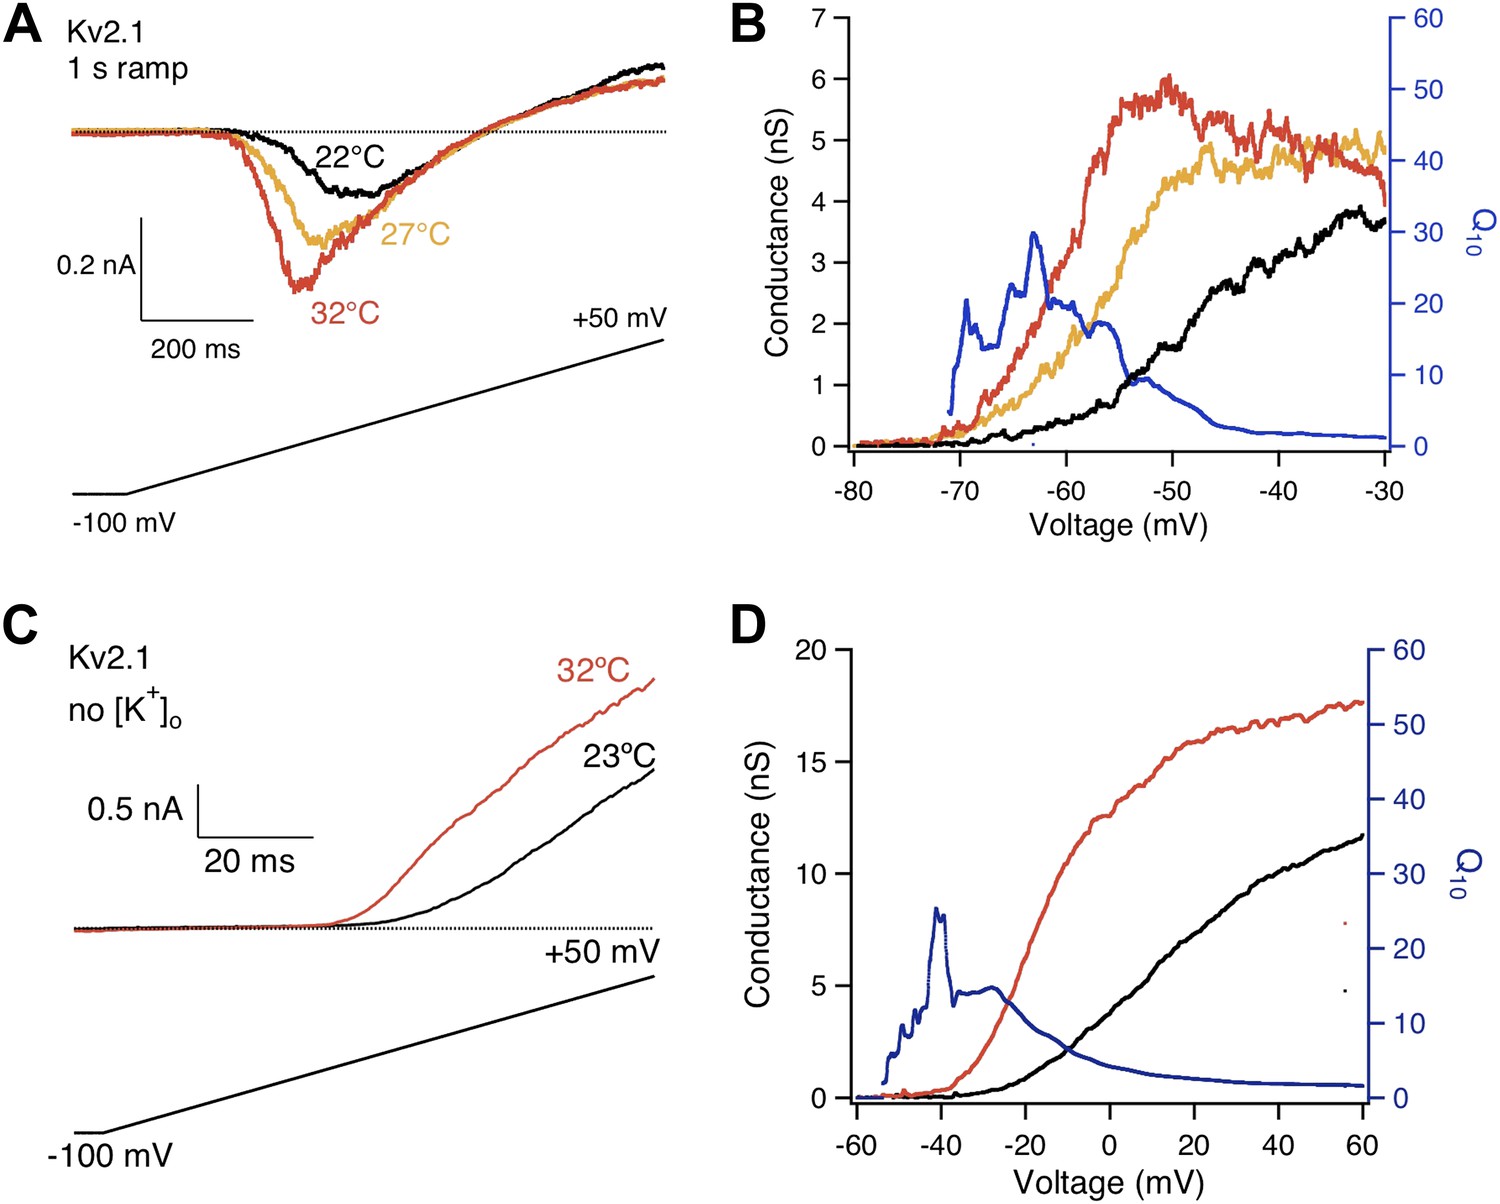
High heat sensitivity of Kv2.1 channels was robustly observed when the length of voltage ramp and extracellular K+ concentration were changed.
(A) The length of voltage ramp from −100 mV to +50 mV was increased from 200 ms to 1 s. With this slowed voltage ramp large increases in current were still observed from Kv2.1 when temperature was raised. (B) Voltage dependence of G-V curves (left axis) and Q10 (right axis) for Kv2.1 with the slow voltage ramp. (C) 130 mM extracellular K+ was replaced with 130 mM Na+. Large increases in current were still observed from Kv2.1 when temperature was raised. (D) Voltage dependence of G-V curves (left axis) and Q10 (right axis) for Kv2.1 with 130 mM extracellular Na+.
Figure 4
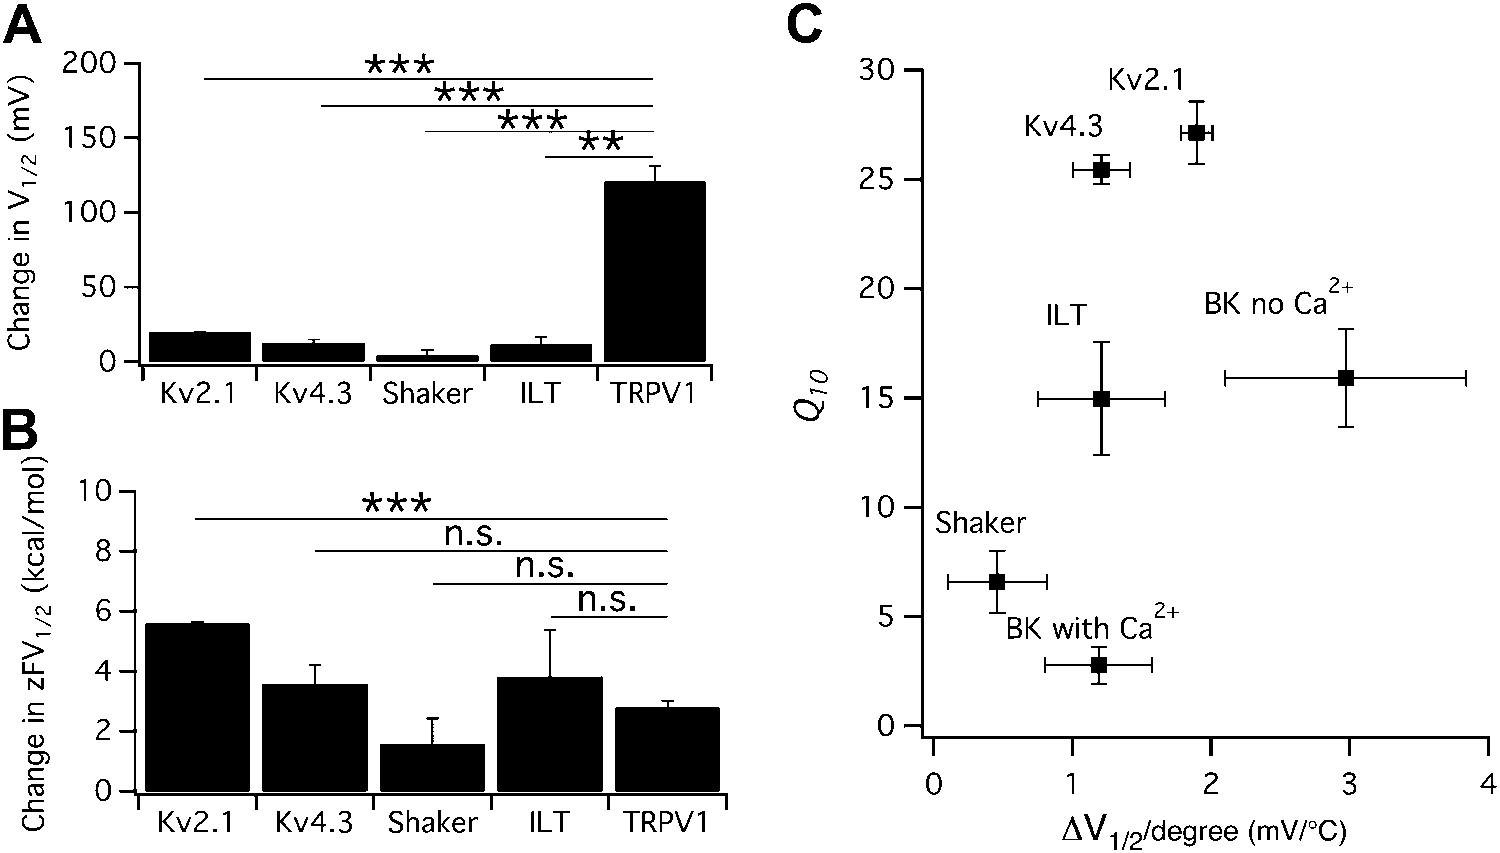
Heat-induced shift in V1/2 is not responsible for high temperature sensitivity.
(A) Changes in V1/2 were induced by raising temperature from the room temperature to a level that maximally activated the channels (n = 3-to-4). (B) Corresponding changes in free energy were calculated as , where z is the total gating charge, F is Faraday's constant. n = 3-to-4. Values of z for Kv channels are based on published work (Schoppa and Sigworth, 1998; Islas and Sigworth, 1999; Dougherty and Covarrubias, 2006). **p<0.01; ***p<0.001; n.s., no significance. (C) Q10 value of each channel type was plotted against the temperature-induced shift in V1/2. At similar levels of shift in V1/2, both large and small Q10 values were observed, suggesting that shift in V1/2 is not responsible for high temperature sensitivity. n = 3-to-4.
Figure 5
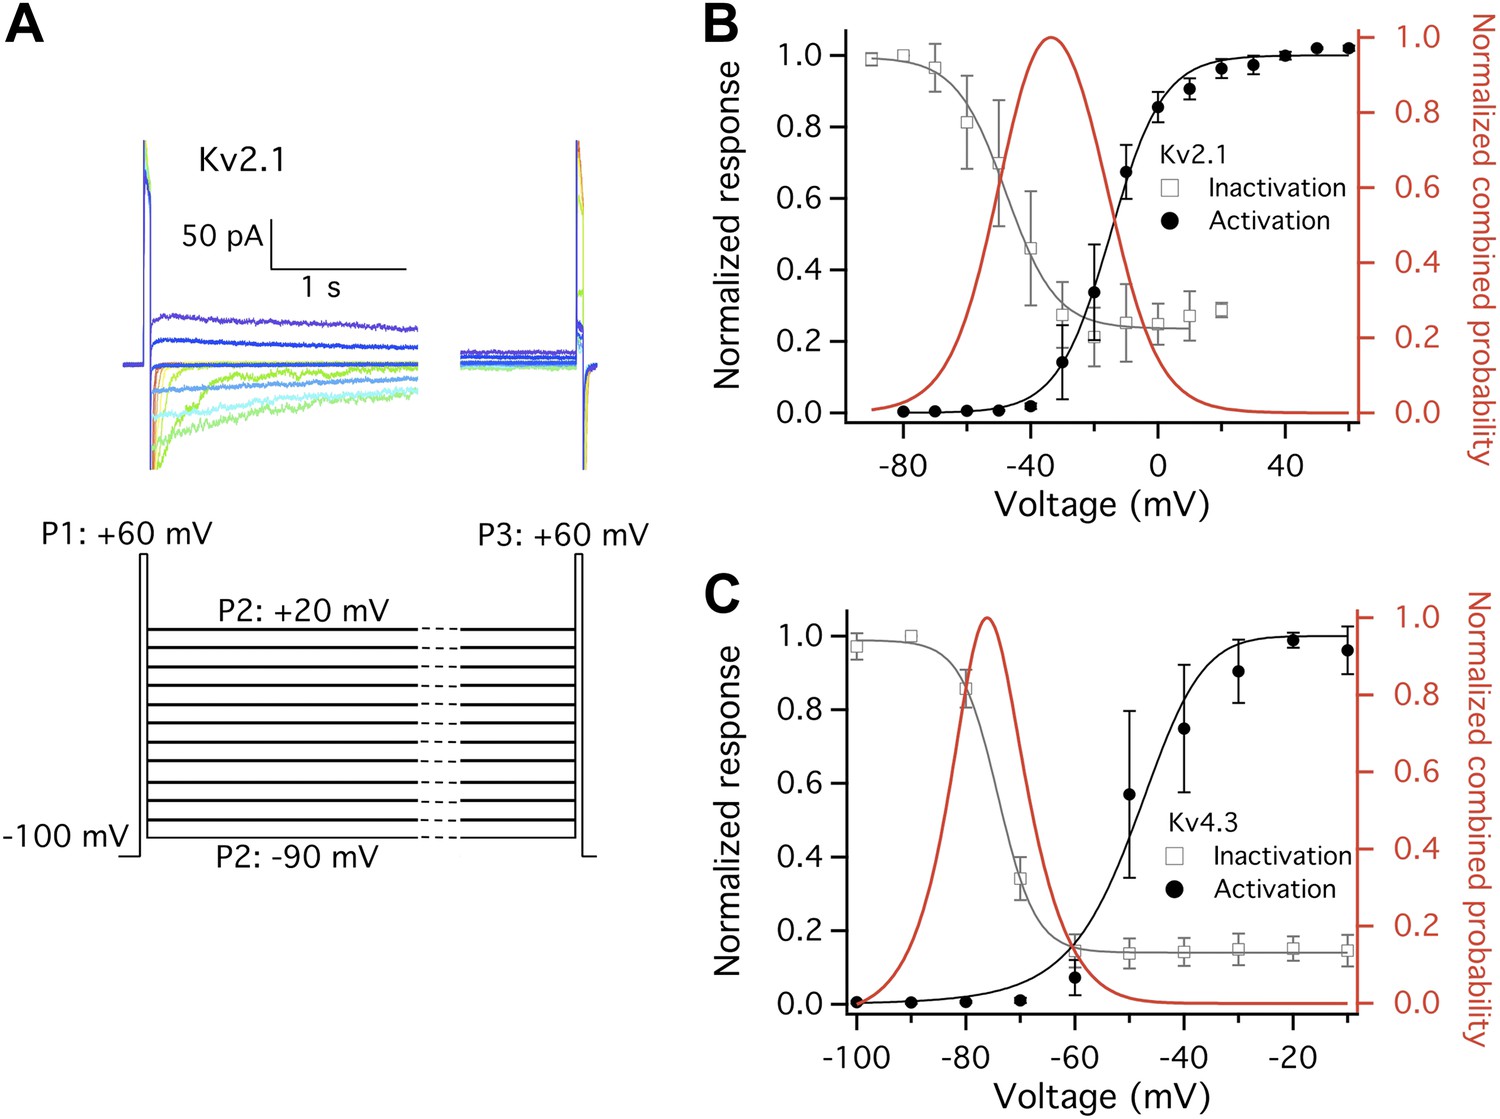
Closed state inactivation (CSI) and channel activation overlap within specific voltage ranges.
(A) Representative current recordings of Kv2.1 CSI. Length of the P2 segment was 10 s. Current measured at P3 was normalized to that measured at P1. The normalized current was then plotted against P2 voltage for voltage dependence of CSI. (B) For Kv2.1, the voltage dependence of both CSI (open squares) and activation (filled circles) follows a single-Boltzmann function (left axis). After normalization the two Boltzmann functions were multiplied to yield the red curve (right axis). This combined probability curve surges in the voltage range where the channels are only slightly activated while significant CSI occurs, which overlaps with the voltage range where high heat sensitivity is observed. (C) Similar voltage dependences of CSI and activation were observed for Kv4.3. n = 3-to-5.
Figure 6
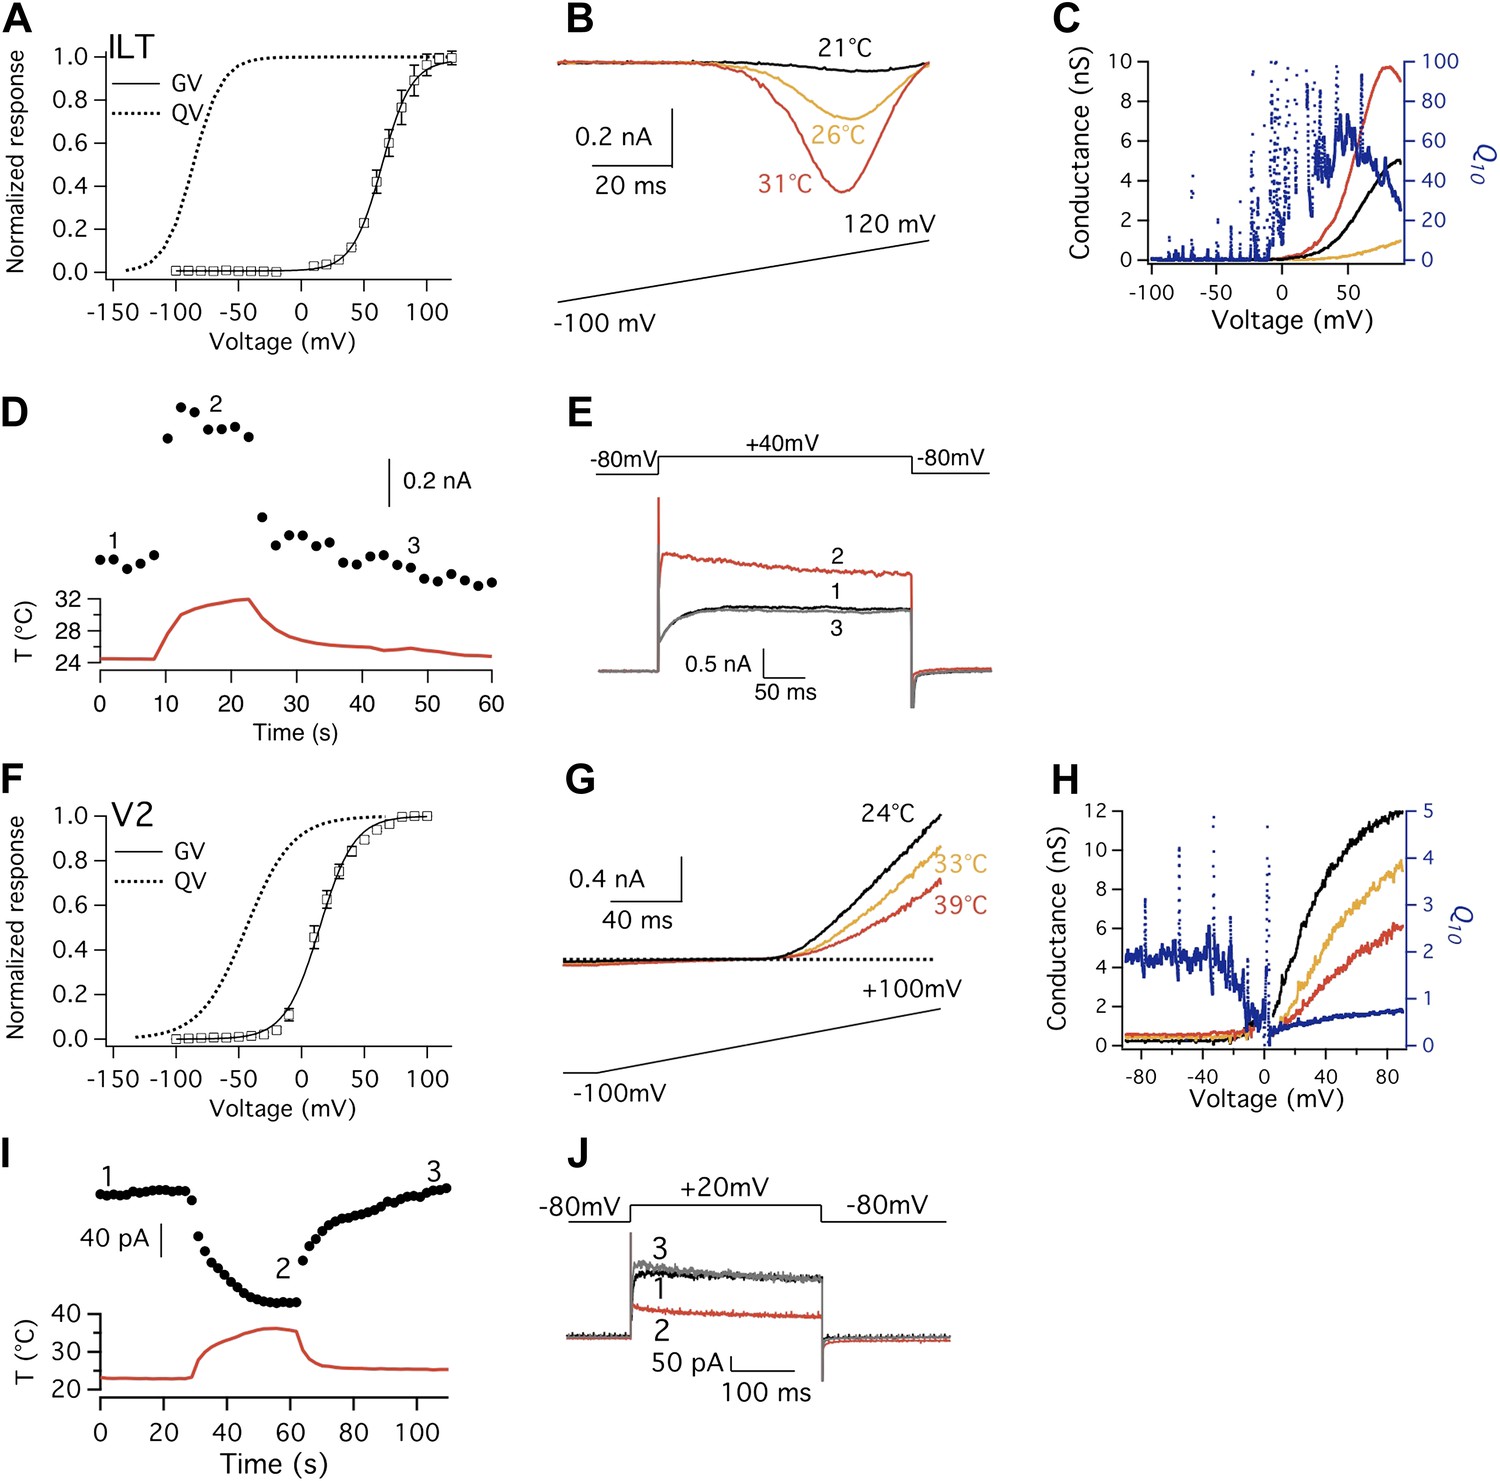
Shaker ILT and V2 mutants exhibit large but opposite heat responses.
(A) and (F) Conductance-voltage (G-V; n = 3-to-6) and gating charge-voltage (Q-V) curves for ILT (A) and V2 (F). Q-V curves for ILT and V2 are reproduced from published studies (Schoppa and Sigworth, 1998; Ledwell and Aldrich, 1999). (B) Large increases in current are observed from ILT when temperature was raised. To increase current amplitude when driving voltage was small, extracellular solution contained 130 mM KCl, while intracellular solution contained 130 mM NaCl. (C) Voltage dependence of Q10 for ILT based on G-V curves derived from (B). (D) and (E) ILT channels were substantially activated by heat at +40 mV. (G) In contrast to the ILT current, V2 current decreases upon temperature rise. (H) Voltage dependence of Q10 for V2 based on G-V curves derived from (G). Q10 drops below 1 when voltage reaches a level that the channel starts to open, as increasing temperature deactivates the channel. (I) and (J) V2 channels were substantially deactivated by heat at +20 mV.
Figure 7
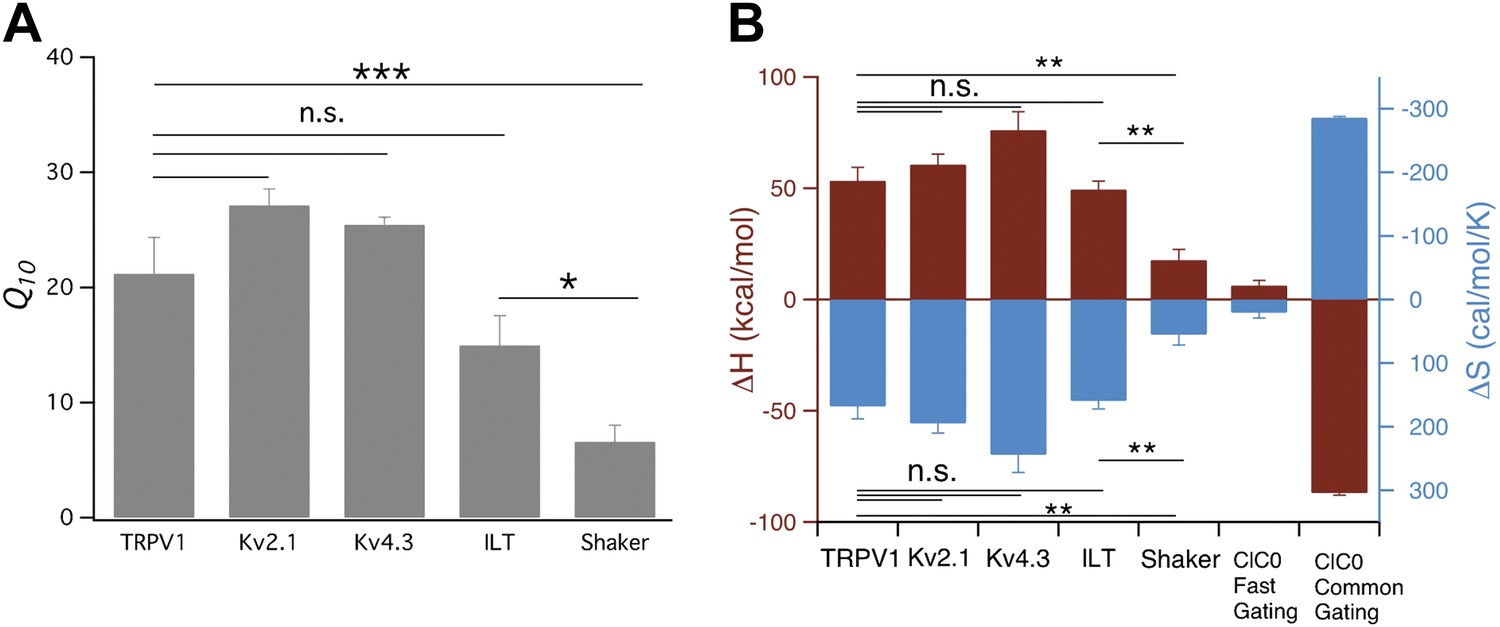
Comparison of Q10 (A) and thermodynamic measurements (B) between TRPV1, Kv and CLC-0 channels.
Data for CLC-0 are reproduced from published results (Yang et al., 2010). n = 3-to-6; *p<0.05; **p<0.01; ***p<0.001; n.s., no significance.
Download links
A two-part list of links to download the article, or parts of the article, in various formats.
Downloads (link to download the article as PDF)
Open citations (links to open the citations from this article in various online reference manager services)
Cite this article (links to download the citations from this article in formats compatible with various reference manager tools)
High temperature sensitivity is intrinsic to voltage-gated potassium channels
eLife 3:e03255.
https://doi.org/10.7554/eLife.03255


