Coding of stimulus strength via analog calcium signals in Purkinje cell dendrites of awake mice
- University of Pennsylvania, United States
- Princeton University, United States
Figures
Figure 1
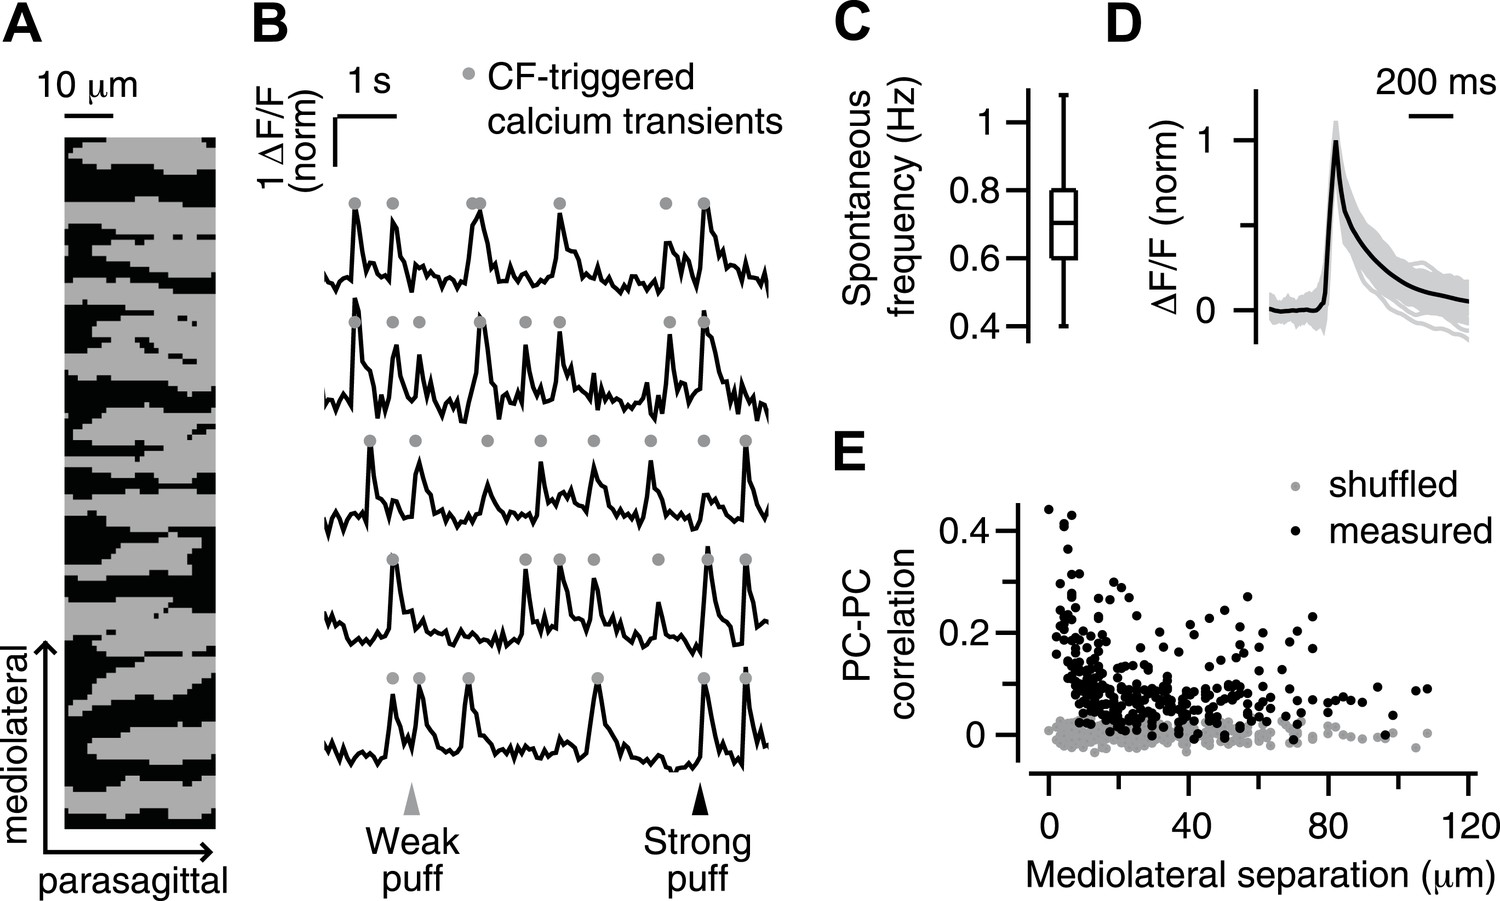
Imaging climbing fiber-triggered calcium transients in Purkinje cell dendrites.
(A) Field of view of an example experiment including 15 dendrites. (B) Example fluorescence traces of some of the dendrites in (A). Triangles indicate periocular airpuff stimuli of different strengths. Circles mark CF-triggered calcium events. (C) Box plot showing frequency of spontaneous calcium events across all dendrites. (D) Mean ΔF/F trace of spontaneous calcium events for all dendrites (gray lines; mean: black). (E) Pearson correlation coefficient of calcium events in pairs of dendrites as a function of the mediolateral separation (black: real data; gray: shuffled-frame control data).
Figure 2

Location of imaged spots.
(A) Dorsal view of an exposed cerebellum showing all imaged spots (colored dots). Colors indicate the fraction of periocular-responsive dendrites in each spot. (B) Spots examined for response laterality are shown. Colors indicate the fraction of ipsi-specific dendrites in each spot. IC: Inferior Colliculus. IV–V, VI, VII, Simplex, and CrusI/II: cerebellar lobules. pf: primary fissure. Dashed line: midline. (C) Top: example ΔF/F traces from an ipsi-specific spot in response to ipsilateral (black, left) and contralateral (gray, right) airpuff stimuli. Bottom: each row shows PSTH of a dendrite in the example ipsi-specific spot in response to ipsi- and contra-lateral stimuli (left, right, respectively). (D) Same as (C), but an example bilateral spot is shown.
Figure 3
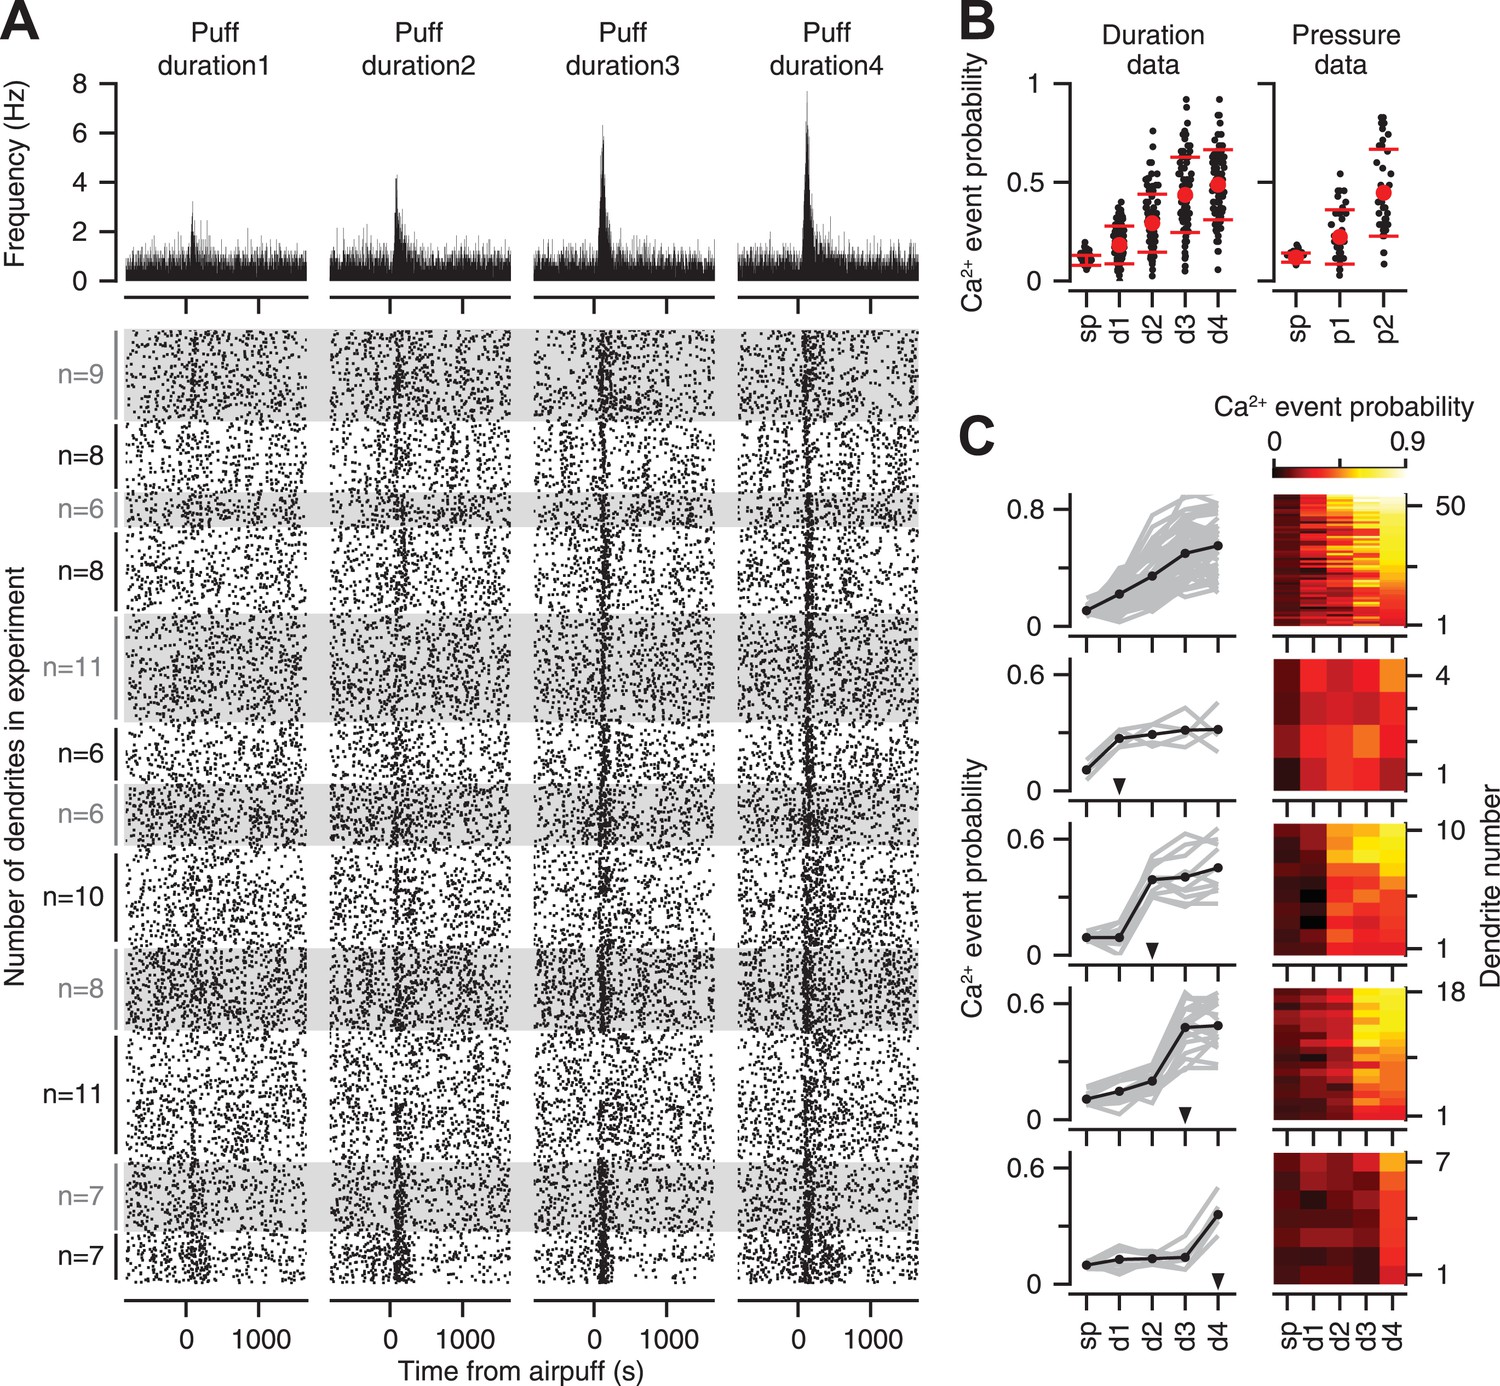
Calcium-event probability encodes stimulus strength.
(A) Bottom: raster plots represent all trials of the duration dataset. Dots indicate calcium events. White and gray shades mark different experiments. For each experiment, all the trials corresponding to an individual dendrite are arranged consecutively. Number of dendrites imaged in each experiment is indicated on the left. Top: PSTHs, corresponding to the raster plots, indicate calcium event frequency at each time point. (B) Calcium-event probability for the spontaneous (sp) and airpuff-evoked conditions (d1–d4, p1–p2) (black: individual dendrites; red: mean ± SEM; left: duration data; right: pressure data). (C) Top to bottom: five dendrite categories based on how calcium-event probability varies with airpuff duration. For each category, calcium-event probability of individual dendrites (left: gray lines; right: rows of heatmaps) and their average (left, black lines) is shown. Triangles (left): The threshold of airpuff duration for evoking calcium events. Colors (right): calcium-event probability. d1–d4: different airpuff durations. p1–p2: different airpuff pressures.
Figure 4
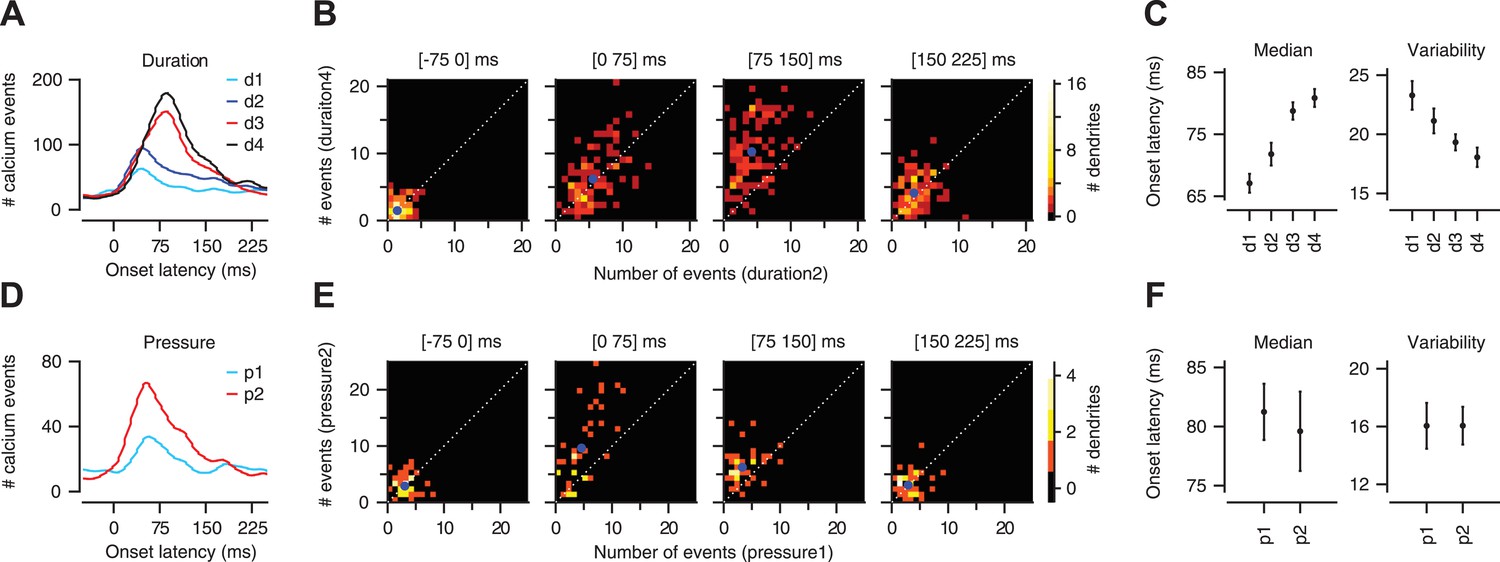
Calcium-event latency is modulated by stimulus strength.
(A) Onset-latency distributions of calcium events for duration data. (B) Each panel corresponds to a particular latency interval (indicated in the title) and compares for each dendrite (dots) the number of events evoked by two different durations of airpuff (y-axis: longer duration; x-axis: shorter duration; blue dot: mean; dashed: unity line). (C) Median onset latency (left) and variability (median of absolute deviation from median) of onset latency (right). Circles: average across dendrites; Error bars: SEM. (D–F) Same as (A–C), but for pressure data.
Figure 5
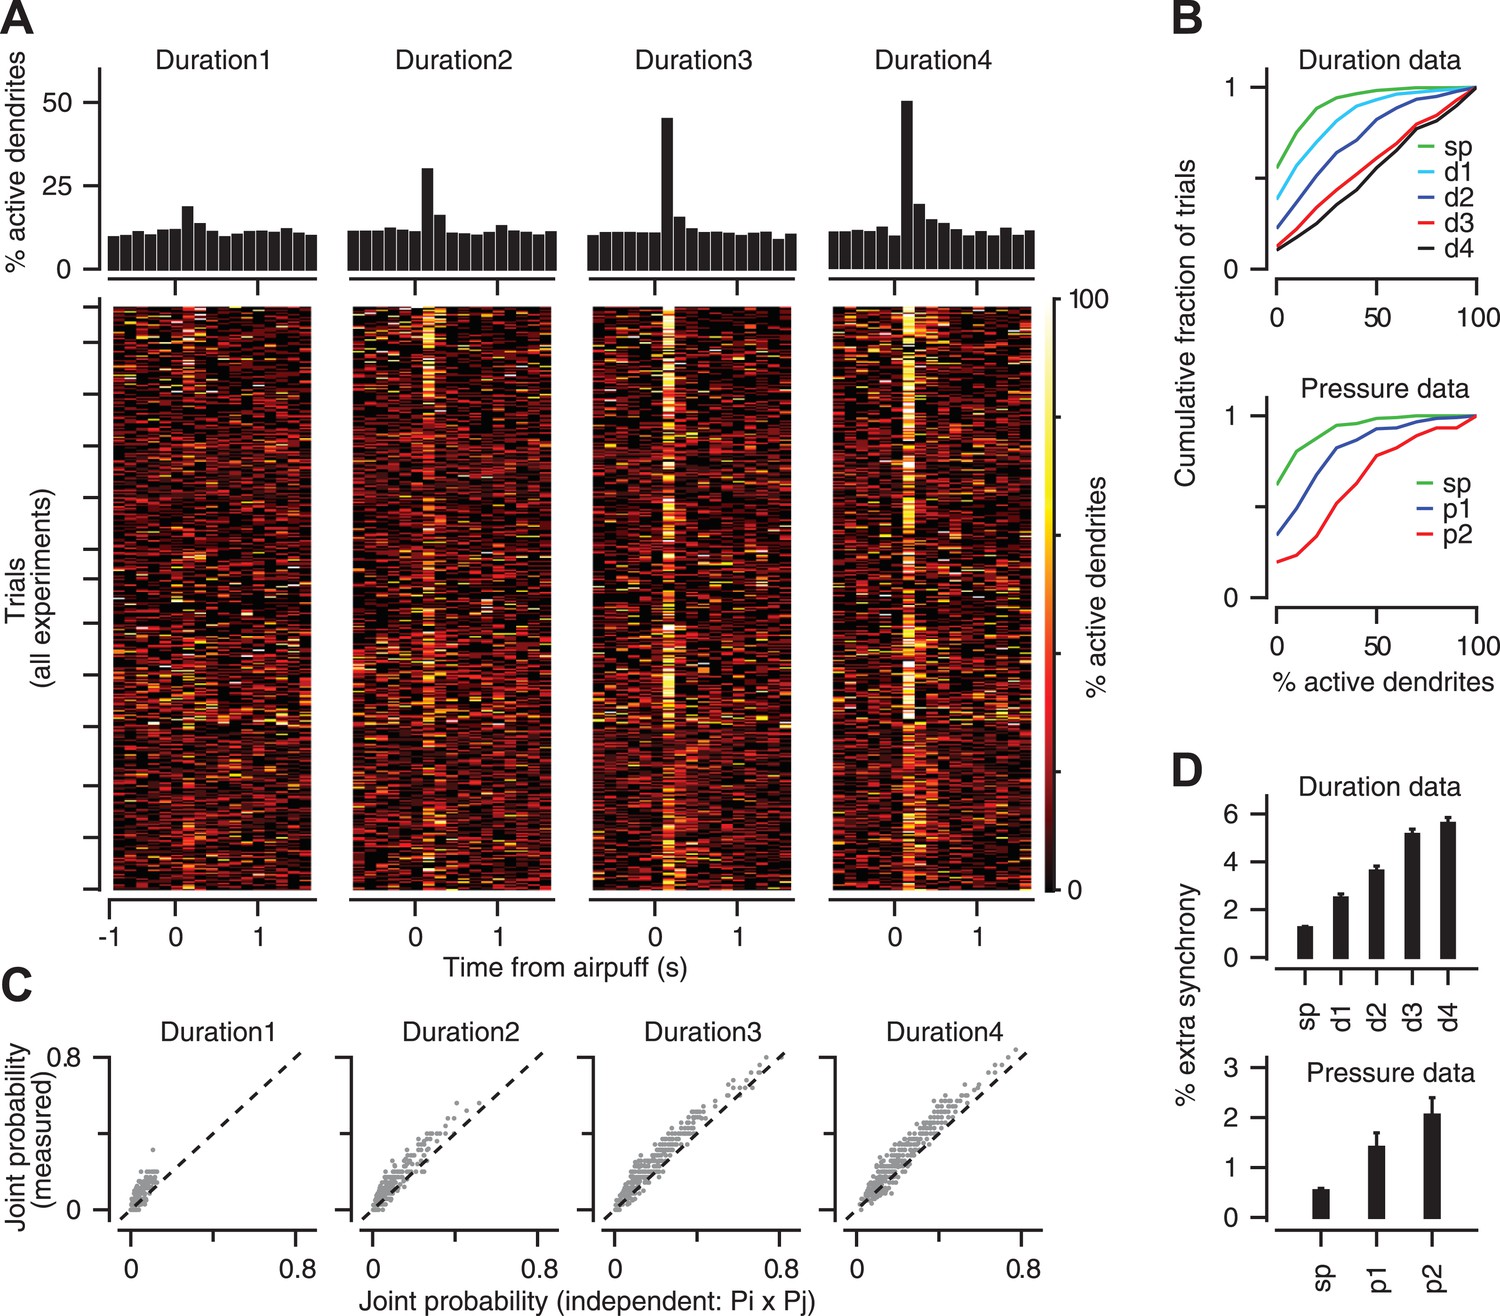
Population coding of stimulus strength.
(A) Bottom: % coactive dendrites at different time points for all trials of the duration data. Colors indicate % coactivation. Top: PSTHs correspond to heatmaps at the bottom and show the average coactivation across all trials at each time point surrounding the stimulus. (B) Cumulative distribution of % coactive dendrites across all trials for the spontaneous (sp) and airpuff-evoked conditions (top: duration data; bottom: pressure data). (C) Measured and independent joint probabilities are shown for each dendrite pair (gray; dashed: unity line) for different airpuff durations. (D) % extra synchrony (measured minus independent joint probability) averaged across all dendrite pairs (error bars: SEM; sp: spontaneous; d1–d4: different airpuff durations. p1–p2: different airpuff pressures).
Figure 6
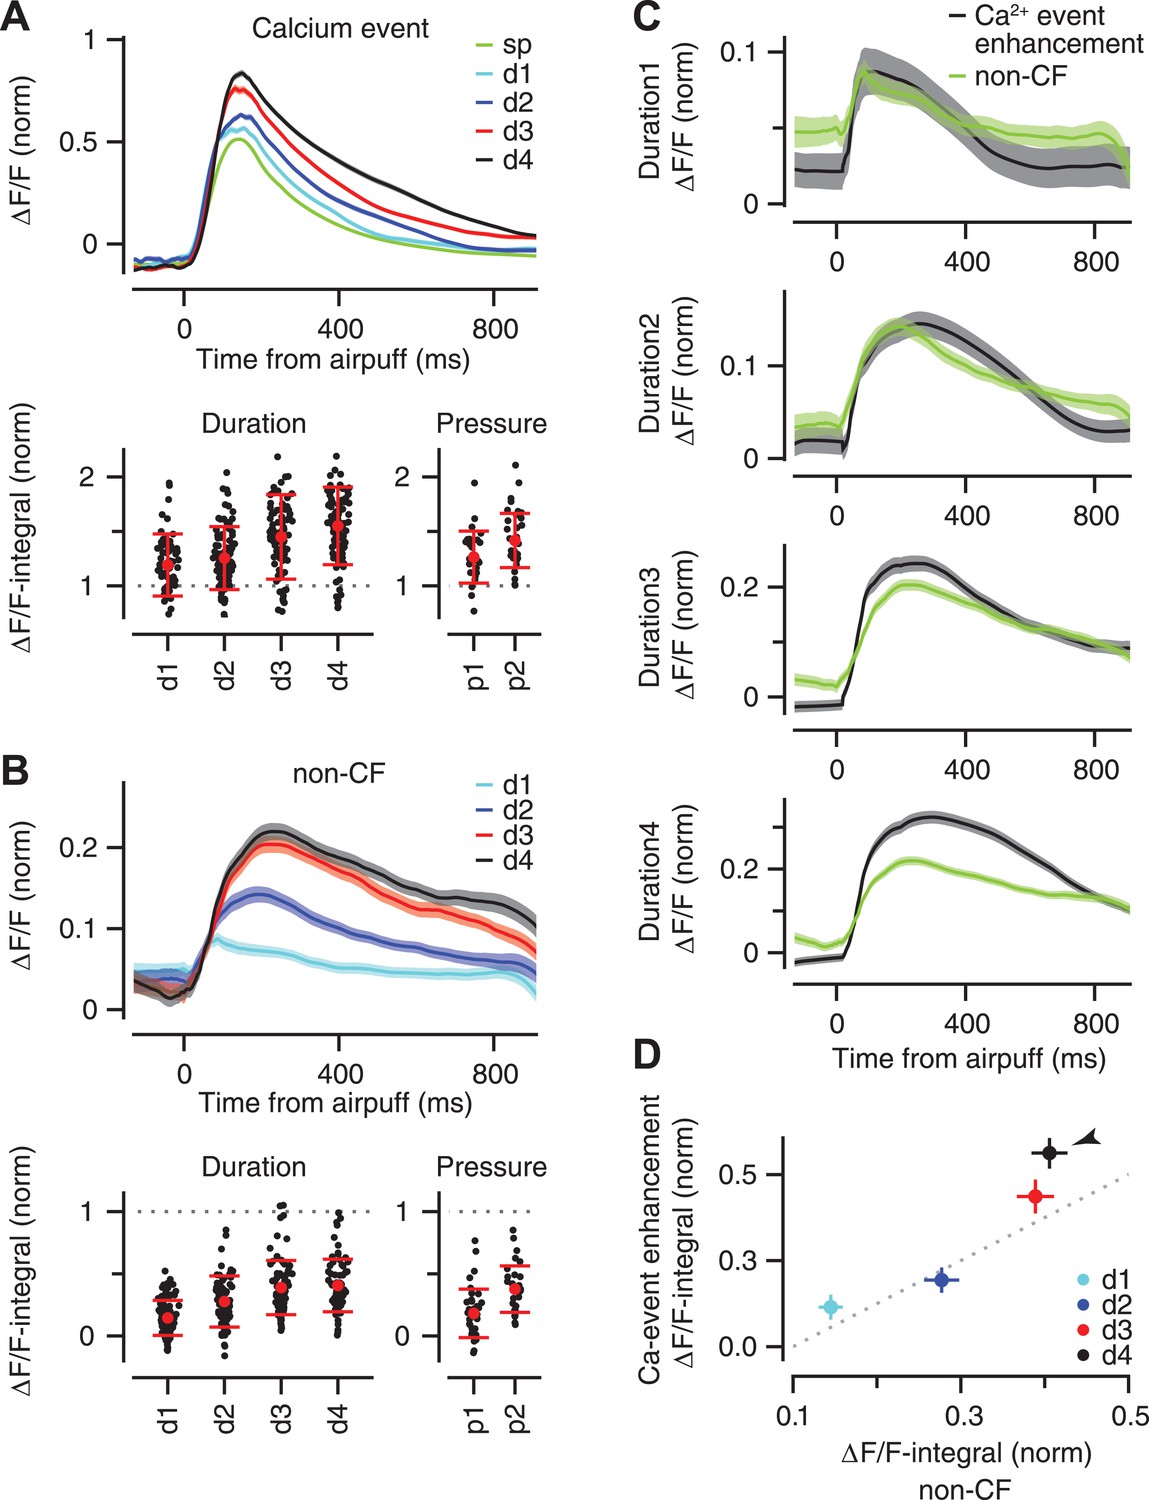
Stimulus strength is represented in the size of calcium events and size of non-CF signals.
(A) Top: mean ΔF/F trace of calcium events across all dendrites for the spontaneous (‘sp’, green) and airpuff-evoked conditions (d1–d4: different airpuff durations; shades: SEM). Bottom: mean size of calcium events (‘ΔF/F-integral’) shown for each dendrite (black dots). Left: duration data: Right: pressure data. ΔF/F-integral values are normalized to the mean size of spontaneous events (dashed line). Red: mean ± SEM. (B) Same as (A), but for the non-CF signal. (C) Each panel corresponds to a duration of airpuff, and compares ΔF/F traces of calcium-event enhancement (i.e., evoked minus spontaneous event; black) and non-CF signal (green) in response to that particular airpuff duration (lines: mean across dendrites; shades: SEM). (D) Mean size of calcium-event enhancement is compared with mean size of non-CF signal for different airpuff durations (d1–d4; circles: average across dendrites; bars: SEM; dashed: unity line; ΔF/F-integral values are normalized to the mean size of spontaneous events. Arrowhead marks the longest duration airpuff, for which supralinearity is evident).
Download links
A two-part list of links to download the article, or parts of the article, in various formats.
Downloads (link to download the article as PDF)
Open citations (links to open the citations from this article in various online reference manager services)
Cite this article (links to download the citations from this article in formats compatible with various reference manager tools)
Coding of stimulus strength via analog calcium signals in Purkinje cell dendrites of awake mice
eLife 3:e03663.
https://doi.org/10.7554/eLife.03663


