Dopamine receptor 1 neurons in the dorsal striatum regulate food anticipatory circadian activity rhythms in mice
- California Institute of Technology, United States
- University of Washington, United States
- Claremont McKenna, Pitzer and Scripps Colleges, United States
- Simon Fraser University, Canada
- California State Polytechnic University Pomona, United States
- Howard Hughes Medical Institute, University of Washington, United States
Figures
Figure 1
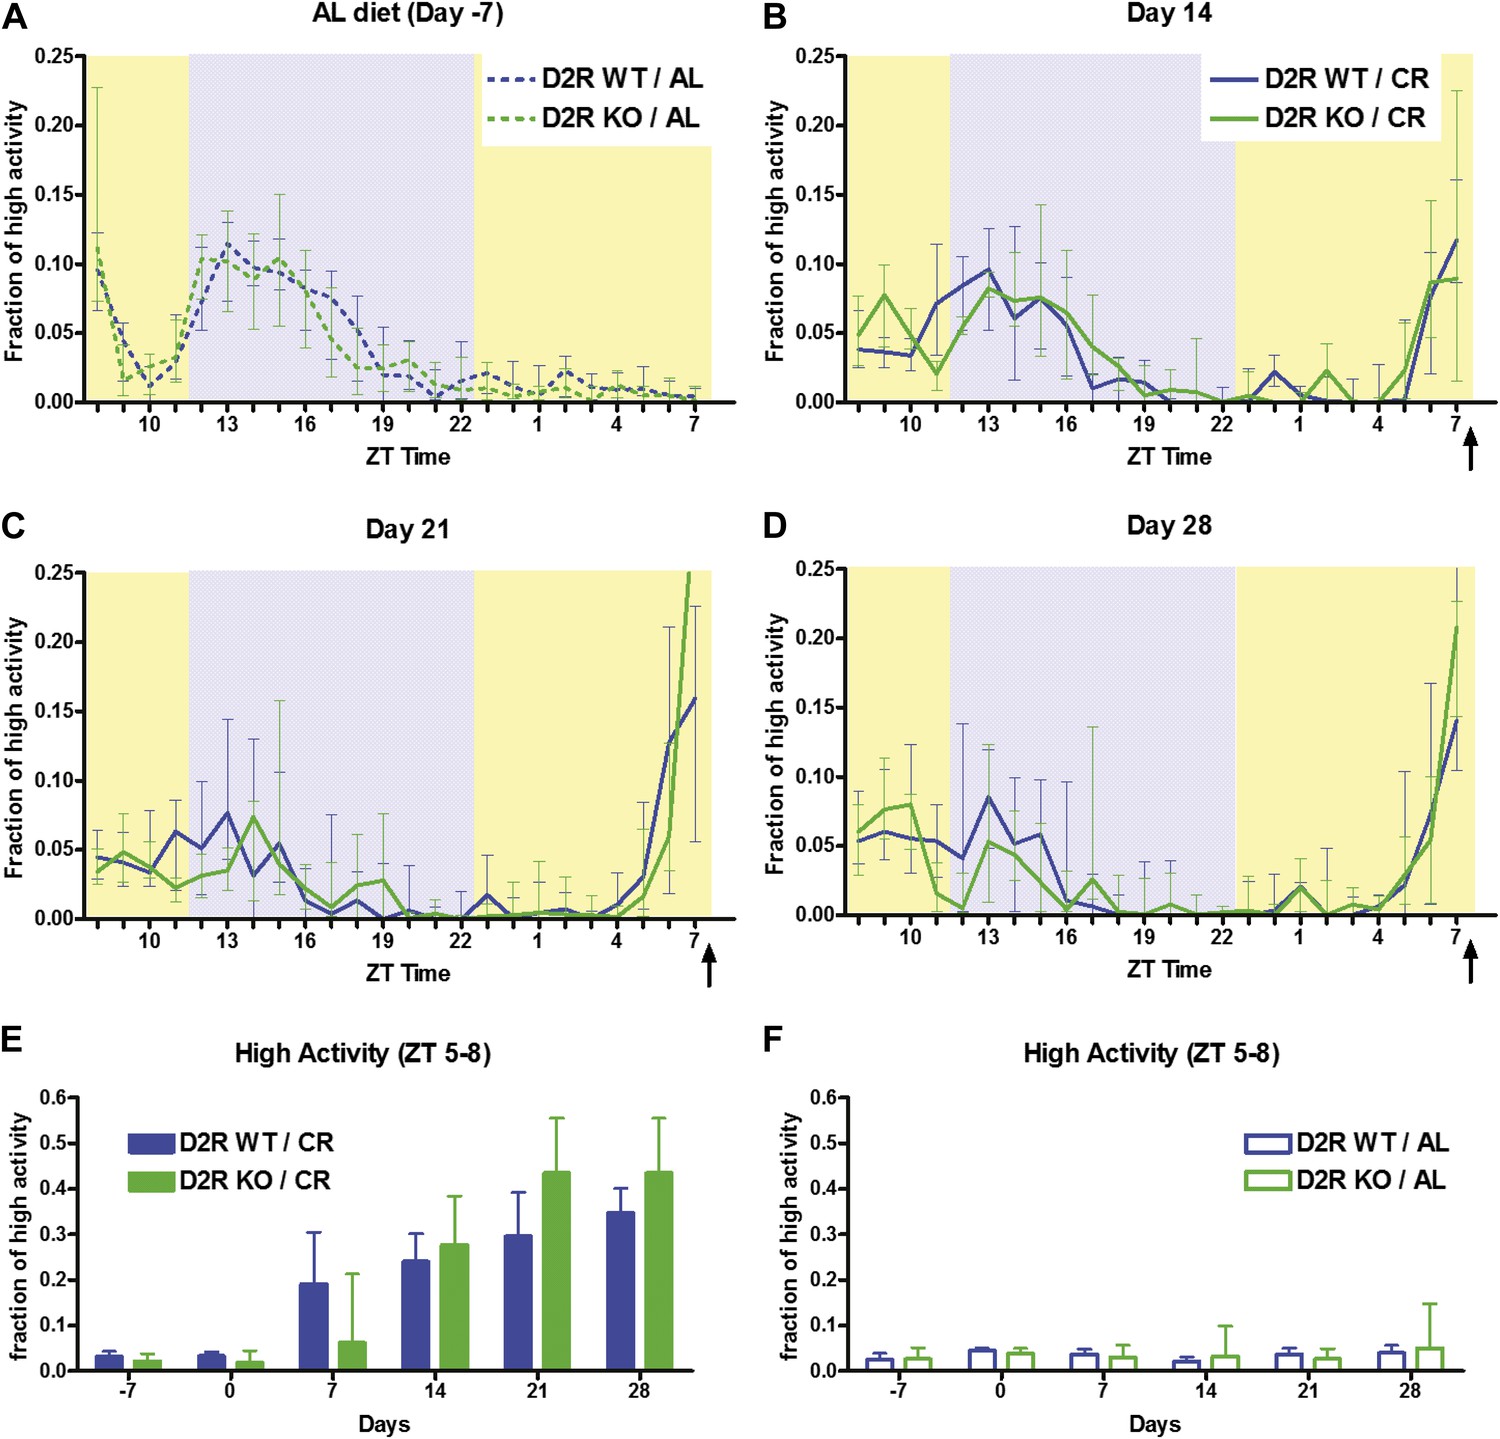
Activity of D2R KO mice and WT mice on 60% CR.
(A) The fraction of all recorded frames within each 1-hr bin on day -7 when the mice were walking, hanging, jumping, or rearing. All mice were still on an ad libitum diet. (B, C, D) The fraction of high activity frames for D2R WT (n = 12) and KO (n = 8) mice in each 1-hr bin on days 14, 21, and 28 of CR. Arrows indicate the bin in which the calorie restricted meal was delivered (ZT 8). Shaded boxes represent lights-off and yellow boxes indicated lights on. (E) The fraction of high activity in the 3 hr before feeding time (ZT 5–8) on days -7, 0, 7, 14, 21, and 28 of the study for mice on CR diets. (F) The fraction of high activity in the 3 hr before feeding time (ZT 5–8) for mice on ad libitum diets. There were no significant differences (Mann–Whitney) in fraction of high activity between D2R WT and KO mice. Median data are plotted with error bars indicating interquartile ranges.
Figure 2 with 3 supplements
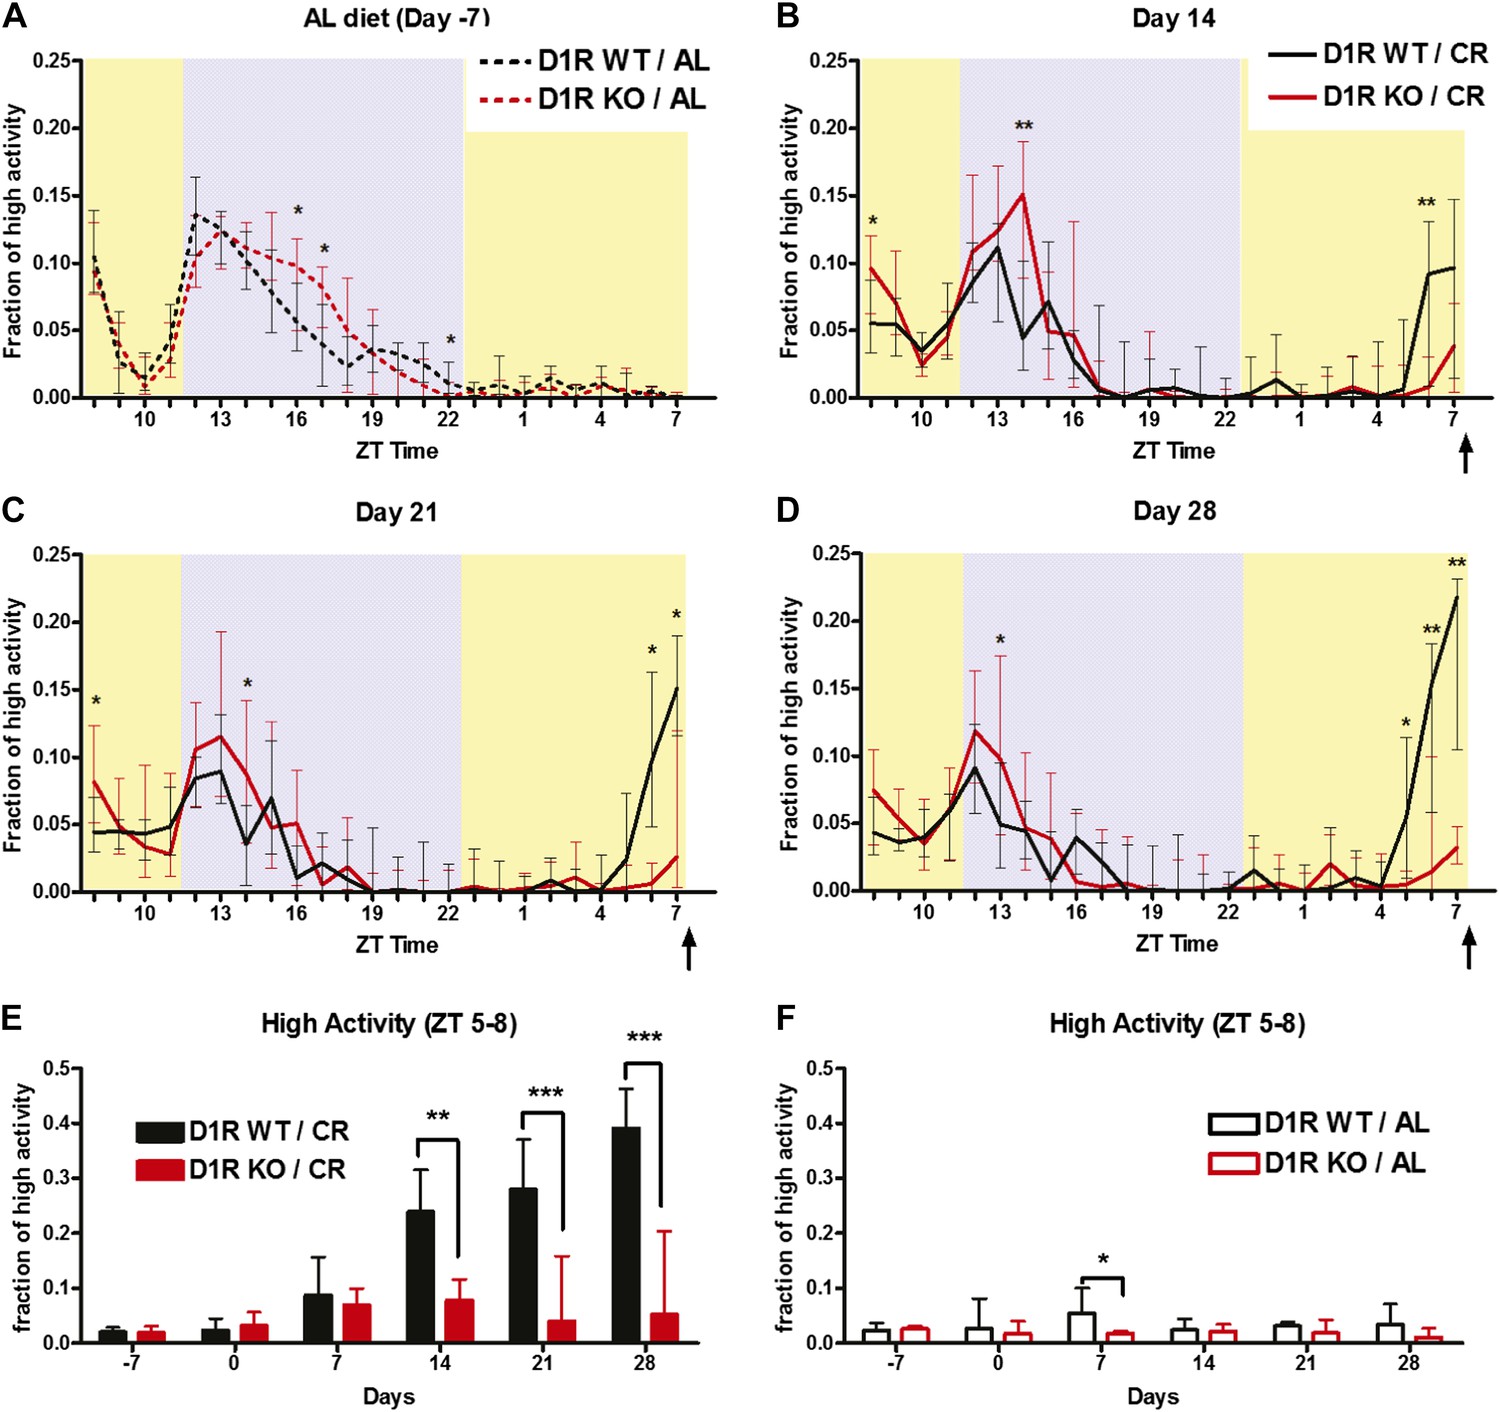
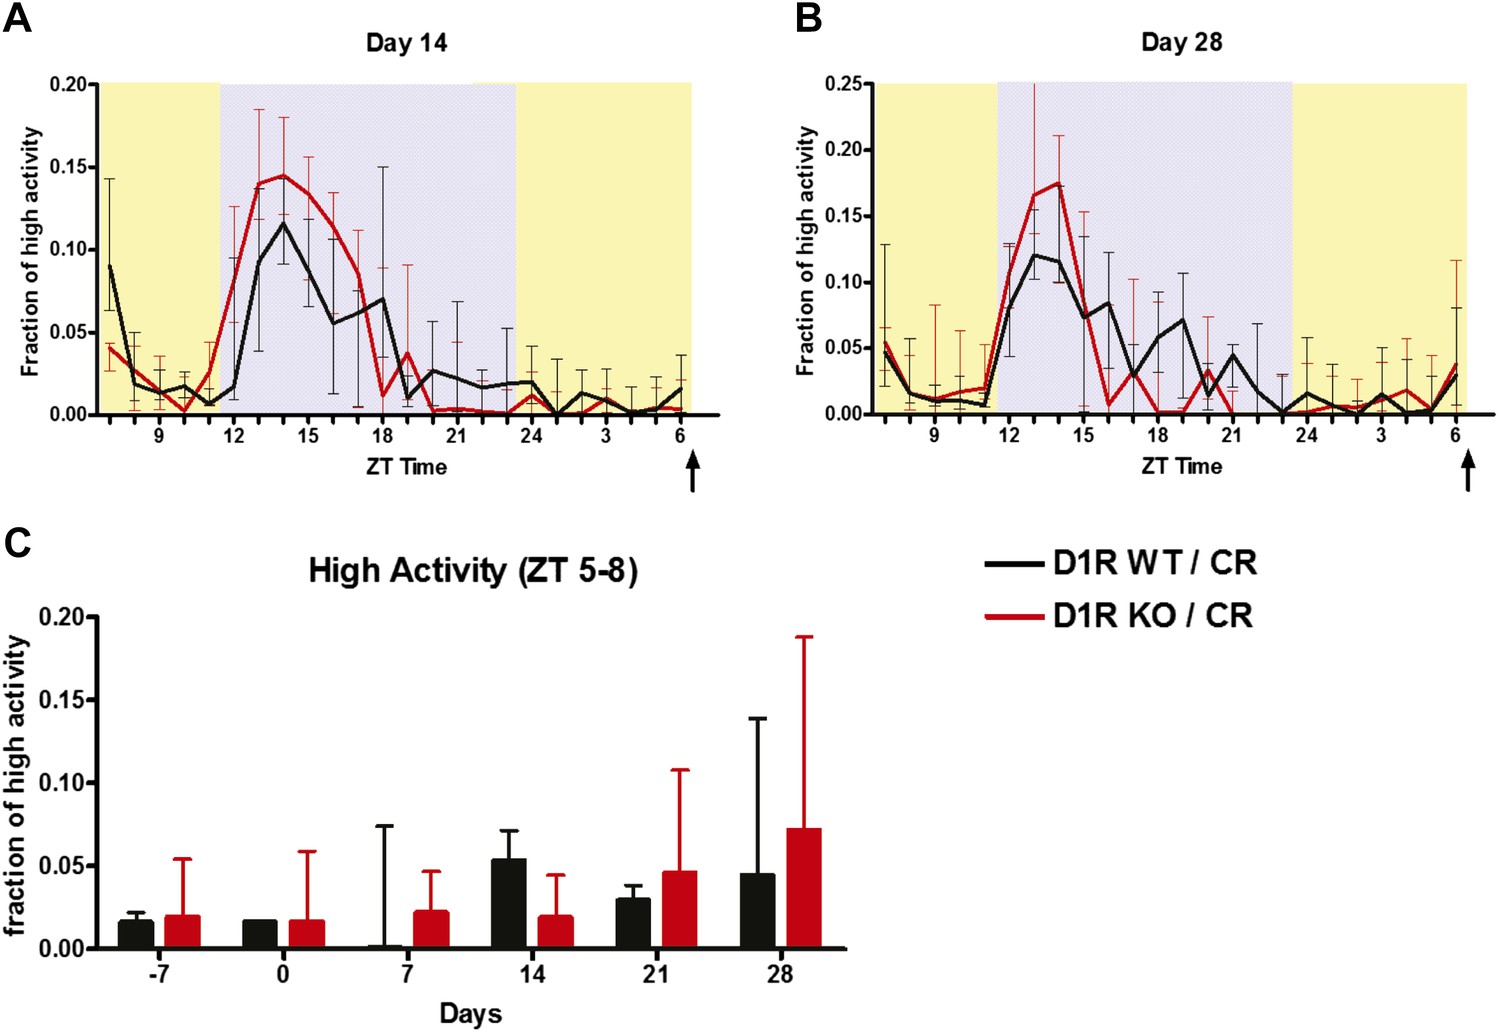
Activity of D1R KO (n = 18) mice and WT (n = 16) mice on 60% CR.
(A) The fraction of high activity within each 1 hr bin on day -7 during which all mice were on an ad libitum diet. (B) The fraction of high activity on day 14, (C) day 21, and (D) day 28 of CR. Arrows indicate the bin in which the meal was delivered (ZT 8). Shaded boxes represent lights-off and yellow boxes indicate lights on. (E) Summed normalized high activity in the 3 hr before feeding (ZT 5–8) for days -7, 0, 7, 14, 21, and 28 of the mice on CR diets. (F) Summed normalized high activity in the 3 hr before feeding (ZT 5–8) for the mice on AL feeding schedules. Bars show medians and interquartile ranges. The statistical test used was Mann–Whitney, where * indicates p < 0.05, ** indicates p < 0.01, and *** indicates p < 0.001.
Figure 2—figure supplement 1
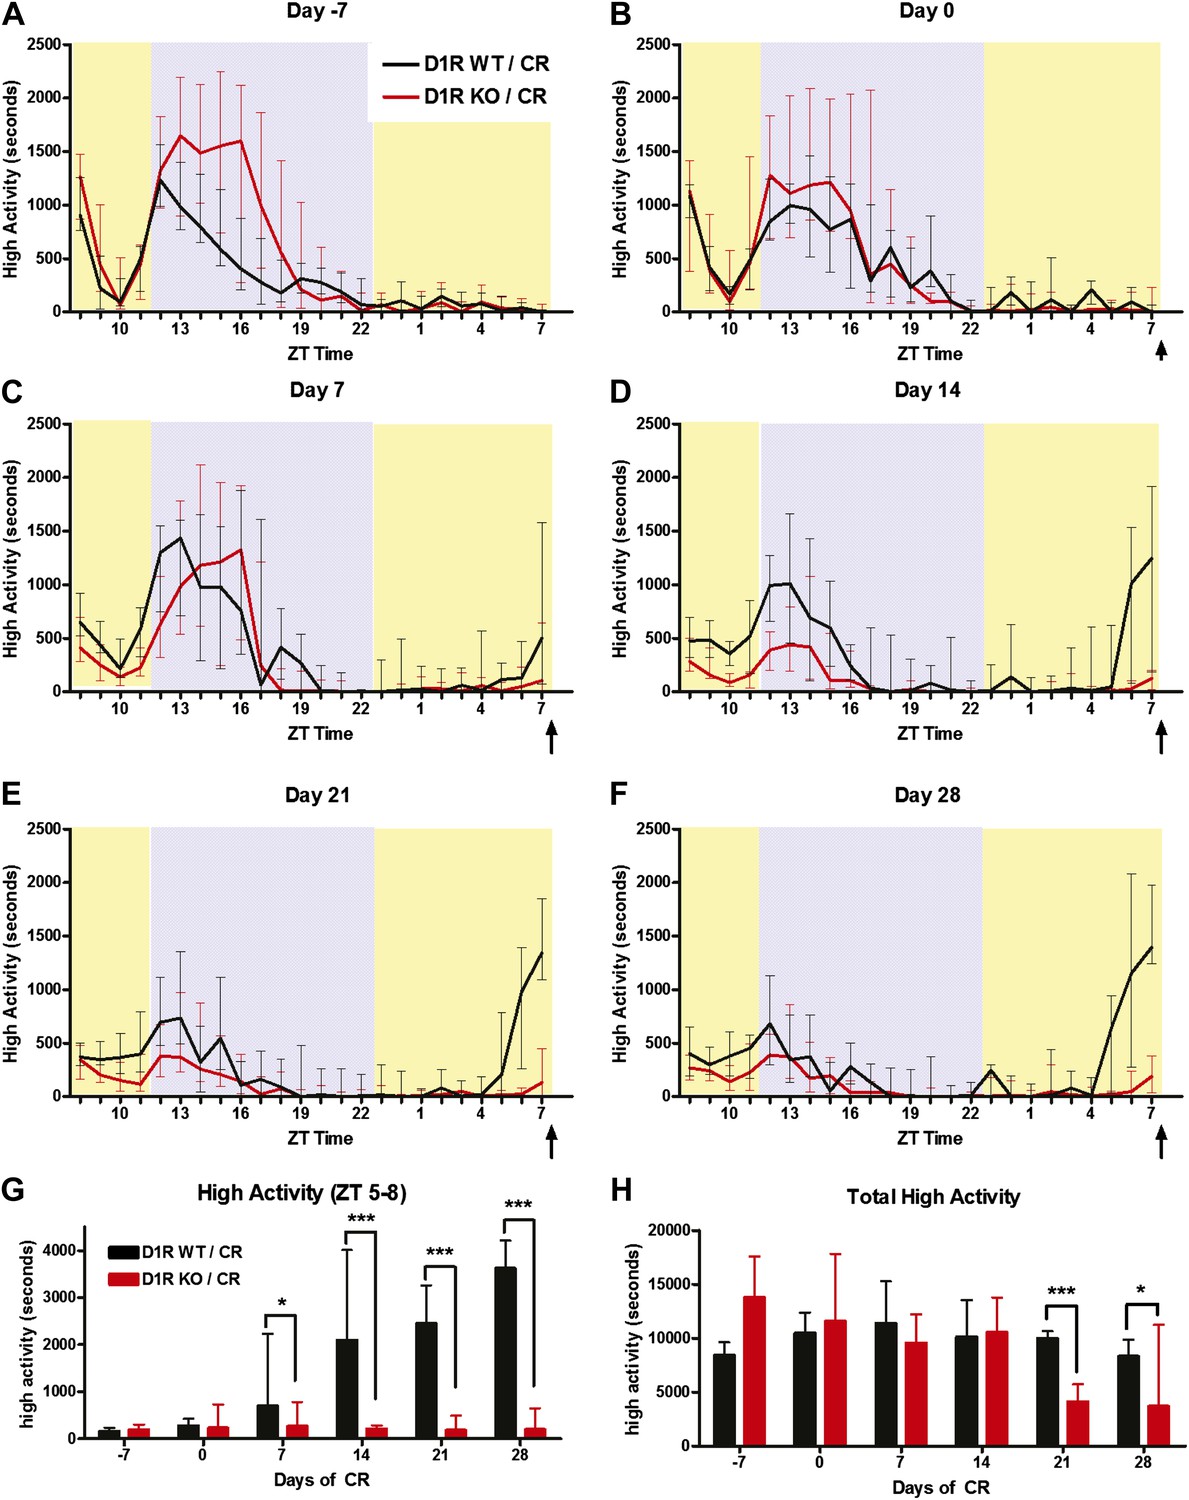
High activity data for D1R knockout mice in seconds (median +/- SEM).
High activity behaviors of D1R KO and WT (same mice as Figure 2) in terms of median seconds (unnormalized) for (A) day 7, (B) day 0, (C) day 7, (D)day 14, (E) day 21, and (F) day 28. (G) Amount of high activity in the 3 hr preceding scheduled feeding in seconds. (H) Amount of total high activity over 24 hr recordings in seconds.
Figure 2—figure supplement 2
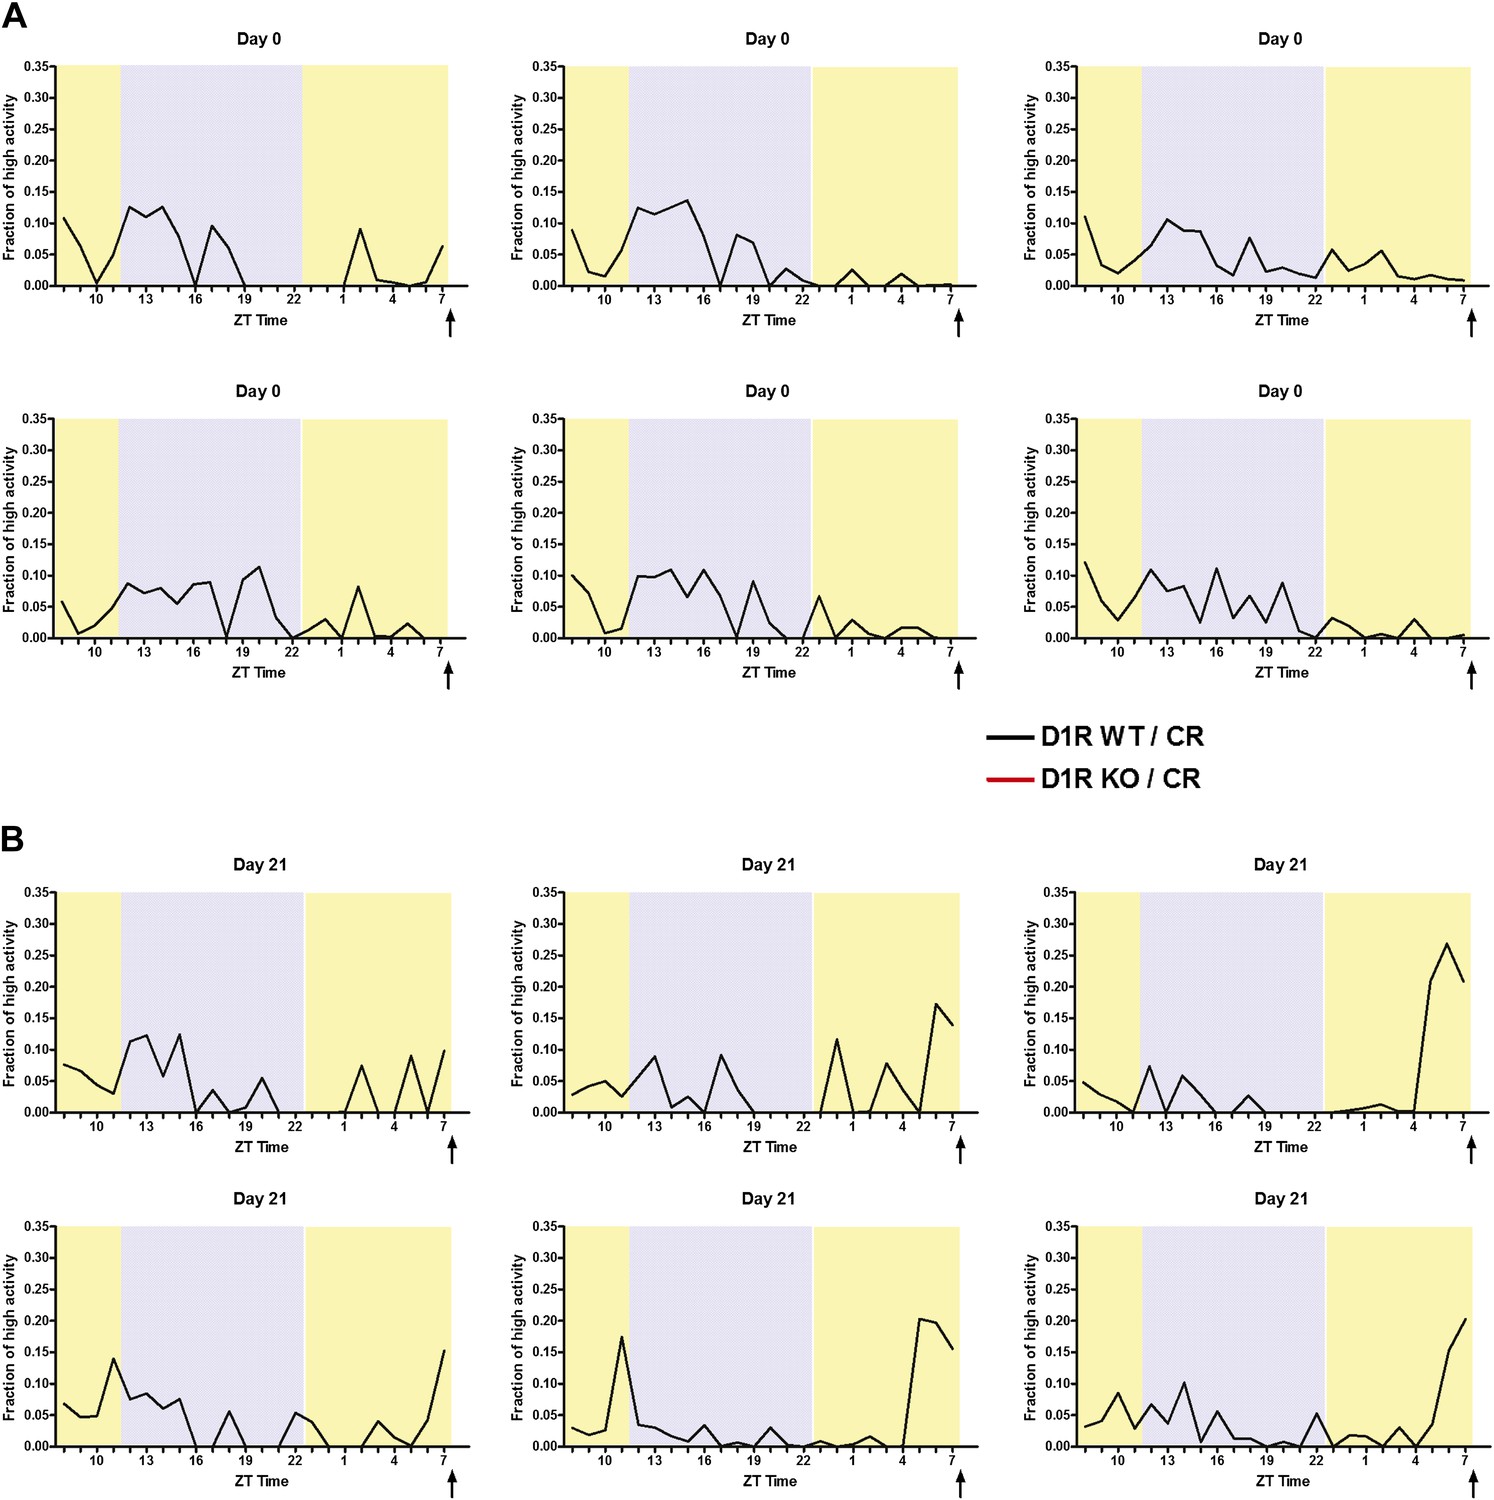
Individual mouse normalized high activity data from n = 6, WT and mice on day 0 and day 21 of 60% CR diet.
https://doi.org/10.7554/eLife.03781.006
Figure 2—figure supplement 3
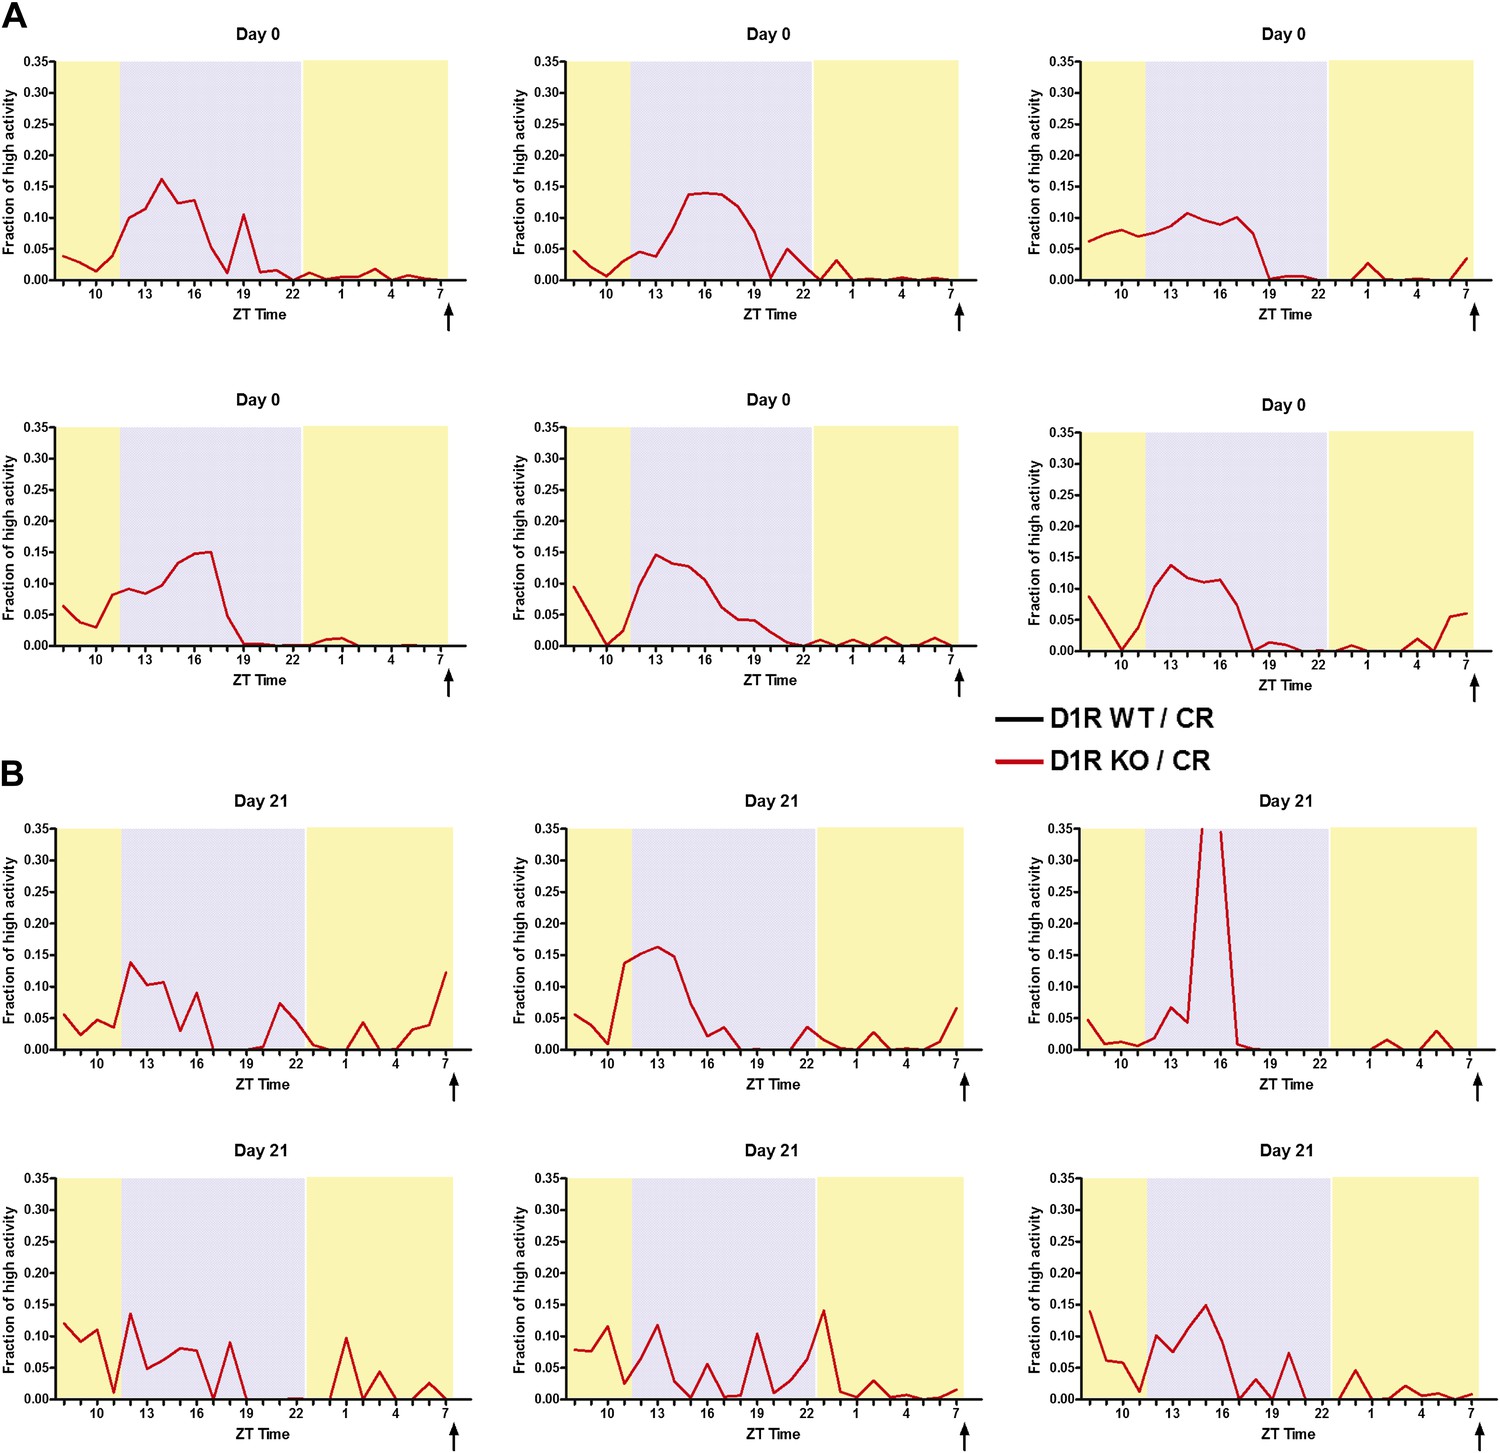
Individual mouse normalized high activity data from n = 6, D1R KO mice on day 0 and day 21 of 60% CR diet.
https://doi.org/10.7554/eLife.03781.007
Figure 3 with 1 supplement
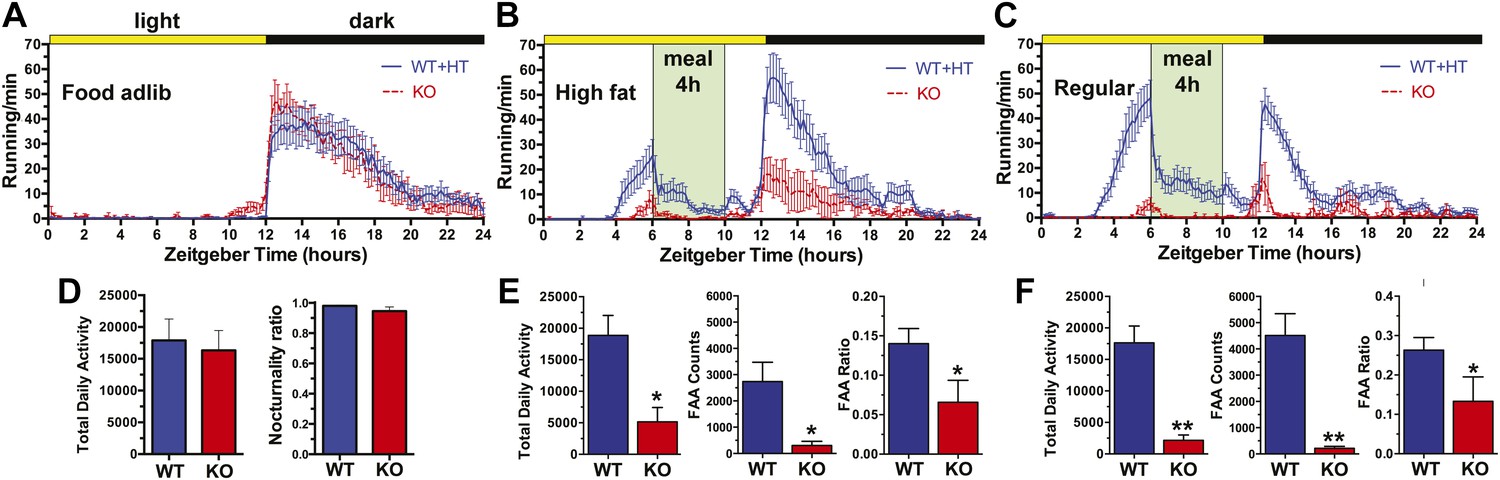
Disc-running activity of D1R KO (n = 4, red curves and bars) and WT/HT mice (n = 12, blue curves and bars) during ad-lib and temporal food restriction schedules.
(A) Group mean (±SEM) waveforms of activity in 10 min bins during ad-lib food access. Data from each mouse are averages of the last 7 days prior to restricted feeding (red dashed lines and bars). Lights-on (ZT 0–12) is indicated by the yellow bar. (B) Group mean waveforms of activity during restricted feeding (4 hr daily access to a moderately high fat diet). (C) Group mean waveforms of activity during restricted feeding regular chow. (D) Total daily activity and nocturnality ratios of WT and KO mice during ad-lib food access. (E) Total daily activity, FAA (2-hr pre-meal) counts, and FAA ratios (2-hr pre-meal counts divided by activity during lights-off) during moderately high fat chow schedule. (F) The same metrics as panel E, during regular chow schedule. * denotes significant difference between WT and KO, p < 0.05, 1-tailed. **denotes significant difference, p < 0.001.
Figure 3—figure supplement 1
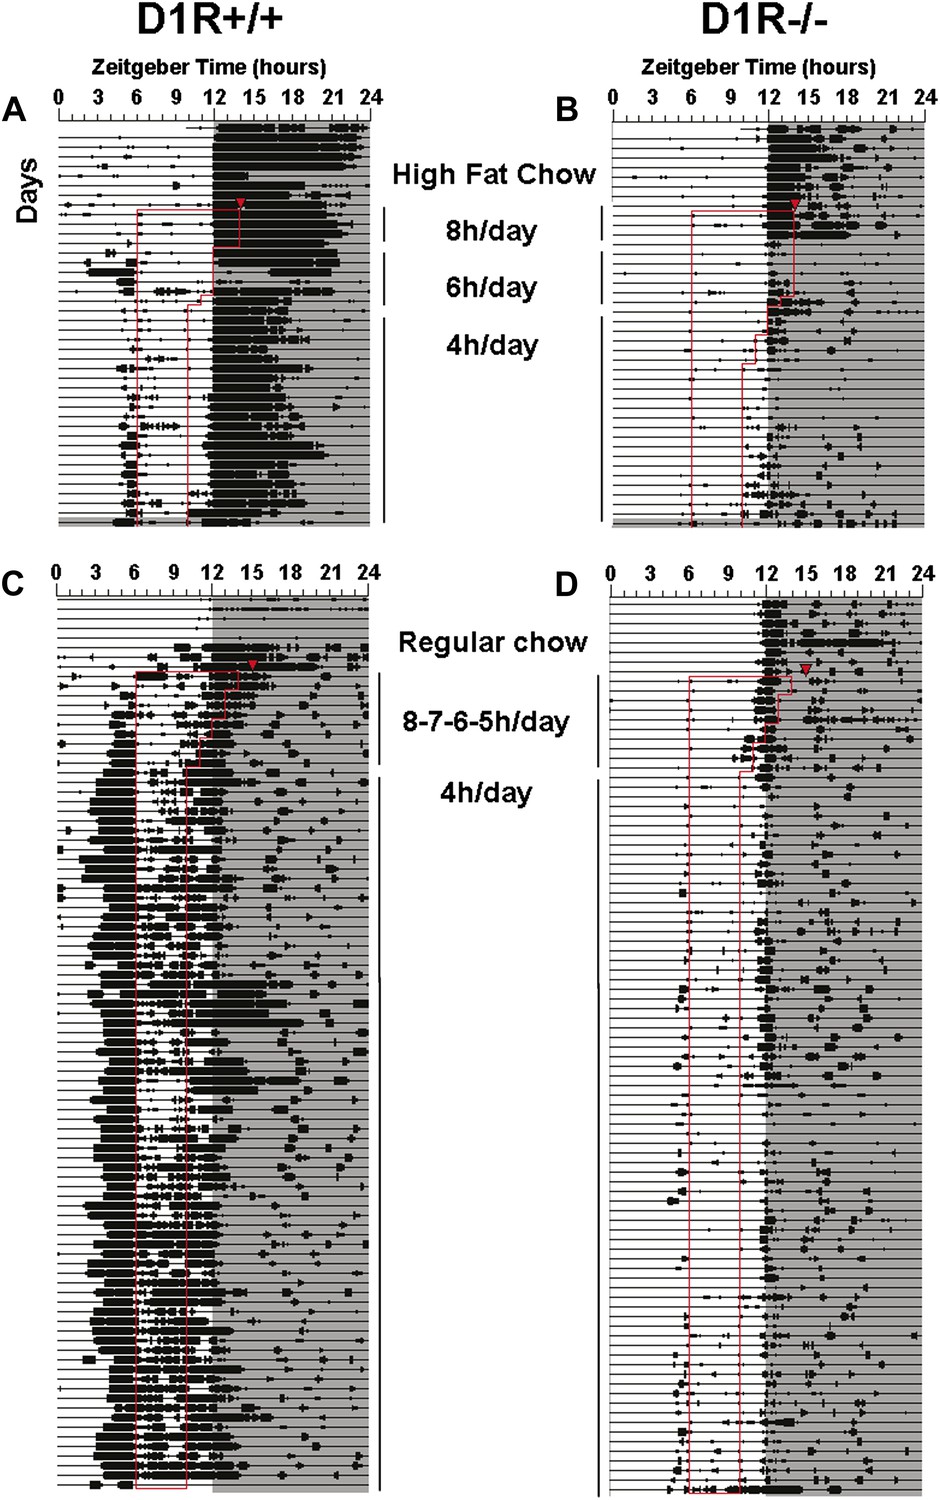
Actogram data for representative D1R knockout and control mice.
Representative actograms of disc running activity in D1R WT (A and C) and D1R KO (B and D) mice. Each line represents 24 hr plotted in 10 min bins from left to right. Consecutive days are aligned vertically. Bins during which activity was registered are denoted by vertical deflections of varying height in proportion to the amount of activity. Lights-off is indicated by shading. Days of restricted feeding are indicated by the vertical thin bars to the immediate right or left of the actograms. Meal time hours are outlined by thin red lines. Food was a high fat chow (A and B) or regular chow (C and D).
Figure 4
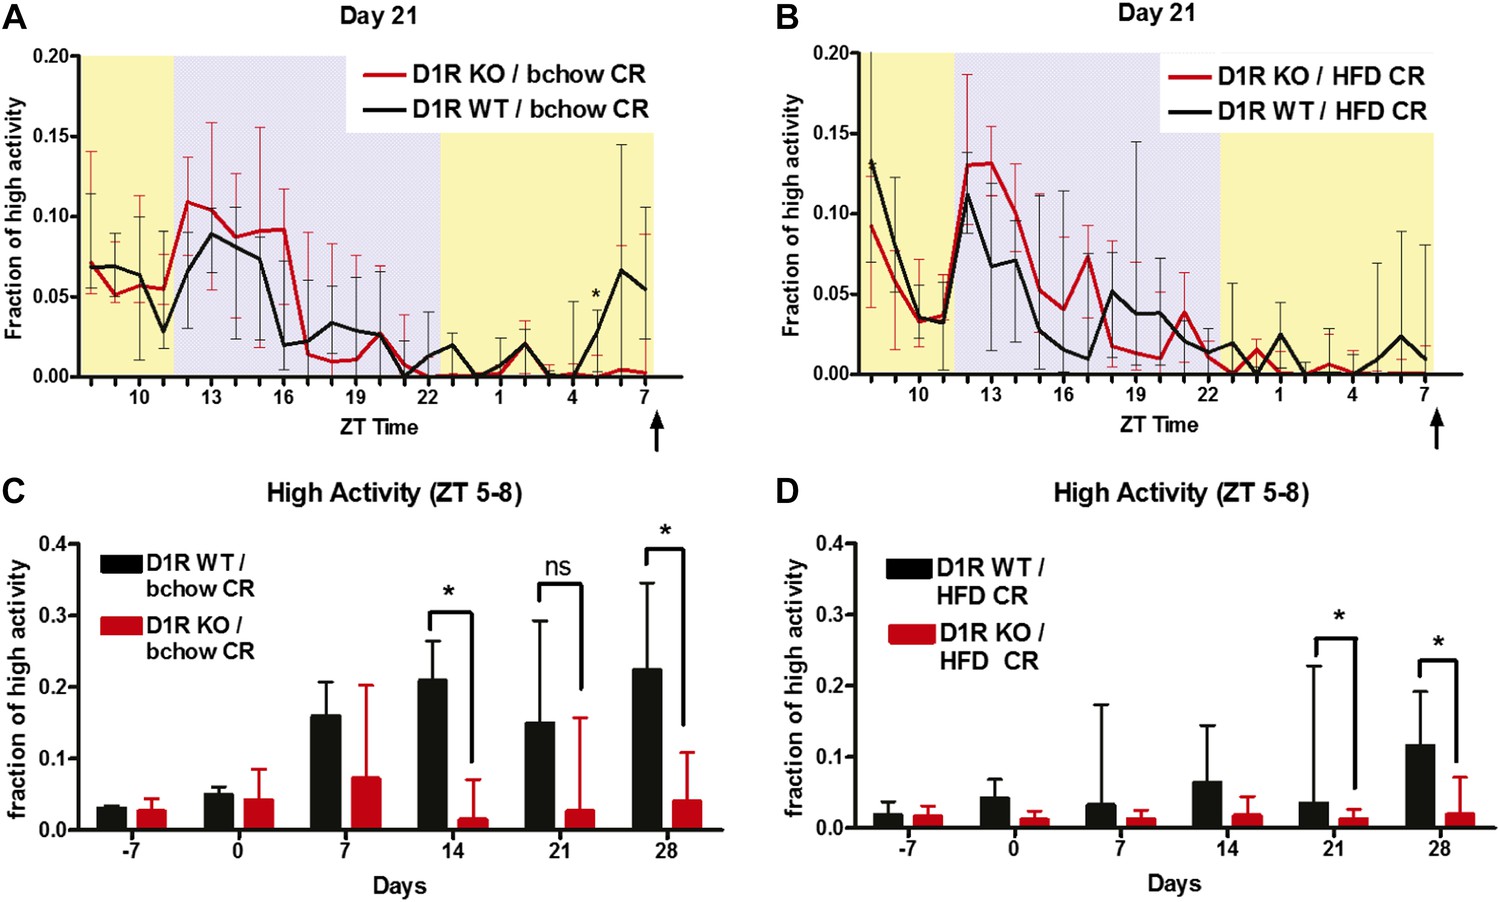
Higher fat content diet FAA studies in D1R KO mice.
(A) Normalized high activity behavior of D1R KO (n = 6) and control (n = 8) mice on day 21 of 60% CR of breeder chow diet. (B) Normalized high activity behavior of D1R KO (n = 11) and control (n = 6) mice on day 21 of 60% CR on rodent high fat diet. (C) Normalized high activity in the 3 hr preceding scheduled meal time for mice on a diet of 60% CR breeder chow. (D) Normalized high activity in the 3 hr preceding scheduled meal time for mice on a diet of 60% CR high fat diet. The statistical test used was Mann–Whitney, where * indicates p < 0.05.
Figure 5
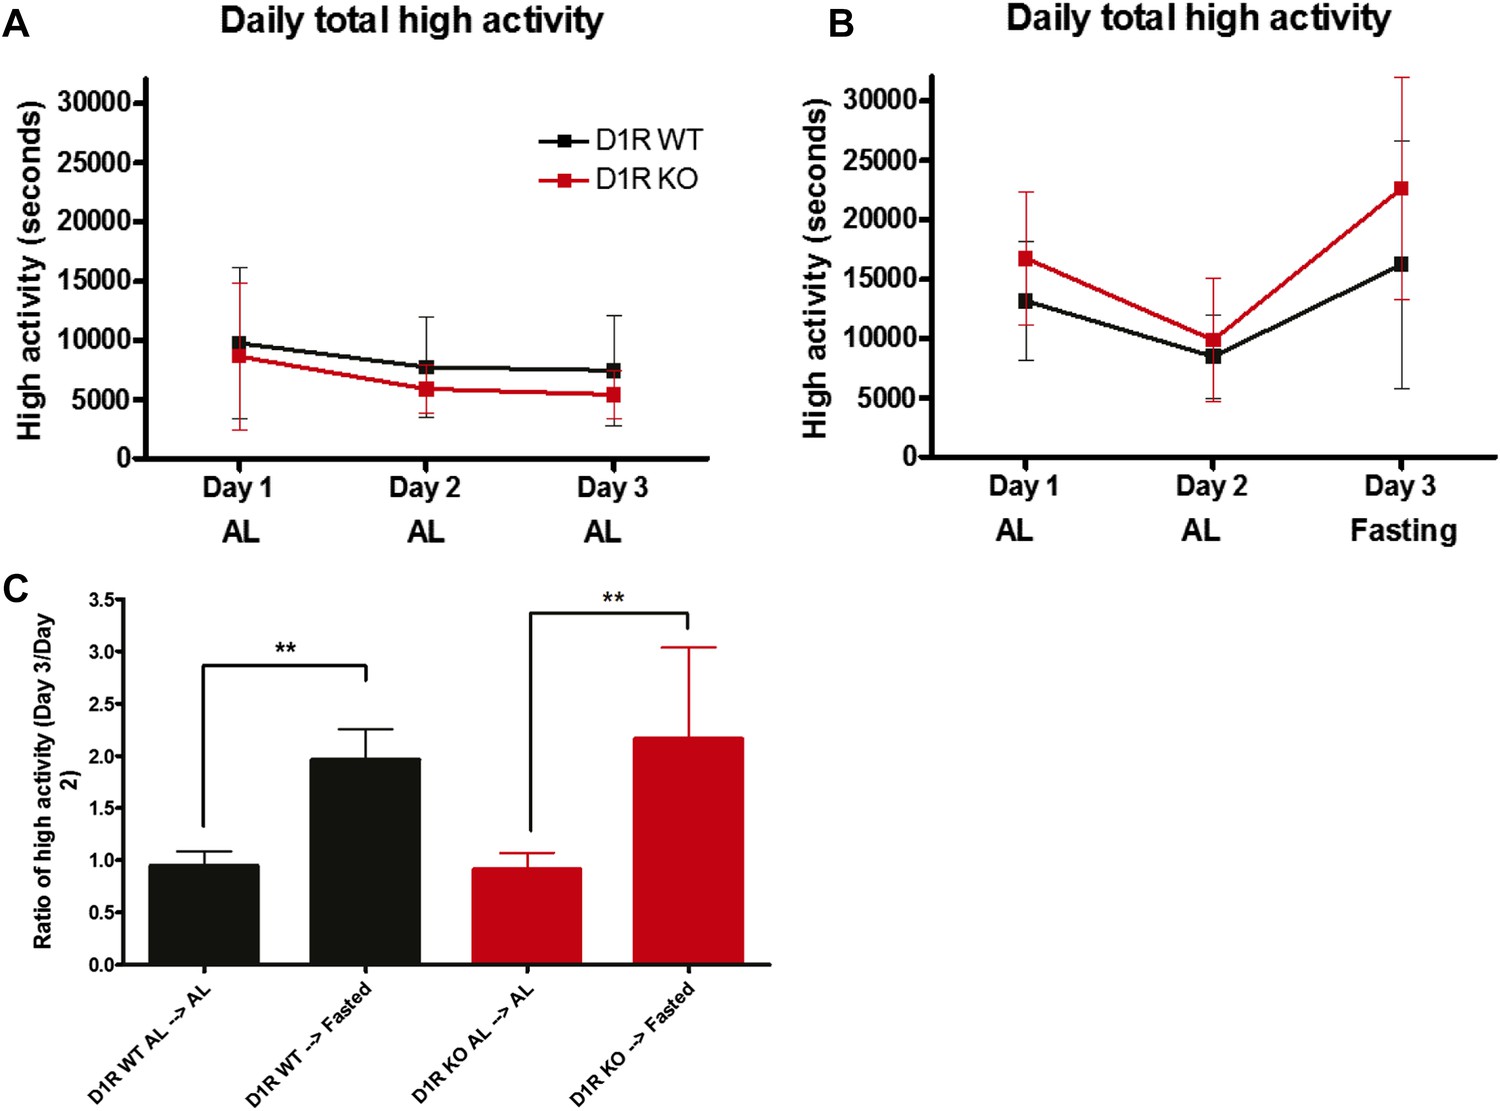
Activity of acutely fasted D1R KO and WT mice.
(A) Total number of seconds of high intensity activity (walking, hanging, jumping, or rearing) for D1R KO (n = 6 KO) and WT (n = 12) mice on 3 consecutive days of ad libitum diet. (B) Total number of seconds of high intensity activity for D1R KO (n = 7) and WT (n = 14) mice on 3 consecutive days. On day 1 and day 2 all mice were on an ad libitum diet, but on the third day all mice were deprived of food. (C) The ratio of total seconds of high activity on day 3 divided by total seconds of high activity on day 2. Bars show medians and interquartile ranges. The statistical test used was Mann–Whitney, where ** indicates p < 0.01.
Figure 6
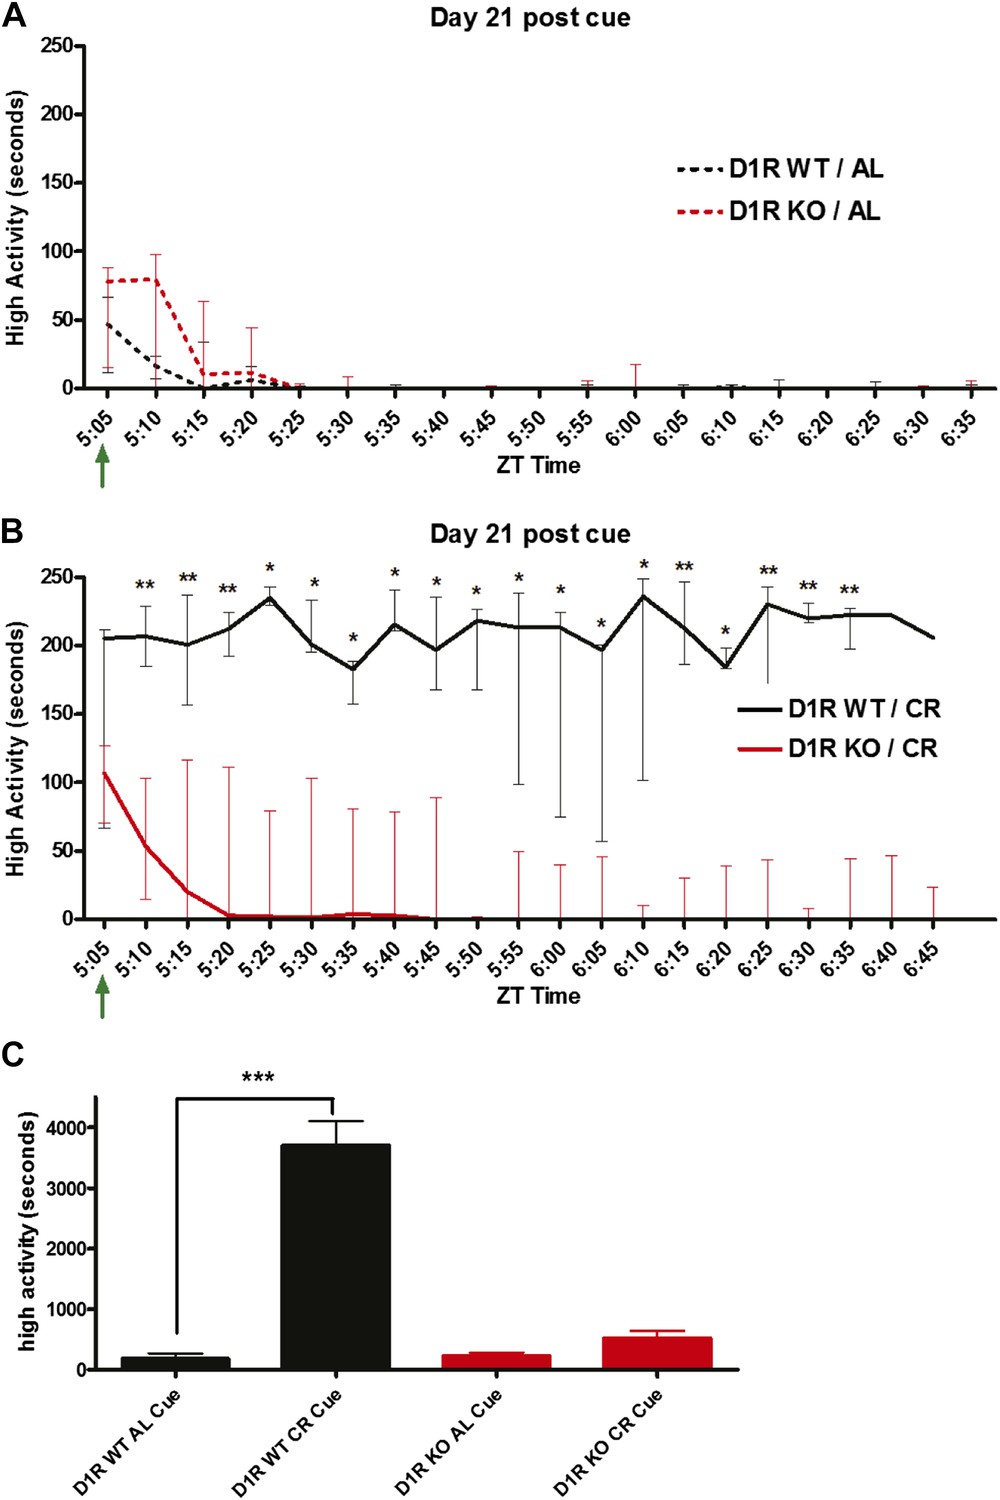
Cued handling FAA.
(A) High activity data (in seconds) in 5 min bins for D1R KO (n = 7) and D1R WT (n = 8) mice that were disturbed 2 hr prior to scheduled feeding. (B) High activity data (in seconds) in 5 min bins for timed, calorie restricted D1R KO (n = 6) and D1R WT (n = 7) mice. Mice were disturbed 2 hr prior to feeding. (C) Summed high activity data over the cued period. The statistical test used was Mann–Whitney, where * indicates p < 0.05, ** indicates p < 0.01, and *** indicates p < 0.001.
Figure 7
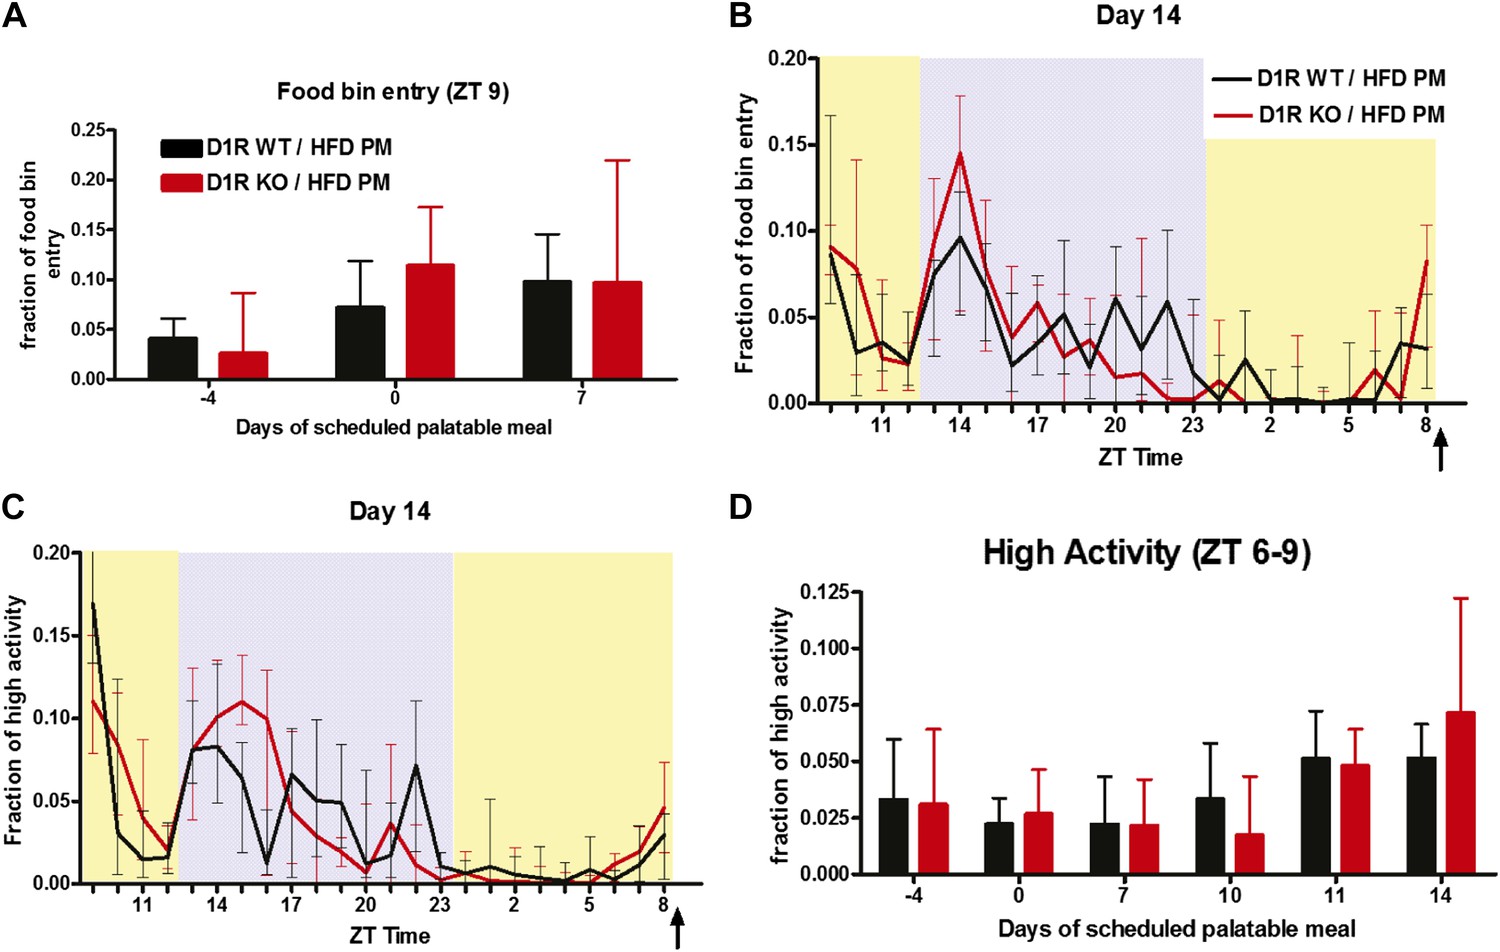
Activity of D1R KO (n = 9–11) and WT (n = 14) mice on a palatable meal schedule.
(A) Fraction of time spent entering the food bin in the hour after feeding (ZT 9) on days 4, 0, and 7. (B) The fraction of normalized food bin entry and (C) normalized high activity in each 1-hr bin on day 14. (D) Sum of normalized high activity in the 3 hr before feeding on days 4, 0, 7, 10, 11, and 14. There were no statistically significant differences between groups, Mann–Whitney. Arrows indicate the bin in which the palatable meal was delivered (ZT 9). Bars show medians and interquartile ranges.
Figure 8
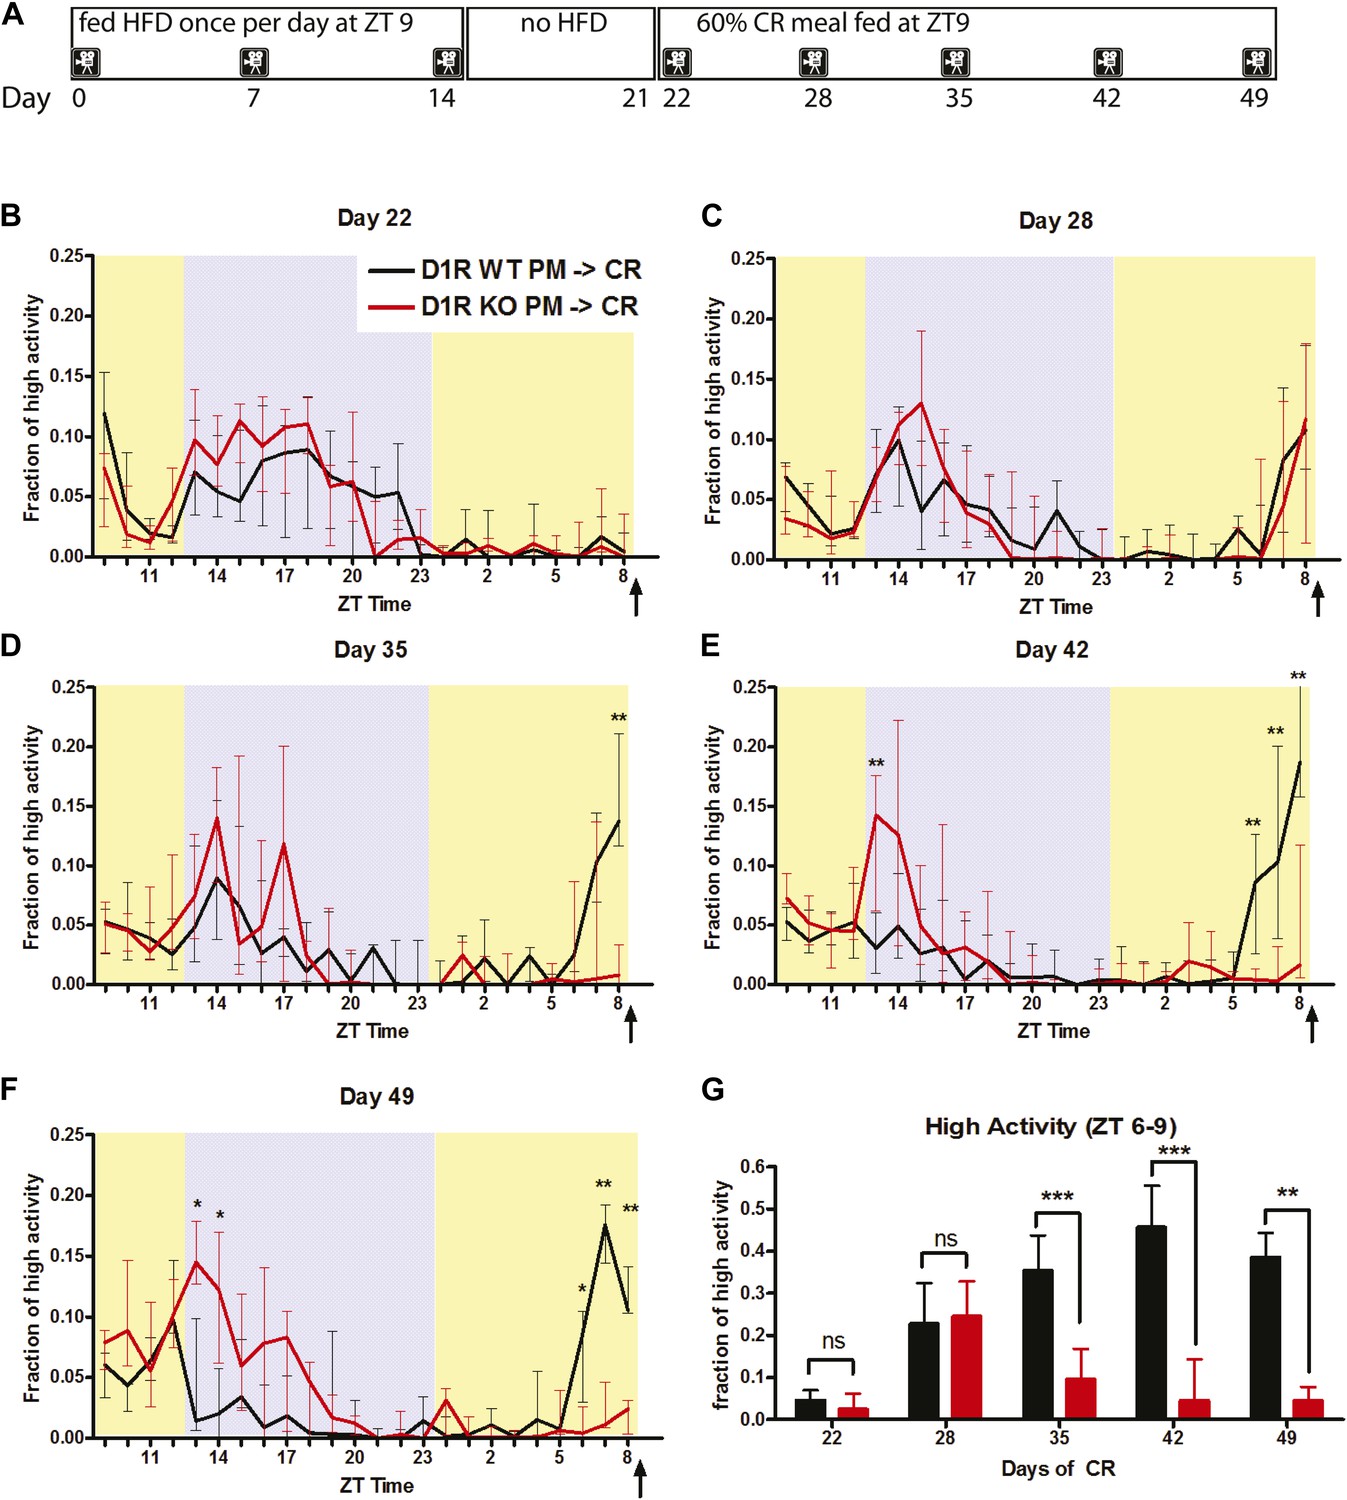
Activity of D1R KO (n = 9) and WT (n = 14) mice on a 60% CR meal pre-treated with 14 days of a palatable meal schedule.
(A) A diagram representing the feeding schedule used in this study. (B) The fraction of high activity each 1-hr bin on day 22, (C) day 28, (D) day 35, (E) day 43, and (F) day 49. Arrows indicate the scheduled feeding time. Shaded boxes represent lights-off while yellow represents lights on. (G) The fraction high activity in the 3 hr before feeding time (ZT 6–9) on day 22, 28, 35, 42, 49. Bars show medians and interquartile ranges. The statistical test used was Mann–Whitney, where * indicates p < 0.05, ** indicates p < 0.01, and *** indicates p < 0.001.
Figure 9 with 2 supplements
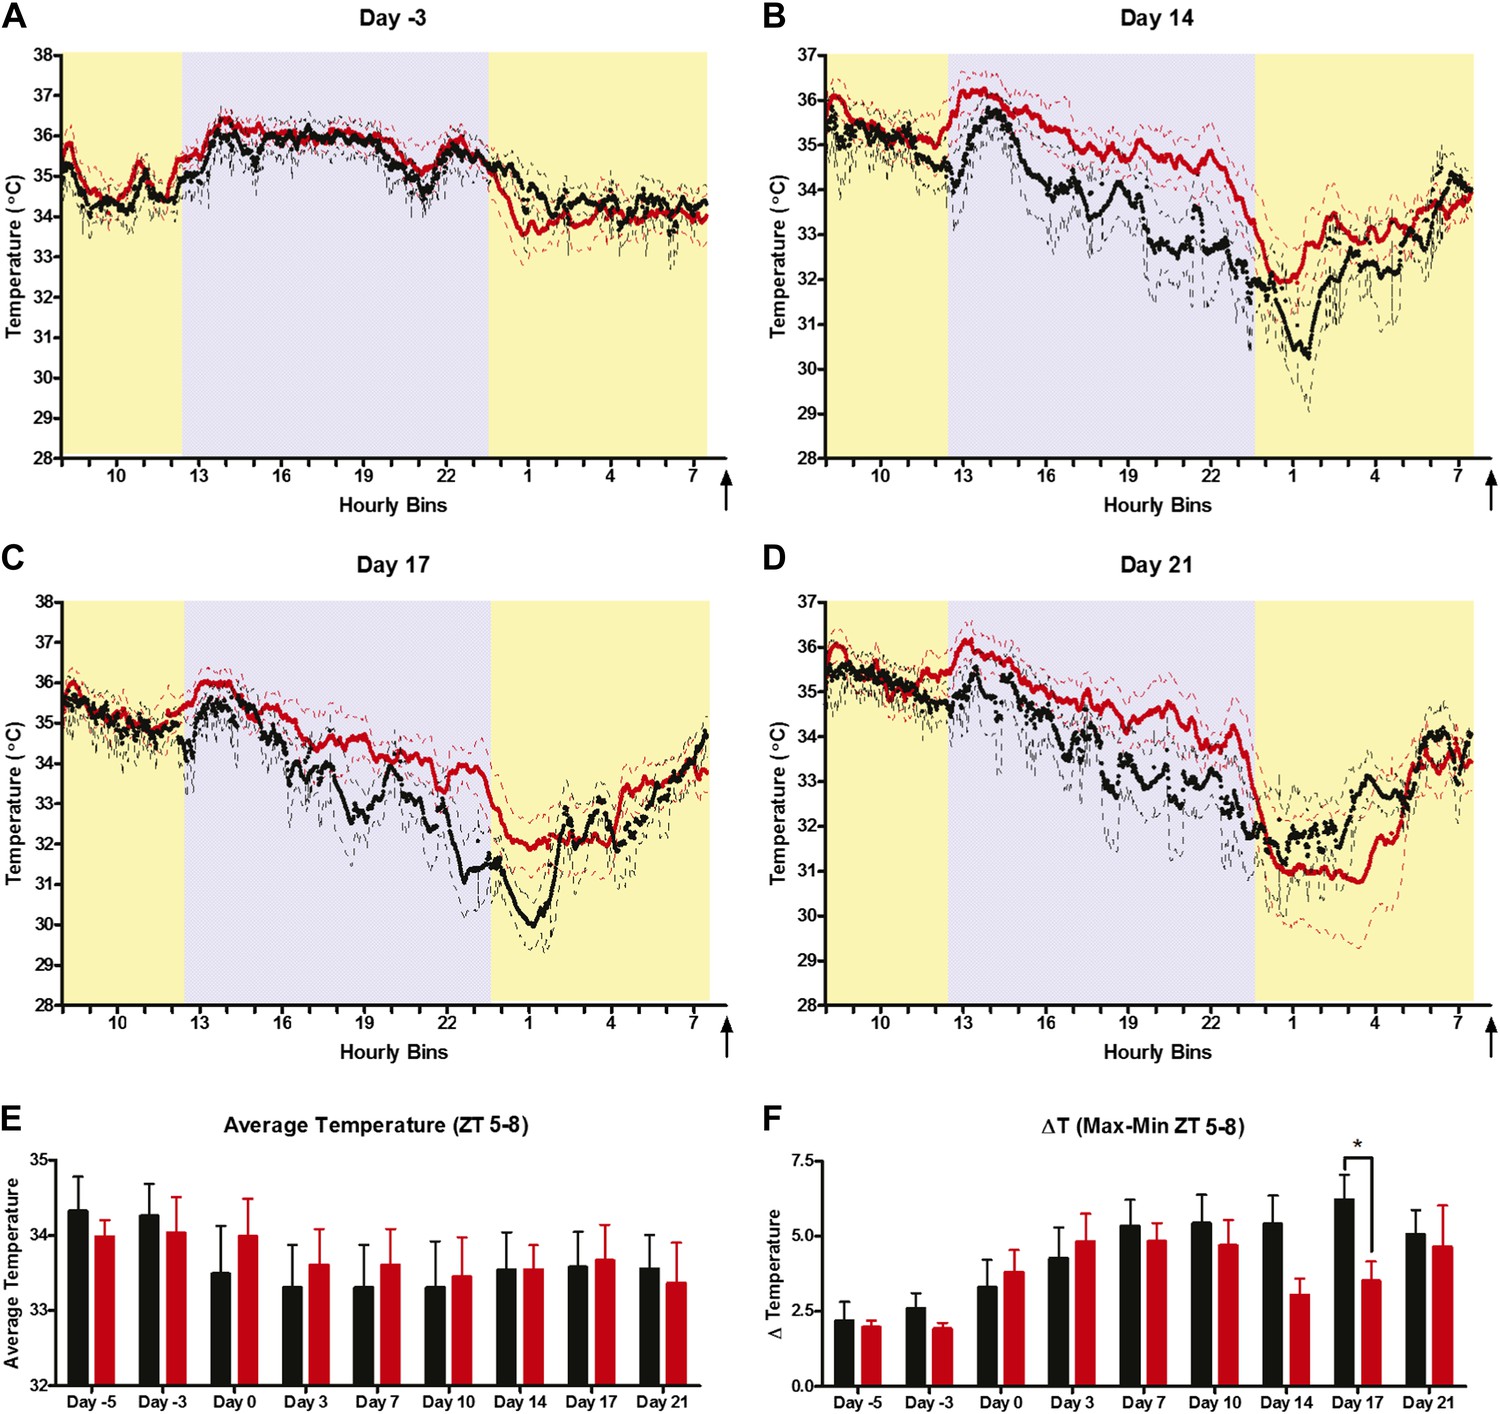
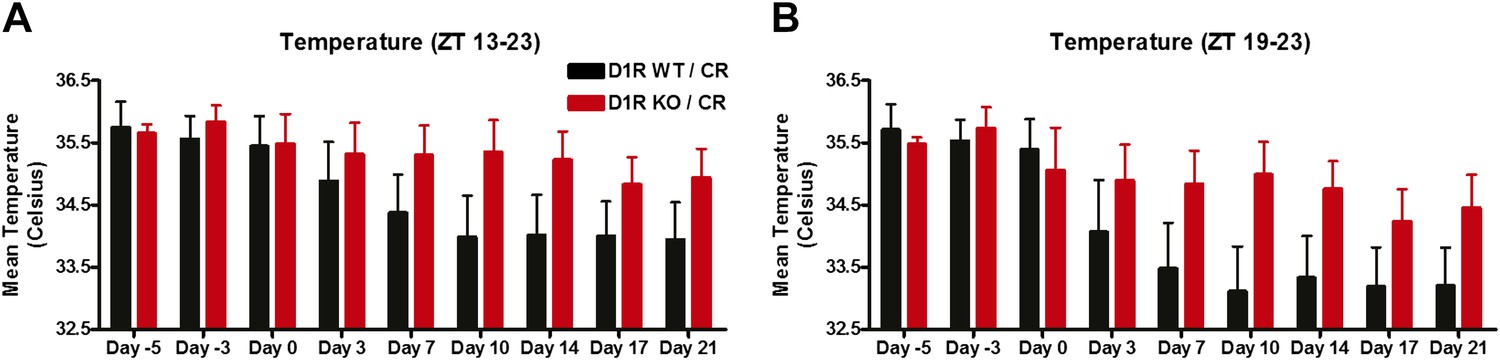
Body temperature measurements.
(A) Mean (± SEM) body temperature of WT and D1R KO mice 3 days prior to initiating CR, (B) day 14, (C) day 17, and (D) day 21 of CR. (E) Mean (±SEM) body temperature overall for each day of measurement. (F) Mean change in temperature in the 3 hr prior to scheduled feeding. * indicates p < 0.05, Mann–Whitney; n = 6 D1R KO and n = 8 WT.
Figure 9—figure supplement 1
FAA study of D1R KO (n = 7) and WT (n = 7) mice at 30°C.
After 1 week at 30°C mice were placed on timed 60% CR feeding. (A) Normalized high activity on day 14 and (B) day 28. (C) Fraction of high activity in the 3 hr preceding expected meal time.
Figure 9—figure supplement 2
Entrainment of behavior and neuronal activation from D1 agonist injection.
Body temperature measurements during lights-off (A) for the entire dark cycle and (B) for the last 4 hr of the dark cycle.
Figure 10
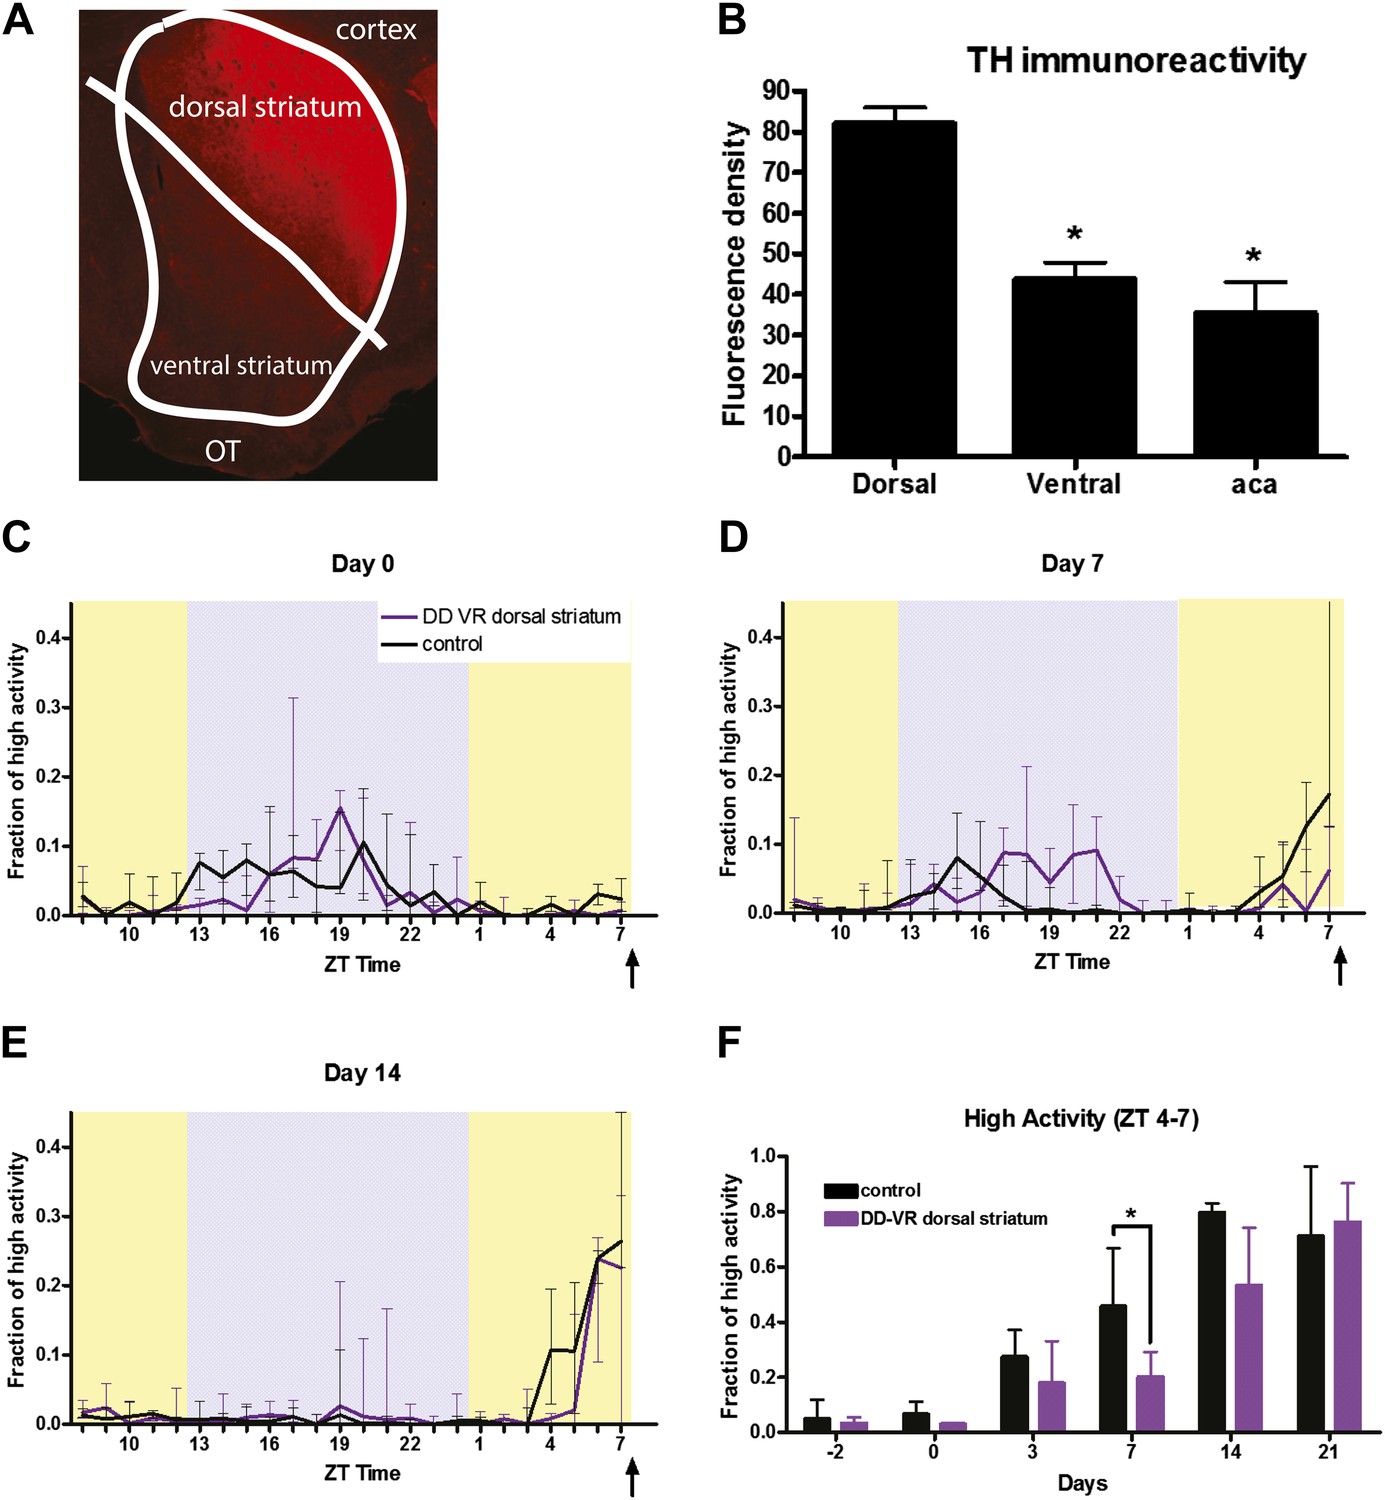
Viral restoration of dopamine signaling in the dorsolateral striatum of dopamine-deficient mice.
(A) Representative tyrosine hydroxylase staining in a dopamine-deficient dorsolateral viral restoration mouse. (B) Quantitation of tyrosine hydroxylase expression in dopamine deficient mice (n = 5). TH immune-stained striatal sections from DD-VR mice were analyzed with MacBiophotonics ImageJ software to measure fluorescence intensities in the dorsal striatum, ventral striatum, and also in the anterior part of the anterior commissure (aca), a structure that is always devoid of TH staining. For each mouse fluorescence intensity values were divided by the size of the analyzed area to generate normalized fluorescence values. (C) Normalized high activity in control (normal dopamine levels, n = 4) and dopamine-deficient viral restoration mice (n = 7) on the first day of CR. (D) Normalized high activity on day 7 of CR and (E) day 14 of CR. (F) Summation of normalized high activity in the 3 hr preceding meal time over the course of the experiment. * indicates p < 0.05, Mann–Whitney.
Figure 11
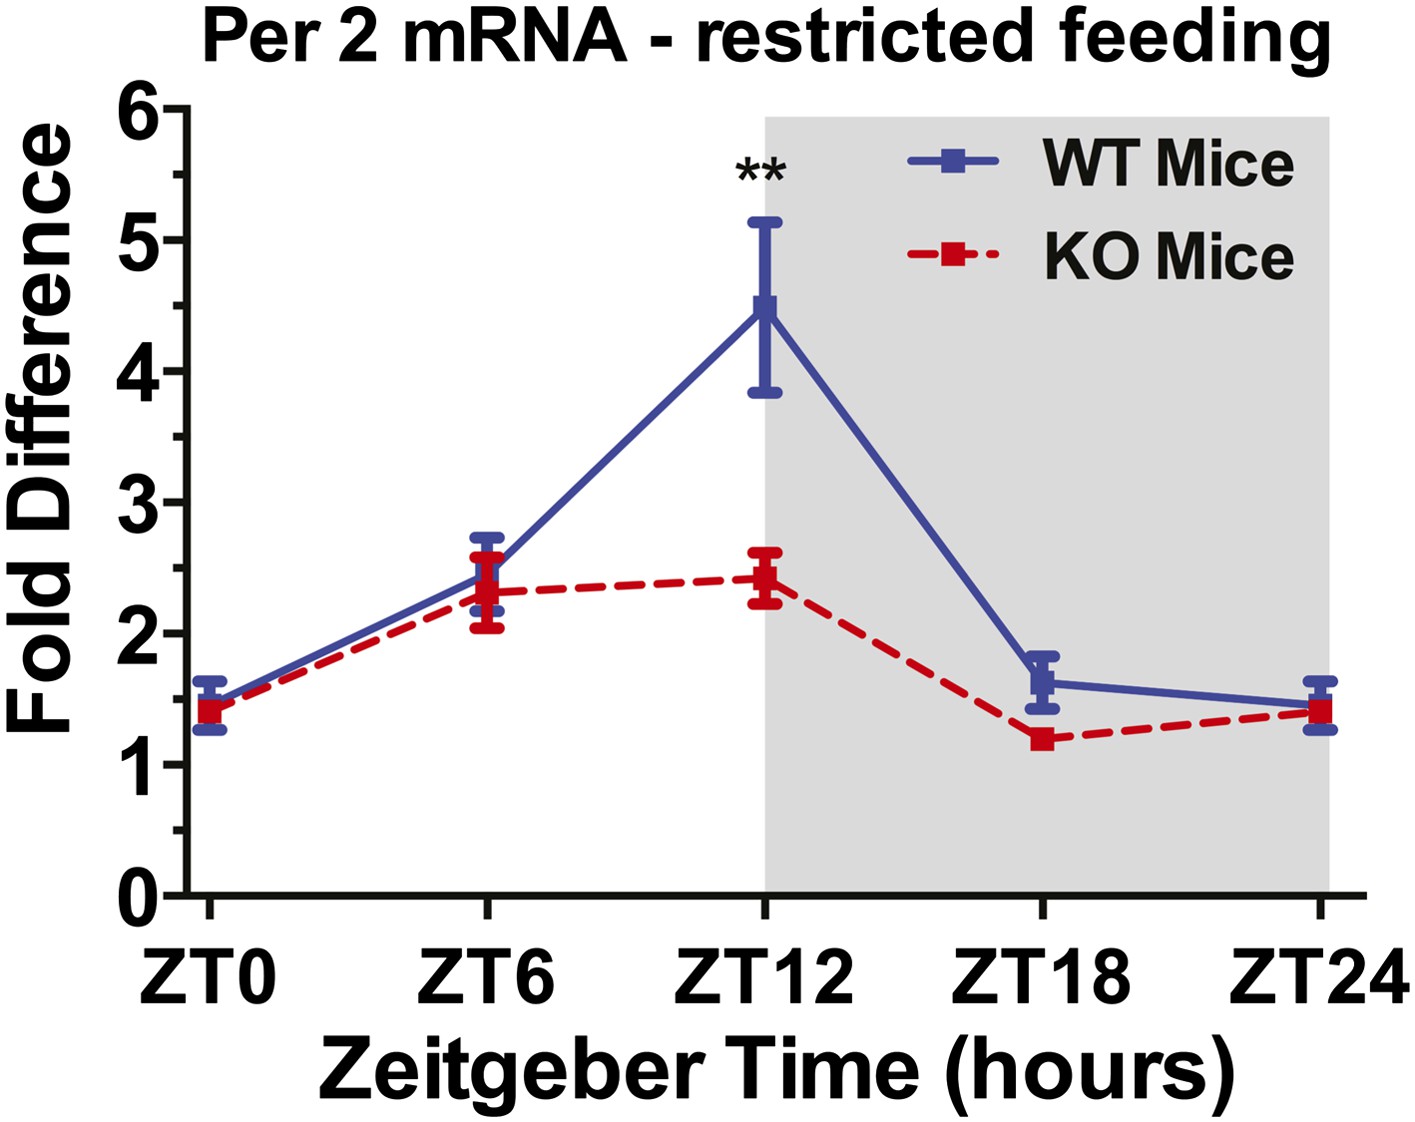
Per2 mRNA expression measured by quantitative reverse-transcriptase PCR at 4 times of day in D1R KO (red dashed curve) and WT mice (blue curve) fed for 4 hr daily at Zeitgeber Time 6.
n = 4 mice per group per time point. ANOVA confirms a significant effect of sample time in both groups. **denotes significant difference between KO and WT mice, p < 0.0001.
Figure 12 with 1 supplement
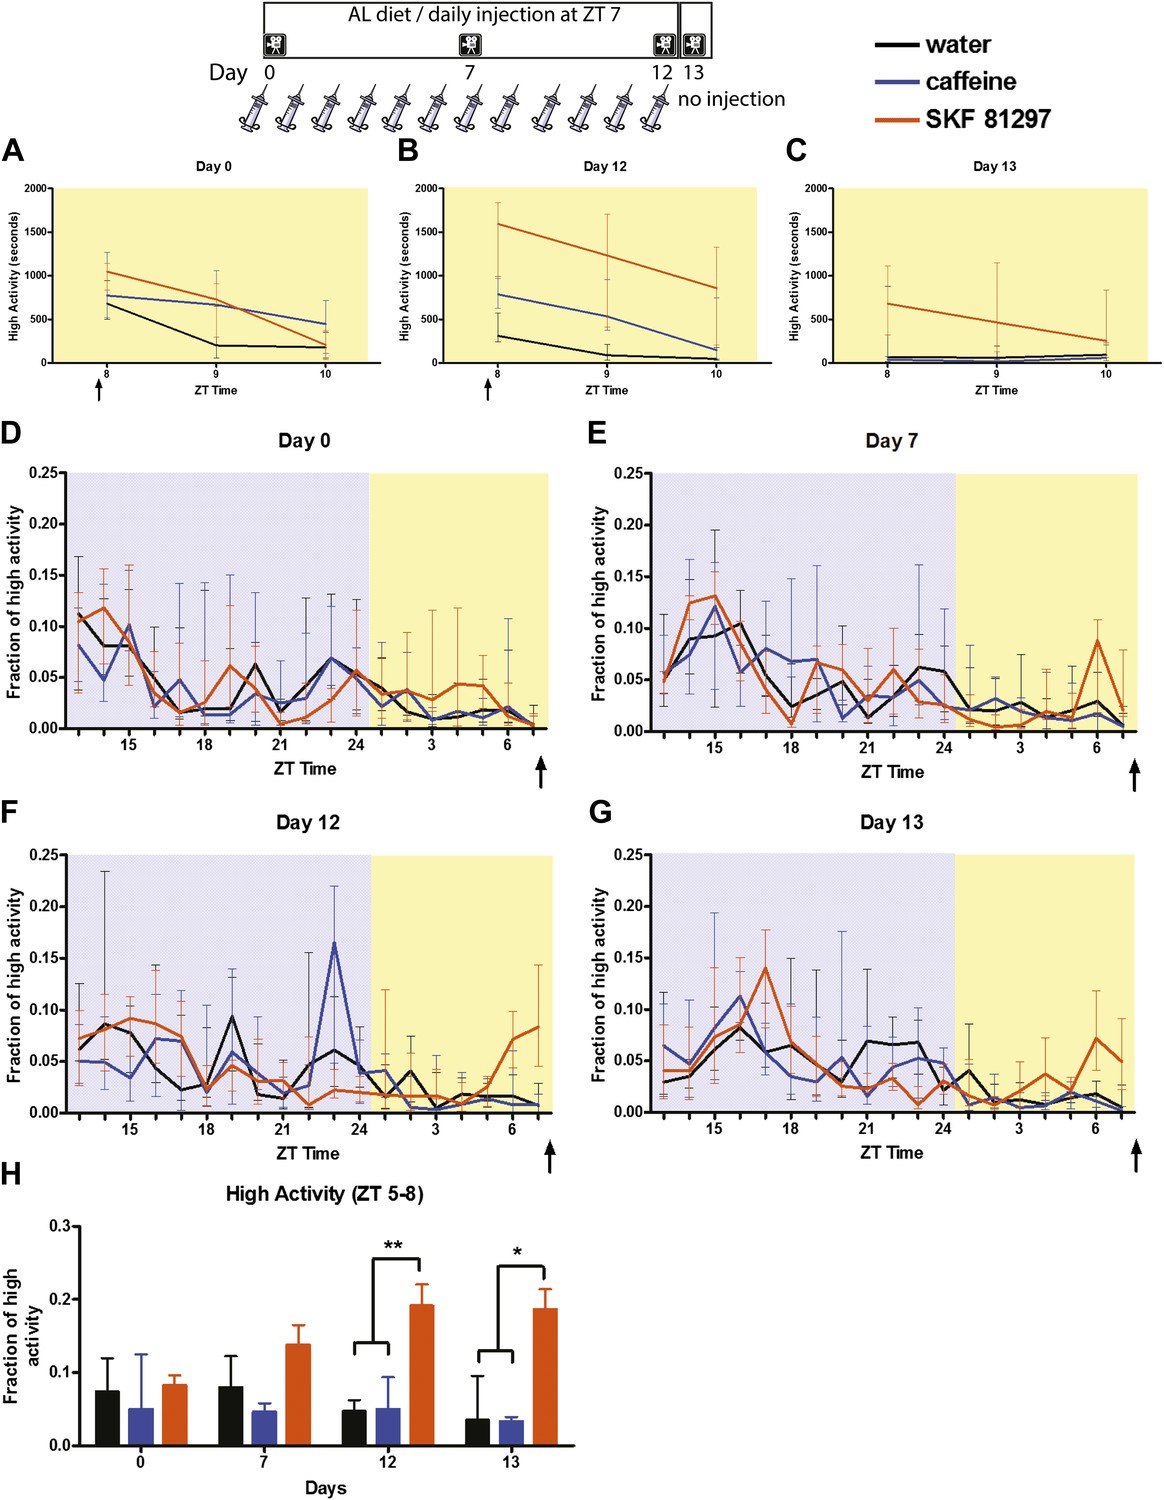
Mice were injected i.p. daily with water (n = 9), caffeine (n = 8–9), or SKF-81297 (n = 9–10).
(A) Seconds of high activity behavior in the 2 hr after injection on day 0, the first day of injection, (B) day 12, and (C) on day 13 when no injection was performed. (D) Fraction of high activity plotted in 1 hr bins after the first day of injection, (E) seventh, (F) 12th day of injection, and (G) 1 day after the last injection. (H) The sum of normalized high activity in the 3 hr preceding scheduled injection at each behavioral measurement. * indicates p < 0.05, **p < 0.01, Mann–Whitney.
Figure 12—figure supplement 1
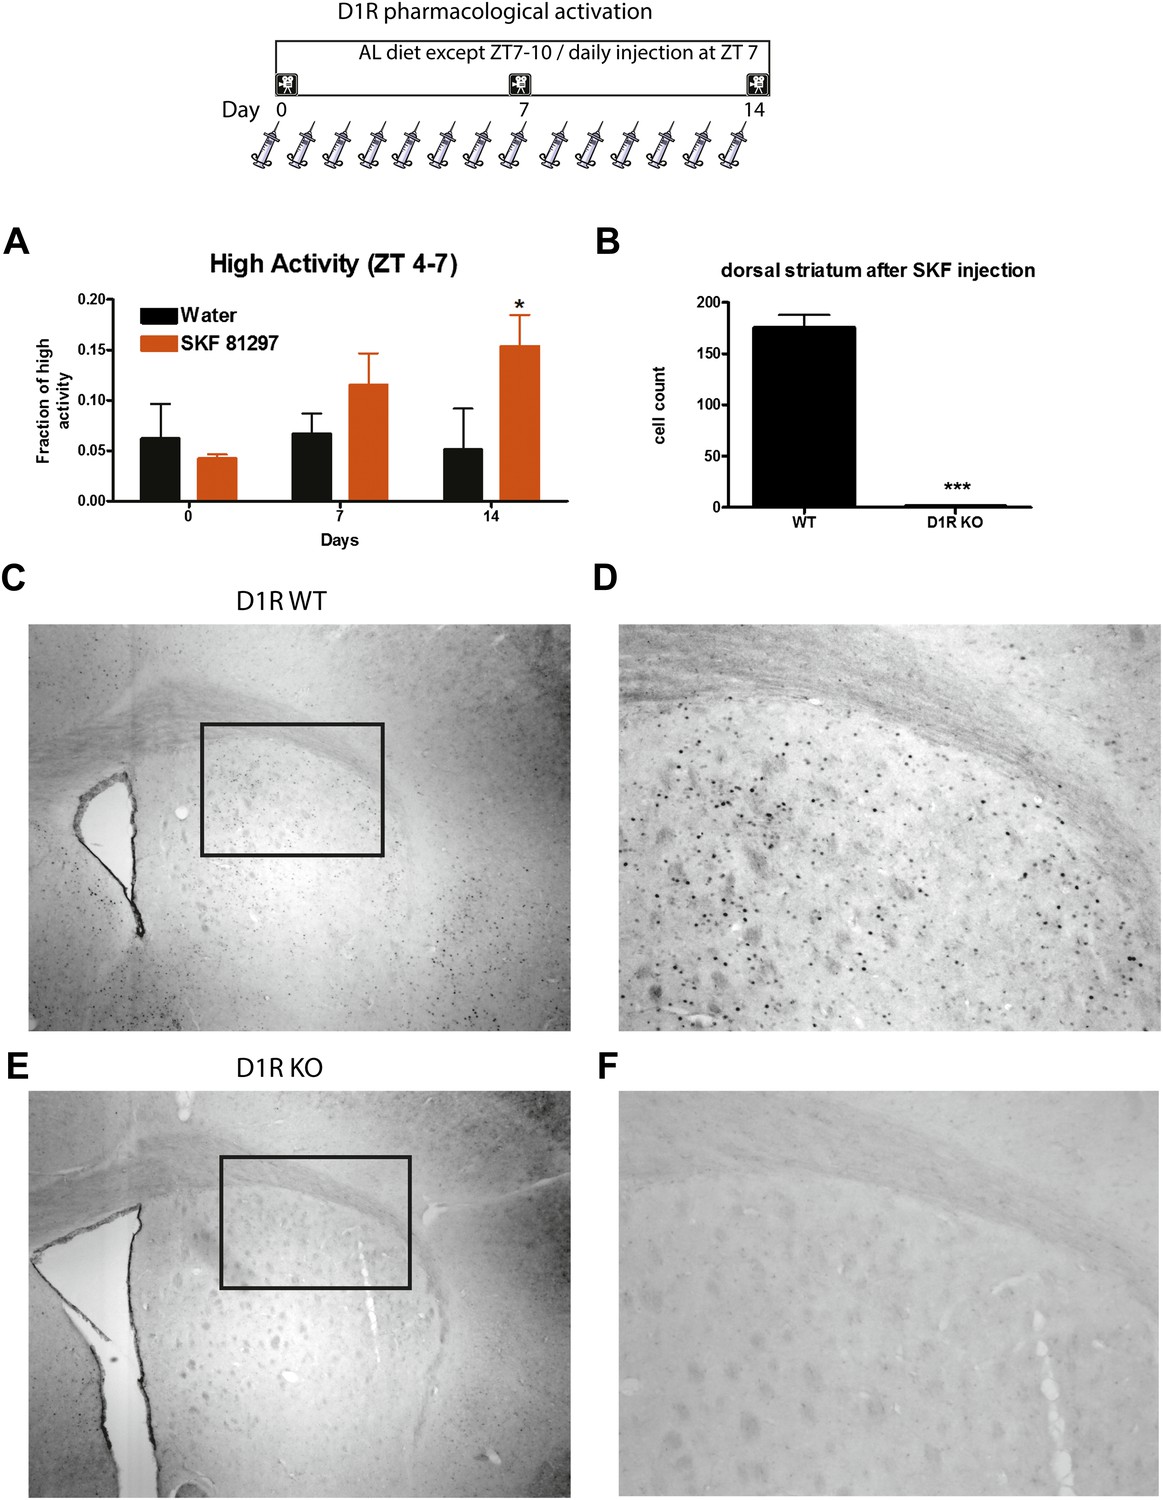
Mice were injected i.p. with either SKF-81297 (n = 8–12) or water (n = 8–12) for 14 days and deprived of food each day for 4 hr post-injection to prevent any drug-induced food consumption.
(A) High activity in the 3 hr preceding daily injection on days 0, 7, and 14 of the experiment. (B) Quantitation of c-Fos immunostaining in the dorsal striatum of D1R WT (n = 2) and D1R KO (n = 2). (C) A low magnification (D) and at 10×. (E) c-Fos immunostaining in the dorsal striatum of a D1R KO mouse, a low magnification (F) and at 10×.
Author response image 1
replication of D1R KO CR phenotype at Keck Science Department using computer vision to measure activity levels. n=7-10 mice per group.
Download links
A two-part list of links to download the article, or parts of the article, in various formats.
Downloads (link to download the article as PDF)
Open citations (links to open the citations from this article in various online reference manager services)
Cite this article (links to download the citations from this article in formats compatible with various reference manager tools)
Dopamine receptor 1 neurons in the dorsal striatum regulate food anticipatory circadian activity rhythms in mice
eLife 3:e03781.
https://doi.org/10.7554/eLife.03781


