Non-linear developmental trajectory of electrical phenotype in rat substantia nigra pars compacta dopaminergic neurons
- Inserm UMR 1072, Faculté de Médecine Secteur Nord, Université de la Méditerranée, France
- Aix-Marseille Université, France
Figures
Figure 1
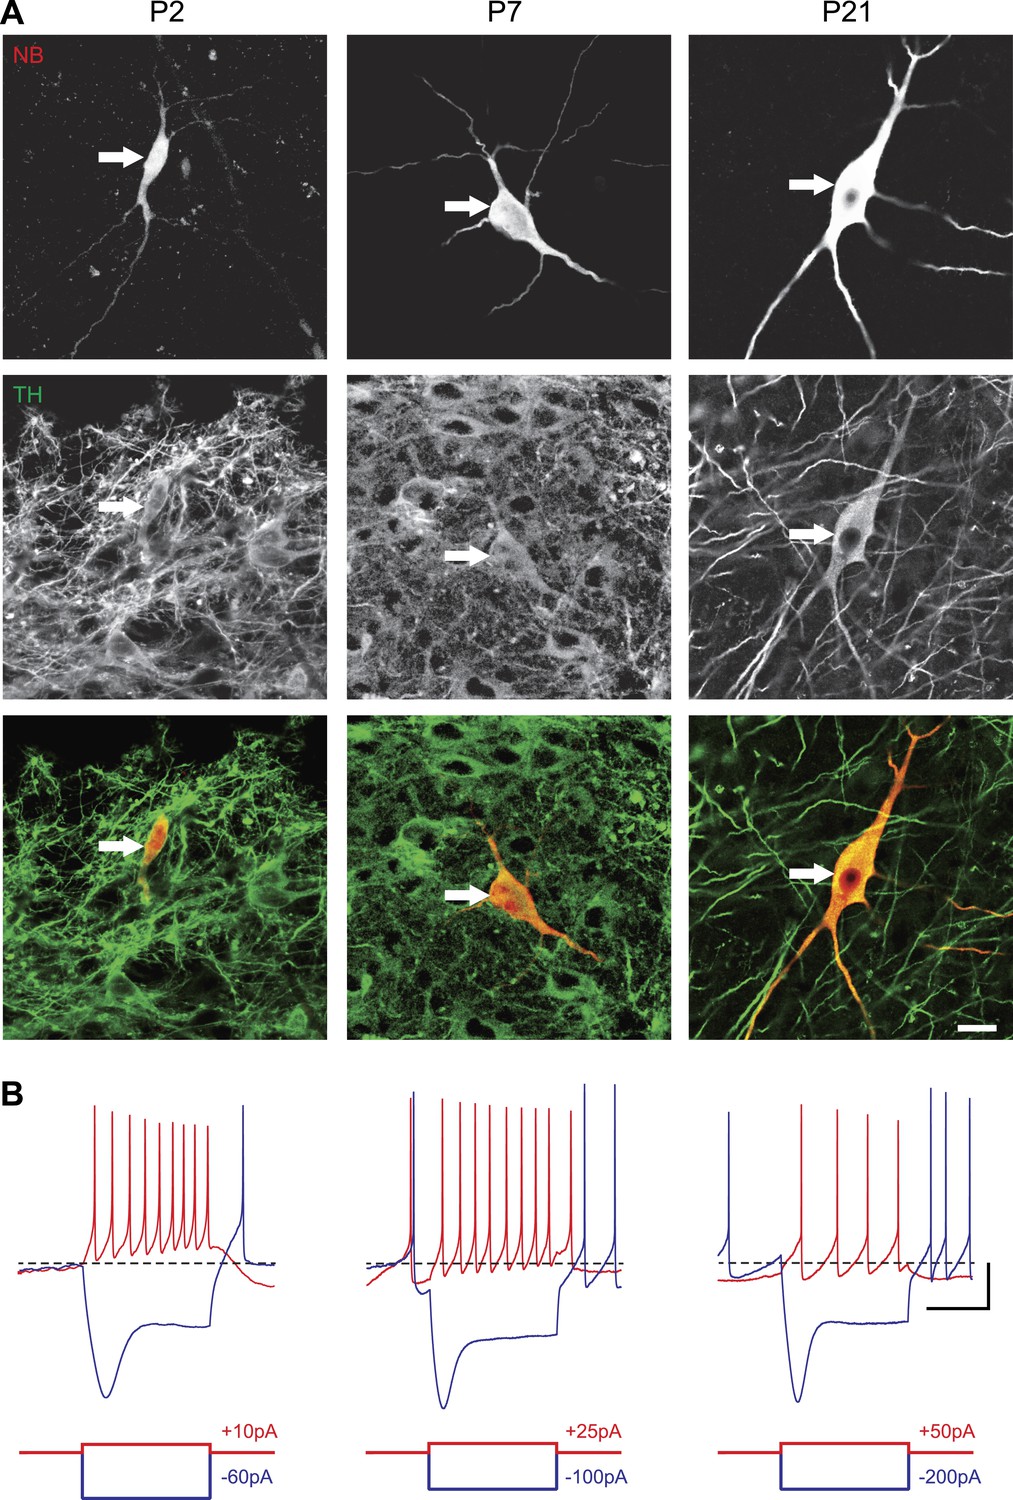
Identification of substantia nigra pars compacta dopaminergic neurons during postnatal development.
(A), top, fluorescent streptavidin labeling of P2 (left), P7 (center) and P21 (right) neurons filled with neurobiotin (NB). Middle, tyrosine hydroxylase (TH) immunolabeling of the same neurons. Bottom, merged images showing the NB (red) and TH (green) labeling, confirming the dopaminergic nature of the recorded neurons. (B), characteristic voltage traces obtained from P2 (top left), P7 (top center) and P21 (top right) subtantia nigra pars compacta dopaminergic neurons in response to hyperpolarizing (blue) and depolarizing (red) current pulses (bottom traces). At each developmental stage, dopaminergic neurons displayed consistent TH labeling (A), as well as a typical sag in response to hyperpolarizing current pulses (B) and a broad AP (not shown). Scale bars: A, 10 µm; B, vertical 20 mV, horizontal 500 ms. The horizontal dotted line in B indicates −60 mV.
Figure 2 with 1 supplement
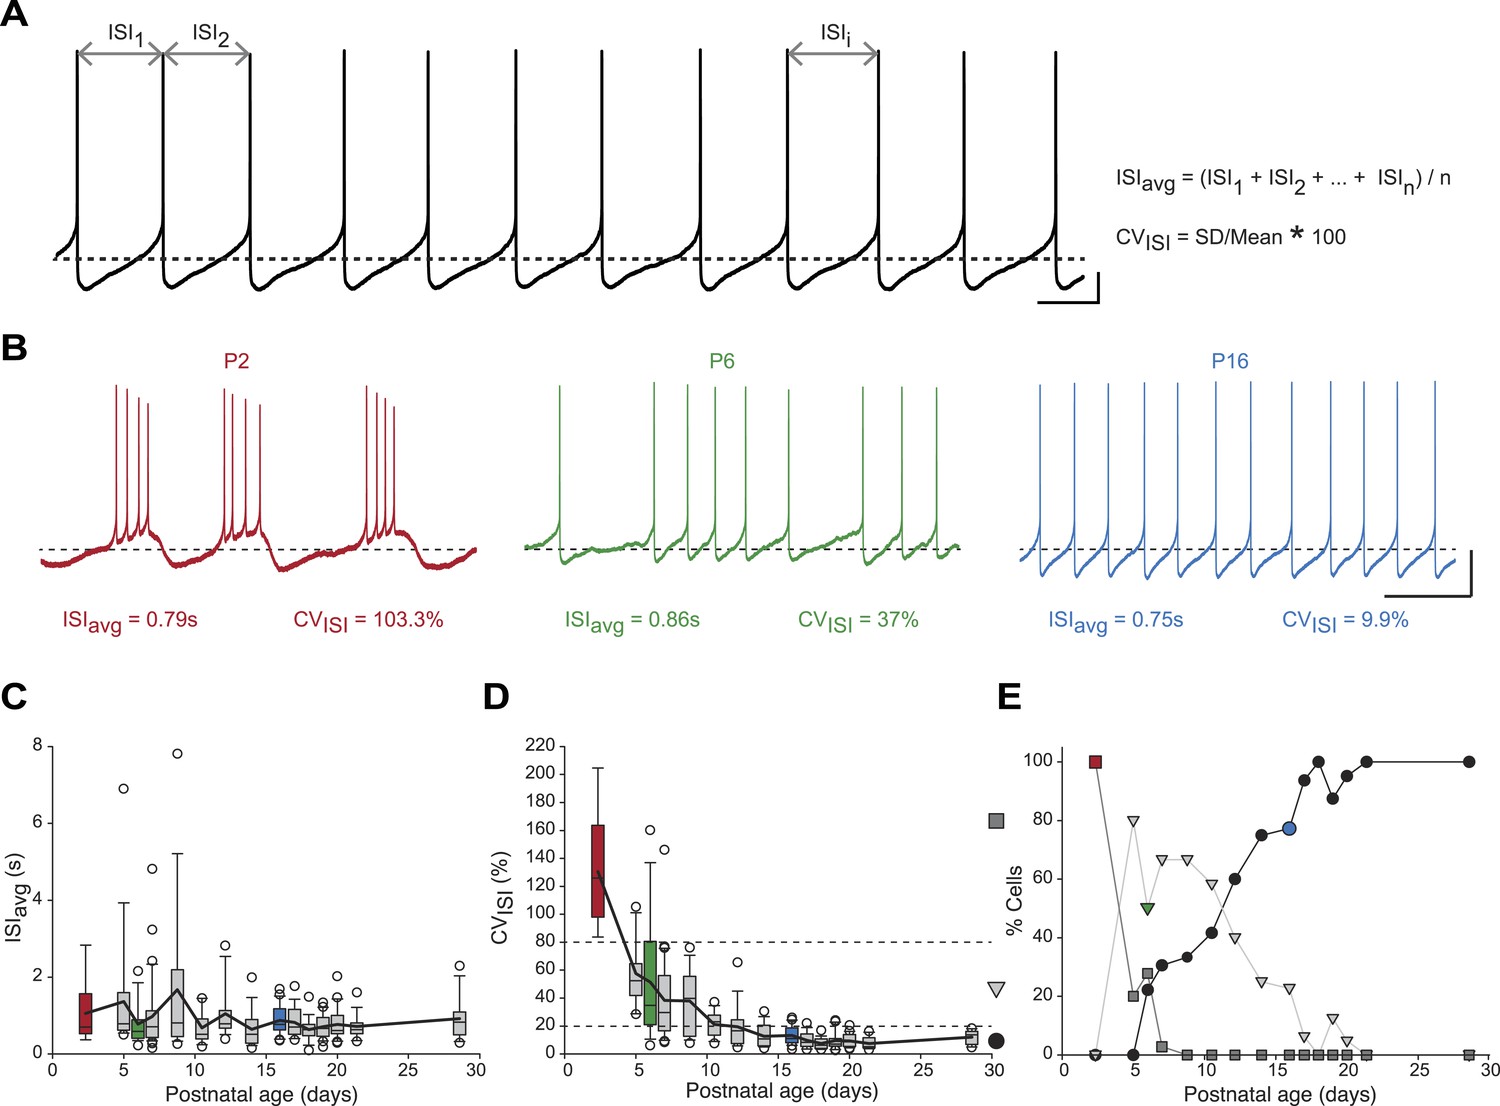
Postnatal evolution of spontaneous activity patterns in substantia nigra pars compacta dopaminergic neurons.
(A), typical voltage recording from a regular pacemaker dopaminergic neuron depicting the parameters extracted to characterize spontaneous activity patterns. Interspike intervals (ISI1, ISI2…ISIi…ISIn) were averaged to calculate the ISIavg while the coefficient of variation of the n ISIs (CVISI) was computed from the standard deviation (SD) of the n ISIs and ISIavg. (B), voltage traces showing the bursting (high CVISI, left, red), irregular (moderate CVISI, center, green) and regular (low CVISI, right, blue) patterns of spontaneous activity observed during the first four postnatal weeks. (C), box and whisker plot representing ISIavg vs postnatal age. (D), box and whisker plot representing CVISI vs postnatal age. Two CVISI threshold values (20 and 80%, horizontal dotted lines) separated three classes of activity patterns: low CV (CVISI < 20%, black circle), medium CV (20% < CVISI < 80%, light gray triangle), high CV (CVISI > 80%, dark gray square). The dark gray square, light gray triangle and black circle on the right indicate the symbols used to represent the three different CV classes (high CV, medium CV and low CV, respectively) in panel E. (E), line and scatter plot representing the evolution of the percentages of high CV (dark gray square), medium CV (light gray triangle) and low CV (black circle) activity patterns vs postnatal age. Scale bars: A, vertical 10 mV, horizontal 500 ms; B, vertical 20 mV, horizontal 2 s. Horizontal dotted lines in A and B indicate −60 mV. For all box and whisker plots, boxes represent the median, first and third quartile, error bars correspond to 10 and 90%, the thick line corresponds to the mean, and all outliers are represented. Colored boxes and symbols in C, D and E match the age and type of firing of the colored traces presented in B (red for P2, bursting; green for P6, irregular; blue for regular, P16).
Figure 2—figure supplement 1
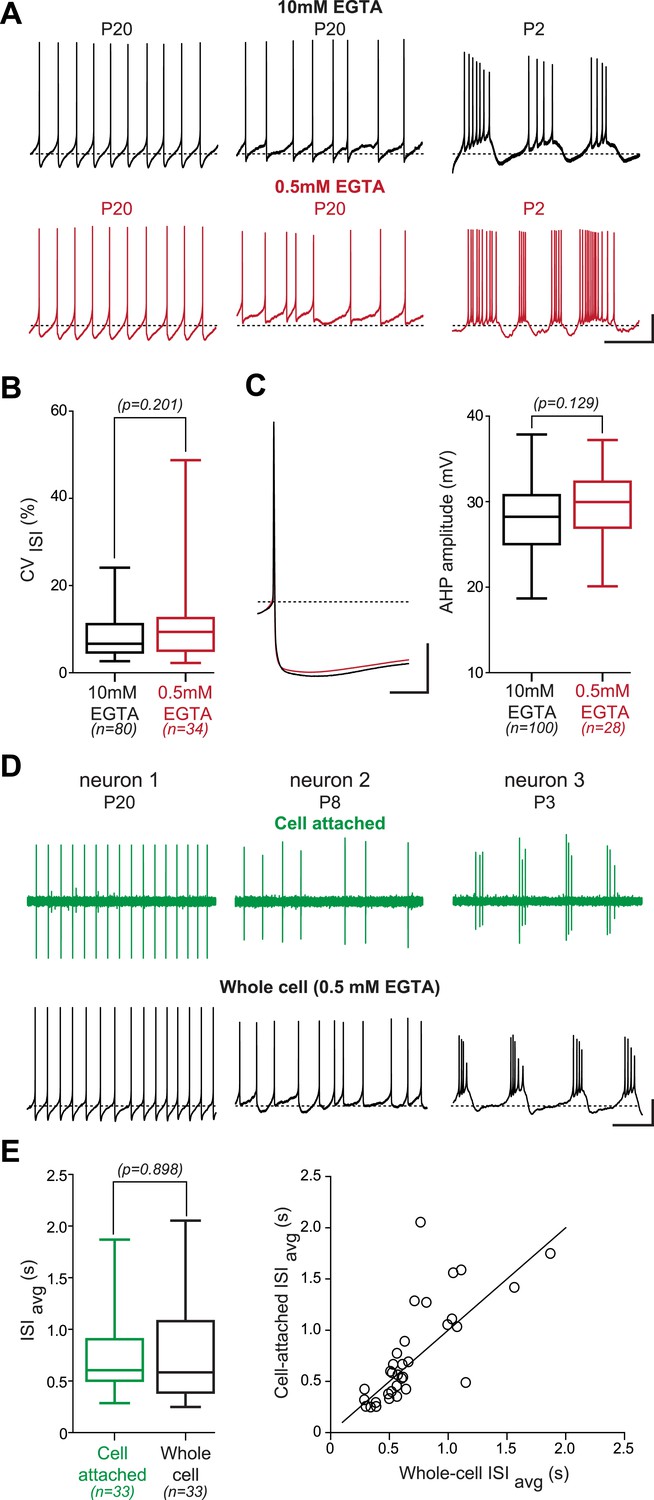
Lack of effect of the recording condition on the activity pattern of substantia nigra pars compacta dopaminergic neurons.
(A), voltage recordings showing that regular (left), irregular (center) and bursting (right) patterns of activity are observed independent of the concentration of EGTA (top black traces, 10 mM; bottom red traces, 0.5 mM) contained in the patch recording solution. (B), box and whisker plot showing that the CVISI is not significantly different between the 10 mM and the 0.5 mM EGTA conditions (unpaired t test, p = 0.201). (C), the amplitude of the after hyperpolarization (AHP) is not modified by the EGTA concentration. Left, average voltage traces showing the amplitude of the AHP following the AP in 10 mM (black trace, n = 100) and in 0.5 mM EGTA (red trace, n = 28). Right, box and whisker plot showing that the AHP amplitude is not significantly different between the two recording conditions (unpaired t test, p = 0.129). (D), voltage recordings obtained from three dopaminergic neurons showing that the three types of activity patterns are observed both in cell-attached (top, green traces) and in whole-cell configuration (bottom, black traces). (E), the firing rate is not significantly modified when going whole-cell. Left, box and whisker plot based on 33 P19 neurons showing that the ISIavg is not significantly modified by the whole-cell compared to the cell-attached configuration (p = 0.898). Right, scatter plot representing the ISIavg recorded in cell-attached configuration vs the ISIavg recorded in whole-cell configuration for the 33 cells represented in the box and whisker plot. The line represents the identity line. Scale bars: A, vertical 20 mV, horizontal 2 s; C, vertical 20 mV, horizontal 25 ms; D, vertical 20 mV, horizontal 2 s. Dotted lines in A, C and D (lower traces) indicate −60 mV. For all box and whisker plots, boxes represent the median, first and third quartile, and error bars correspond to the min and max of the distribution.
Figure 3

Statistical stacking table summarizing the statistical differences in 16 electrophysiological parameters across 15 developmental stages.
Each major cell corresponding to the comparison between two developmental stages is subdivided in 16 sub-cells corresponding to the 16 electrophysiological parameters as depicted in the inset. The color of each sub-cell indicates the level of significance of the statistical comparison (white, non-significant; light gray, p < 0.05; dark gray, p < 0.01; black, p < 0.001). Statistical comparisons were performed for each electrophysiological parameter separately using a one-way ANOVA with post-hoc Tukey correction for multiple comparisons. Abbreviations: ISIavg, averaged interspike interval; Rin, input resistance; Cm, membrane capacitance; τm, membrane time constant; Reb, rebound delay; AHP, afterhyperpolarization; CVISI, coefficient of variation of the interspike interval; Thre, AP threshold; Ampl, AP amplitude; HW, AP half-width; Rise, AP rise slope; Decay, AP decay slope; GS, gain start; GE, gain end; SFA, spike frequency adaptation.
Figure 4

Postnatal evolution of passive properties in substantia nigra pars compacta dopaminergic neurons.
(A), parameters extracted to characterize the passive properties of dopaminergic neurons. The input resistance (Rin), membrane capacitance (Cm) and the membrane time constant (Taum) were calculated based on the voltage response (top, black trace) of the neuron to a small step of hyperpolarizing current (bottom, gray trace). (B), voltage traces (black) obtained in response to current steps (gray) of different amplitudes in P3 (top), P6 (middle) and P21 (bottom) dopaminergic neurons. (C), box and whisker plot representing Rin vs postnatal age. (D), box and whisker plot representing Cm vs postnatal age. (E), box and whisker plot representing Taum vs postnatal age. Scale bars: A and B, vertical 5 mV, horizontal 250 ms. Dotted lines in A indicate the voltage values used to calculate ΔV. For all box and whisker plots, boxes represent the median, first and third quartile, error bars correspond to 10 and 90%, the thick line corresponds to the mean, and all outliers are represented. Colored boxes in C, D and E correspond to the age of the colored traces presented in B (red for P3, green for P6, blue for P21).
Figure 5

Postnatal evolution of sag and rebound delay in substantia nigra pars compacta dopaminergic neurons.
(A), sag amplitude and delay were extracted from the voltage response (top, black trace) of the neuron to a large hyperpolarizing current step (bottom, gray trace). (B), voltage recordings showing the typical sag and rebound delay of P3 (top, red), P6 (middle, green) and P21 (bottom, blue) dopaminergic neurons in response to hyperpolarizing current steps (gray traces). (C), top, box and whisker plot representing sag amplitude vs postnatal age. Bottom, box and whisker plot representing rebound delay vs postnatal age. Scale bars: A and B, vertical 20 mV, horizontal 150 ms. Horizontal dotted line in A indicates the voltage peak of the hyperpolarizing response. Vertical dotted line indicates the end of the current pulse used to calculate the delay. For all box and whisker plots, boxes represent the median, first and third quartile, error bars correspond to 10 and 90%, the thick line corresponds to the mean, and all outliers are represented. Colored boxes in C correspond to the age of the colored traces presented in B (red for P3, green for P6, blue for P21).
Figure 6
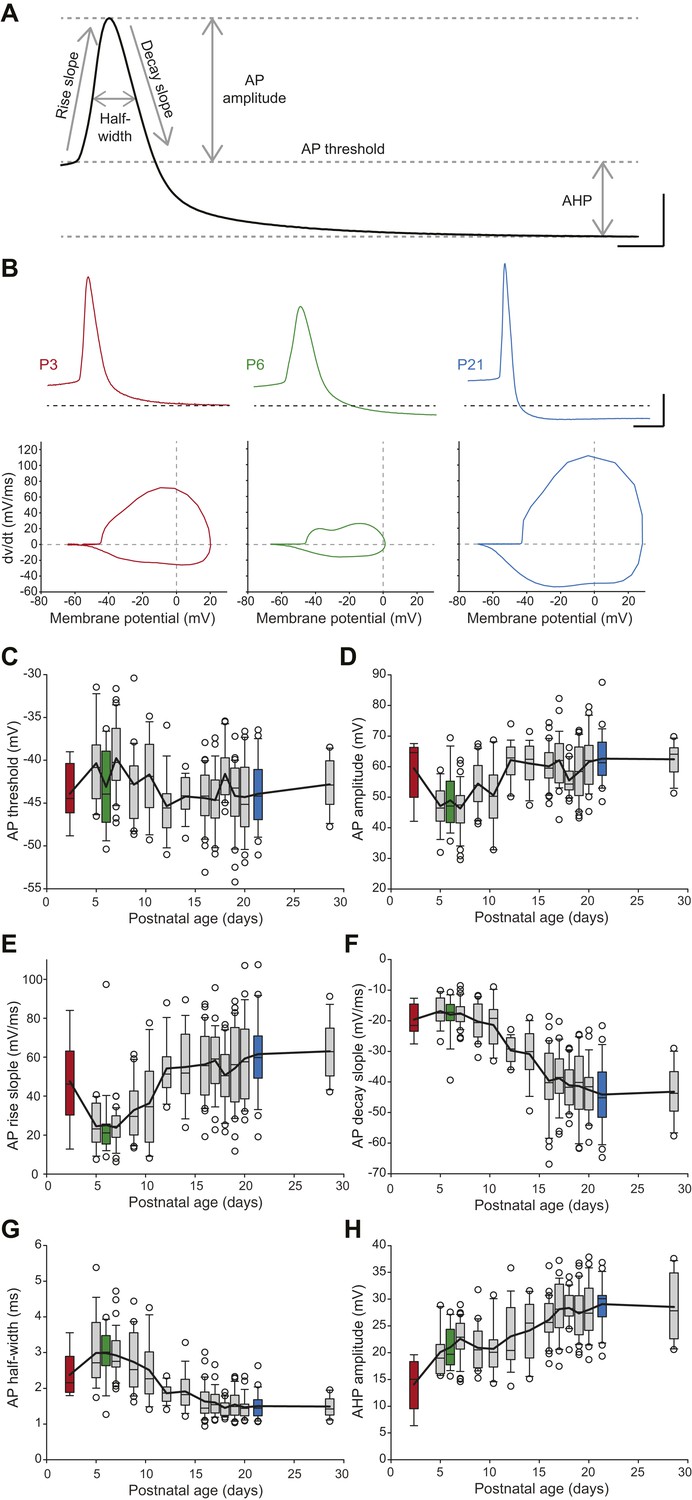
Postnatal evolution of action potential properties in substantia nigra pars compacta dopaminergic neurons.
(A), voltage recording depicting the parameters extracted to characterize the action potential (AP) in dopaminergic neurons. Six parameters were extracted: rise slope, decay slope, half-width, amplitude, threshold and AHP amplitude. (B), typical APs (top traces) recorded in P3 (left, red), P6 (center, green) and P21 (right, blue) dopaminergic neurons with the corresponding phase plots representing the first time derivative of voltage vs voltage (bottom). (C), box and whisker plot representing AP threshold vs postnatal age. (D), box and whisker plot representing AP amplitude vs postnatal age. (E), box and whisker plot representing AP rise slope vs postnatal age. (F), box and whisker plot representing AP decay slope vs postnatal age. (G), box and whisker plot representing AP half-width vs postnatal age. (H), box and whisker plot representing AHP amplitude vs postnatal age. Scale bars: A, vertical 20 mV, horizontal 2 ms; B, vertical 20 mV, horizontal 5 ms. For all box and whisker plots, boxes represent the median, first and third quartile, error bars correspond to 10 and 90%, the thick line corresponds to the mean, and all outliers are represented. Colored boxes in C–H correspond to the age of the colored traces presented in B (red = P3, green = P6, blue = P21).
Figure 7

Postnatal evolution of membrane excitability in substantia nigra pars compacta dopaminergic neurons.
(A), voltage traces depicting the parameters extracted to characterize membrane excitability. The firing frequency of the neuron was measured in response to 1 s current pulses of increasing amplitude (from 50 pA to 300 pA for the neuron shown in this panel), and the starting and ending AP frequencies were calculated for each pulse, based on the first three and last three APs, respectively (left and center panels). The gain at the start (GS) and at the end (GE) of the pulse were then extracted from the linear regression of the AP frequency vs current plot (right panel). The spike frequency adaptation (SFA) index was computed as the ratio GS/GE. (B), responses of P3 (left, red), P8 (center, green) and P21 (right, blue) neurons to 100 pA depolarizing pulses. Voltage recordings (bottom traces) and corresponding timecourses of instantaneous spike frequency (top plots) are shown for the three developmental stages. SFA index values calculated as presented in A are given for each neuron. (C), box and whisker plot representing GS vs postnatal age. (D), box and whisker plot representing GE vs postnatal age. (E), box and whisker plot representing SFA index vs postnatal age. Scale bars: A, vertical 20 mV, horizontal 250 ms. For all box and whisker plots, boxes represent the median, first and third quartile, error bars correspond to 10 and 90%, the thick line corresponds to the mean, and all outliers are represented. Colored boxes in C, D and E correspond to the age of the colored traces presented in B (red for P3, green for P8, blue for P21).
Figure 8
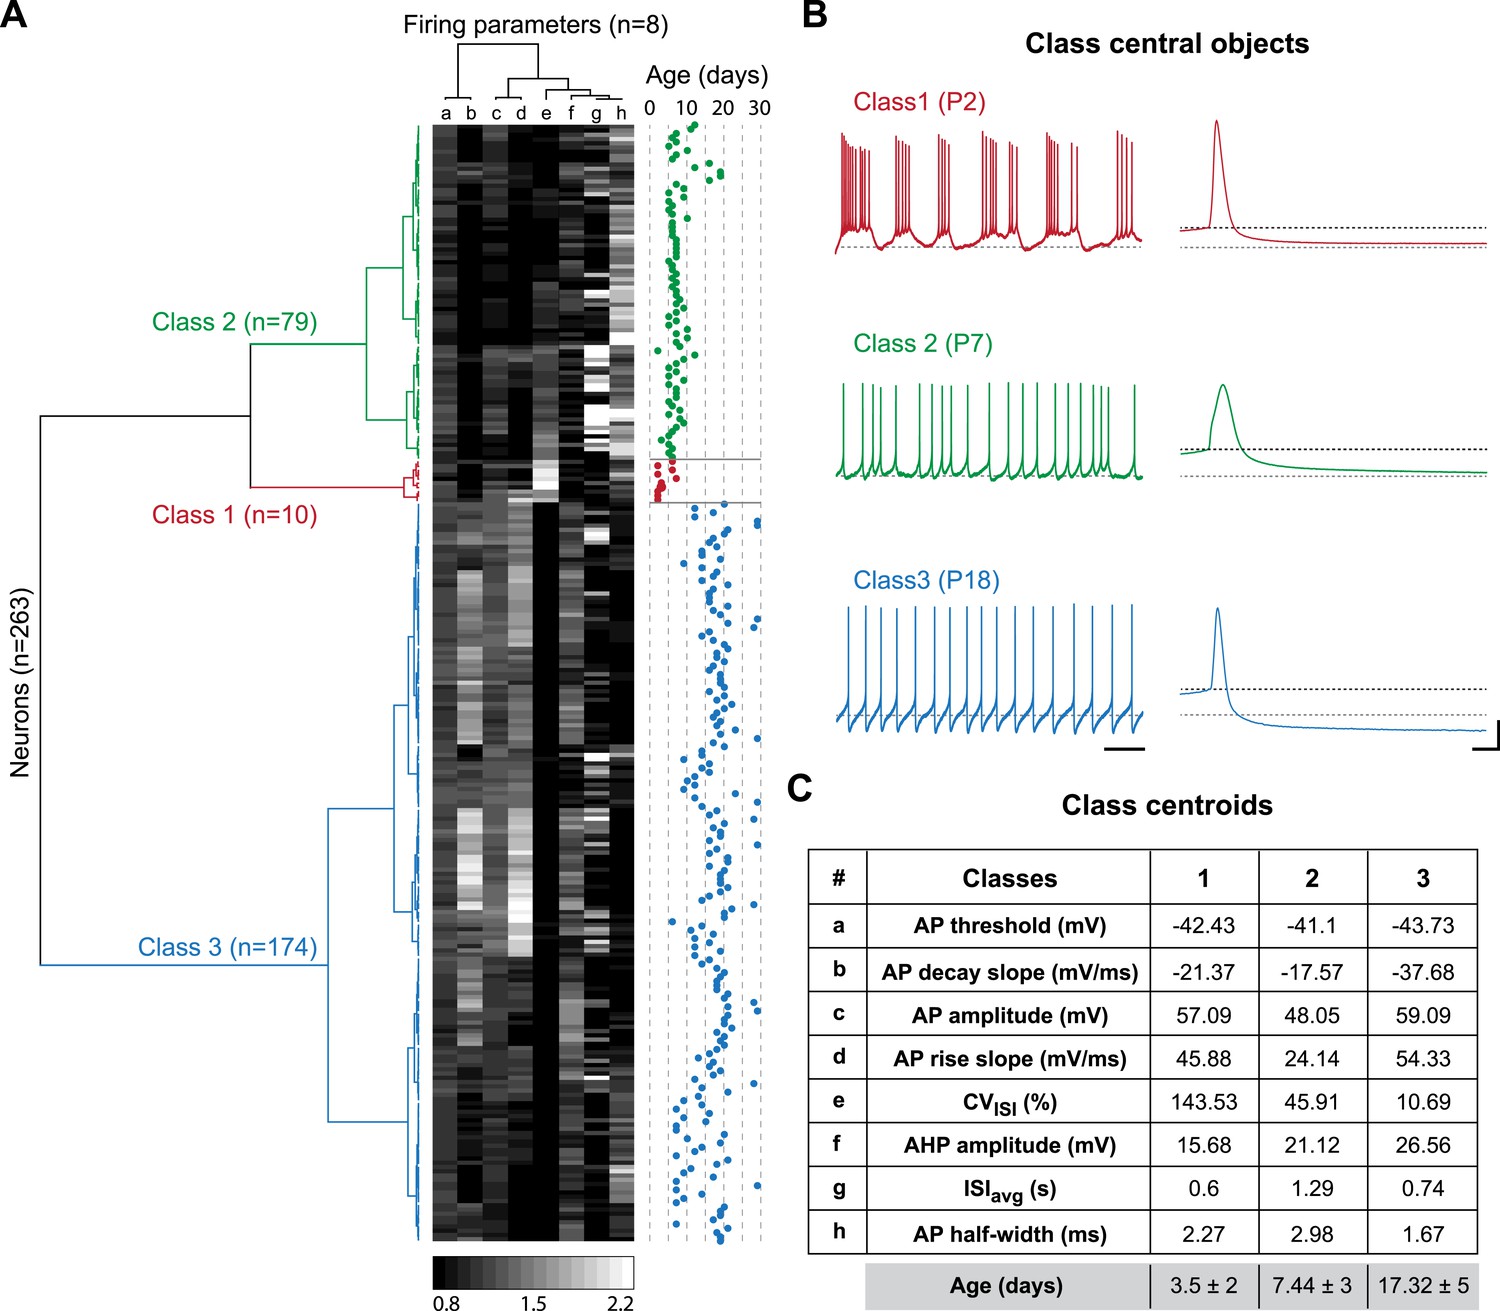
Agglomerative hierarchical clustering analysis of electrophysiological classes of substantia nigra pars compacta dopaminergic neurons during postnatal development.
(A), dendrogram representing the agglomerative hierarchical clustering (AHC) of the 263 P2–P29 recorded neurons into three classes based on the 8 electrophysiological parameters (a to h) listed in panel C. The graded gray heat map represents the value of each electrophysiological parameter for each neuron normalized to the mean of the parameter for the whole population (scale bar at the bottom of the graph). The age of each neuron is plotted on the right and gives an indication of the relationship between the 3 electrophysiological classes and postnatal age. (B), voltage recordings corresponding to the central objects of each class showing the differences in spontaneous activity patterns and AP shape associated with each class. (C), table presenting the values of the 8 electrophysiological parameters for each class centroid. As an indication, the average age of each class was calculated and is given in the last row in gray (mean ± SD). Scale bars: B, vertical 20 mV, horizontal 2 s and 5 ms for the left and right column traces, respectively. The gray and black dotted lines in panel B indicate −60 mV and the AP threshold, respectively. Colors in A and B indicate the three classes (red for class 1, green for class 2, blue for class 3).
Figure 9

Principal component analysis of the electrophysiological behavior of substantia nigra pars compacta dopaminergic neurons during postnatal development.
(A), polar plot representing the respective contribution of each of the 8 electrophysiological parameters to the two principal components retained from the PCA (PC1 and PC2). (B), scatter plot representing the factor loadings of the 263 P2–P29 neurons in the PC2 vs PC1 space. The points are color-coded as a function of the AHC class: red circles for class 1, green squares for class 2 and blue triangles for class 3. Light color symbols correspond to individual neurons while bright color symbols represent the averaged factor loadings for each class (error bars represent the SD). (C1), scatter plot representing the factor loadings of the 263 P2–P29 neurons (gray circles) and the averaged factor loadings for each developmental stage (colored circles). Error bars represent the standard error of the mean. (C2), expanded version of the scatter plot presented in C1 centered on the later developmental stages (P12–P13 to P28–P29).
Figure 10
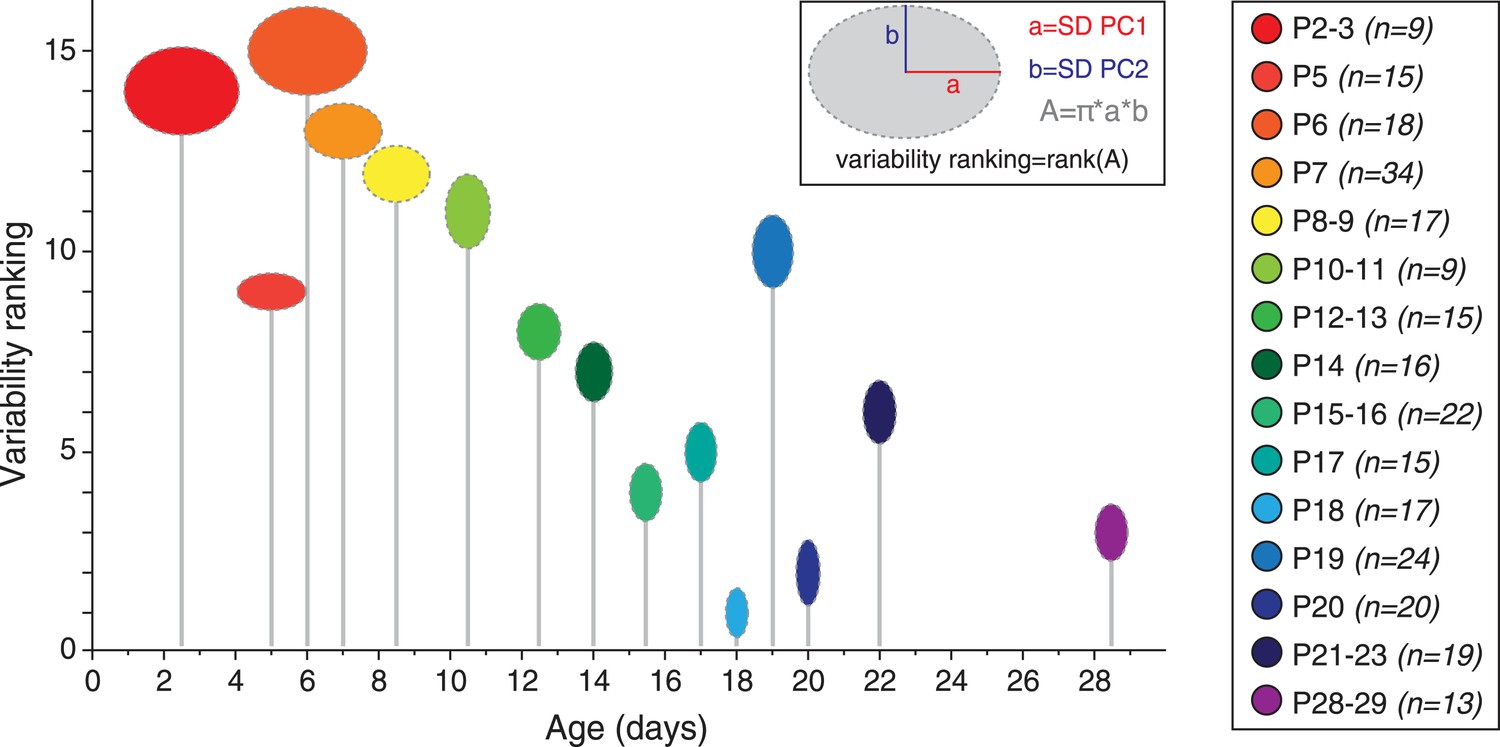
Developmental timecourse of electrical phenotype variability.
Bubble plot representing the variability in electrical phenotype for each developmental stage in Figure 9C. The size of each ellipse is determined by the values of the standard deviations for PC1 (horizontal semi-axis, a) and PC2 (vertical semi-axis, b), as indicated in the inset. The Y-coordinate of each ellipse (variability ranking value) is then determined by the surface area A of each ellipse, which is proportional to phenotype variability as defined in the PCA space. Each ellipse is positioned along the X-axis according to the developmental stage it represents (gray drop line).
Figure 11 with 1 supplement
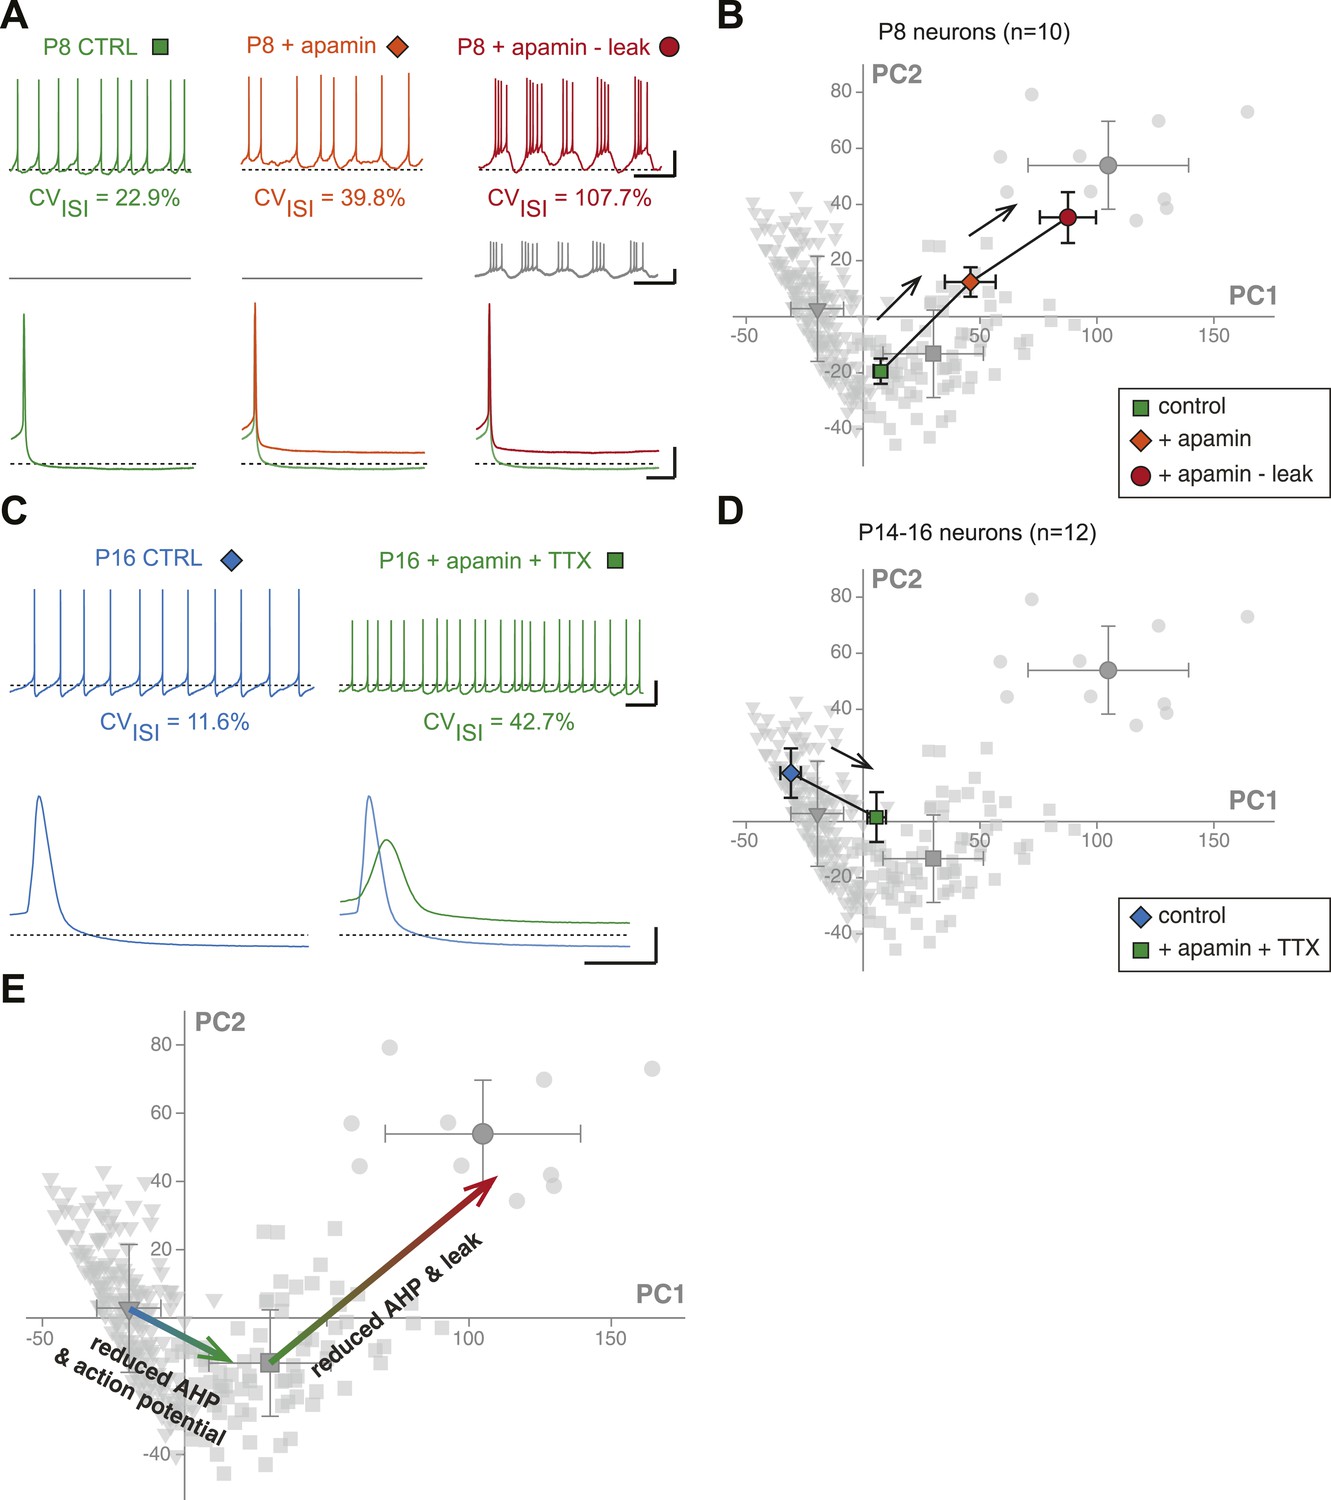
Reproducing the developmental transitions in electrical phenotype using pharmacology and dynamic clamp.
(A), current-clamp recordings (top traces) obtained from a P8 neuron in control condition (left, green), during apamin application (center, orange), and during apamin application + negative leak injection (right, red). The middle traces (gray) correspond to the dynamic clamp-injected current while the lower traces show the changes in shape of the AHP in the different conditions. (B), average factor loadings obtained for 10 P8 neurons recorded in the three conditions presented in A and plotted in the PCA space presented in Figure 9B. The background gray points correspond to the three classes identified using AHC, and are plotted as a reference. (C), current-clamp recordings (top traces) of a P14 neuron recorded in control condition (left, blue) and in the presence of apamin and TTX (right, green). The lower traces show the changes in the AP induced by apamin + TTX. (D), average factor loadings obtained for 12 P14–16 neurons recorded in the two conditions presented in C and plotted in the PCA space presented in Figure 9. The background gray points correspond to the three classes identified using AHC, and are plotted as a reference. (E), summary of the changes in phenotype induced by the manipulations presented in A–B and C–D. The total vectors corresponding to apamin − leak (P8 neurons) and apamin + TTX (P14–16 neurons) were locked on the averages of the classes 2 and 3 of the AHC (corresponding to average ages of P7 and P17, respectively). Scale bars: A, vertical 20 mV (top and bottom traces) and 10 pA (middle traces), horizontal 2 s (top and middle traces) and 50 ms (bottom traces). (C), vertical 20 mV, horizontal 1 s and 5 ms for the top and bottom traces, respectively. The black dotted lines in panel A and C indicate −60 mV.
Figure 11—figure supplement 1
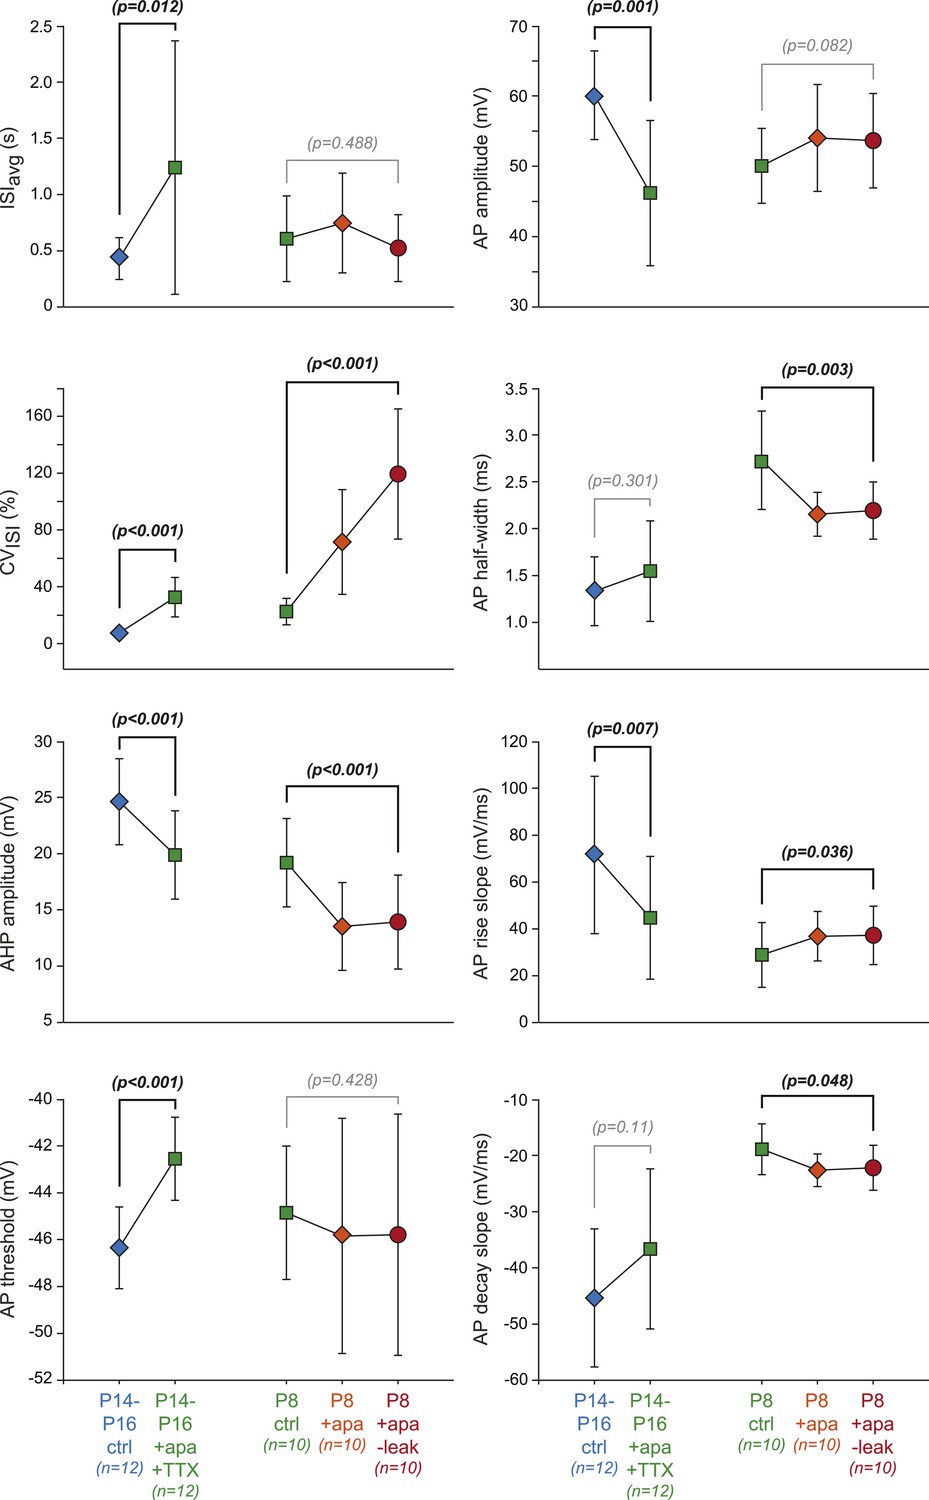
Effect of dynamic-clamp and pharmacological manipulations on 8 individual electrophysiological properties.
Scatter plots representing the changes in the 8 electrophysiological properties (ISIavg, CVISI, AHP amplitude, AP threshold, AP amplitude, AP half-width, AP rise slope, AP decay slope) corresponding to the changes in PCA factor loadings presented in Figure 11B,D. Paired statistical tests (paired t test or Wilcoxon signed rank test) were performed between the initial (P14–P16 ctrl, P8 ctrl) and the final conditions (P14–P16 + apamin + TTX, P8 + apamin − leak, respectively) and the corresponding p values are shown. Significant statistical differences appear in black while non-significant differences appear in gray. Data are presented as mean ± SD.
Tables
Table 1
Descriptive statistics of the 16 electrophysiological parameters measured on substantia nigra pars compacta dopaminergic neurons across postnatal development
| Age | ISIavg (s) | CVISI (%) | τm (ms) | Rin (MOhm) | Cm (pF) | Sag (mV) | Rebound (ms) | AP threshold (mV) | ||||||||||||||||
|---|---|---|---|---|---|---|---|---|---|---|---|---|---|---|---|---|---|---|---|---|---|---|---|---|
| Mean | SD | N | ||||||||||||||||||||||
| P2–P3 | 1.06 | 0.84 | 9 | 130.5 | 40.1 | 9 | 200.3 | 8.0 | 5 | 1642 | 420 | 5 | 129 | 34 | 5 | 28.2 | 4.0 | 9 | 465 | 134 | 6 | −43.9 | 3.3 | 9 |
| P5 | 1.36 | 1.60 | 15 | 57.6 | 22.6 | 15 | 86.9 | 13.7 | 11 | 642 | 163 | 11 | 146 | 52 | 11 | 29.4 | 5.7 | 14 | 339 | 188 | 12 | −40.3 | 4.5 | 15 |
| P6 | 0.78 | 0.56 | 18 | 51.5 | 43.0 | 18 | 70.3 | 23.9 | 18 | 612 | 170 | 18 | 118 | 32 | 18 | 30.2 | 7.2 | 18 | 316 | 127 | 18 | −43.1 | 4.3 | 19 |
| P7 | 0.97 | 0.93 | 36 | 38.4 | 28.0 | 36 | 89.3 | 24.4 | 25 | 650 | 174 | 26 | 143 | 38 | 25 | 31.2 | 5.2 | 25 | 249 | 89 | 19 | −39.8 | 4.0 | 35 |
| P8–P9 | 1.67 | 1.95 | 18 | 38.0 | 23.2 | 18 | 90.9 | 38.4 | 21 | 576 | 268 | 21 | 200 | 141 | 21 | 29.6 | 6.2 | 17 | 401 | 212 | 15 | −42.8 | 4.3 | 20 |
| P10–P11 | 0.68 | 0.41 | 12 | 21.1 | 8.6 | 12 | 80.6 | 28.6 | 10 | 327 | 210 | 10 | 281 | 109 | 10 | 33.3 | 4.2 | 10 | 330 | 165 | 10 | −41.7 | 4.2 | 11 |
| P12–P13 | 1.04 | 0.67 | 15 | 19.6 | 15.1 | 15 | 87.9 | 32.7 | 17 | 369 | 166 | 17 | 297 | 226 | 17 | 32.4 | 3.7 | 16 | 378 | 341 | 16 | −45.4 | 3.7 | 18 |
| P14 | 0.64 | 0.48 | 16 | 12.8 | 8.3 | 16 | 92.3 | 44.0 | 14 | 460 | 192 | 14 | 205 | 68 | 14 | 35.6 | 2.9 | 10 | 489 | 448 | 9 | −44.2 | 2.3 | 16 |
| P15–P16 | 0.88 | 0.38 | 22 | 13.3 | 6.6 | 22 | 77.8 | 28.5 | 19 | 325 | 117 | 19 | 245 | 67 | 19 | 27.9 | 6.5 | 33 | 340 | 207 | 30 | −44.4 | 3.4 | 30 |
| P17 | 0.82 | 0.40 | 16 | 9.9 | 5.6 | 16 | 83.5 | 25.7 | 20 | 323 | 109 | 22 | 283 | 160 | 20 | 28.1 | 7.4 | 35 | 375 | 270 | 26 | −44.6 | 3.5 | 28 |
| P18 | 0.63 | 0.30 | 18 | 7.6 | 4.0 | 18 | 89.0 | 24.2 | 18 | 340 | 118 | 18 | 280 | 86 | 18 | 29.5 | 4.2 | 22 | 433 | 222 | 20 | −41.6 | 3.0 | 21 |
| P19 | 0.71 | 0.32 | 24 | 9.6 | 6.1 | 24 | 89.9 | 28.1 | 30 | 352 | 103 | 30 | 270 | 106 | 30 | 28.6 | 6.2 | 38 | 456 | 278 | 32 | −44.2 | 4.1 | 33 |
| P20 | 0.77 | 0.42 | 21 | 9.3 | 4.8 | 21 | 88.5 | 41.8 | 22 | 375 | 116 | 23 | 231 | 66 | 22 | 28.5 | 8.3 | 24 | 572 | 493 | 22 | −44.3 | 4.4 | 24 |
| P21–P23 | 0.72 | 0.32 | 19 | 7.5 | 4.5 | 19 | 93.1 | 48.2 | 21 | 319 | 115 | 23 | 293 | 128 | 21 | 27.5 | 6.6 | 23 | 388 | 254 | 22 | −43.9 | 4.0 | 24 |
| P28–P29 | 0.92 | 0.54 | 12 | 12.1 | 4.7 | 12 | 148.3 | 42.6 | 10 | 472 | 88 | 10 | 316 | 83 | 10 | 34.1 | 4.5 | 13 | 736 | 375 | 10 | −42.8 | 3.0 | 12 |
| Age | AP amplitude (mV) | AP half-width (ms) | AP rise slope (mV/ms) | AP decay slope (mV/ms) | AHP (mV) | Gain start (Hz/100pA) | Gain end (Hz/100pA) | SFA index | ||||||||||||||||
|---|---|---|---|---|---|---|---|---|---|---|---|---|---|---|---|---|---|---|---|---|---|---|---|---|
| P2–P3 | 59.5 | 9.6 | 9 | 2.38 | 0.62 | 9 | 47.6 | 21.7 | 9 | −19.6 | 5.2 | 9 | 14.1 | 4.9 | 9 | 32.1 | 5.9 | 6 | 20 | 7.8 | 6 | 1.76 | 0.53 | 6 |
| P5 | 47.1 | 7.4 | 15 | 2.99 | 0.95 | 15 | 24.5 | 10.8 | 15 | −16.9 | 4.6 | 15 | 20.1 | 4.5 | 15 | 17.7 | 5 | 7 | 8.8 | 2.1 | 7 | 2.07 | 0.71 | 7 |
| P6 | 49.0 | 9.2 | 19 | 2.99 | 0.71 | 19 | 25.1 | 19.2 | 19 | −18.0 | 6.6 | 19 | 21.0 | 3.7 | 19 | 22.7 | 6.5 | 10 | 11.7 | 3.7 | 10 | 1.97 | 0.27 | 10 |
| P7 | 46.3 | 7.8 | 35 | 2.92 | 0.64 | 35 | 23.8 | 8.6 | 35 | −17.6 | 4.1 | 35 | 22.6 | 3.7 | 35 | 17.5 | 4.7 | 13 | 8.83 | 2.4 | 13 | 2.08 | 0.71 | 13 |
| P8–P9 | 54.4 | 7.4 | 20 | 2.74 | 0.82 | 20 | 32.8 | 14.8 | 20 | −20.2 | 5.9 | 20 | 20.9 | 4.2 | 20 | 18.1 | 4.3 | 13 | 10.4 | 3.3 | 13 | 1.80 | 0.31 | 13 |
| P10–P11 | 50.6 | 11.6 | 11 | 2.51 | 0.83 | 11 | 36.3 | 21.2 | 11 | −21.4 | 7.5 | 11 | 20.7 | 4.9 | 11 | 11 | 4.5 | 10 | 11.5 | 5.3 | 10 | 1.01 | 0.30 | 10 |
| P12–P13 | 62.1 | 6.3 | 18 | 1.86 | 0.27 | 18 | 54.2 | 14.5 | 18 | −29.7 | 4.2 | 18 | 23.0 | 6.0 | 18 | 13.2 | 5 | 15 | 11.6 | 4.5 | 15 | 1.29 | 0.80 | 15 |
| P14 | 61.0 | 7.1 | 16 | 1.91 | 0.54 | 16 | 54.9 | 18.4 | 16 | −30.9 | 8.5 | 16 | 24.1 | 5.5 | 16 | 12.2 | 4 | 10 | 9.8 | 2.6 | 10 | 1.30 | 0.50 | 10 |
| P15–P16 | 60.1 | 6.5 | 30 | 1.63 | 0.49 | 30 | 56.2 | 18.3 | 30 | −39.7 | 11.5 | 30 | 26.1 | 4.0 | 30 | 9.28 | 3.2 | 26 | 9.28 | 4.2 | 26 | 1.11 | 0.44 | 26 |
| P17 | 62.1 | 8.6 | 28 | 1.61 | 0.37 | 28 | 58.2 | 16.2 | 28 | −38.8 | 8.8 | 28 | 28.1 | 5.0 | 28 | 7.13 | 2.1 | 14 | 8.28 | 2.9 | 14 | 0.92 | 0.31 | 14 |
| P18 | 55.5 | 4.7 | 21 | 1.45 | 0.21 | 21 | 50.6 | 15.6 | 21 | −41.1 | 7.3 | 21 | 28.4 | 3.2 | 21 | 6.97 | 2 | 12 | 7.59 | 2.9 | 12 | 0.99 | 0.35 | 12 |
| P19 | 58.2 | 8.8 | 33 | 1.55 | 0.38 | 33 | 54.3 | 21.1 | 33 | −41.4 | 11.4 | 33 | 27.4 | 4.6 | 33 | 8.32 | 2.6 | 19 | 9.3 | 2.6 | 19 | 0.93 | 0.31 | 19 |
| P20 | 61.6 | 8.8 | 24 | 1.47 | 0.31 | 24 | 59.3 | 21.2 | 24 | −42.6 | 8.8 | 24 | 28.0 | 5.0 | 24 | 8.15 | 2.4 | 16 | 9.21 | 3 | 16 | 0.95 | 0.33 | 16 |
| P21–P23 | 62.6 | 8.2 | 24 | 1.50 | 0.37 | 24 | 61.5 | 21.0 | 24 | −44.1 | 11.4 | 24 | 29.1 | 4.3 | 24 | 6.79 | 2.1 | 24 | 7 | 1.8 | 24 | 1.01 | 0.32 | 24 |
| P28–P29 | 62.4 | 5.3 | 12 | 1.49 | 0.29 | 12 | 63.0 | 14.3 | 12 | −43.2 | 8.7 | 12 | 28.6 | 6.2 | 12 | 6.99 | 2.3 | 10 | 6.82 | 1.4 | 10 | 1.07 | 0.43 | 10 |
-
Abbreviations: ISIavg, averaged interspike interval; CVISI, coefficient of variation of the interspike interval; τm, membrane time constant; Rin, input resistance; Cm, membrane capacitance; Rebound, rebound delay; AP, action potential; AHP, after hyperpolarization; SFA, spike frequency adaptation.
Download links
A two-part list of links to download the article, or parts of the article, in various formats.
Downloads (link to download the article as PDF)
Open citations (links to open the citations from this article in various online reference manager services)
Cite this article (links to download the citations from this article in formats compatible with various reference manager tools)
Non-linear developmental trajectory of electrical phenotype in rat substantia nigra pars compacta dopaminergic neurons
eLife 3:e04059.
https://doi.org/10.7554/eLife.04059


