Quantitative microscopy of functional HIV post-entry complexes reveals association of replication with the viral capsid
- University of Heidelberg, Germany
- German Center for Infection Research, Germany
- Gilead Sciences Inc., United States
Figures
Figure 1 with 7 supplements
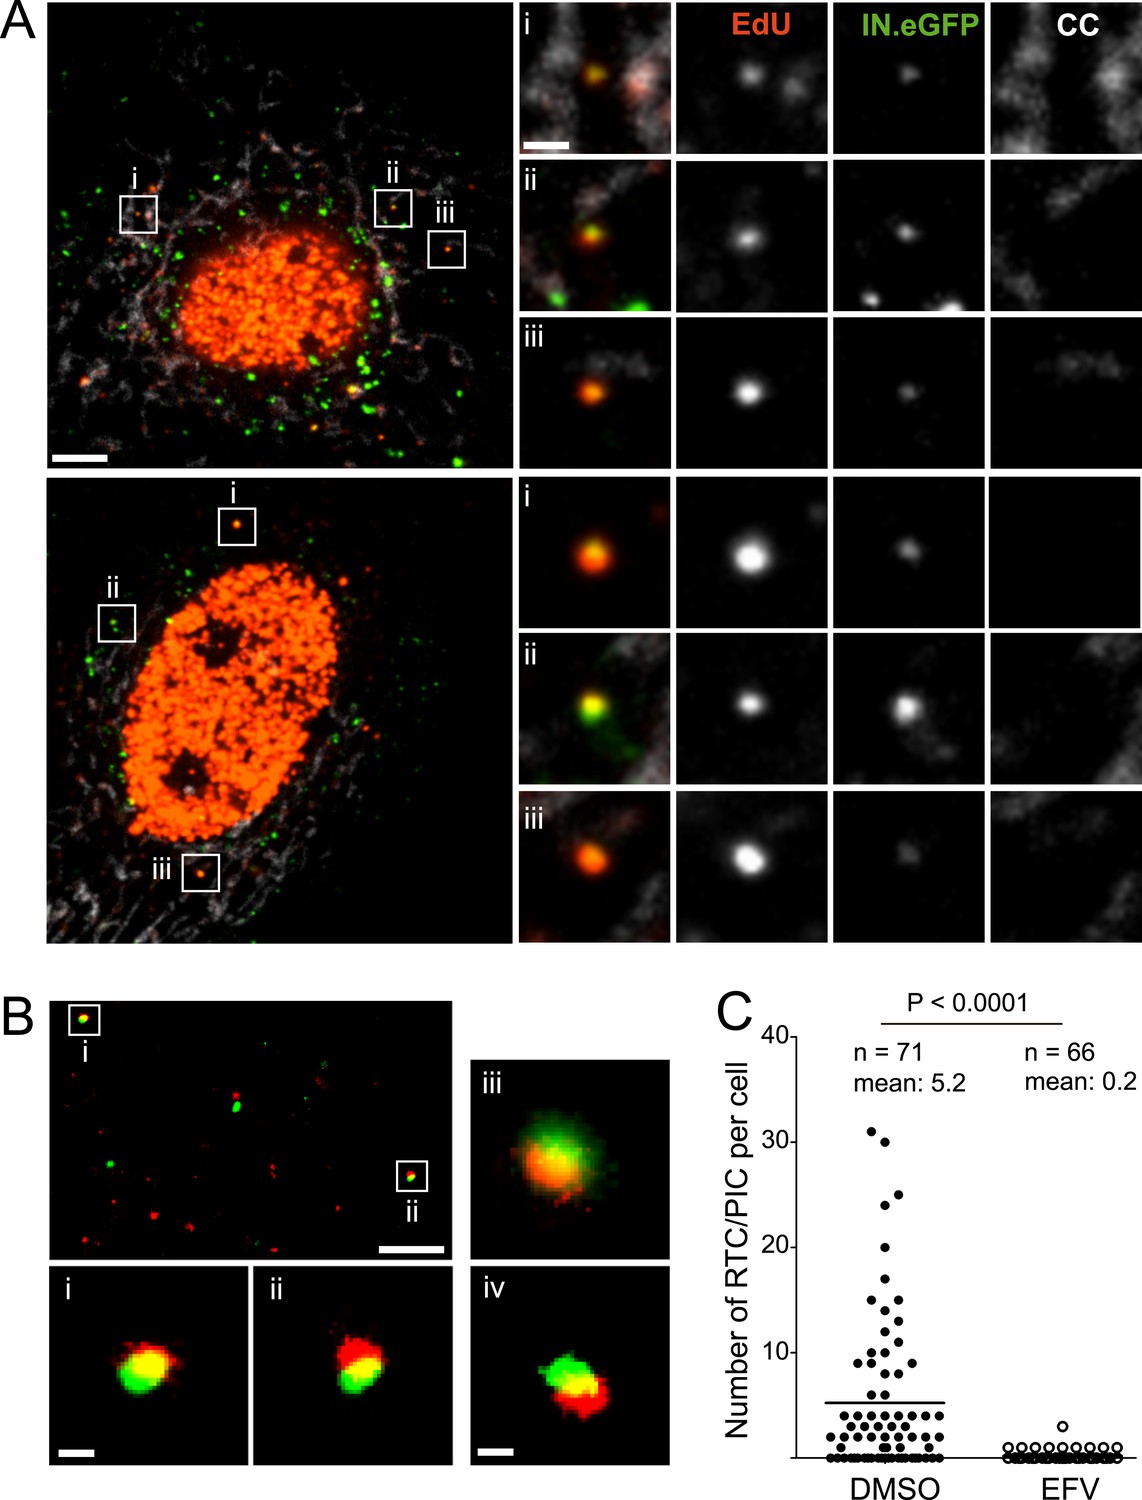
HIV-1 RTC/PIC detection in TZM-bl cells.
(A) Identification of candidate RTC/PIC based on co-localization of EdU with IN.eGFP. TZM-bl cells were infected with HIV-1 (IN.eGFP) for 4 hr in the presence of APC and EdU, followed by fixation and click-labeling. Mitochondria were detected by cytochrome C immunostaining (CC; white). z-stacks covering the whole-cell volume were acquired by SDCM and analyzed for distinct co-localizing EdU-AlexaFluor647 (red) and IN.eGFP (green) signals. Left panels show z-sections through representative cells. Boxed regions (i–iii) mark three co-localizing objects from each cell displayed as enlargements on the right. Images from the optimal focal plane of each object are shown in the enlargements. Scale bars: 5 μm (overviews), 1 μm (enlargements). (B) Super-resolution microscopy confirming co-localization between EdU-AlexaFluor647 (red) and IN.mEos3.2 (green). TZM-bl cells were infected with HIV-1 (IN.mEos3.2) for 4 hr before click-labeling and analyzed by dual-color PALM/dSTORM. The overview shows an image recorded in TIRF mode; boxed regions i–ii are enlarged below. Enlargements iii–iv show additional examples of co-localization recorded by PALM/dSTORM in epifluorescence mode. Scale bars: 1 μm (overview), 100 nm (enlargements). (C) Inhibition of reverse transcriptase prevents RTC/PIC formation. TZM-bl cells were infected with HIV-1 (IN.eGFP) for 4.5 hr in the presence of DMSO or 5 μM EFV, respectively, followed by click-labeling and immunostaining as in (A). z-stacks covering the whole-cell volume were acquired for randomly selected cells and the number of RTC/PIC per cell was determined. The graph shows pooled results from three independent experiments. Statistical significance was assessed using the Mann–Whitney test. See Figure 1—figure supplement 1–3 for characterization of labeled virus particles and effect of APC on infectivity, Figure 1—figure supplement 4 for reduction of nuclear EdU signal with APC treatment, Figure 1—figure supplement 5 for detection of mitochondrial DNA in the cytoplasm, Figure 1—figure supplement 6 for analysis of detection sensitivity, and Figure 1—figure supplement 7 for summary of number of RTC/PIC detected per cell.
Figure 1—figure supplement 1
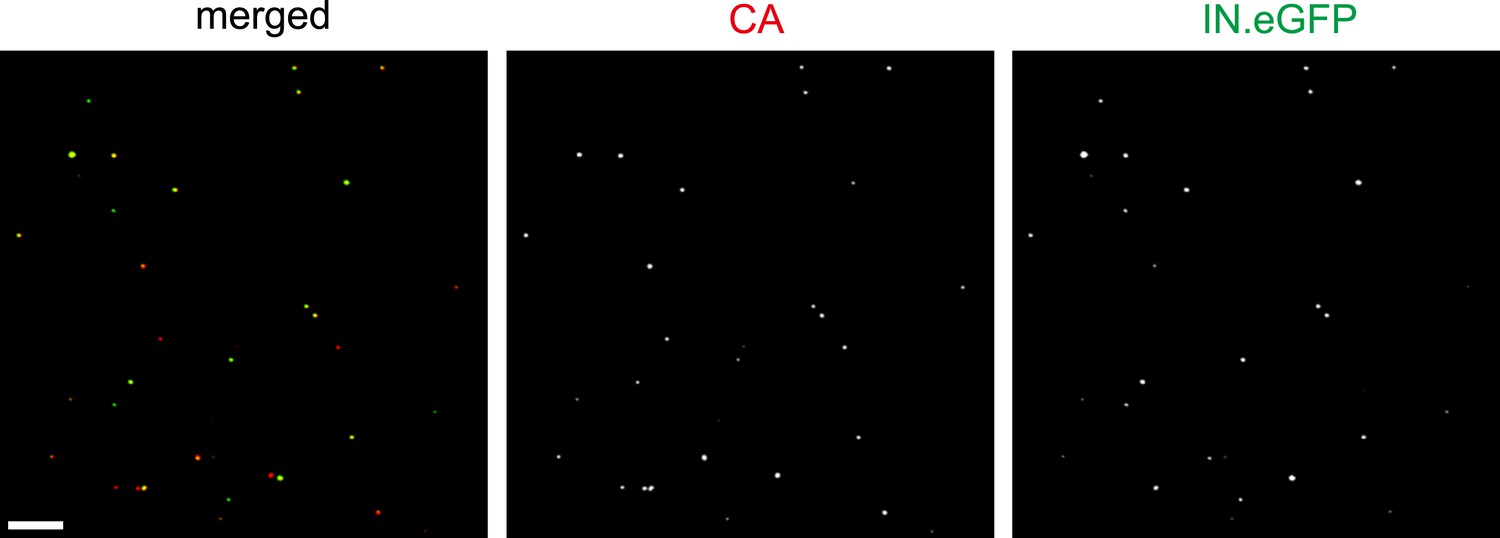
Analysis of labeled virus particles by immunofluorescence.
HIV-1 (IN.eGFP) particles were produced as described in ‘Materials and methods’. Particles were adhered to glass cover slips, fixed and immunostained using antiserum against HIV-1 CA. The figure shows a representative confocal image recorded in the red (CA) and green (IN.eGFP) channel, respectively. Scale bar: 5 µm.
Figure 1—figure supplement 2

Analysis of labeled virus particles by immunoblot.
Pelleted HIV-1 and HIV-1 (IN.eGFP) virus particles were separated by SDS-PAGE and analyzed by immunoblot using antisera against CA or IN, respectively. Positions of molecular mass standards (in kDa) are indicated on the left, HIV-1 specific proteins are marked on the right.
Figure 1—figure supplement 3
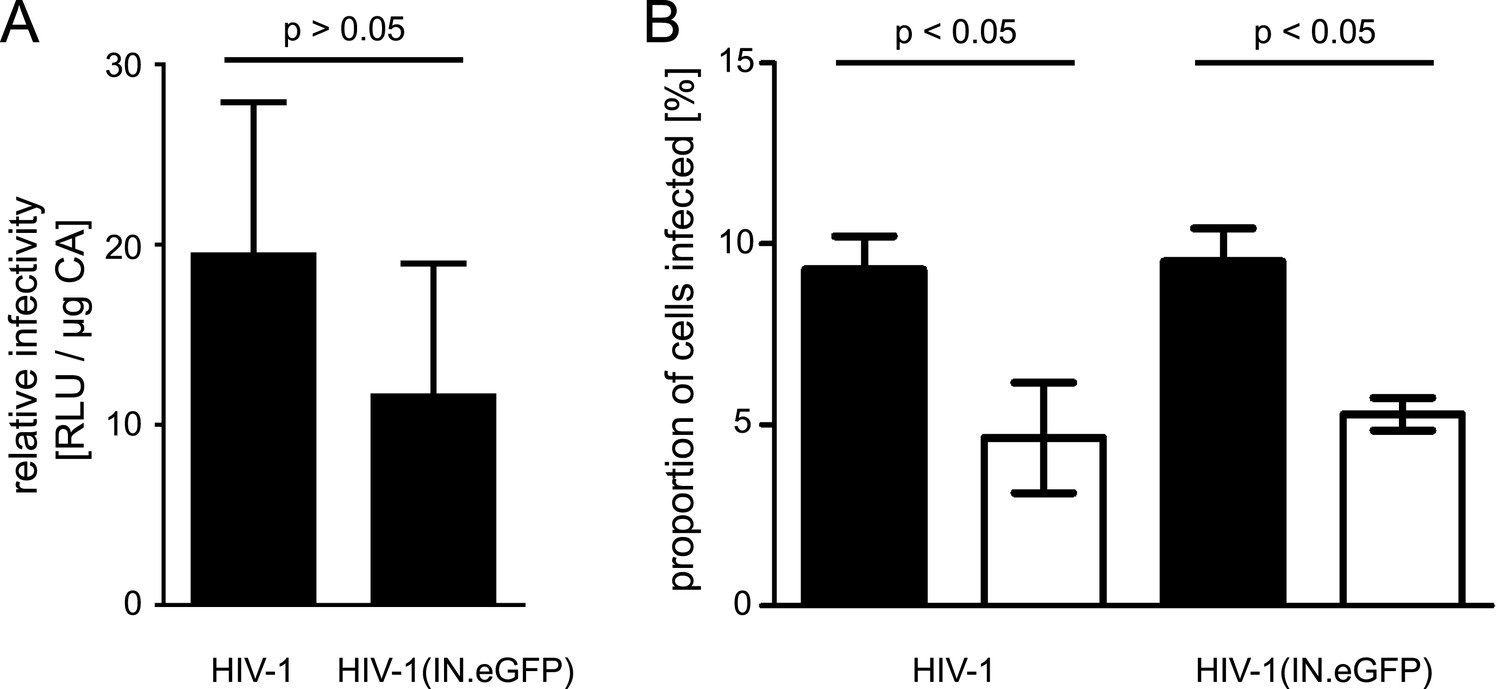
Quantification of relative infectivity of labeled virions.
(A) Comparison of wt virus and particles carrying exogenous IN.eGFP. TZM-bl cells were infected with serial dilutions of HIV-1 and HIV-1 (IN.eGFP). At 48 hr p.i., cell lysates were harvested and infection was quantified by luciferase assay. Values were normalized to the amount of virus measured by p24 ELISA. The graph shows mean values and SD from three independent experiments. RLU, relative light units. (B) Effect of APC treatment on HIV-1 infection. TZM-bl cells pre-incubated overnight with DMEM containing DMSO or 6 µM APC, respectively, were infected with HIV-1 or HIV-1 (IN.eGFP) with an MOI of 0.1 for 4 hr in the presence of DMSO or 6 µM APC. The medium was subsequently changed to DMEM and incubation was continued. At 48 hr p.i., the percentage of infected cells was quantified by immunostaining for HIV-1 CA followed by flow cytometry. The graph shows mean values and SD from two independent experiments performed in duplicate. Black bars: DMSO treated cells; white bars: APC treated cells. p-values were calculated using a Student's t test.
Figure 1—figure supplement 4
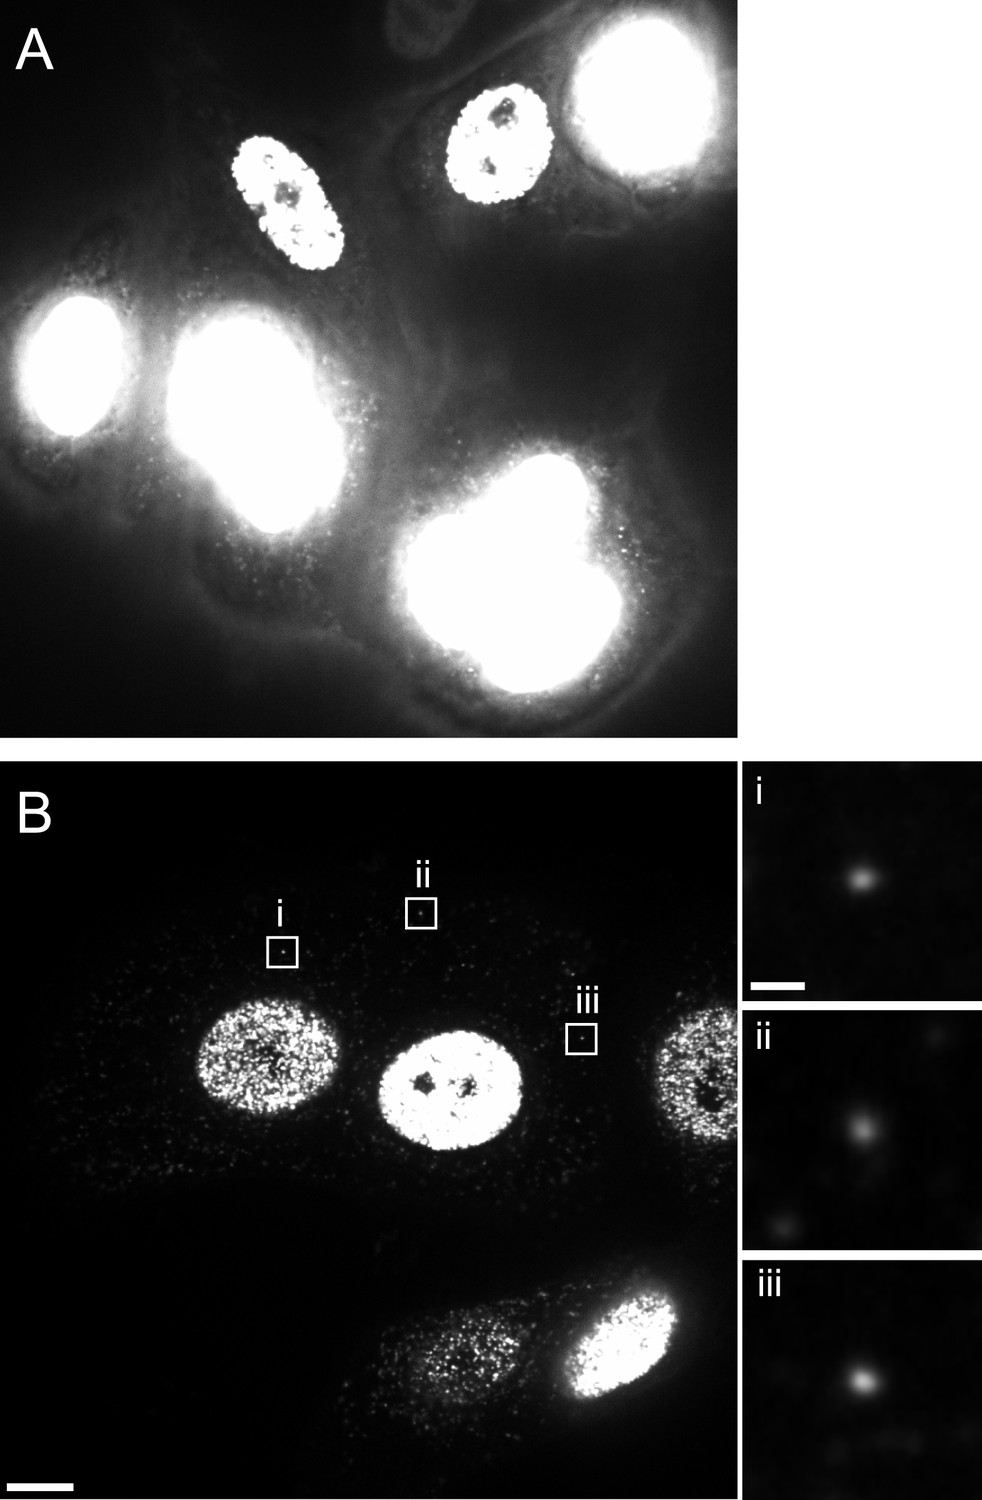
Reduction of nuclear EdU signal by APC treatment.
TZM-bl cells were pre-incubated in medium without (A) or with (B) 6 µM APC over night. Cells were then infected with HIV-1 (IN.eGFP) in the presence of 6 μM APC and 10 µM EdU. At 5 hr p.i., cells were fixed, click-labeled, and analyzed. Images show z-sections through the nuclear region of cells recorded using identical microscope settings. Boxed areas i–iii in (B) show punctate EdU-Alexa-647 signals detected in the cytoplasm; these regions are shown enlarged at the right. Scale bars: 5 µm (overviews), 1 µm (enlargements).
Figure 1—figure supplement 5

Detection of mitochondrial DNA synthesis in the cytoplasm.
TZM-bl cells were pre-incubated in medium containing 6 µM APC overnight and then infected with HIV-1 (IN.eGFP) in the presence of 10 µM EdU and 6 µM APC. At 4 hr p.i., cells were fixed, click-labeled (red), immunostained with antiserum against cytochrome C (white), and imaged. The upper panel shows a representative z-section through the nuclear region. EdU signals overlapping with CC-stained areas (i) may result from mitochondrial DNA synthesis, whereas distinct IN.eGFP-EdU co-localizing objects overlapping with mitochondrial staining (ii) were classified as RTC/PIC. Scale bars: 5 µm (overview), 1 µm (enlargements).
Figure 1—figure supplement 6
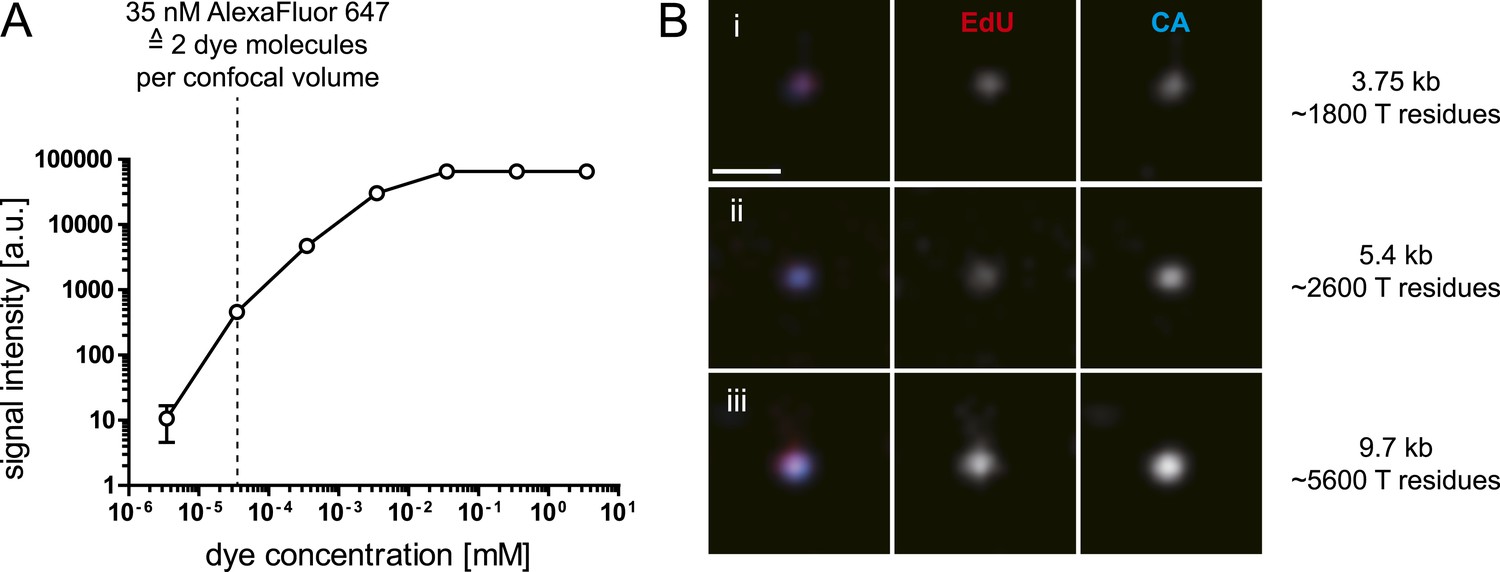
Sensitivity of EdU-Alexa Fluor647 detection.
(A) Sensitivity of the microscopy setup. 10-fold serial dilutions were prepared starting from a solution of 3.5 mM Alexa-647 azide (Click-iT EdU-Alexa Fluor 647 Imaging Kit; Life technologies) in PBS. Solutions were imaged with the SDCM setup used throughout this study directly upon distribution into LabTek chamber slide wells. The graph shows intensity values recorded for the different dye concentrations; mean values and SD from three independent dilution experiments are displayed. An intensity value of 65,535 reflects camera saturation. Intensity clearly above background was detected for a 35 nM solution (dotted line), corresponding to ∼2 dye molecules per confocal volume (250 nm × 250 nm × 900 nm, x–y–z). (B) Sensitivity of RT product detection. The figure shows exemplary RTC/PIC from TZM-bl cells transduced with retroviral vector particles produced as outlined in ‘Materials and methods’ (i and ii) or infected with HIV-1 (IN.eGFP) (iii). Vector particles packaged RNA derived from plasmid pRRL.PPT.SF.GFPpre (i) or plasmid pWPI (ii), respectively. At 4.5 hr after particle addition, cells were fixed and click-labeled as in Figure 1A. Samples were immunostained using antiserum raised against HIV-1 CA (blue). CA staining in (i) was weaker than in the other two cases; the image has been enhanced for comparable visibility. The approximate length of the respective full-length cDNA, as well as the approximate number of T residues in the complete cDNA is indicated at the right.
Figure 1—figure supplement 7

Numbers of cytoplasmic RTC/PIC detected per cell.
Infection of TZM-bl cells with HIV-1 (IN.eGFP), click-labeling, immunostaining with antibody against cytochrome C, and single cell imaging were performed as described in Figure 1. The binned histogram summarizes pooled data from 69 individual cells from 3 independent experiments.
Figure 2
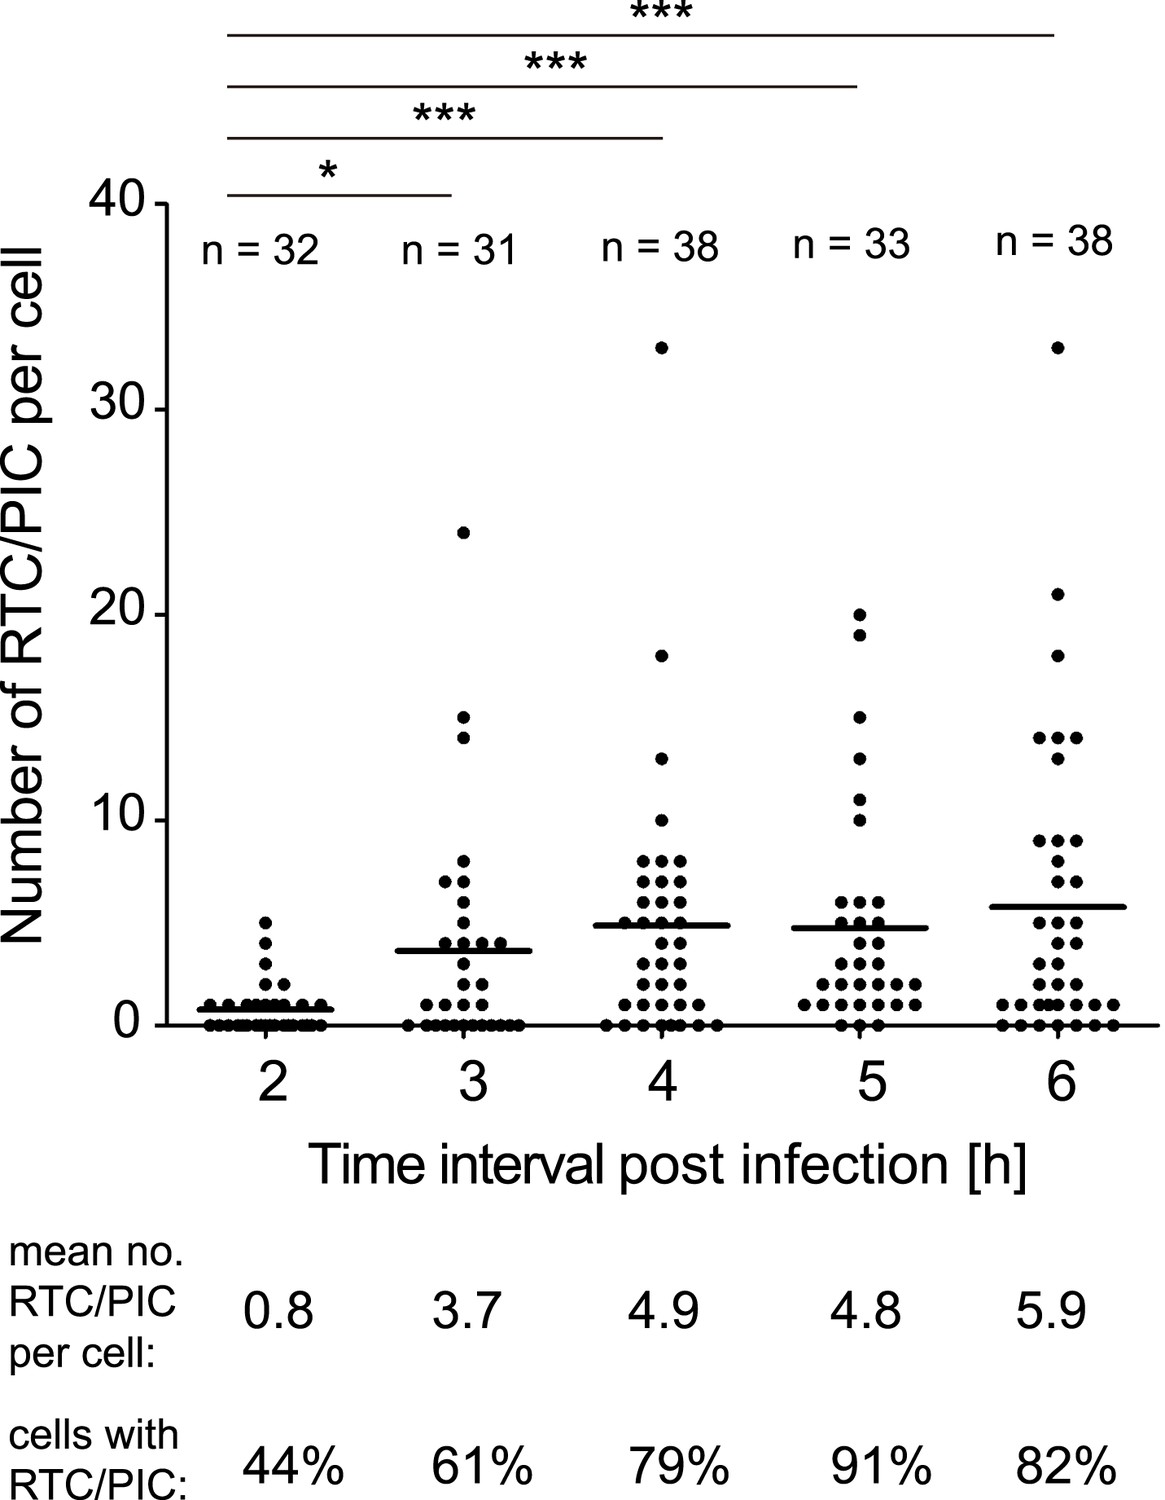
Time course of RTC/PIC detection.
TZM-bl cells were infected with HIV-1 (IN.eGFP) as in Figure 1. Cells were fixed at the indicated time points after infection and analyzed as in Figure 1C. Numbers of RTC/PIC detected per cell were counted for randomly selected cells in each incubation interval. The graph shows pooled results from two independent experiments. Mean values of RTC/PIC per cell are indicated by black lines. Statistical significance was assessed using the Mann–Whitney test.
Figure 3
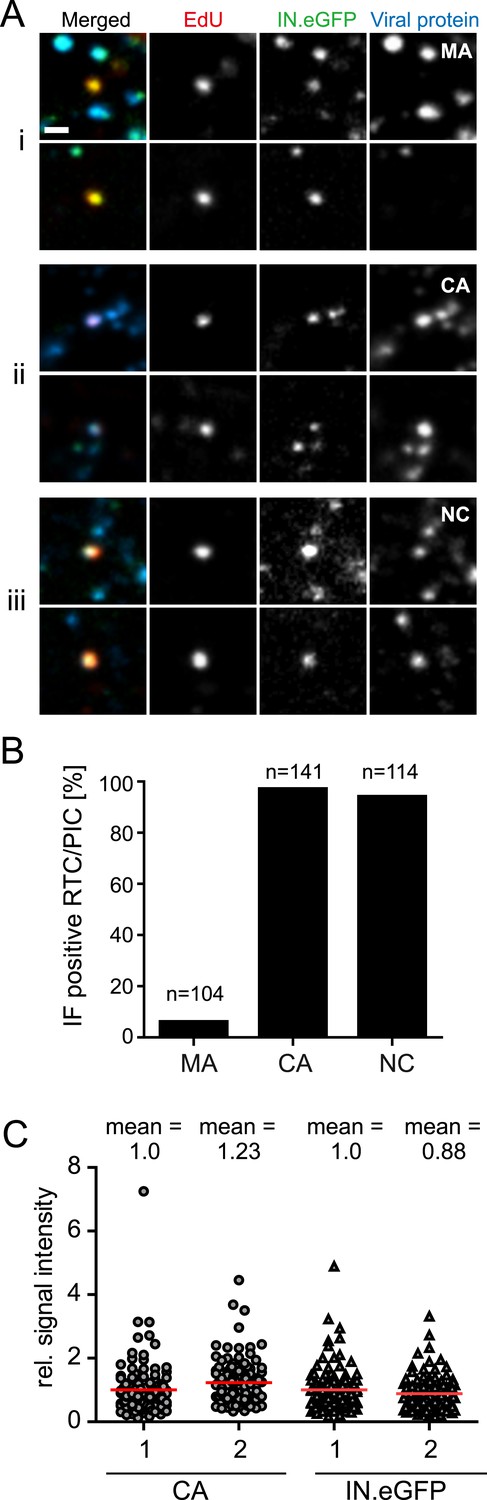
Association of HIV-1 Gag derived proteins with RTC/PIC.
(A) Immunofluorescence analysis. TZM-bl cells were infected with HIV-1 (IN.eGFP) as in Figure 1. At 4 hr p.i. samples were fixed, click-labeled, and immunostained using antisera against HIV-1 MA (i), CA (ii), or NC (iii), respectively. z-stacks covering the whole-cell volume were acquired by SDCM, RTC/PIC were identified as in Figure 1 and co-localization with each Gag derived protein was analyzed. The panel shows two representative RTC/PIC per antiserum used. Scale bar: 1 μm. (B) Quantitative analysis of co-localization with viral proteins. For each staining condition, n > 100 individual randomly selected RTC/PIC, identified as in (A), were analyzed for detection of the respective Gag derived protein. 6%, 97%, and 94% of RTC/PIC were positive for MA, CA, or NC, respectively. (C) Quantification of relative signal intensity. A total of 114 intracellular CA-IN.eGFP objects not containing detectable EdU signal (1) and 114 RTC/PIC (2), respectively, were identified in cells from three independent experiments. Signal intensity of CA (circles) and IN.eGFP (triangles) was calculated for each object as described in ‘Materials and methods’. Within each experiment, values were normalized to the mean intensity of CA or IN.eGFP signal, respectively, that was obtained for the CA-IN.eGFP objects lacking EdU. Each data point in the graph represents a single object; mean intensity values are indicated by red lines.
Figure 4 with 1 supplement
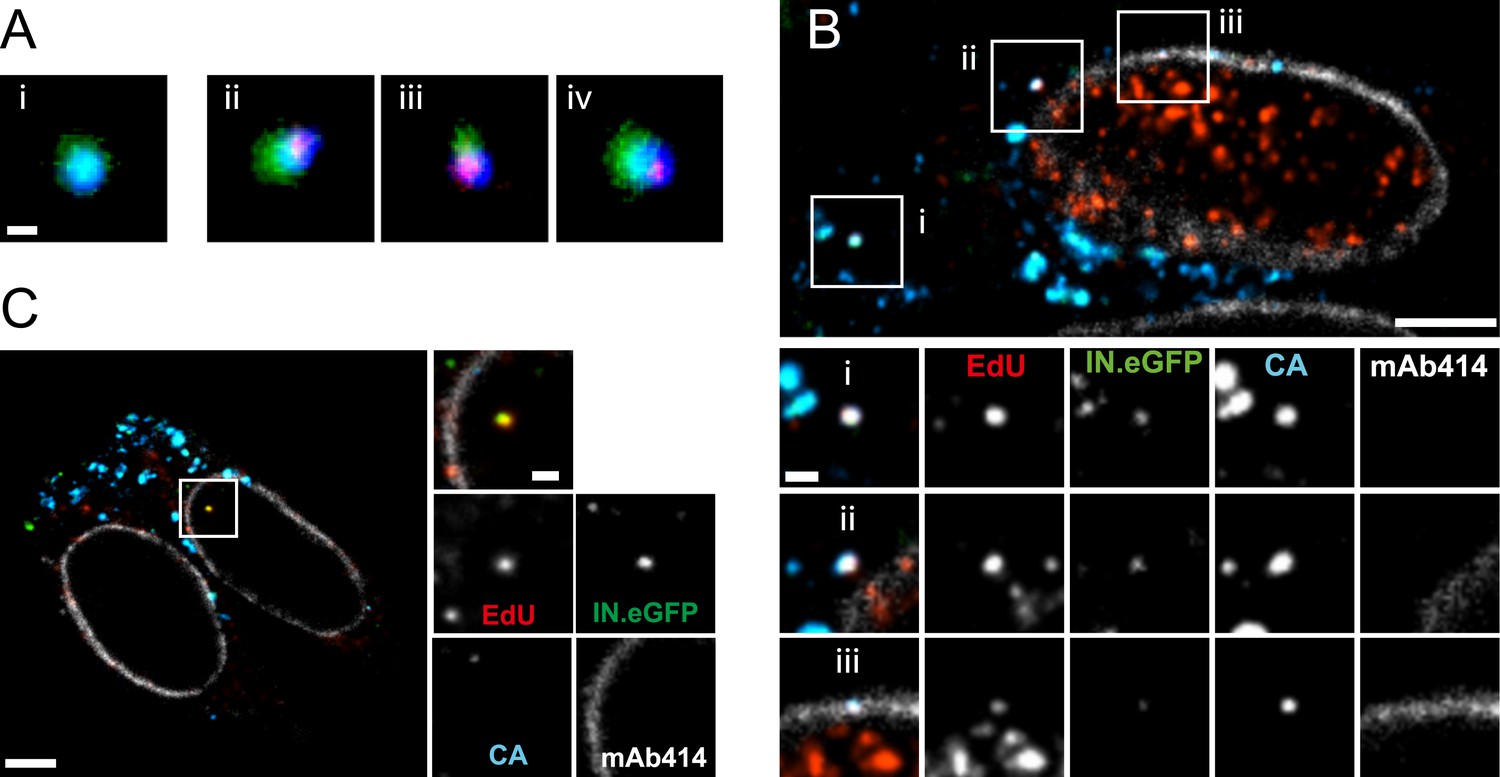
Co-localization of HIV-1 CA with RTC/PIC at different intracellular localizations.
(A) Three-color PALM/dSTORM analysis of RTC/PIC. TZM-bl cells were infected with HIV-1 (IN.mEos3.2) as in Figure 1. At 4 hr p.i., cells were fixed, click-labeled, and immunostained using antiserum against HIV-1 CA. Three-color PALM/dSTORM images were acquired in TIRF mode as described in ‘Materials and methods’. The panel shows an example of an EdU-negative IN.mEos3.2/CA co-localizing object that possibly represents an intracellular virion (i), as well as three examples of triple-labeled complexes classified as RTC/PIC (ii–iv). Scale bar: 100 nm. (B) RTC/PIC detected in the cytoplasmic and perinuclear regions. TZM-bl cells were infected with HIV-1 (IN.eGFP) as in Figure 1. At 5 hr p.i., samples were fixed, click-labeled, and immunostained using an antibody against nuclear pore proteins (white) and antiserum against HIV-1 CA (blue). The top panel shows a z-section through an individual cell displaying RTC/PIC in the peripheral cytoplasmic region (i), close to the nucleus (ii), and overlapping or in close proximity of the nuclear membrane (iii). The lower panels show enlargements of the insets with images selected from the optimal focal plane of each RTC/PIC. Scale bars: 5 μm (overview), 1 μm (enlargements). (C) PIC detected inside the nucleus. The left panel shows a z-section through two individual cells, selected for very low levels of nuclear EdU labeling. Immunostaining was performed as in (B). The boxed area shows an IN.eGFP/EdU co-localizing object within the nucleus. Enlargements of this object in the individual channels are shown on the right. Scale bars: 5 μm (overview), 1 μm (enlargements). See Figure 4—figure supplement 1 for analysis of cluster sizes of RTC/PIC detected in three-color PALM/dSTORM analysis.
Figure 4—figure supplement 1

Size distribution of RTC/PIC associated CA and IN.mEos clusters derived from PALM/dSTORM analyses.
Diameters of CA and IN.mEos clusters were measured using images from 3-color PALM/dSTORM analysis. A total of 16 clusters detected in eight individual cells were analyzed. The graph shows mean values and SD.
Figure 5
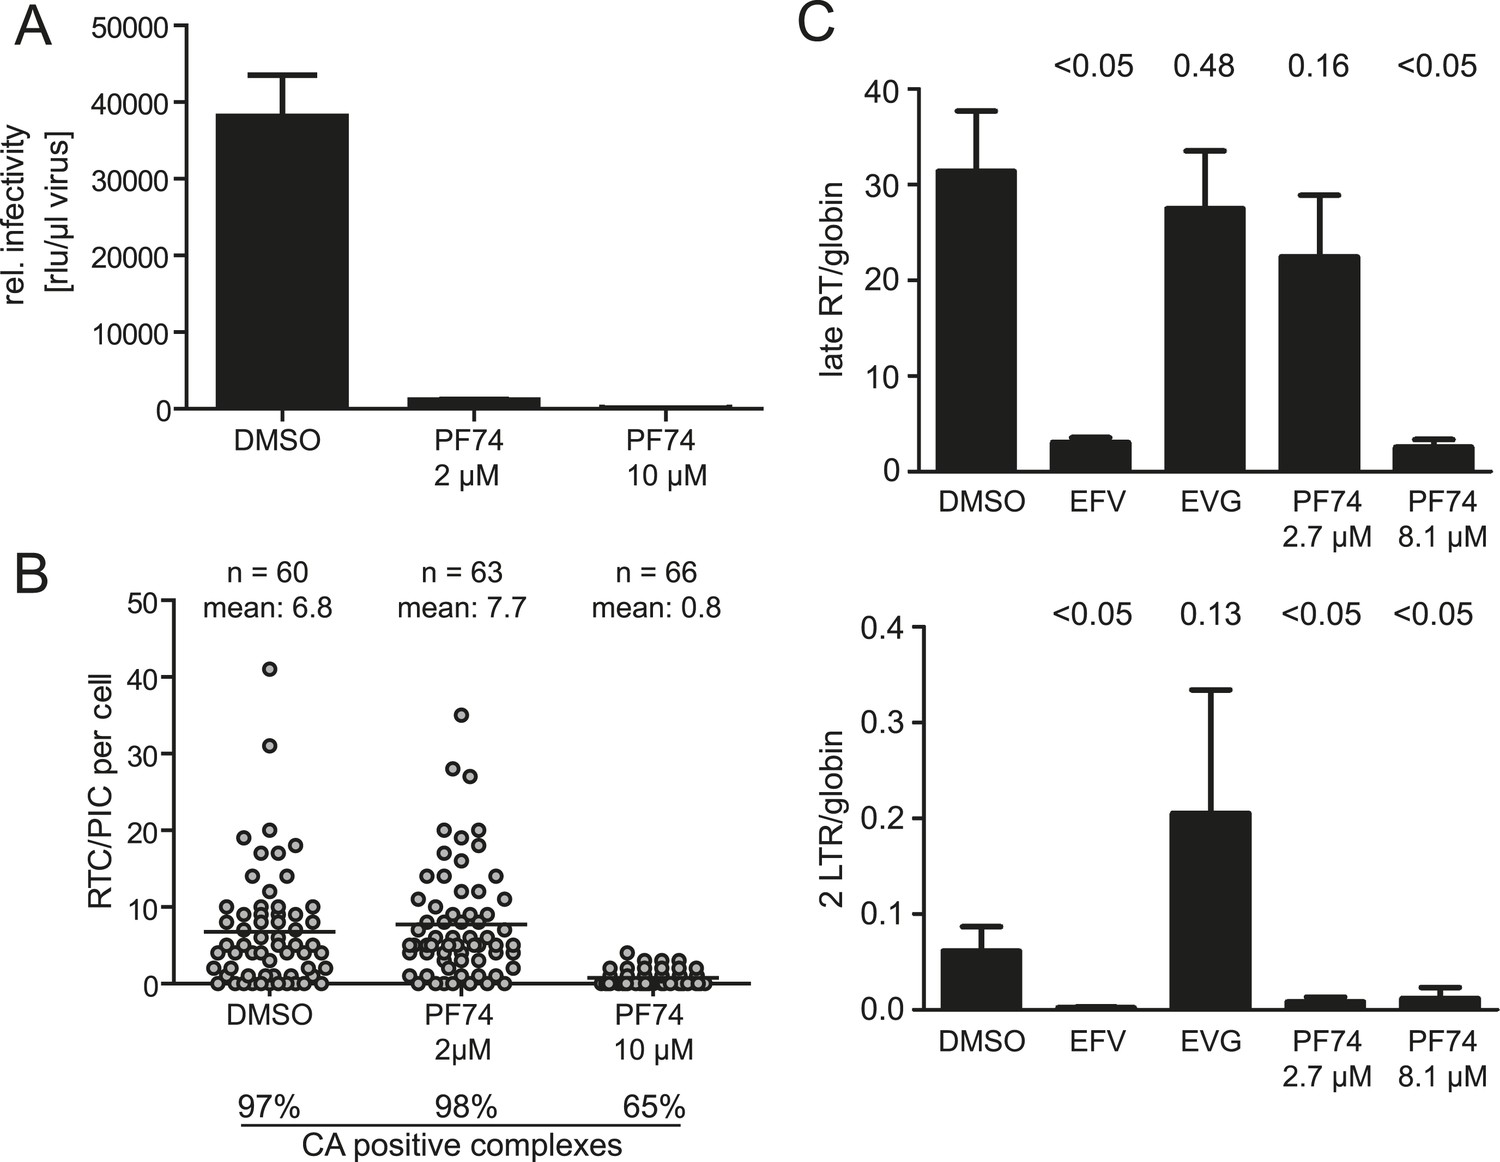
Effect of PF74 treatment on RTC/PIC formation and infection of host cells.
(A) Inhibition of productive infection. TZM-bl cells were infected with serial dilutions of HIV-1 produced in the presence of DMSO or the indicated concentrations of PF74, respectively. Cell lysates were harvested at 48 hr p.i., and infectivity was determined by measuring luciferase reporter gene activity. The graph shows mean values and standard deviation (SD) from three replicate infections. (B) Inhibition of RTC/PIC formation. TZM-bl cells were infected with HIV-1 (IN.eGFP) in the presence of DMSO or two different concentrations of PF74, respectively. At 4.5 hr p.i., cells were fixed, click labeled, immunostained with antiserum against HIV-1 CA, and analyzed. Numbers of RTC/PIC per cell were determined for randomly selected cells from z-stacks covering the whole-cell volume, and the proportion of complexes co-localizing with CA immunostaining was determined. The figure shows pooled results from three independent experiments. Statistical significance was assessed using the Mann–Whitney test. (C) Quantification of HIV-1 DNA. MT-2 cells were infected with HIV-1 (IIIB) in the presence of DMSO or of the indicated concentrations of the inhibitors EFV, EVG, or PF74, respectively. Late RT products (top) and 2-LTR circles (bottom) in cell lysates were quantified by qPCR as described in ‘Materials and methods’ using appropriate primer sets. The graph shows mean values and SD from three replicate infections. Statistical significance of the difference between each treatment and the DMSO control (p-values determined by Student's t test) is indicated.
Figure 6 with 1 supplement

Co-localization of CPSF6 with RTC/PIC in the cytoplasm.
The figure shows co-localization of CPSF6 with RTC/PIC in the cytoplasm of TZM-bl (A) and TNPO3KD (B and C) cells in the absence (B) or presence (C) of 2 µM PF74. Cells were infected with HIV-1 (IN.eGFP), and click-labeled as described in Figure 1A, followed by immunostaining against CPSF6 (blue) and SDCM analyses. The RTC/PIC in the boxed area (i) are shown enlarged in the top rows at the right; the middle and bottom rows at the right show examples of RTC/PIC from other cells. Arrows in enlargements indicate positions of RTC/PIC without detectable CPSF6. To visualize weak signals for proper visualization, greyscale enlargement images were auto-contrasted in ImageJ. Scale bars: 5 μm (overviews), 1 μm (enlargements). See Figure 6—figure supplement 1 for localization of CPSF6 in different cell lines.
Figure 6—figure supplement 1
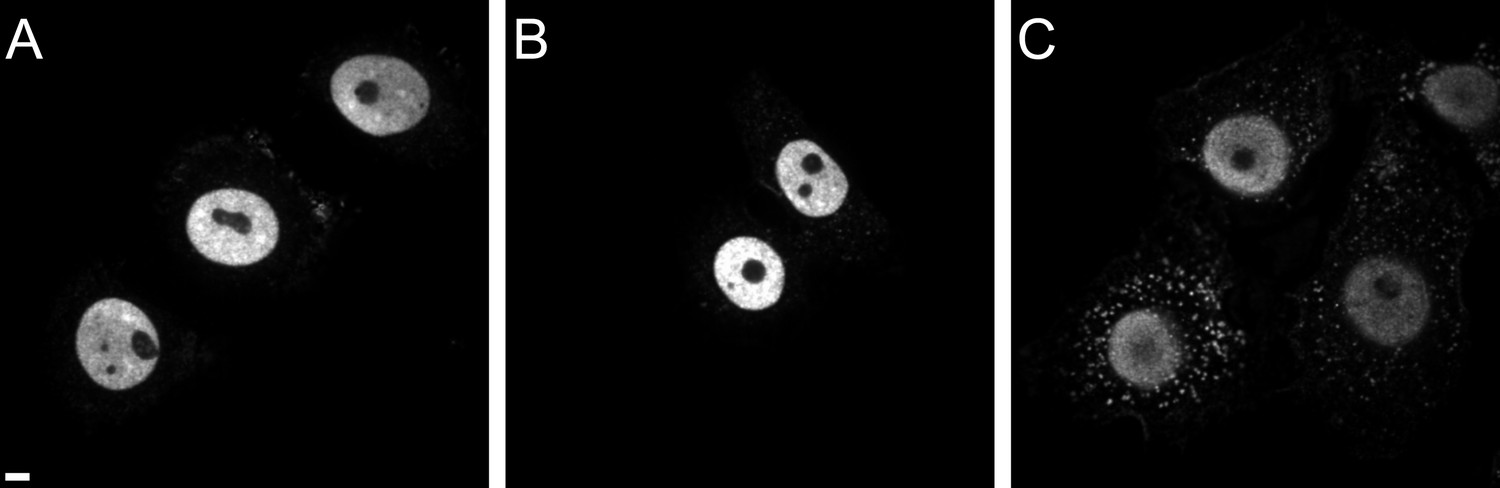
CPSF6 localization in TZM-bl (A), TNPO3Scr (B), and TNPO3KD (C) cells.
Cells were immunostained with antibody against CPSF6 and imaged by SDCM using the same microscope settings. Panels show representative z-sections through the middle region of cells. Scale bar: 5 µM.
Figure 7
Detection of RTC/PIC in primary macrophages.
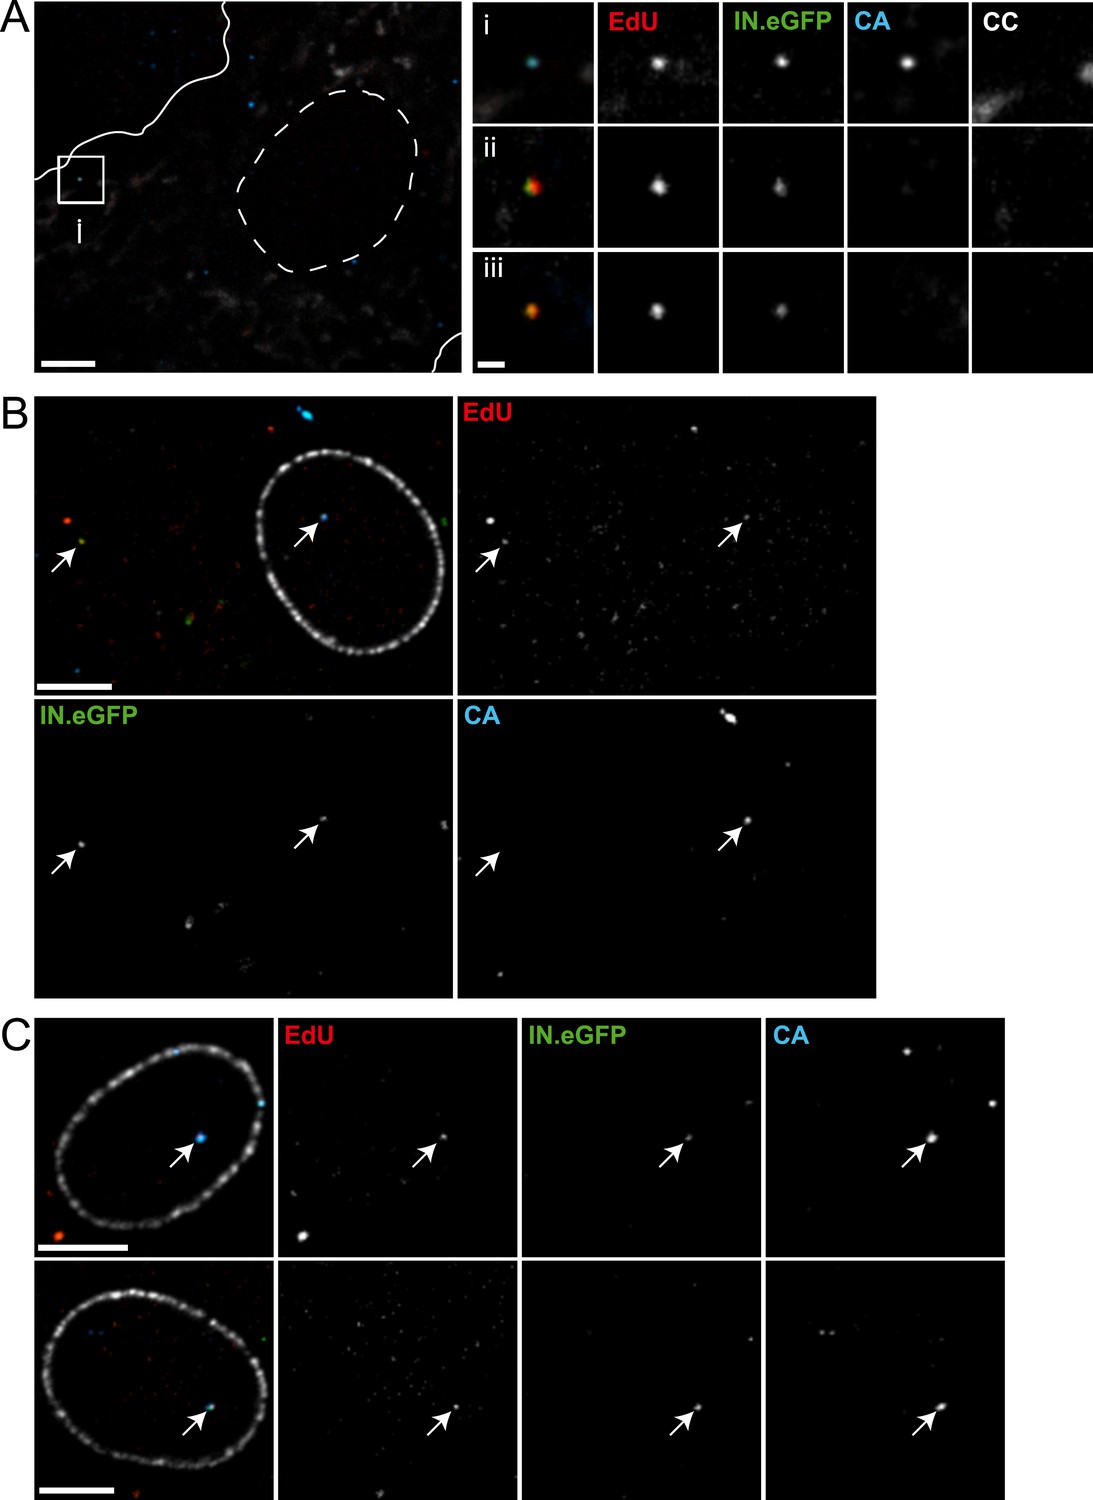
(A) Detection of RTC/PIC in MDM. Human MDM were prepared and infected with an R5-tropic variant of HIV-1 (IN.eGFP) (NL4-3-R5(IN.eGFP)) for 24 hr in the presence of 5 μM EdU. Cells were fixed, click-labeled, and immunostained for CC and HIV-1 CA. The left panel shows a z-section through part of a representative cell, displaying immunostaining for CC (white) and HIV-1 CA (blue) together with EdU (red) and IN.eGFP (green). Boundaries of the cell (white line) and nucleus (dashed line) are indicated. The RTC/PIC in the boxed area (i), as well as two other exemplary RTC/PIC detected in cells from two other donors (ii–iii) are shown enlarged on the right. To visualize weak signals for proper visualization, greyscale enlargement images of example (i) were auto-contrasted in ImageJ. Scale bar: 5 μm (overview), 1 μm (enlargements). (B and C) CA signals associated with nuclear PIC. MDM were prepared and infected for 48 hr, followed by click-labeling, and immunostaining using an antibody against nuclear pore complexes (white) and antiserum against HIV-1 CA (blue). (B) Channel overlay of a z-section through part of a representative cell, together with images of the individual channels (EdU, red; IN.eGFP, green; CA, blue). Arrows indicate an example of a cytoplasmic RTC/PIC (left) and a nuclear PIC (right), respectively. Scale bar: 5 μm. (C) Additional examples of nuclear PIC detected at 48 hr p.i. in MDM from two other donors. Scale bars: 5 μm. See Figure 7—source data 1 for a summary of infected MDM immunostained with CC and CA antibodies.
-
Figure 7—source data 1
RTC/PIC detected in MDM.
Human MDM were infected with NL4-3-R5(IN.eGFP) for 24 hr, fixed, click-labeled, and stained with CC and CA antibodies. RTC/PIC detected were counted from z-stacks covering the whole-cell volume. The table summarizes data from three independent experiments.
- https://doi.org/10.7554/eLife.04114.020
Tables
Table 1
Cytoplasmic and nuclear subviral complexes in MDM
| Cytoplasm | Nucleus | Proportion of nuclear complexes [%] | Number of cells imaged | |||||
|---|---|---|---|---|---|---|---|---|
| RTC/PIC (n) | CA-positive RTC/PIC (n) | CA-positive RTC/PIC [%] | PIC (n) | CA-positive PIC (n) | CA-positive PIC [%] | |||
| 24 hr | 90 | 46 | 51 | 9 | 9 | 100 | 9 | 367 |
| 48 hr | 45 | 13 | 29 | 61 | 59 | 97 | 58 | 200 |
| Total | 135 | 59 | 44 | 70 | 68 | 97 | 34 | 567 |
-
The table summarizes data from primary MDM infected with NL4-3-R5(IN.eGFP) or NL4-3-4059(IN.eGFP) for 24 hr or 48 hr, respectively. Infected MDM were immunostained with antibodies against nuclear pore complexes and CA. Data were obtained as outlined in Figure 7 in cells from eight different donors in five independent experiments (cells from three donors were infected for both 24 hr and 48 hr).
Download links
A two-part list of links to download the article, or parts of the article, in various formats.
Downloads (link to download the article as PDF)
Open citations (links to open the citations from this article in various online reference manager services)
Cite this article (links to download the citations from this article in formats compatible with various reference manager tools)
Quantitative microscopy of functional HIV post-entry complexes reveals association of replication with the viral capsid
eLife 3:e04114.
https://doi.org/10.7554/eLife.04114


