The transcription factor FOXL2 mobilizes estrogen signaling to maintain the identity of ovarian granulosa cells
- Institut Jacques Monod, France
- Université Paris Diderot, Paris VII, France
Figures
Figure 1 with 2 supplements
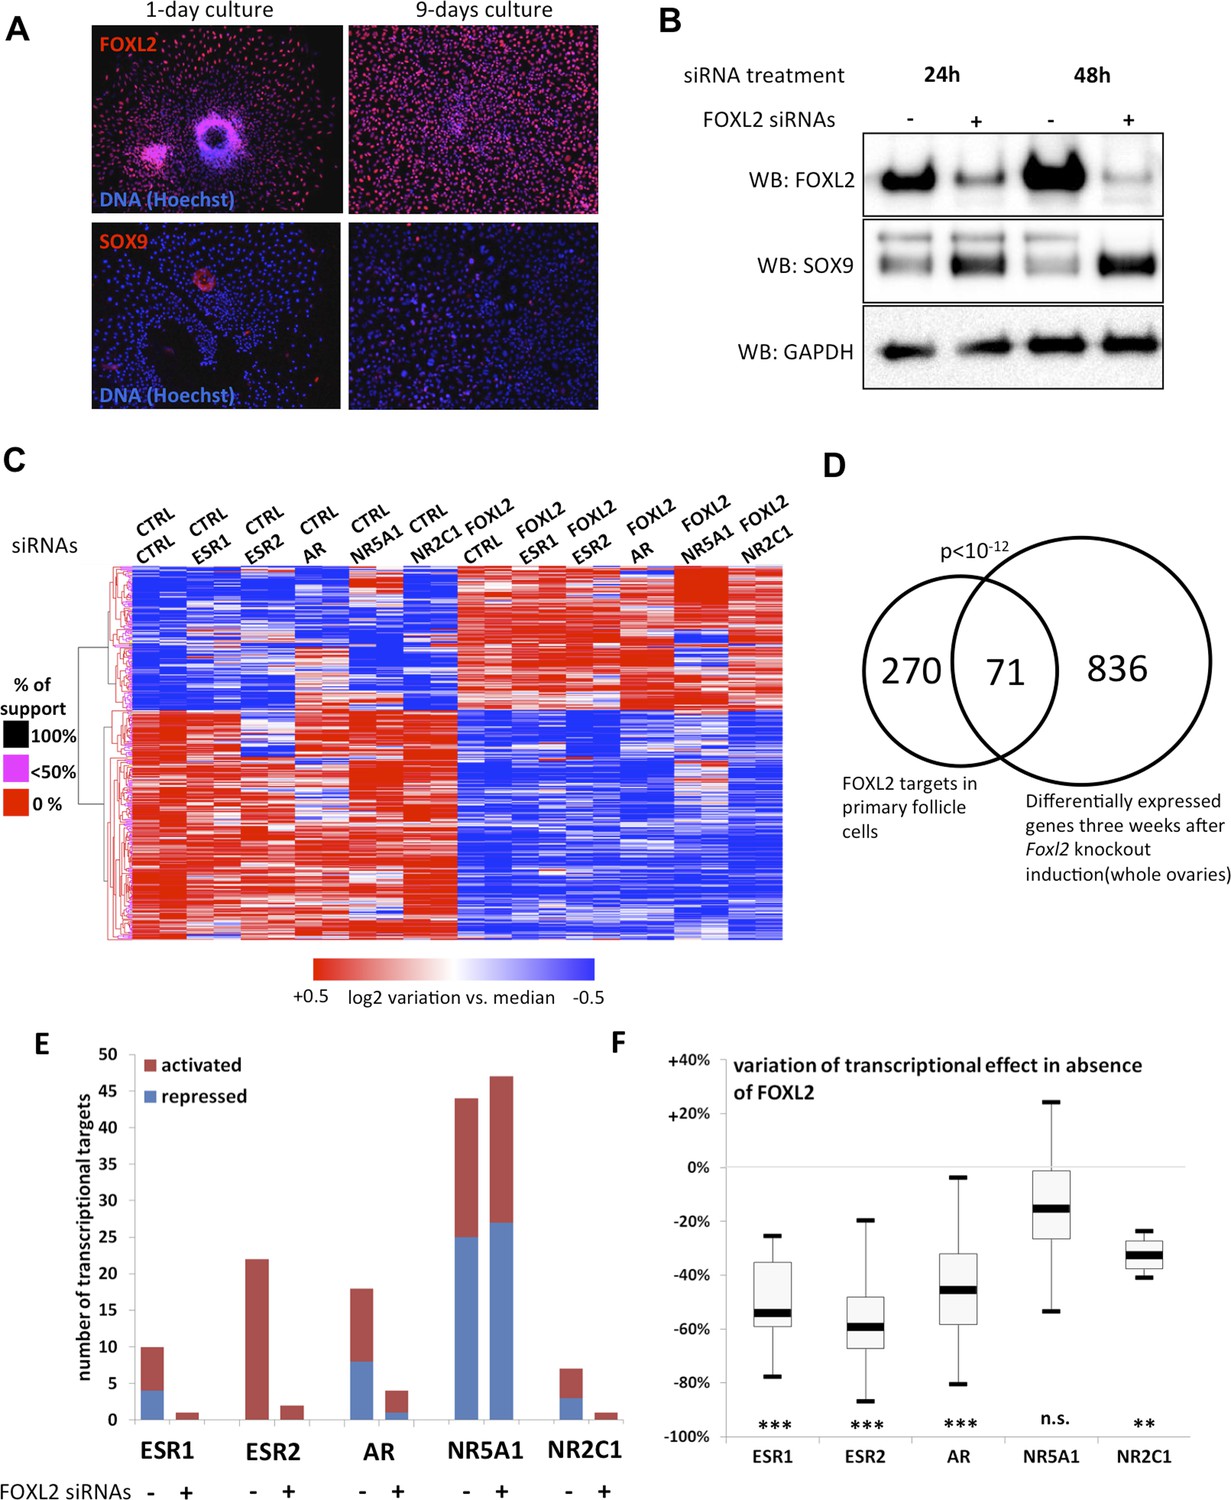
FOXL2 and nuclear receptor transcriptional targets in primary follicular cells.
(A) Analysis by immunofluorescence of FOXL2 and SOX9 expression in primary murine granulosa cells cultured for either 1 day or 9 days. FOXL2 and SOX9 are stained in red, whereas DNA was counterstained with Hoechst 33342 (blue). These micrographs show that FOXL2 expression remains strong and homogenous in 9-day granulosa cell cultures, whereas SOX9 is slightly upregulated. (B) Western blot analysis of FOXL2 and SOX9 expression in 9-day cultured murine granulosa cells treated with a control siRNA or with anti-FOXL2 siRNAs for 24 or 48 hr. GAPDH was used as a loading control. This panel shows that FOXL2 is required for Sox9 repression in these cells, as SOX9 expression increases quickly following Foxl2 knockdown. (C) Heatmap representation of the relative expression values of FOXL2 targets in various conditions (biological duplicates). A bootstraped hierarchical clustering was performed and the dendrogram is represented on the left. The clustering discriminates with 100% of support two main groups of FOXL2-activated targets, and two groups of FOXL2-repressed targets (detailed below). (D) Venn Diagram representing the intersection of FOXL2 targets in our data with genes whose expression is modified 3 weeks after Foxl2 conditional knockout in granulosa cells (in vivo). The intersection is composed of genes affected in the same direction in both studies. (E) Number of activated or repressed targets of the indicated NRs in the presence of FOXL2 (i.e., control siRNA) or in its absence (i.e., when comparing to conditions where anti-FOXL2 siRNAs were used). (F) Boxplot of the variation (in %) of the transcriptional effect of the indicated NRs on its target genes (defined according to the inclusion criteria explained in the main text), when Foxl2 was knocked down compared to control conditions. This variation was calculated for each target gene of the indicated NR. The extreme points represent the 5th and 95th percentiles, whereas the box represents the 25th to 75th percentiles, with the median indicated in black. Statistical significance of the observed differences with the null hypothesis (reference value of 0) in a one-sample t test: n.s. non significant; **p < 0,01; ***p < 0,0001.
-
Figure 1—source data 1
This file contains all Log2 transcriptional effects and transcriptional targets analyzed in Figure 1, which were calculated as indicated in methods.
The different tabs contain respectively (all Log2 transcriptional effects, list of FOXL2 targets, list of FOXL2 ‘in vivo’ targets, list of ESR1 targets, list of ESR2 targets, list of AR targets, list of NR5A1 targets, list of NR2C1 targets, list of AR targets in the absence of FOXL2, and list of NR5A1 targets in the absence of FOXL2). Red indicates activated transcriptional targets (more than twofold). Dark blue indicates repressed transcriptional targets (more than twofold). Orange indicates activated targets (between 1.5-fold and twofold). Light blue indicates repressed transcriptional targets (between 1.5-fold and twofold).
- https://doi.org/10.7554/eLife.04207.004
Figure 1—figure supplement 1
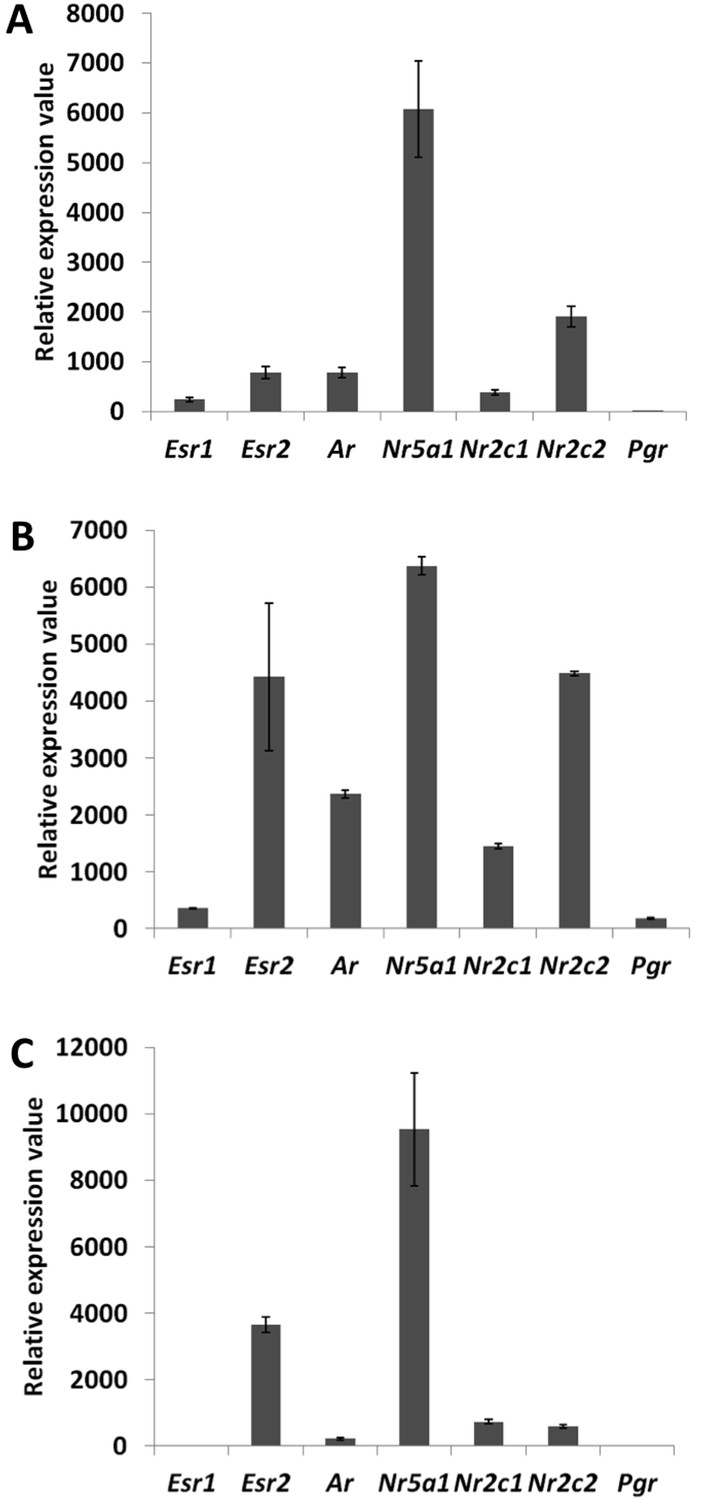
Detection and quantification of various nuclear receptors in primary follicle cells.
Evaluation of the expression levels of Esr1, Esr2, Ar, Nr5a1, Nr2c1, Nr2c2, and Pgr in 9-day primary follicular cells with qPCR (A) or microarray data on a Nimblegen (B) or Agilent (C) platform. For (A), qPCR was carried out using cDNAs at various concentrations in order to evaluate the precise efficiency of each amplicon. The relative expression levels were then deduced from the average of six data points. For (B) and (C), the bar represents the average fluorescence values measured in the control conditions (i.e., cells treated only with control siRNAs).
Figure 1—figure supplement 2
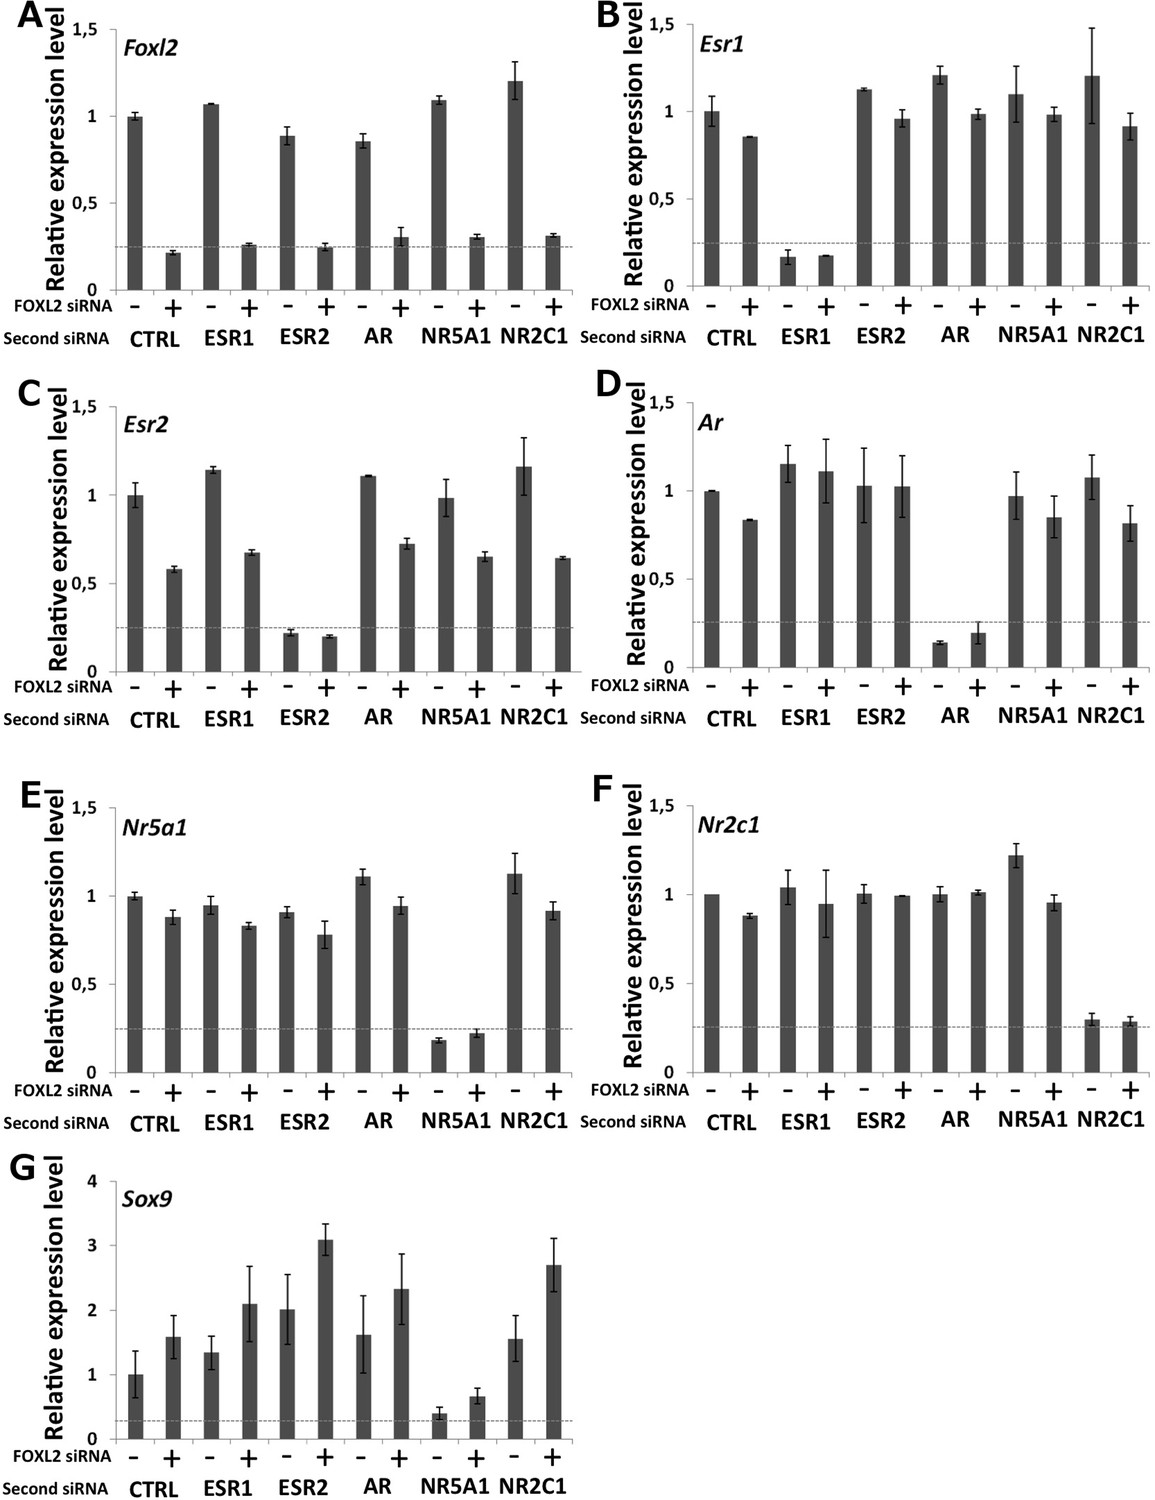
Characterization of siRNA efficiency for microarray analysis.
Relative amounts of Foxl2 (A), Esr1 (B), Esr2 (C), Ar (D), Nr5a1 (E), Nr2c1 (F), and Sox9 (G) cDNAs prepared from 9-day primary follicular cells treated with the indicated siRNAs, determined by qPCR. Relative expression levels were normalized by the average expression level of Actb and Sdha and are expressed as relative values with respect to the expression level in the control condition. Error bars represent the standard deviation of two biological duplicates. The experiment was repeated twice with consistent results. The dotted line represents 25% of the expression level in the control condition. This shows that each of the targeted mRNA is reduced by at least 70% in the presence of the corresponding siRNA pool. Sox9 mRNA level is maximally increased when Foxl2 and Esr2 are knocked down and decreased when NR5A1 is knocked down.
Figure 2 with 3 supplements

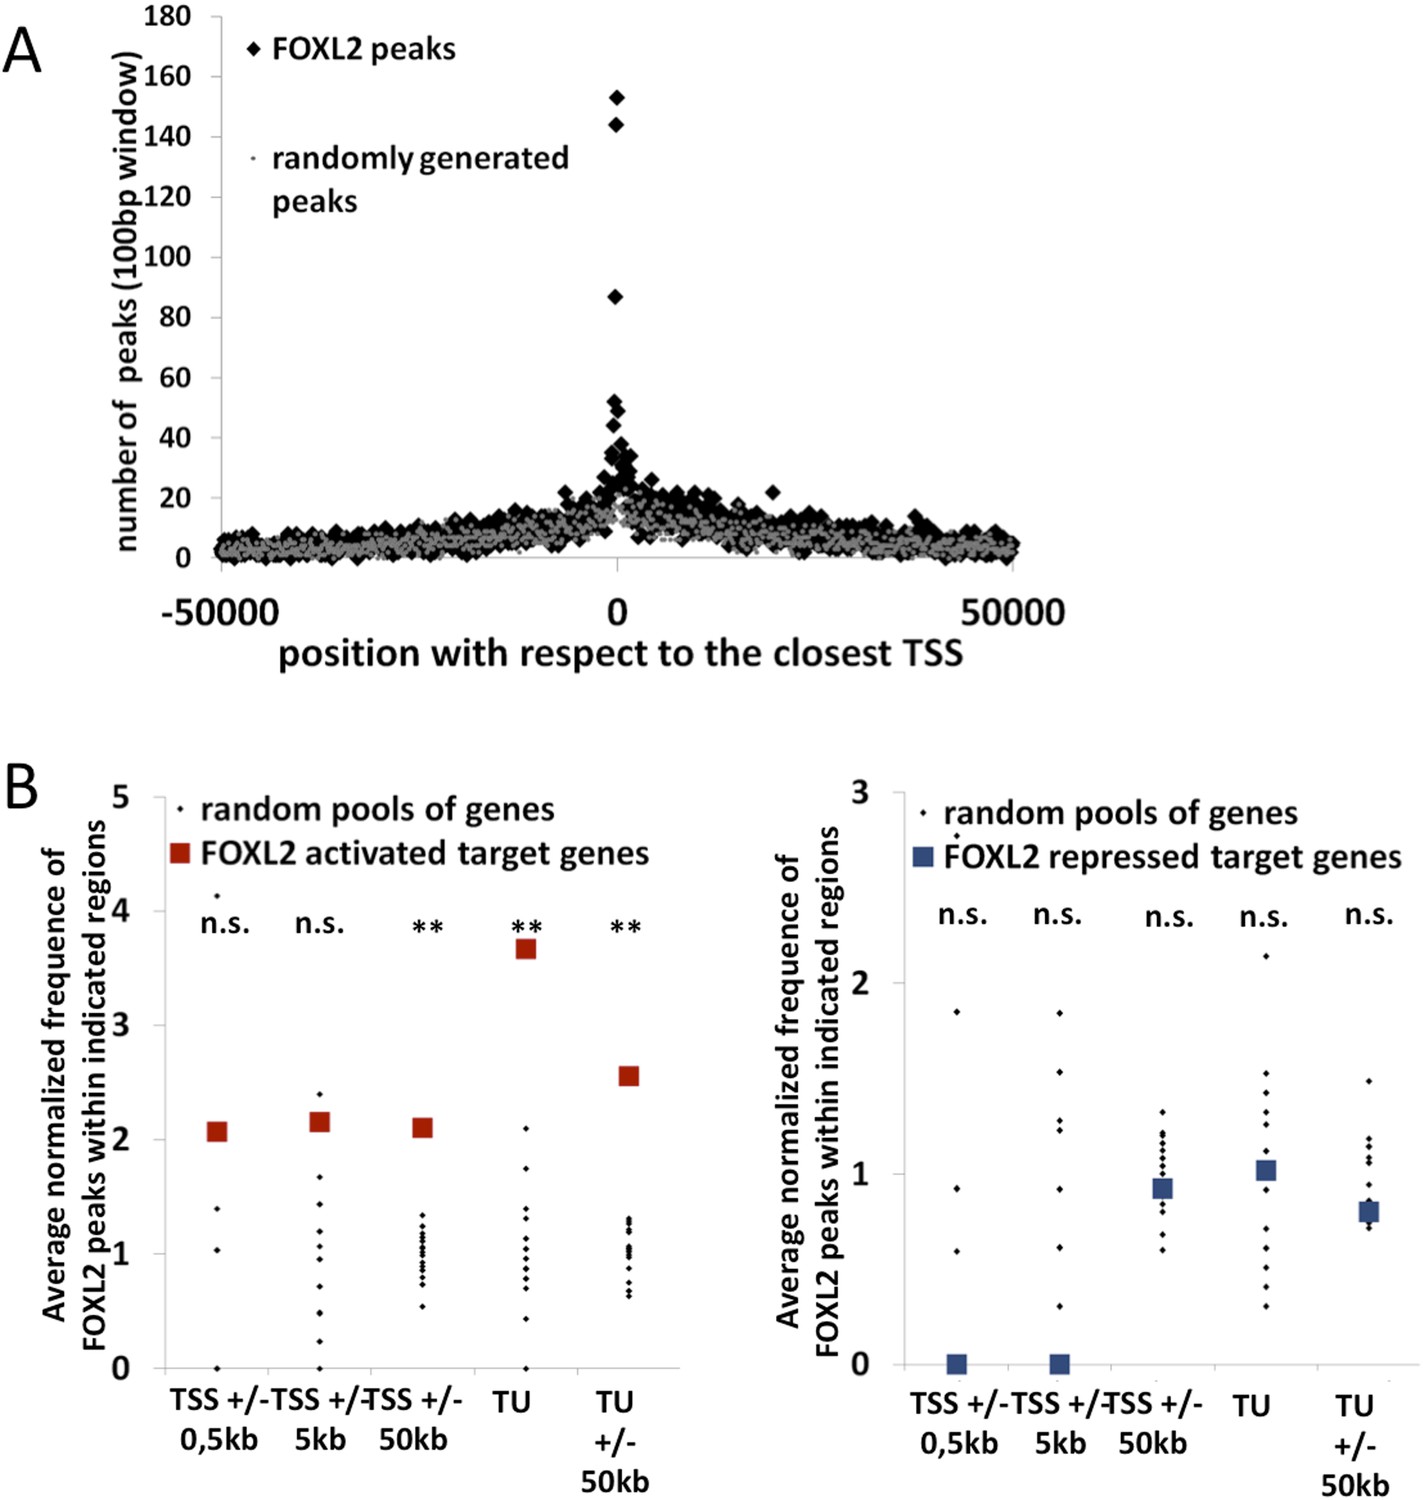
Genome-wide analysis of FOXL2 binding sites.
(A) Logo representing two motifs over-represented in FOXL2 peaks and corresponding to forkhead motifs. The right panel represents the enrichment of these motifs in FOXL2 peaks, centered on their summits. (B) Distribution of FOXL2 peaks around TSSs. A stronger enrichment can be observed between −300 and +100 bp of the TSSs. (C–D) Enrichment of FOXL2 peaks at various locations of FOXL2-activated (C) and FOXL2-repressed (D) targets. Black dots represent the enrichment in FOXL2 peaks for 20 pools of randomly selected genes, each pool comprising the same number of genes than FOXL2-activated/repressed genes. The significance of FOXL2 peaks enrichment close to FOXL2 targets was evaluated using a Grubbs test for the detection of outliers. **p < 0.01; n.s.: non-significant. Surprisingly, FOXL2 peaks were not enriched around the TSSs of FOXL2 targets. Nevertheless, a strong enrichment of FOXL2 peaks can be observed in the transcription units (TUs) of FOXL2-activated targets compared to the TUs of randomly selected genes.
-
Figure 2—source data 1
MACS results providing the list of FOXL2-binding regions in mm9 canonical female genome coordinates.
- https://doi.org/10.7554/eLife.04207.009
Figure 2—figure supplement 1
Further characterization of FOXL2 binding sites repartition compared to its transcriptomic targets.
(A) Enrichment of FOXL2 peaks at proximity of transcription start sites compared with a similar number of randomly selected peaks. (B) FOXL2 peak enrichment at the proximity of in vivo FOXL2 targets (i.e., intersection of targets identified in our data with genes whose expression is modified following the Foxl2 conditional knockout, Uhlenhaut et al. 2009). Enrichment of FOXL2 peaks at various distances of FOXL2-activated (left panel) and repressed (right panel) target genes. Black dots represent the enrichment in FOXL2 peaks for 20 pools of randomly selected genes, each pool comprising the same number of genes than FOXL2-activated/repressed genes. The significance of FOXL2 peaks enrichment close to FOXL2 gene targets was evaluated using a Grubbs test for the detection of outliers. **p<0.01; n.s.: non significant. As for all FOXL2 targets in our study, FOXL2 peaks are particularly enriched (more than 3.5-fold) within the transcription units of FOXL2-activated target genes, and a smaller enrichement can be detected with 50 kb of TSS and TUs of activated target genes, but not at proximity of FOXL2-repressed genes.
Figure 2—figure supplement 2
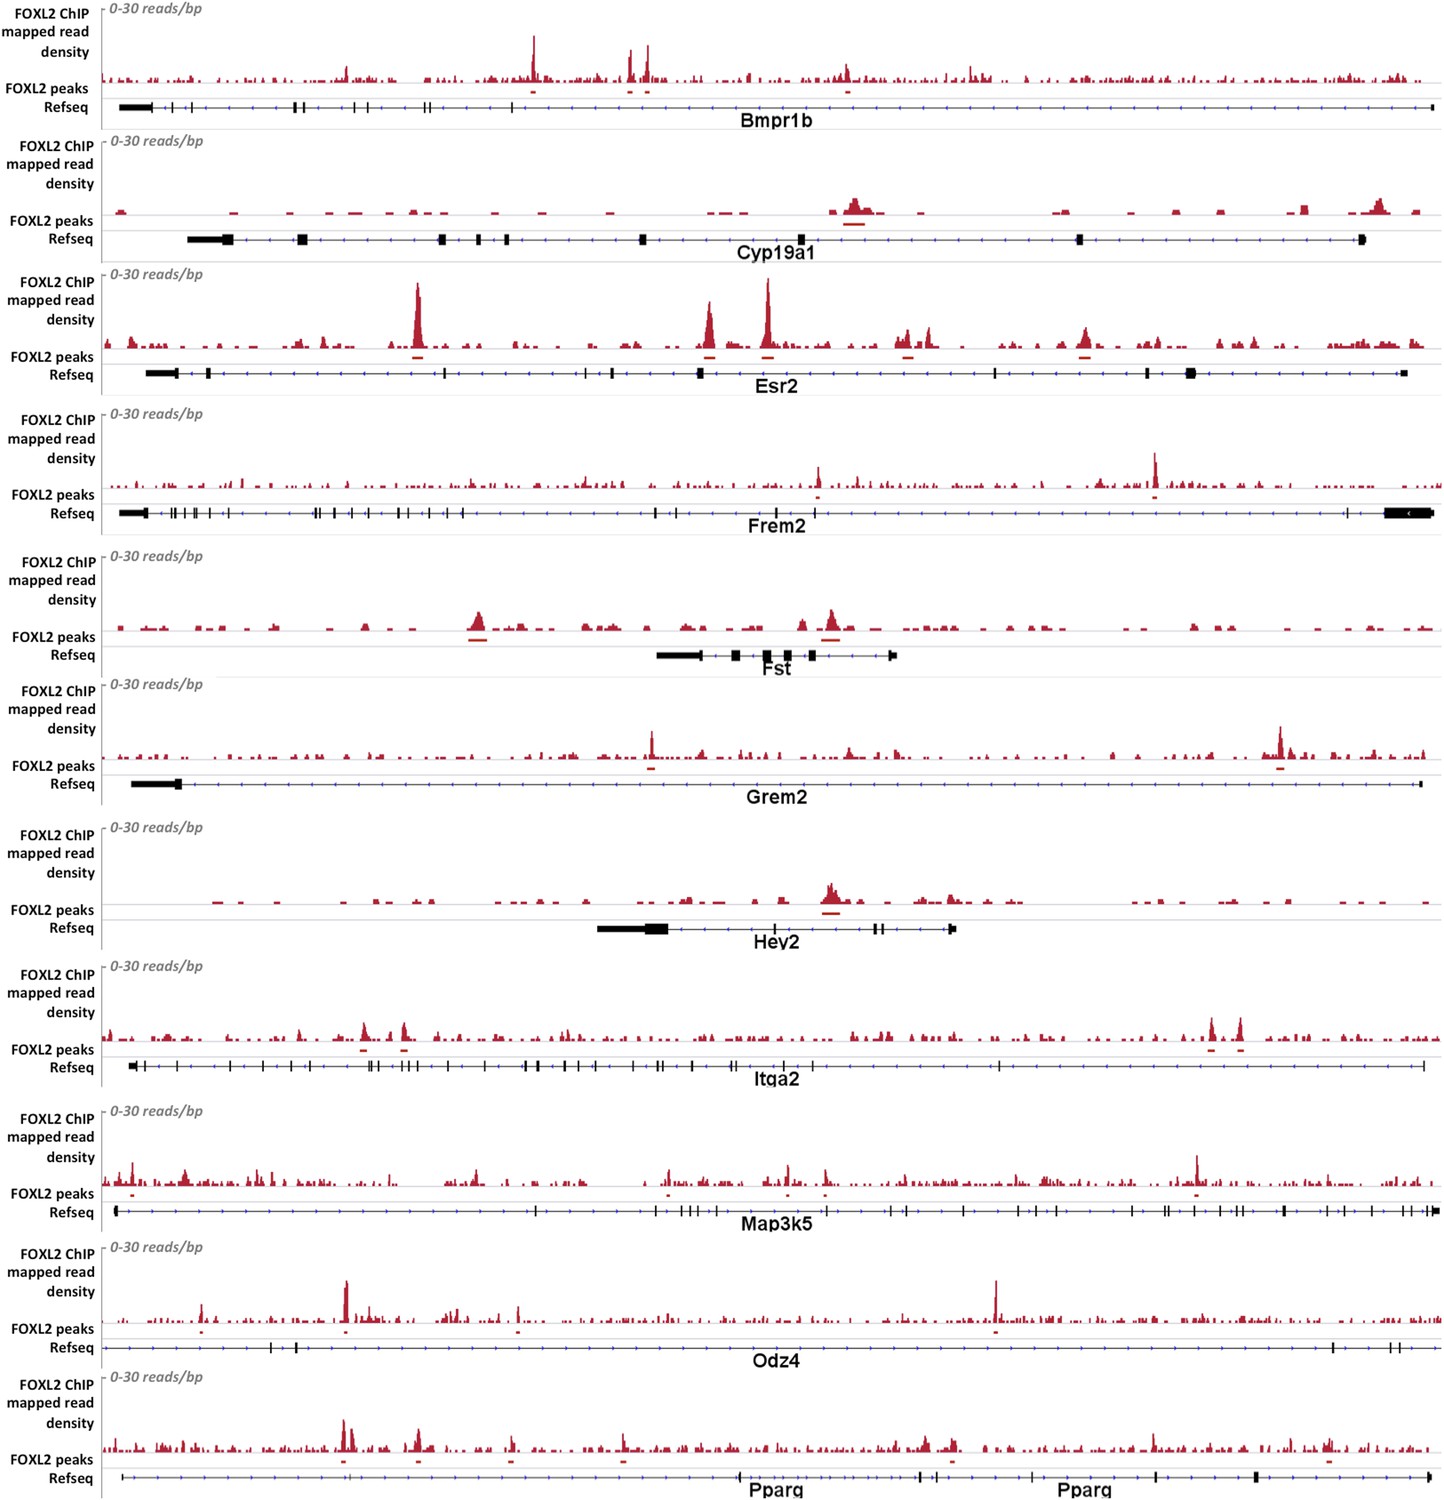
Alignment of the density of FOXL2-mapped reads and of FOXL2-detected peaks with the referenced transcription units of various gene activated by FOXL2.
From top to bottom: Bmpr1b, Cyp19a1, Esr2, Frem2, Fst, Grem2, Hey2, Itga2, Map3k5, Odz4, and Pparg. Mapped read density is represented along the y-axis (scale 0–30 reads/bp), peaks were detected using MACS algorithm (in red, FDR < 0.05). The position of Refseq annotations (in black) are represented under the graph. In all these examples, FOXL2 peaks can be detected in the introns of these genes, suggesting the existence of potential intronic regulatory elements used by FOXL2.
Figure 2—figure supplement 3
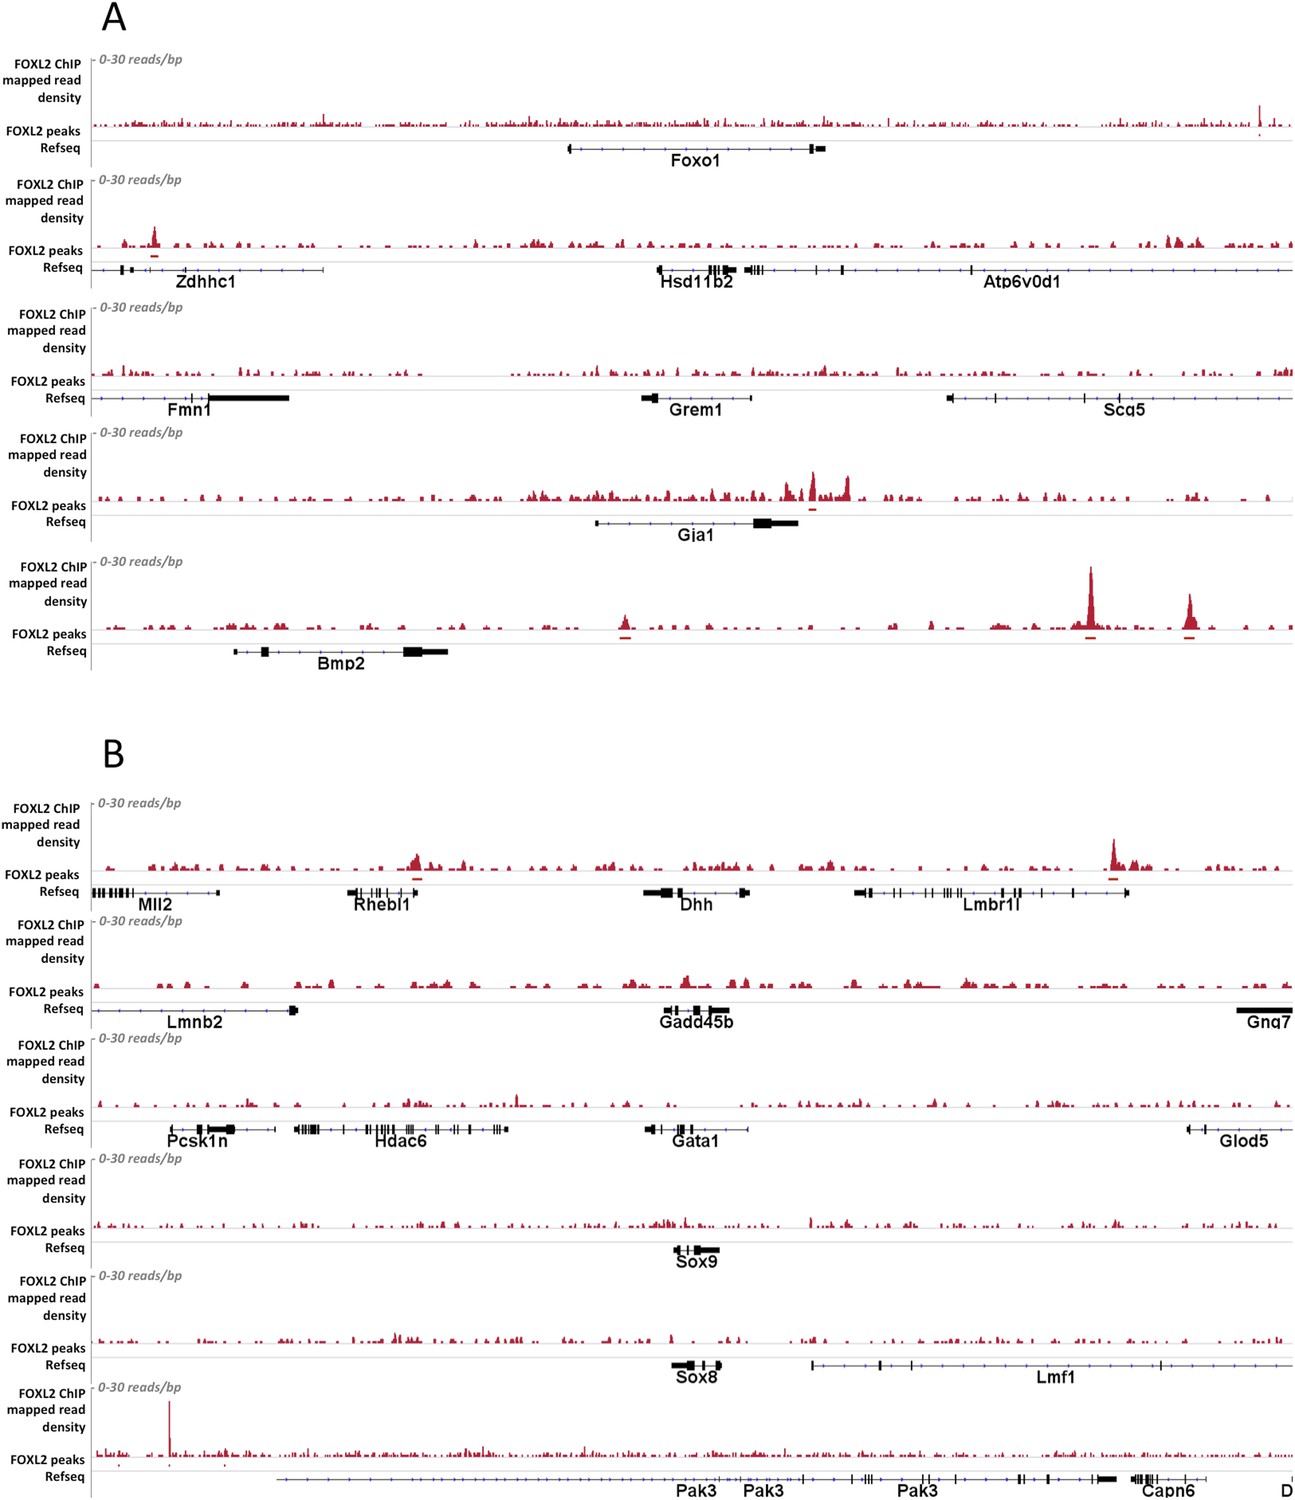
Alignment of the density of FOXL2-mapped reads and FOXL2-detected peaks with the referenced transcription units of various gene activated (A) or repressed (B) by FOXL2.
Mapped read density is represented along the y-axis (scale 0–30 reads/bp). Peaks were detected using MACS algorithm (in red, FDR < 0.05). The positions of Refseq annotations (in black) are represented under the graph. (A) From top to bottom: Foxo1, Hasd11b2, Grem1, Gja1, Bmp2. In these examples, no FOXL2 peaks can be detected within the gene transcription units. However, peaks outside the TU may in some case represent potential regulatory elements. (B) From top to bottom: Dhh, Gadd45b, Gata1, Sox9, and Sox8. In all these examples no FOXL2 peaks can be detected in the introns of these target genes. Some peaks can be detected at a relative proximity of Dhh and Gadd45b but not of Sox9, suggesting FOXL2 may also indirectly repress Sox9.
Figure 3
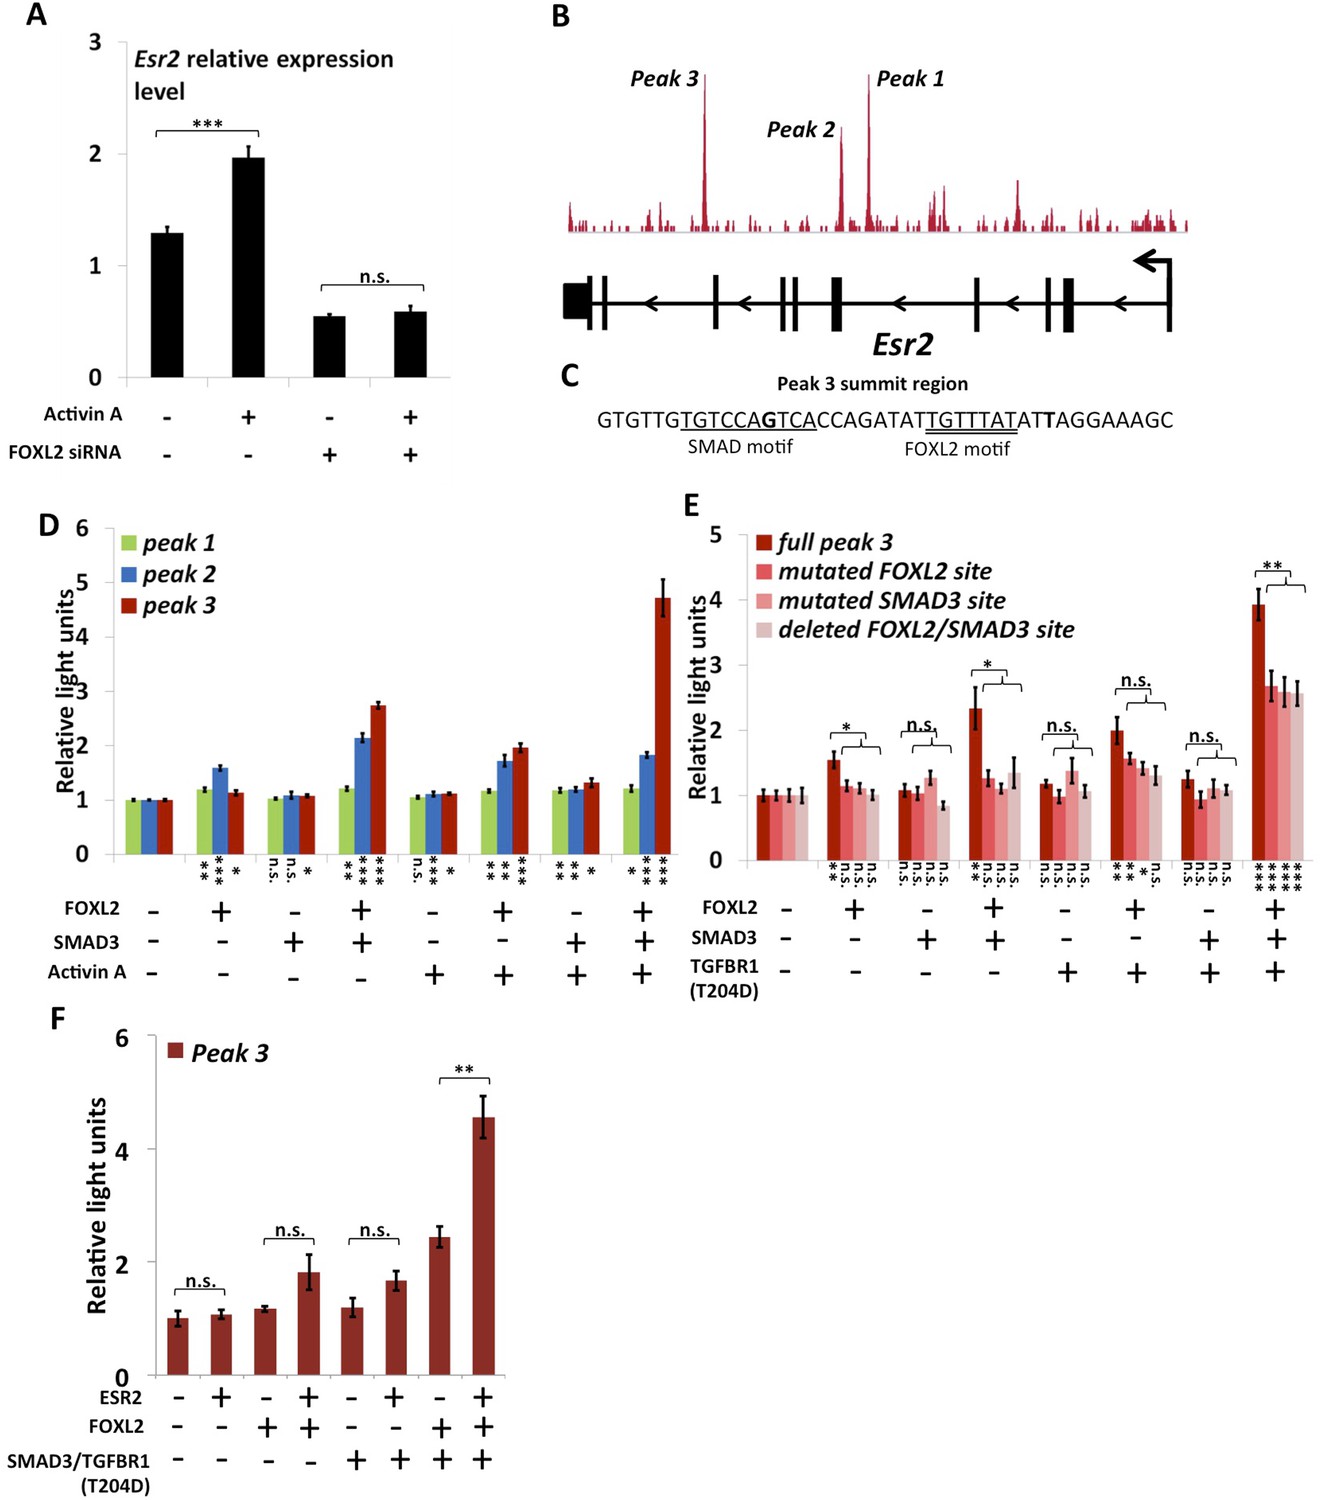
FOXL2 is required for ESR2 expression.
(A) Relative amounts of Esr2 cDNA, determined by qPCR, in mouse follicular cells transfected with an anti-FOXL2 or control siRNAs for 24 hr and treated by 2 nM Activin A or a vehicle for 18 hr. The average expression level of Sdha and Actb was used as a control for normalization. The values are the mean of three independent experiments performed in duplicate. (B) FOXL2 peaks in the Esr2 TU. Three main peaks can be observed in the fourth and eighth introns. (C) Sequence around the summit of the FOXL2 peak in the eighth intron. FOXL2 and SMAD motifs are present near the peak summit. (D–F) Luciferase assays showing FOXL2/SMAD3/ESR2 transcriptional cooperation/synergy on the Esr2 regulatory elements. COV434 cells were transfected with constructs driving the expression of FOXL2, SMAD3, ESR2, and/or a constitutive mutant of TGFBR1 (T204D), as well as with constructs containing the sequences of Peaks 1–3 (D), mutated versions of Peak 3 (E) or Peak 3 alone (F) cloned upstream of a minimal CMV promoter driving the expression of the Firefly luciferase gene, and a construct for the expression of the Renilla luciferase. In the indicated conditions, the cells were treated with 2 nM Activin for 18 hr before lysis. Transcriptional activity was measured as the ratio of Firefly/Renilla luciferases. p-values according to a Student's t test between the indicated conditions and the control condition: *p < 0.05; **p < 0.01; ***p < 0.001; n.s.: non-significant. Asterisks above the histogram in (E) represent the maximum p-value of a Student's t test between full Peak 3 transcriptional activity and all three mutants. Experiments were performed in six replicates.
Figure 4 with 5 supplements
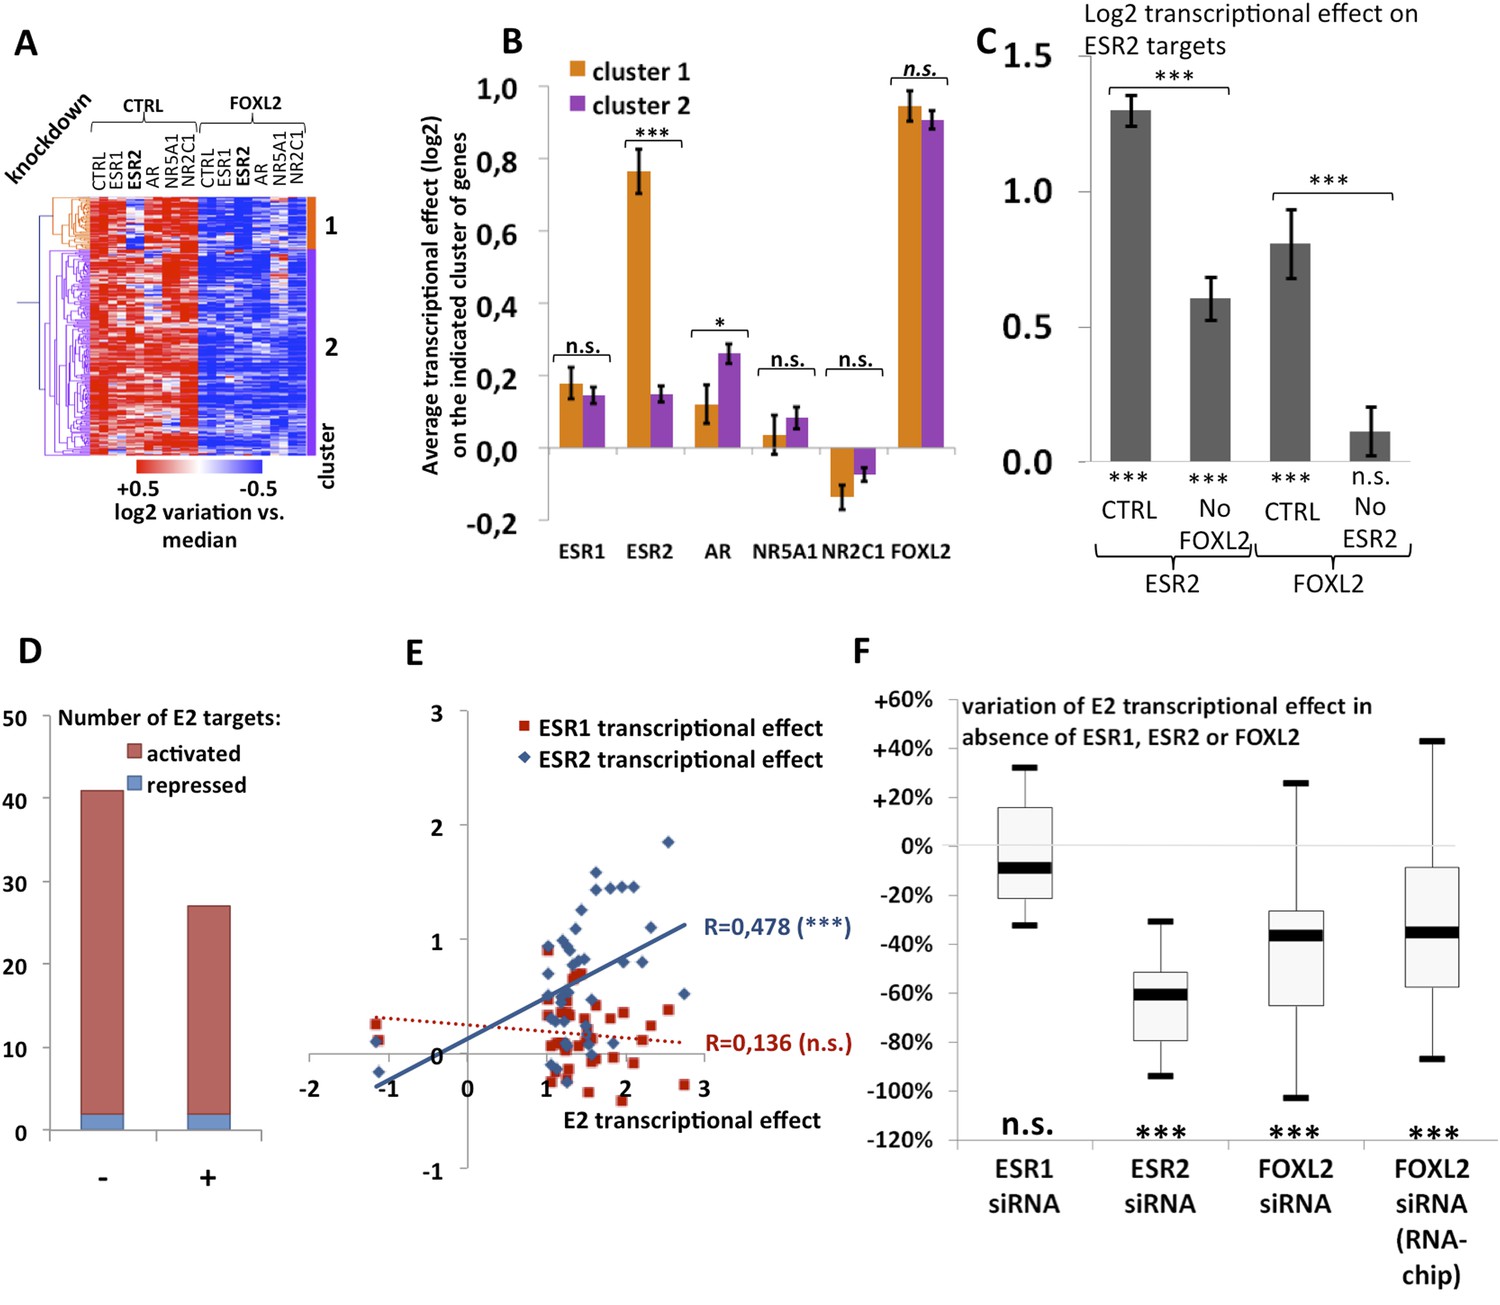
Analysis of estradiol-dependent transcription.
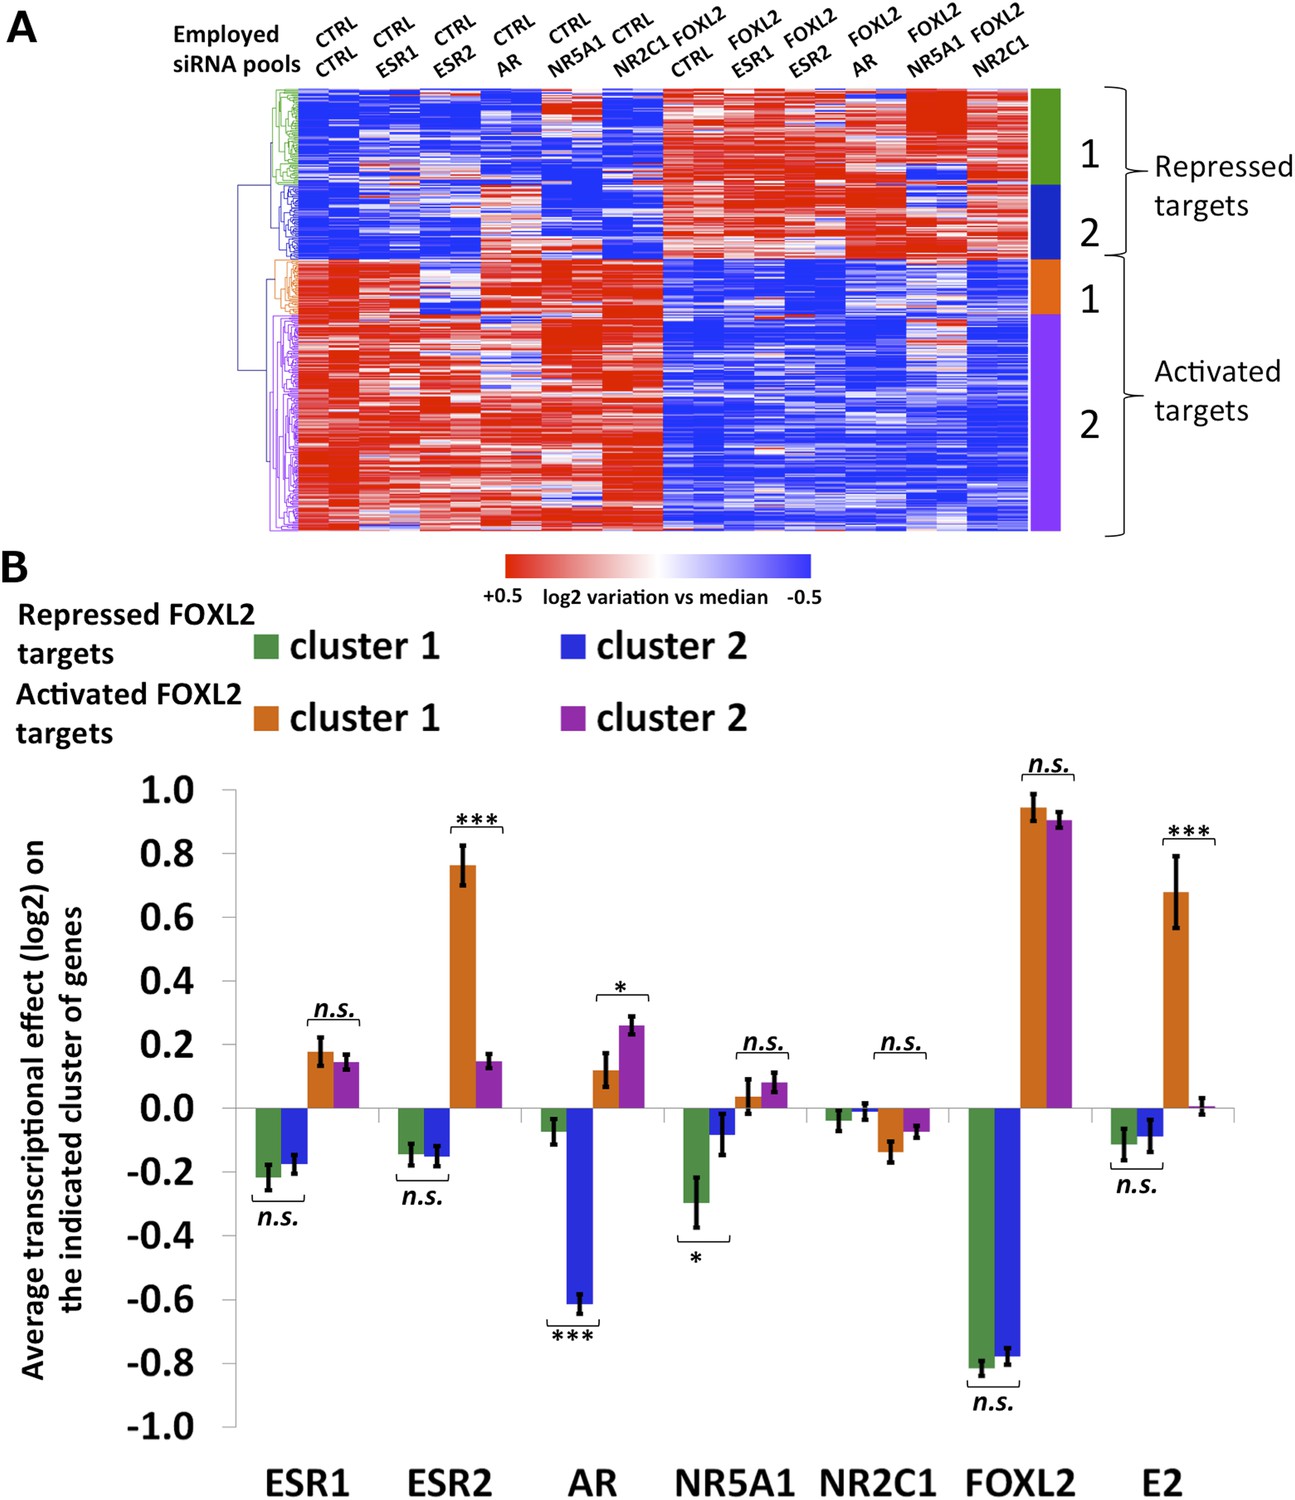
(A) Heatmap of the FOXL2-activated target genes in our arrays. The targets were classified using hierarchical clustering. (B) Histogram of the average transcriptional effects of the five NRs and FOXL2 on the two clusters of FOXL2-activated target genes. The error bars represent the Standard Error of the Mean (SEM). Asterisks represent the p-value according to Student's t tests: *p < 0.05; **p < 0.01; ***p < 0.001; n.s.: non-significant. This diagram shows that the two clusters are mainly discriminated by the ESR2 effect, and that cluster 1 comprises mostly ESR2 transcriptional targets. (C) Histogram representing the average transcriptional effect of ESR2 (first two bars) and FOXL2 (last two bars) on the group of 20 ESR2 transcriptional target genes, either in normal conditions, or in the absence of FOXL2 (for ESR2) or ESR2 (for FOXL2). The diagram shows that ESR2 transcriptional effect on its targets is dramatically reduced in the absence of FOXL2. FOXL2 has a strong positive transcriptional effect on ESR2 targets, but this effect is abolished when Esr2 is knocked-down. Asterisks above the graph represent the p-value according to two-sample Student's t tests: ***p < 0.001. Asterisks under the graph represent the p-value according to one-sample Student's t tests against the null hypothesis: ***p < 0.001. n.s.: p > 0.05. (D) Number of genes for which mRNA expression changed (2× or more) following a 10-hr E2 treatment in the presence of FOXL2 (i.e., in the presence of a control siRNA, left bar) or in the absence of FOXL2 (i.e., FOXL2-targeting siRNAs used for 24 hr before treatment, right bar). (E) Correlation of estradiol (E2) effect with that of either ESR1 (red squares) or ESR2 (blue diamonds) on E2-responding genes (log2-transformed data). Significance of the correlations according to a Fisher's F test: ***p < 0,001; n.s.: non-significant. (F) Boxplot of the variation of E2 transcriptional effect on E2 target genes (RNA-Chip lane) or 27 selected E2 target genes (first three lanes) between the control condition and the condition where Foxl2, Esr1, or Esr2 is knocked down (as indicated). Statistical significance of the observed differences with respect to the reference value 0 in a one-sample t test: n.s. non significant, ***p < 0.001.
-
Figure 4—source data 1
This file contains all Log2 transcriptional effects and transcriptional targets analyzed in Figure 4, which were calculated as indicated in methods.
The different tabs contain respectively (all Log2 transcriptional effects from both arrays, a list of E2 targets and a list of E2 targets in the absence of FOXL2). Red indicates activated transcriptional targets (more than twofold). Dark blue indicates repressed transcriptional targets (more than twofold). Orange indicates activated targets (between 1.5-fold and twofold). Light blue indicates repressed transcriptional targets (between 1.5-fold and twofold).
- https://doi.org/10.7554/eLife.04207.015
Figure 4—figure supplement 1
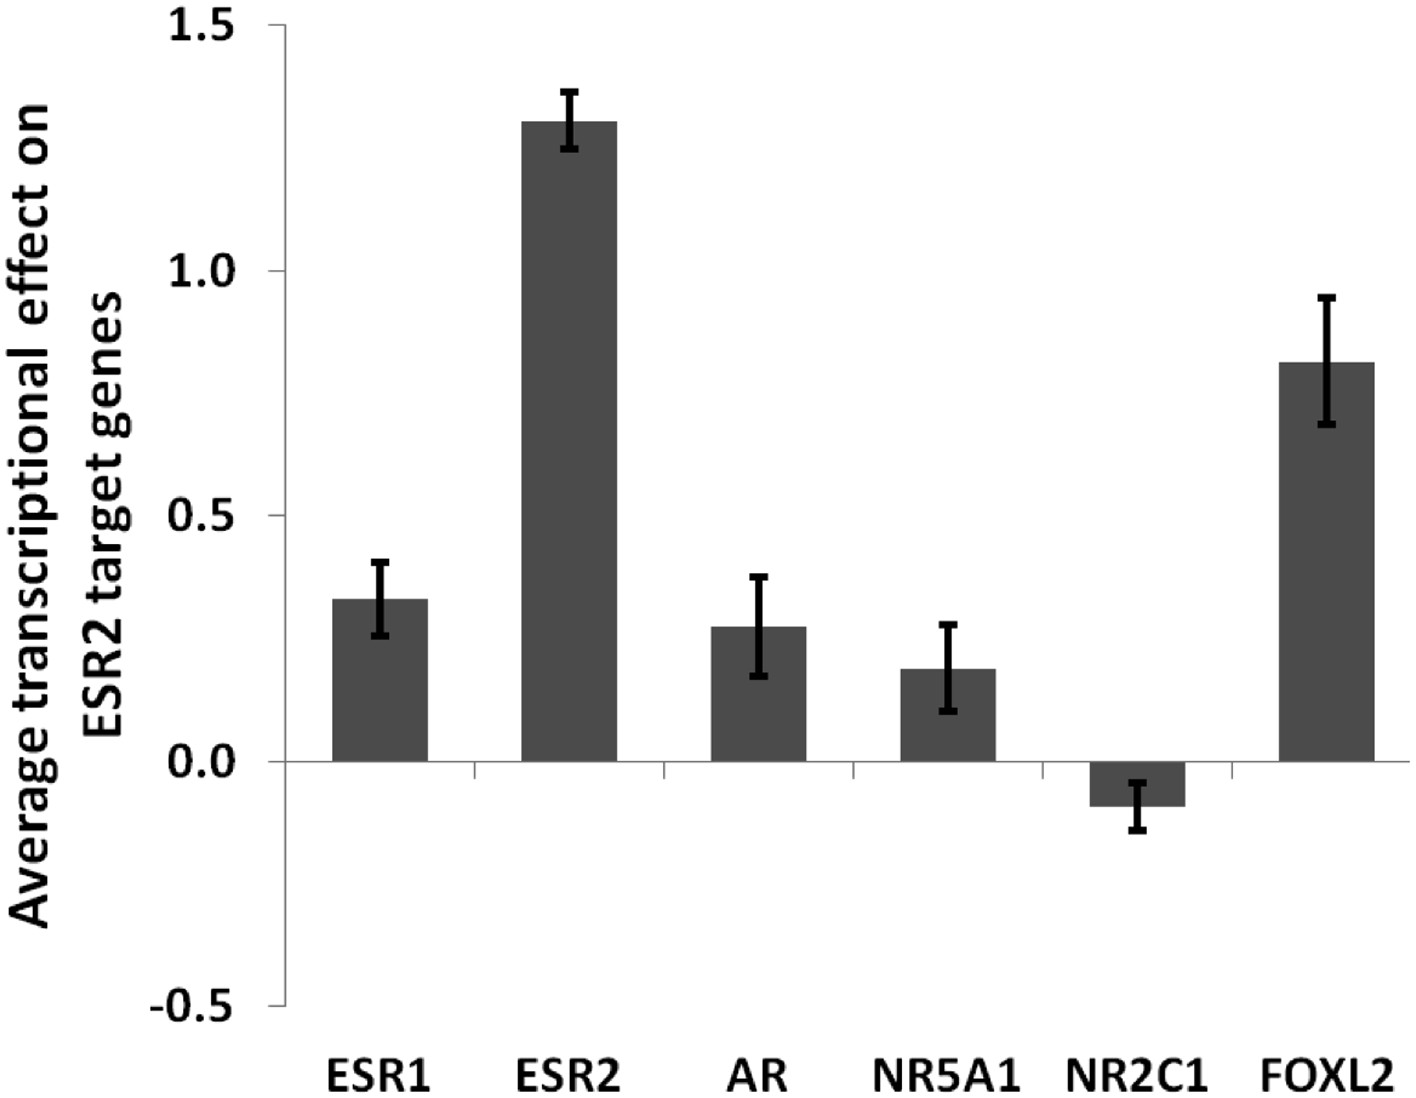
Average transcriptional effect (log2) of each tested factor on ESR2 target genes.
This graph shows that FOXL2 is a strong activator of ESR2 target genes. Error bars represent the SEM.
Figure 4—figure supplement 2
Characterization of FOXL2 transcriptional targets.
(A) Heatmap of FOXL2 targets in our arrays. A bootstraped hierarchical clustering was preformed and the resulting tree is represented on the left (from Figure 1C). The clustering separates with 100% of support two main groups of FOXL2-activated targets (in orange and purple), and two groups of FOXL2 repressed targets (in green and blue). (B) Histogram representing the average transcriptional effects of the five nuclear receptors, FOXL2 and estradiol on the four clusters of FOXL2 target genes. The error bar represents the Standard Error of the Mean (SEM). Stars represent the p-value according to a Student's t test: *p<0.05; **p<0.01; ***p<0.001; n.s.: non-significant. This diagram shows that (i) the two clusters of FOXL2-repressed targets are mainly discriminated by AR transcriptional effect, and that cluster 2 comprises mostly AR transcriptional targets. (ii) The two clusters of FOXL2-activated targets are mainly discriminated by ESR2 transcriptional effect, and that cluster 1 comprises mostly ESR2 transcriptional targets, which are also sensitive to estradiol.
Figure 4—figure supplement 3
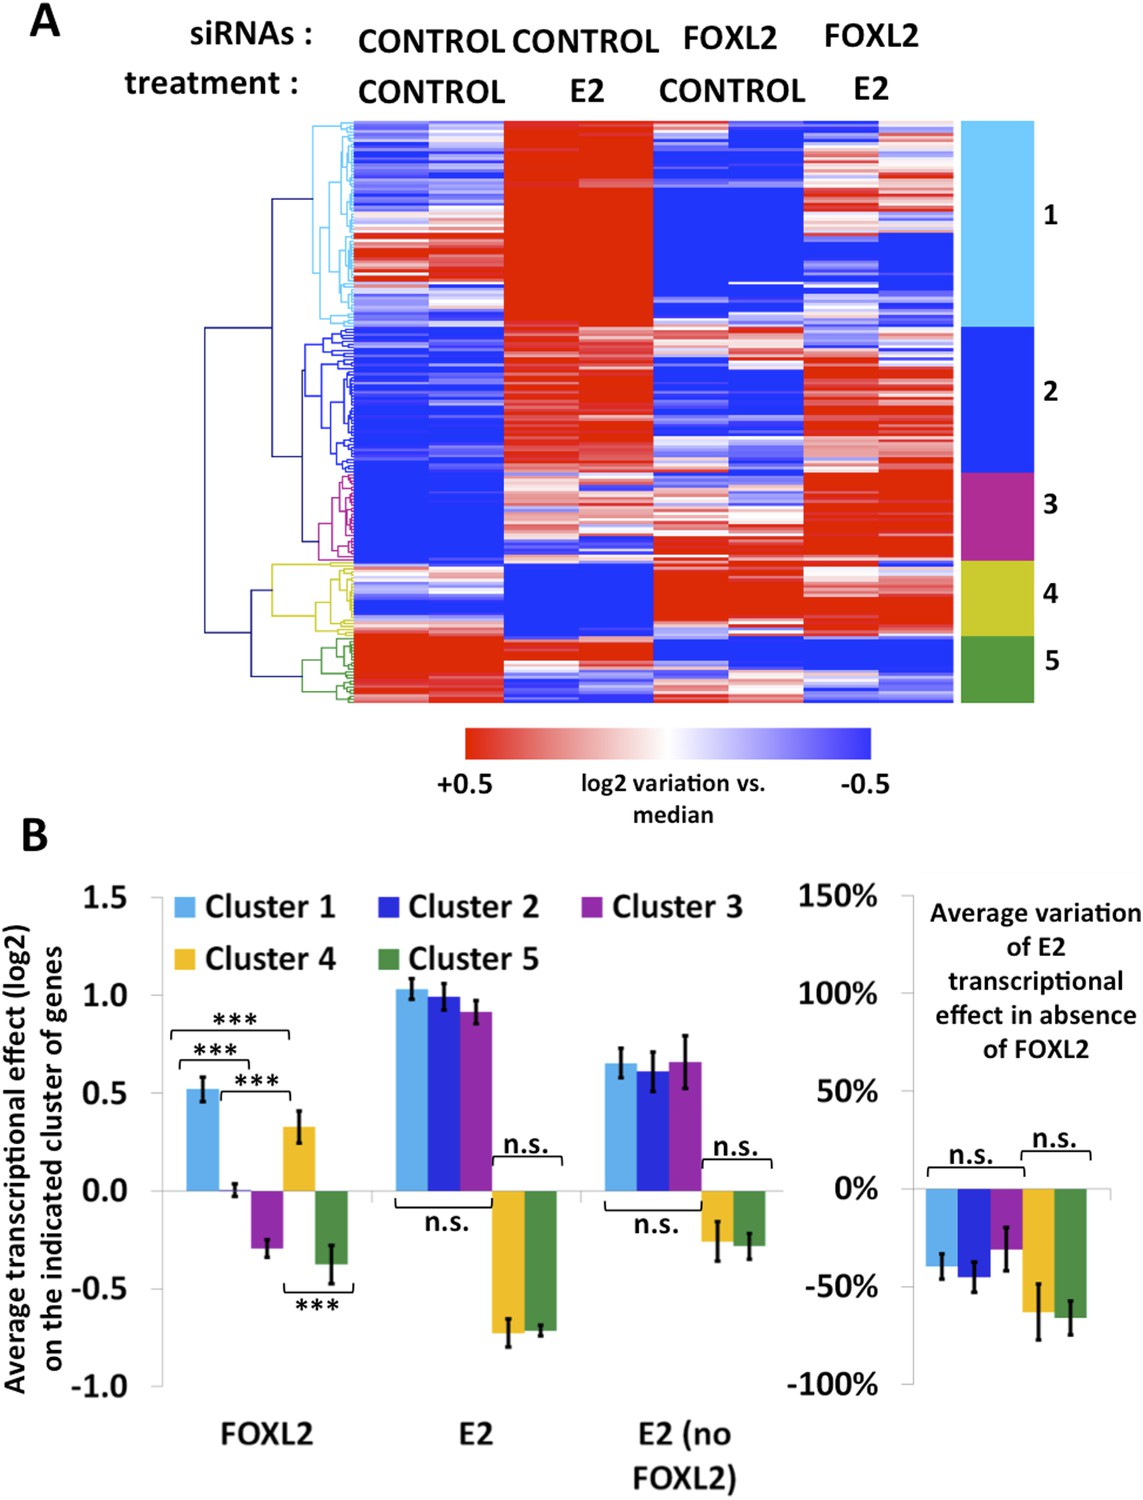
Characterization of estradiol transcriptional targets.
(A) Heatmap of the expression values of genes modified >1.5-fold in the presence of E2. A bootstraped hierarchical clustering was performed on these genes, and the resulting tree is represented on the left. Five main clusters were obtained with 100% of support (3 clusters of E2-activated genes, 2 clusters of E2-repressed genes). (B) The left histograms display the average transcriptional effect of the indicated factor (FOXL2, E2, or E2 in the absence of FOXL2) within the indicated gene clusters. Error bars represent the SEM. Asterisks represent the p-value of a Student's t tests between the indicated conditions: ***p < 0.001; n.s.: non significant. The right graph displays the average variation of E2 transcriptional effect between the conditions where FOXL2 is present and the conditions where Foxl2 is knocked down, within the indicated clusters.
Figure 4—figure supplement 4
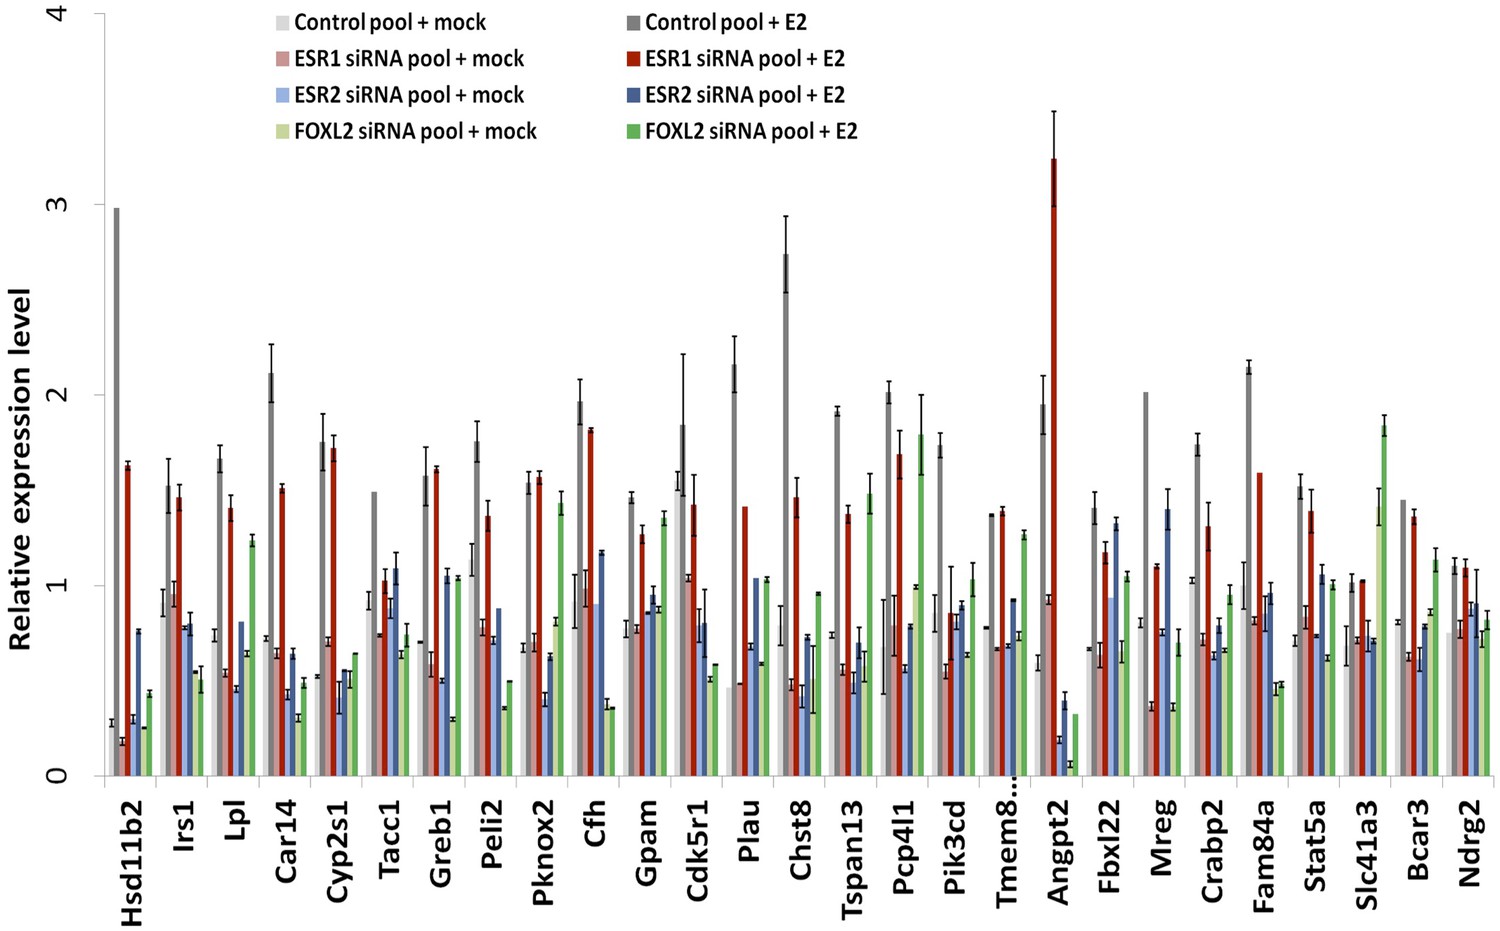
RT-qPCR characterization of ESR1, ESR2, and FOXL2 siRNAs effects on E2 transcriptional induction.
Quantification by qPCR of the expression level of 27 E2-responding genes following treatment of cells with anti-FOXL2, anti-ESR1 or anti-ESR2 siRNAs, and estradiol. Relative expression levels were normalized by the average expression level of Actb and Sdha. Bars represent the average of two technical duplicates, and the experiment was repeated with consistent results.
Figure 4—figure supplement 5
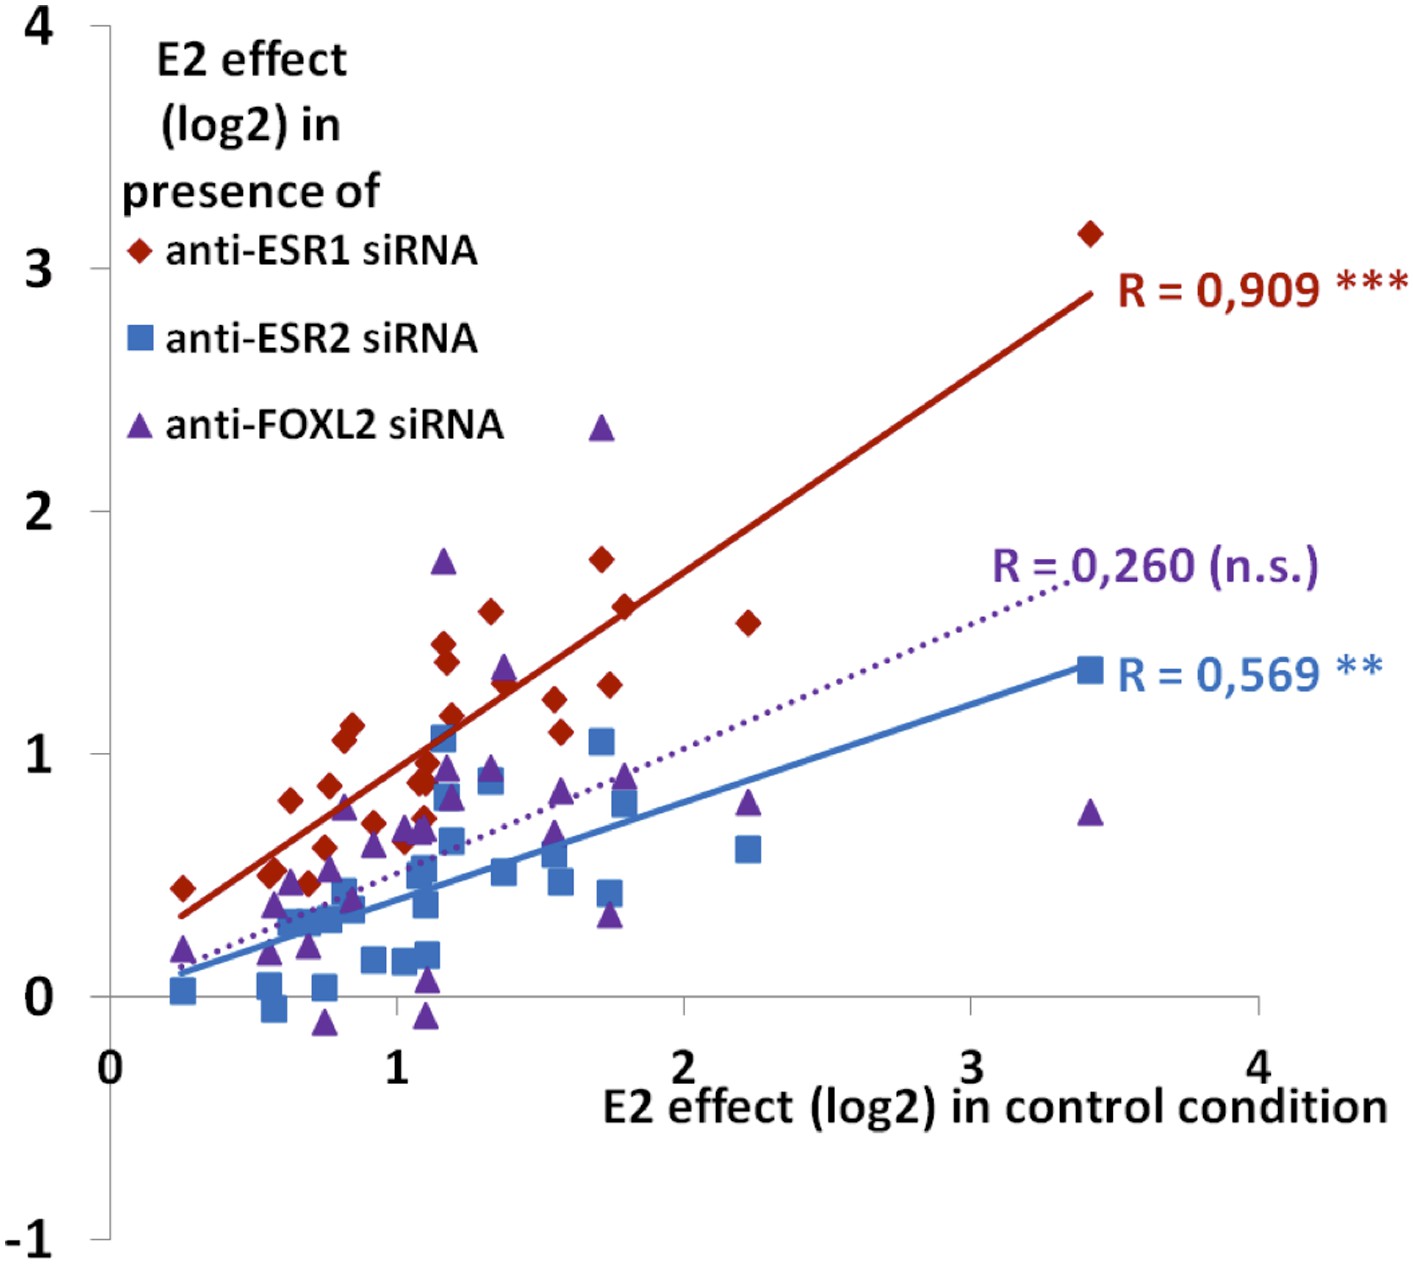
Synthetic representation of Figure 4—figure supplement 4.
Correlation between the E2 effect in the presence of siRNAs targeting Esr1 (red diamonds) or Esr2 (blue squares) or FOXL2 (purple triangles) with E2 transcriptional effect in the control condition. The lines represent the linear regression of either data sets (dotted for FOXL2, as the correlation is not significant). The slope of ESR1 linear regression is close to 1, showing that E2 effect is basically not affected by the Esr1 knockdown. Conversely, the slope of ESR2 linear regression is below 0.5, showing a strong reduction of E2 effect when Esr2 is knocked down. The wide scattering of E2 response in the presence of Foxl2 siRNA suggests that FOXL2 effect on E2 signaling may differ greatly depending on genes, despite an average reduction of E2 effect in the absence of FOXL2.
Figure 5

A robust network repressing SOX9 expression and promoting estradiol signaling.
(A) Western blot analysis of SOX9 and GAPDH expression in the extracts of follicle cells treated with anti-FOXL2 and/or anti-ESR2 siRNA pools for 48 hr. A black arrow designates SOX9. (B–C) Histogram representation of Cyp19a1 expression determined by our microarray analyses. Error bar represents the standard deviation based on two biological replicates. (D) Western blot analysis of SOX9 and GAPDH expression in extracts of hormone-deprived follicular cells treated with anti-FOXL2, anti-ESR1 or anti-ESR2 siRNA pools for 24hr and/or 17β-estradiol for 10 hr. (E) Schematic representation of our findings on FOXL2 regulation of estradiol signaling. Our findings suggest that FOXL2 may regulate estradiol signaling through (i) regulation of the production of E2 and (ii) regulation of estrogen receptivity by modulating the expression of Esr2. FOXL2 cooperates with Activin/SMAD3 and possibly ESR2 itself in the latter process. Sox9 repression seems to rely on multiple pathways in addition to the one described here, as FOXL2 and ESR1 have been described to co-bind a SOX9 regulatory element in the ovary.
Tables
Table 1
Term enrichment among FOXL2 targets in cultured murine primary cells and FOXL2 targets shared with in vivo analysis
| ID | Term | Count | Bonferroni | p-Value | Genes |
|---|---|---|---|---|---|
| GO TERM ENRICHMENT of FOXL2 target genes | |||||
| GO:0007155 | cell adhesion | 34 | 6.10−6 | 3.10−9 | NRP2, CDK5R1, CLSTN2, MYBPC3, LMO7, CLDN11, SOX9, CD24A, CNTNAP5A, TGFB2, WISP2, WISP1, PVRL1, ADAM2, MSLN, ACAN, COL6A2, PSTPIP1, COL6A1, ITGA1, ITGA2, PCDH8, PCDH7, EMILIN2, MCAM, GPR98, PCDH18, AMIGO2, ITGA9, OMD, FREM2, ITGA7, VCAN, BMPR1B |
| GO:0022610 | biological adhesion | 34 | 6.10−6 | 3.10−9 | NRP2, CDK5R1, CLSTN2, MYBPC3, LMO7, CLDN11, SOX9, CD24A, CNTNAP5A, TGFB2, WISP2, WISP1, PVRL1, ADAM2, MSLN, ACAN, COL6A2, PSTPIP1, COL6A1, ITGA1, ITGA2, PCDH8, PCDH7, EMILIN2, MCAM, GPR98, PCDH18, AMIGO2, ITGA9, OMD, FREM2, ITGA7, VCAN, BMPR1B |
| GO:0010817 | regulation of hormone levels | 16 | 2.10−5 | 1.10−8 | HSD17B1, EXOC3L, ADH7, VGF, IRS1, ALDH1A2, ACE, RDH10, DIO2, AKR1C18, CHST8, HSD11B2, BMPR1B, PCSK5, SMPD3, CYP19A1 |
| GO:0042127 | regulation of cell proliferation | 29 | 1.10−3 | 7.10−7 | FGFR2, FGF18, PTGS2, PPARG, BTC, FOXO1, SOX9, CD24A, ADORA1, TGFB2, ALDH1A2, BDNF, SPRY1, S1PR1, CDKN2B, HEY2, GRPR, ADAM33, PTGER2, BMP2, ICOSL, IL7, EFNB1, ESR2, IRS1, EREG, EPGN, PLAU, BMPR1A |
| GO:0042445 | hormone metabolic process | 12 | 1.10−3 | 8.10−7 | ALDH1A2, ACE, RDH10, DIO2, AKR1C18, HSD17B1, CHST8, HSD11B2, ADH7, BMPR1B, PCSK5, CYP19A1 |
| GO:0040007 | growth | 16 | 5.10−3 | 3.10−6 | FGFR2, BMP2, PTGS2, GJA1, MREG, SOX9, TIMP3, TGFB2, RDH10, EREG, MFSD7B, ETNK2, BMPR1B, BMPR1A, CYP19A1, ADD1 |
| GO:0016337 | cell–cell adhesion | 17 | 1.10−2 | 8.10−6 | CDK5R1, CLSTN2, LMO7, PCDH8, CLDN11, PCDH7, MCAM, SOX9, CD24A, GPR98, TGFB2, PCDH18, AMIGO2, PVRL1, FREM2, ACAN, BMPR1B |
| GO:0001568 | blood vessel development | 17 | 2.10−2 | 1.10−5 | FGFR2, FGF18, TBX20, FOXO1, GJA1, CXCL12, TGFB2, ALDH1A2, S1PR1, EREG, EPGN, ITGA7, HEY2, ROBO4, ANGPT1, COL1A1, ANGPT2 |
| GO:0048589 | developmental growth | 11 | 3.10−2 | 2.10−5 | FGFR2, RDH10, EREG, PTGS2, GJA1, BMPR1B, MREG, SOX9, TIMP3, BMPR1A, CYP19A1 |
| GO:0001944 | vasculature development | 17 | 3.10−2 | 2.10−5 | FGFR2, FGF18, TBX20, FOXO1, GJA1, CXCL12, TGFB2, ALDH1A2, S1PR1, EREG, EPGN, ITGA7, HEY2, ROBO4, ANGPT1, COL1A1, ANGPT2 |
| GO:0048608 | reproductive structure development | 12 | 5.10−2 | 3.10−5 | FGFR2, DHH, RDH10, EREG, FST, ADAMTS1, ESR2, BMPR1B, VGF, SOX9, LFNG, CYP19A1 |
| PANTHER CLASSIFICATION of FOXL2 target genes | |||||
| BP00274 | Cell communication | 31 | 7.10−4 | 6.10−6 | CXCL5, CLSTN2, PPARG, BTC, FOXO1, CNTNAP5A, ASGR1, ASGR2, WISP2, BDNF, PVRL1, ADAM2, ANGPT1, HTR1D, ANGPT2, ODZ4, SLC8A1, IL7, EFEMP2, PCDH8, ESR2, PCDH7, GPR98, ARHGAP26, PCDH18, OMD, FREM2, EPGN, VCAN, PLAU, IGFBP4 |
| BP00102 | Signal transduction | 70 | 2.10−3 | 1.10−5 | NRP2, NDST4, CLSTN2, BTC, PPARG, GJA1, FOXO1, CNTNAP5A, ASGR1, ASGR2, BDNF, WISP2, S1PR1, GAB2, CXCR7, ADAM2, PDE4B, STARD8, ANGPT1, CHST15, HTR1D, RAMP1, ANGPT2, CCRL1, ODZ4, PTGER2, ARHGEF7, PCDH8, ESR2, PCDH7, IRS1, GPR98, ARHGAP26, AMIGO2, PLCE1, EREG, LYST, VCAN, RASD1, CAMK1D, FGFR2, IL1R1, CXCL5, SAV1, HS3ST1, PVRL1, GRPR, PCSK5, OLFM1, PIK3R1, SLC8A1, IL7, RASEF, EFEMP2, SPSB4, VMN2R11, SHANK2, RCAN2, PCDH18, DUSP5, EPHA4, OMD, RPS6KA1, RGS2, EPGN, FREM2, RGS4, BMPR1B, PLAU, IGFBP4 |
| GO TERM ENRICHMENT of the ‘in vivo’ FOXL2 target (71 genes at the intersection between our data and Ulenhaut's 2009) | |||||
| GO:0010817 | regulation of hormone levels | 7 | 1.10−2 | 2.10−5 | HSD17B1, CHST8, HSD11B2, EXOC3L, BMPR1B, PCSK5, CYP19A1 |
| GO:0042445 | hormone metabolic process | 6 | 3.10−2 | 4.10−5 | HSD17B1, CHST8, HSD11B2, BMPR1B, PCSK5, CYP19A1 |
-
Gene lists (FOXL2 targets or FOXL2 targets shared with Uhlenhaut et al., 2009) were analysed using the DAVID server (david.abcc.ncifcrf.gov/) to find significantly enriched terms among the GO Biological Process and Panther Biological Process databases. Only terms enriched with a Bonferroni p-value <0.05 were retained.
Download links
A two-part list of links to download the article, or parts of the article, in various formats.
Downloads (link to download the article as PDF)
Open citations (links to open the citations from this article in various online reference manager services)
Cite this article (links to download the citations from this article in formats compatible with various reference manager tools)
The transcription factor FOXL2 mobilizes estrogen signaling to maintain the identity of ovarian granulosa cells
eLife 3:e04207.
https://doi.org/10.7554/eLife.04207


