Maximally informative foraging by Caenorhabditis elegans
- University of California, San Diego, United States
- Salk Institute for Biological Studies, United States
Figures
Figure 1
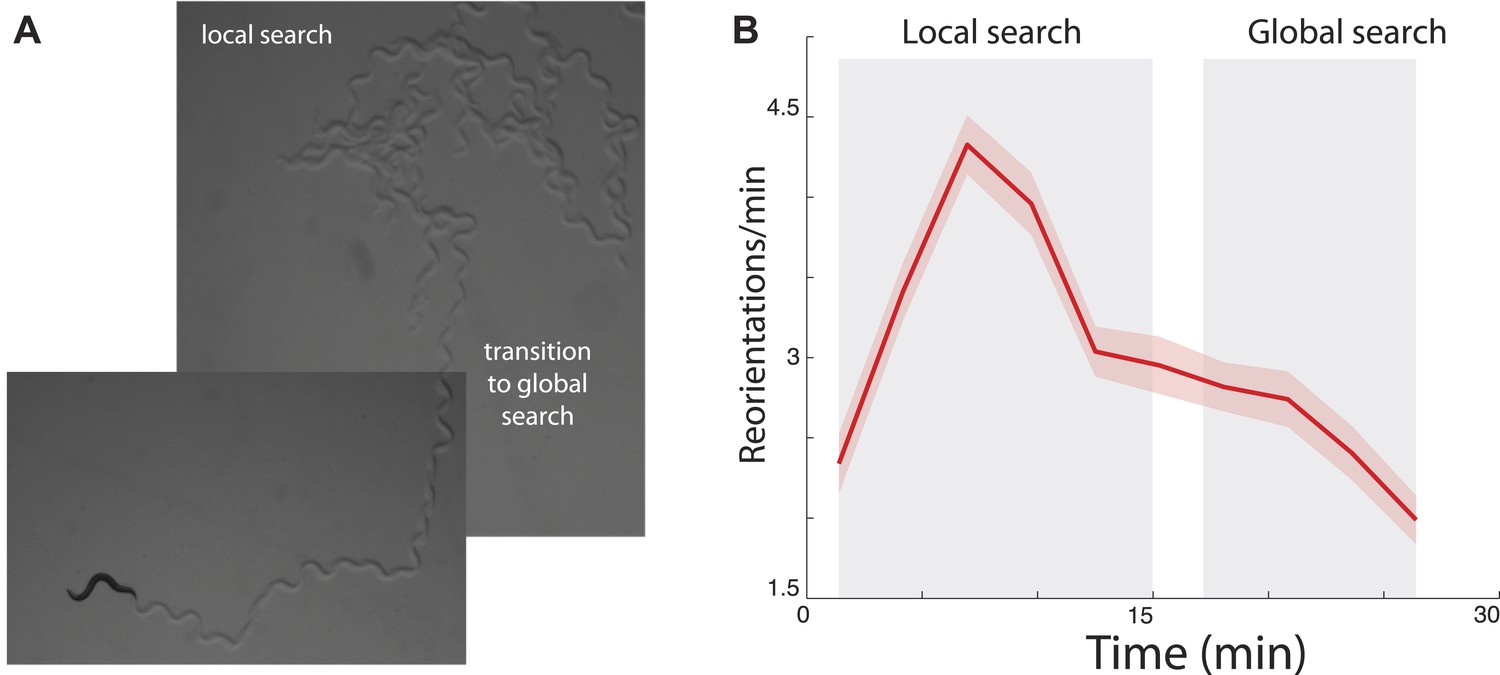
Transition between local and global search in C. elegans foraging trajectories following their removal from food.
(A) Animals search the local area by producing a large number of turns before abruptly transitioning to a global search. (B) Across many animals, this transition is readily apparent in the mean turning rate. Standard error of the mean is shown as the lightly shaded region around the solid average line.
Figure 2
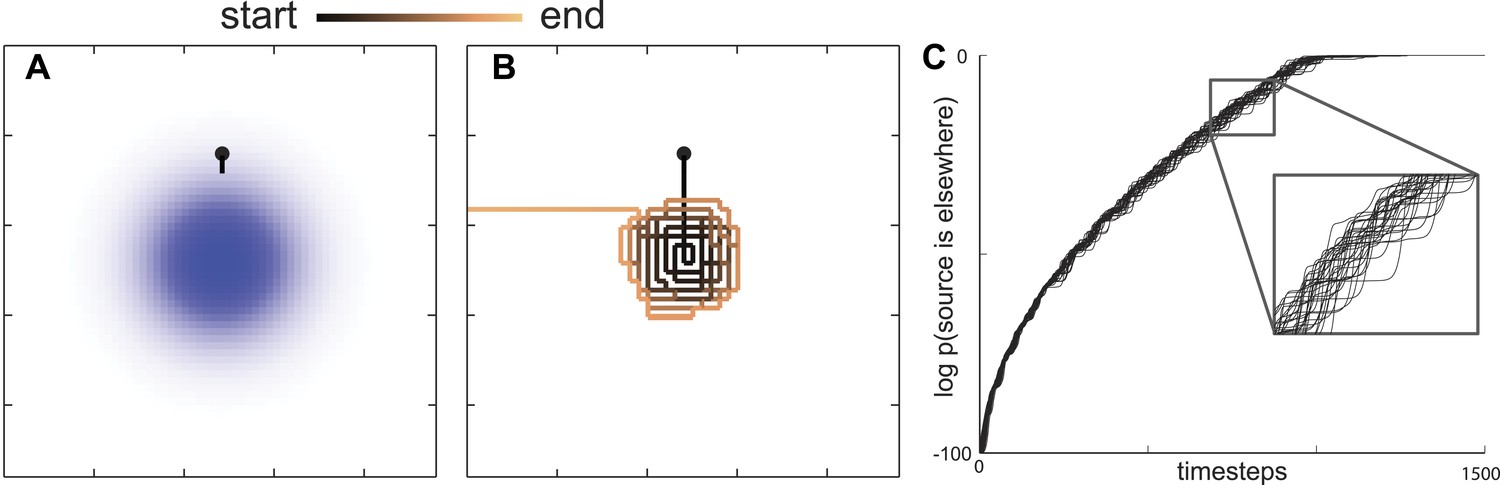
Maximally informative trajectories exhibit abrupt transitions between spiral-like and straight motion towards the boundary.
(A) Initial trajectories of the model head directly towards the peak probability of finding an odor source. (B) After some period of time the model displays an abrupt transition in behavior from a spiral-like motion to a straight motion towards the boundary. (C) The log probability that the food is elsewhere consistently increases as the search progresses. The transition between local (spiral-like) and global (straight motion towards the boundary) search occurs when this probability approaches 1.
Figure 3
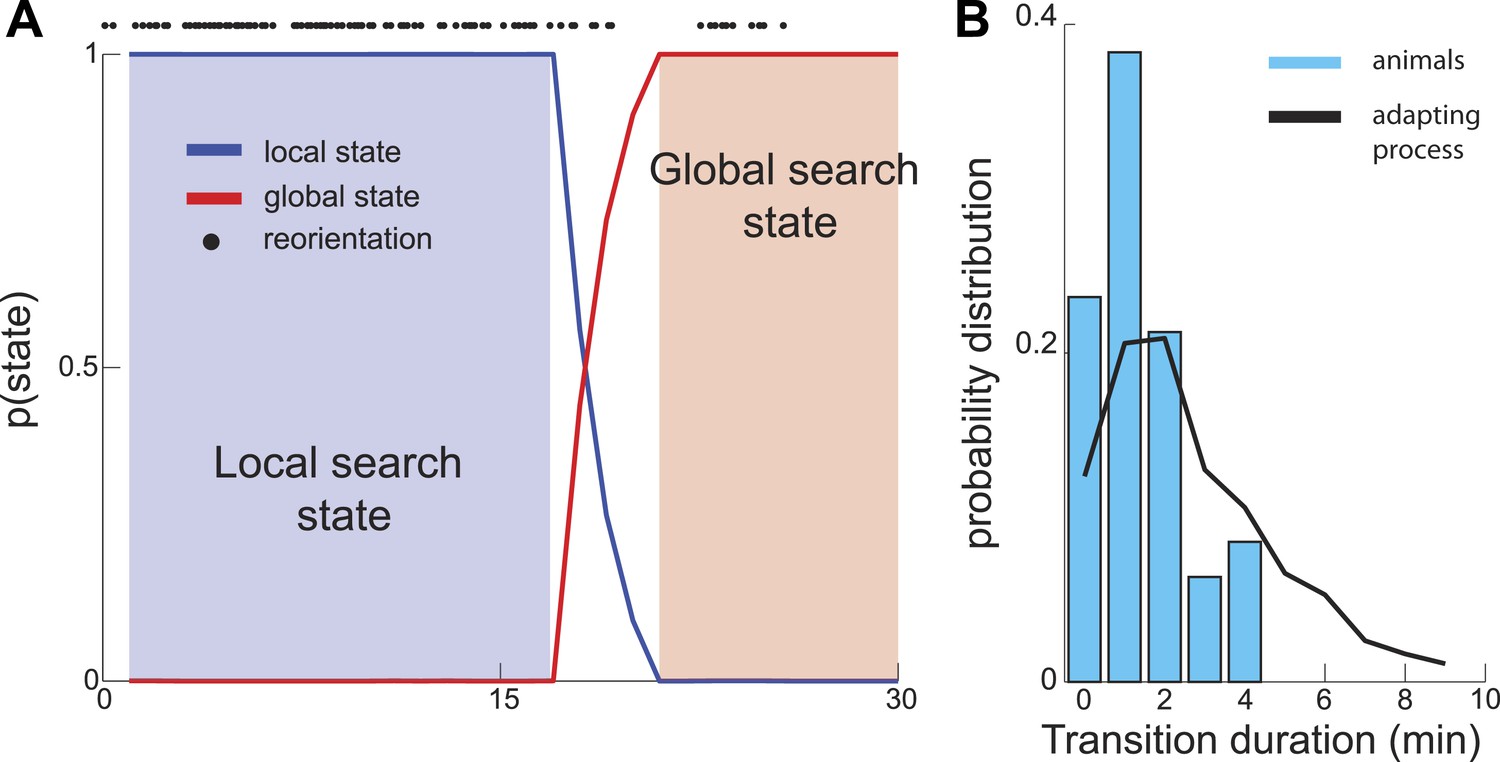
Sharp Transition between local and global phases of the search.
We used a Hidden Markov model to estimate the probability that animal's behavior falls into one of two states. (A) Example analysis based on a single trajectory shows fast (several minutes) switching time between the local and global phases of the search. (B) The distribution of transition durations across a set of trajectories from different animals.
Figure 4 with 1 supplement
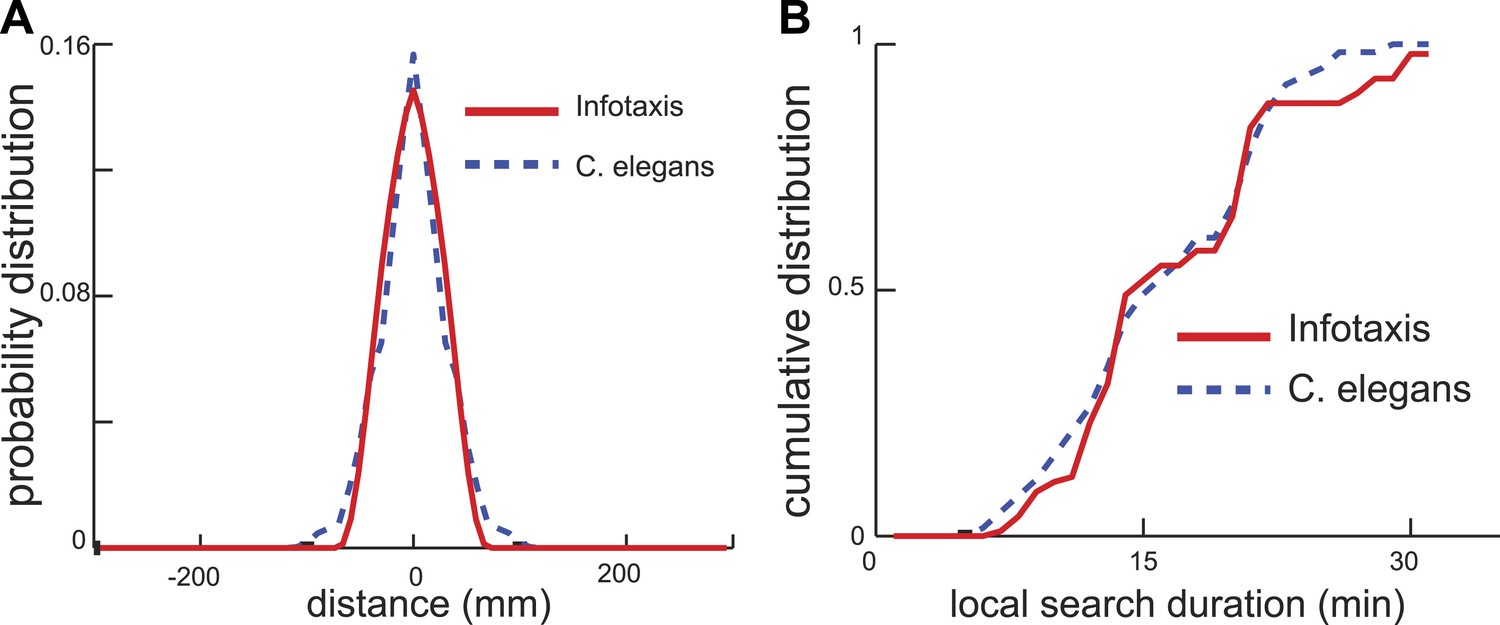
Infotaxis model quantitatively accounts for the worm trajectories.
(A) The distribution of worm displacements from an initial position at the end of the local search is non-Gaussian and can be fitted using the three parameters (See ‘Materials and methods’) of the infotaxis model. (B) The same set of parameters also accounts for the cumulative distribution for the local search duration across different individual worms.
Figure 4—figure supplement 1

Comparison of measured local search duration times with predictions based on chemotaxis and infotaxis models.
The chemotaxis model was fit by measuring the maximum and steady-state turning rates of the animal and constraining the mean turning rate. The data (blue dashed line) and infotaxis (red solid line) are reproduced from Figure 4.
Figure 5
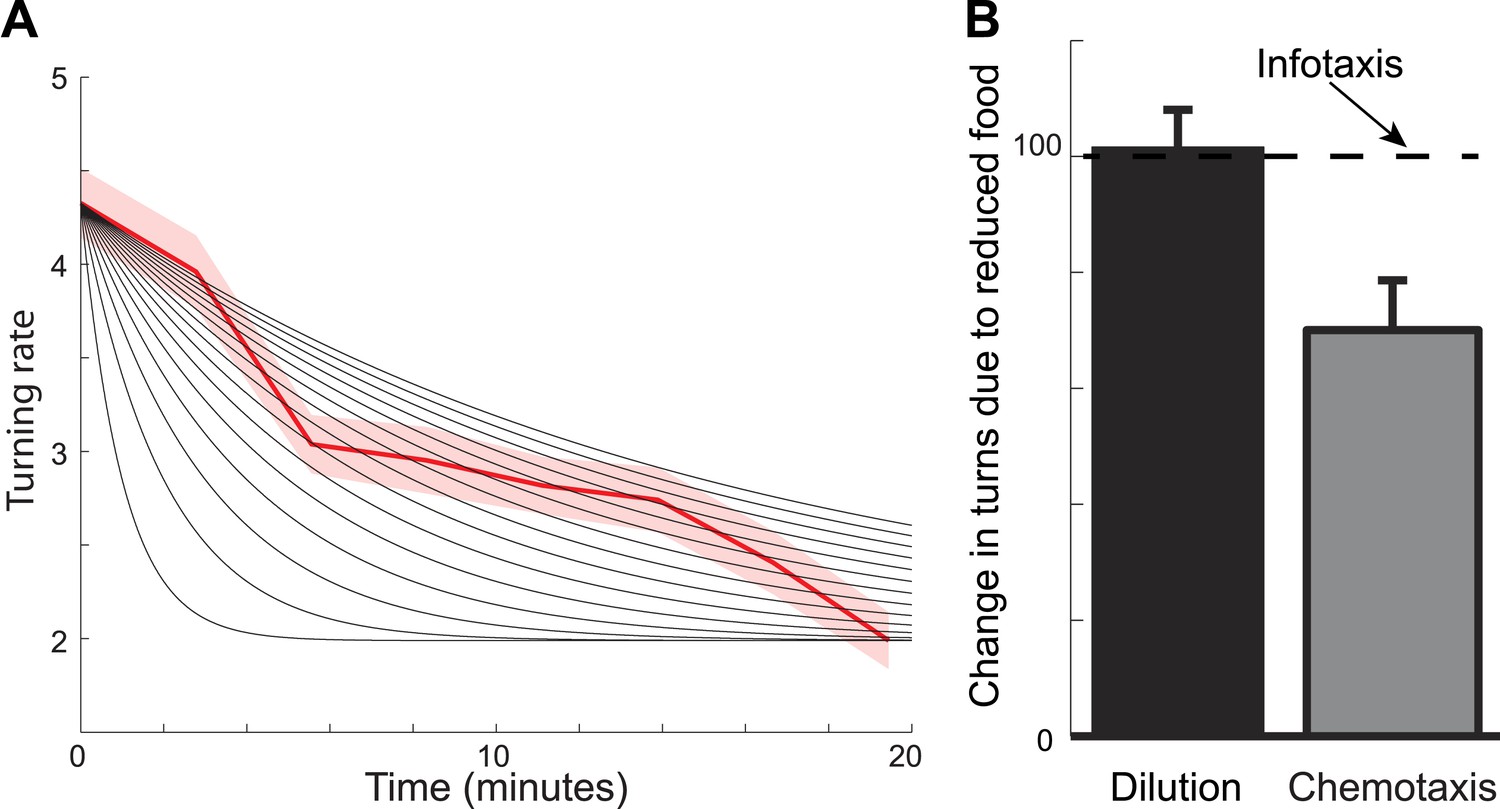
Foraging trajectories deviate from predictions of the chemotaxis model.
The chemotaxis model explains the reduction in the average number of turns as adaptation to low odorant concentration. (A) For different adaptation times, the predicted dynamics of turn rate can match either the slow decay in the beginning of the search or the small rate of turning at the end of the search, but not both. Black lines are predictions using adaptation while red shows experimental measurements. (B) The average number of turns is unaffected by changes in food concentration (black), in contrast to chemotaxis predictions (grey bar) and in agreement with the infotaxis predictions (dashed line).
Figure 6
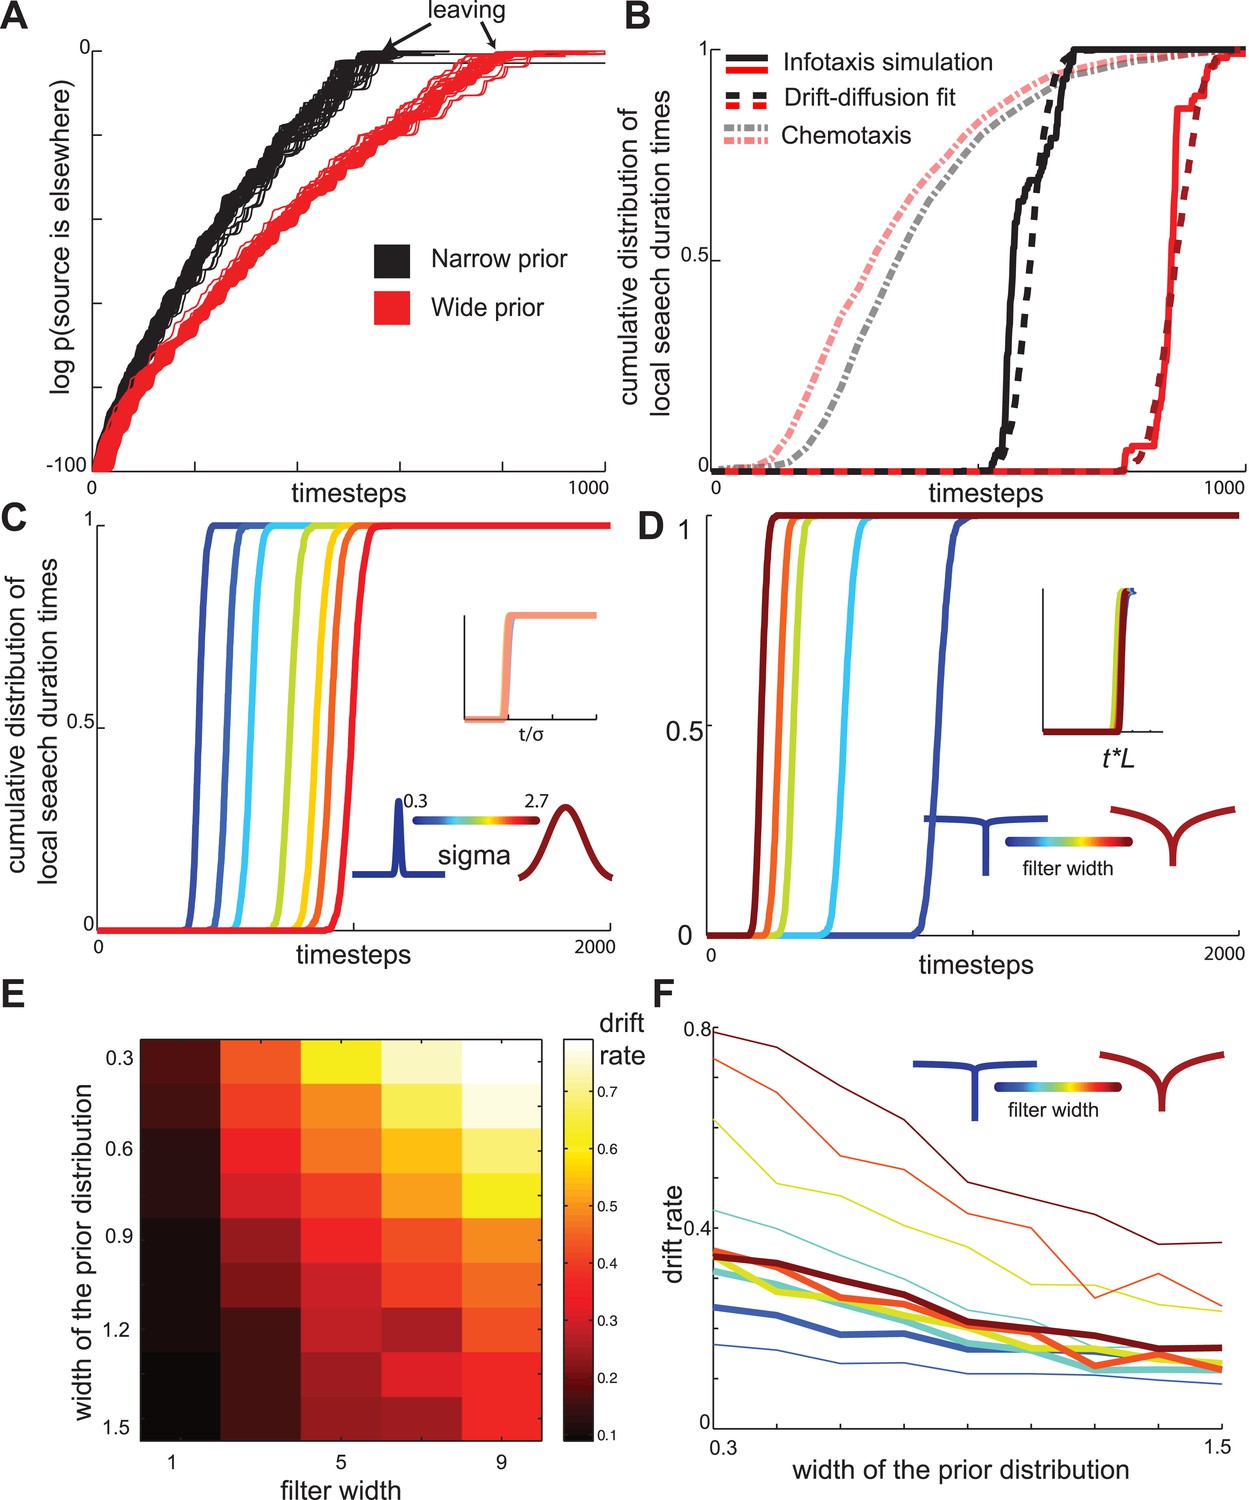
Drift-diffusion approximates maximally informative search across a range of conditions.
(A) The log probability that the food is located elsewhere has approximately linear dynamics, resembling a drift-diffusion decision variable. The drift rate (slope) decreases with the width of the prior distribution (B) The distribution of local search duration times can be approximated by a drift diffusion model for a range of conditions. The chemotaxis model predicts an opposite shift in the local search duration times between wide and narrow priors compared to the infotaxis predictions. In both panels (A) and (B) red and black curves correspond to wide and narrow priors, respectively. (C) The drift rate increases linearly with the width σ of the prior distribution. (D) The drift rate decreases linearly with filter width L (E) The drift rate depends primarily on the ratio L/ σ. (F) Normalizing models with different filters by their prior distribution widths reveals a common strategy.
Figure 7
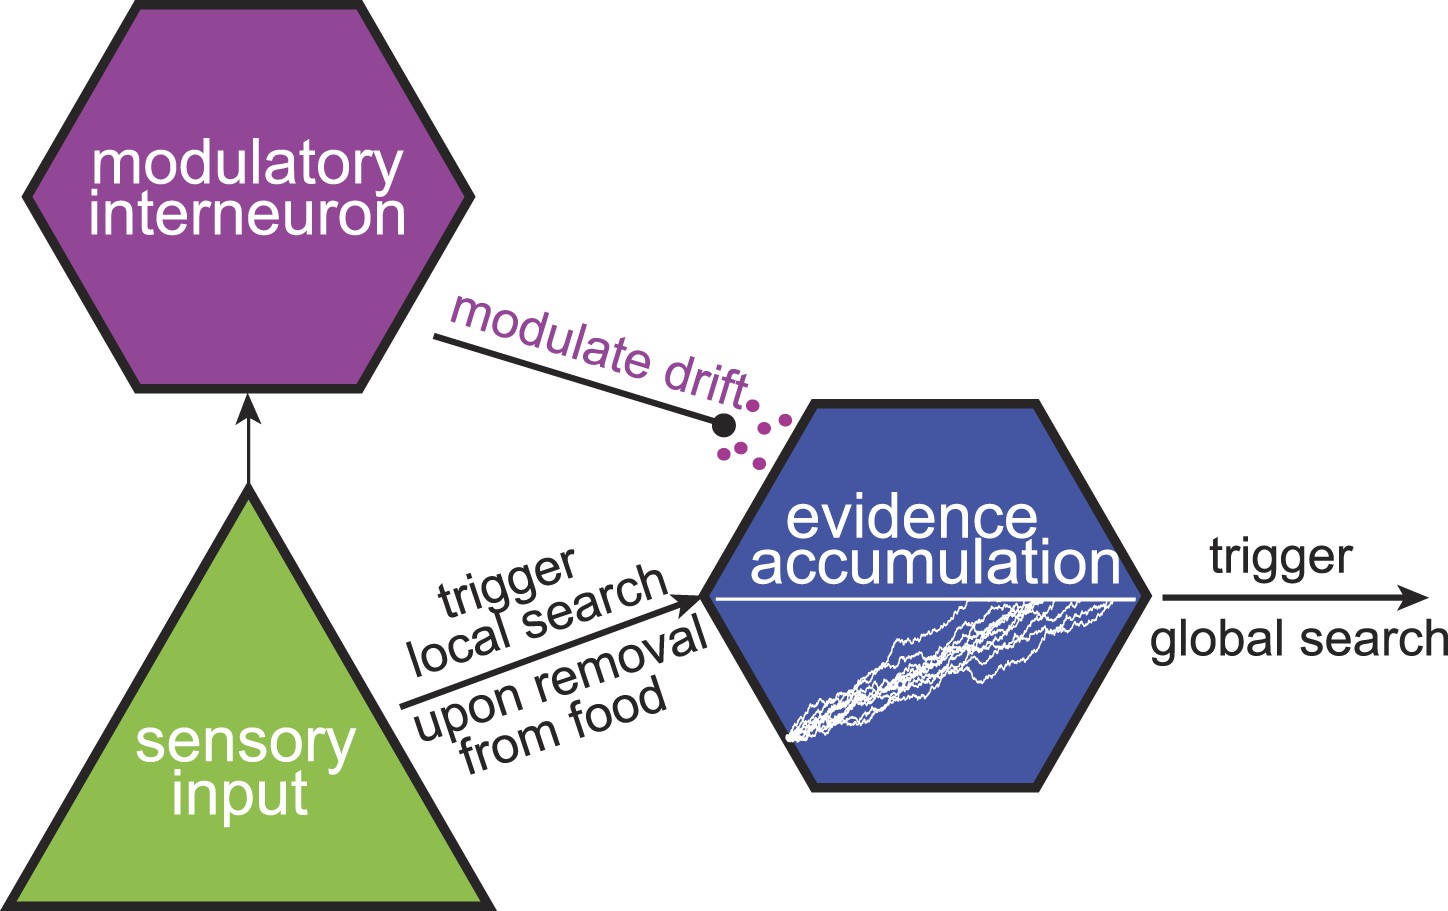
A tentative neural model for near-optimal foraging.
Maximally informative foraging can be approximated by a combination of local and global search phases. Responses of a sensory neuron initiate the start of the local search. The passage of time during the local search is encoded in the intracellular voltage of an interneuron. Finally, the duration of the local search can be modulated by the release of neuromodulators.
Download links
A two-part list of links to download the article, or parts of the article, in various formats.
Downloads (link to download the article as PDF)
Open citations (links to open the citations from this article in various online reference manager services)
Cite this article (links to download the citations from this article in formats compatible with various reference manager tools)
Maximally informative foraging by Caenorhabditis elegans
eLife 3:e04220.
https://doi.org/10.7554/eLife.04220


