Recombination occurs within minutes of replication blockage by RTS1 producing restarted forks that are prone to collapse
- University of Oxford, United Kingdom
Figures
Figure 1 with 1 supplement
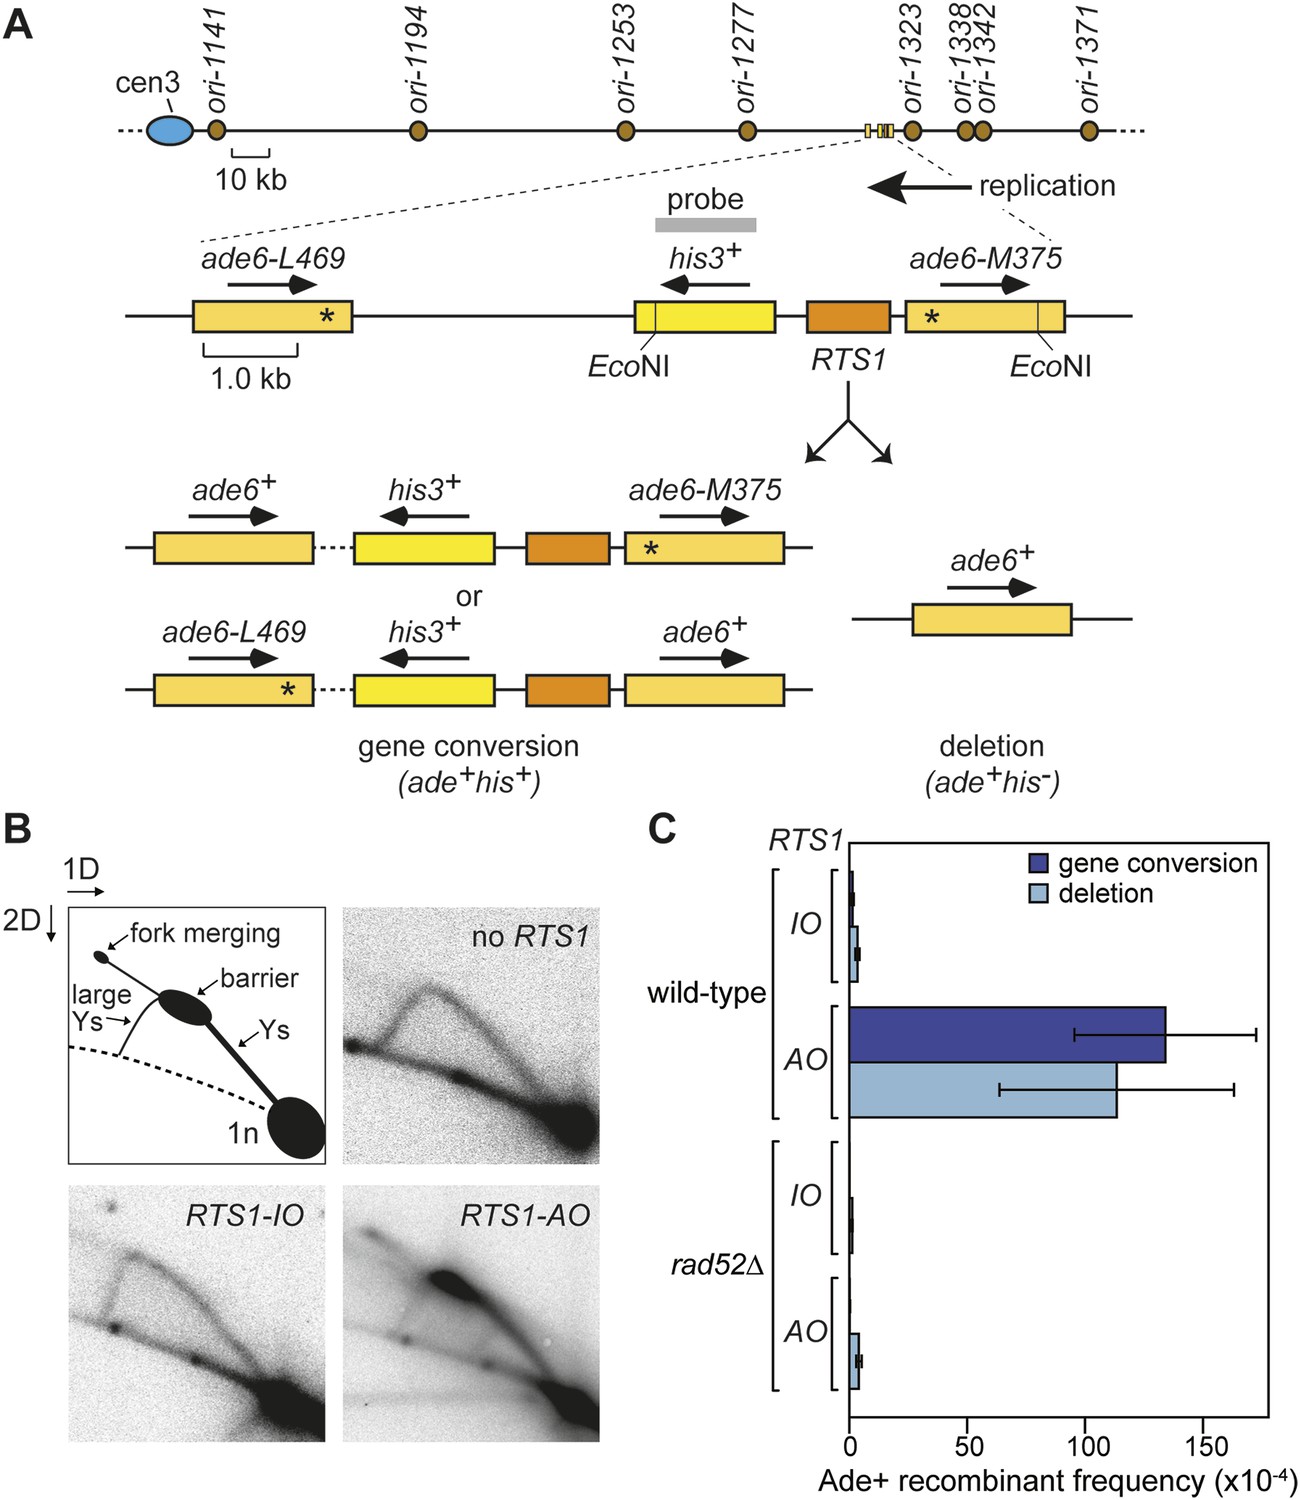
Experimental system for studying RFB-induced RDR.
(A) Schematic showing the location of the direct repeat recombination reporter on chromosome 3, the two types of recombinants, and the position of the probe used for 2D gel analysis in B. Asterisks indicate the position of point mutations in ade6-L469 and ade6-M375. (B) 2D gel analysis of replication intermediates in the EcoNI fragment shown in A. The DNA was extracted from strains MCW429 (no RTS1), MCW4712 (RTS1-IO), and MCW4713 (RTS1-AO). (C) Ade+ recombinant frequencies for strains MCW4712, MCW4713, MCW1687, and MCW1688. Data are represented as mean ± SD.
Figure 1—figure supplement 1
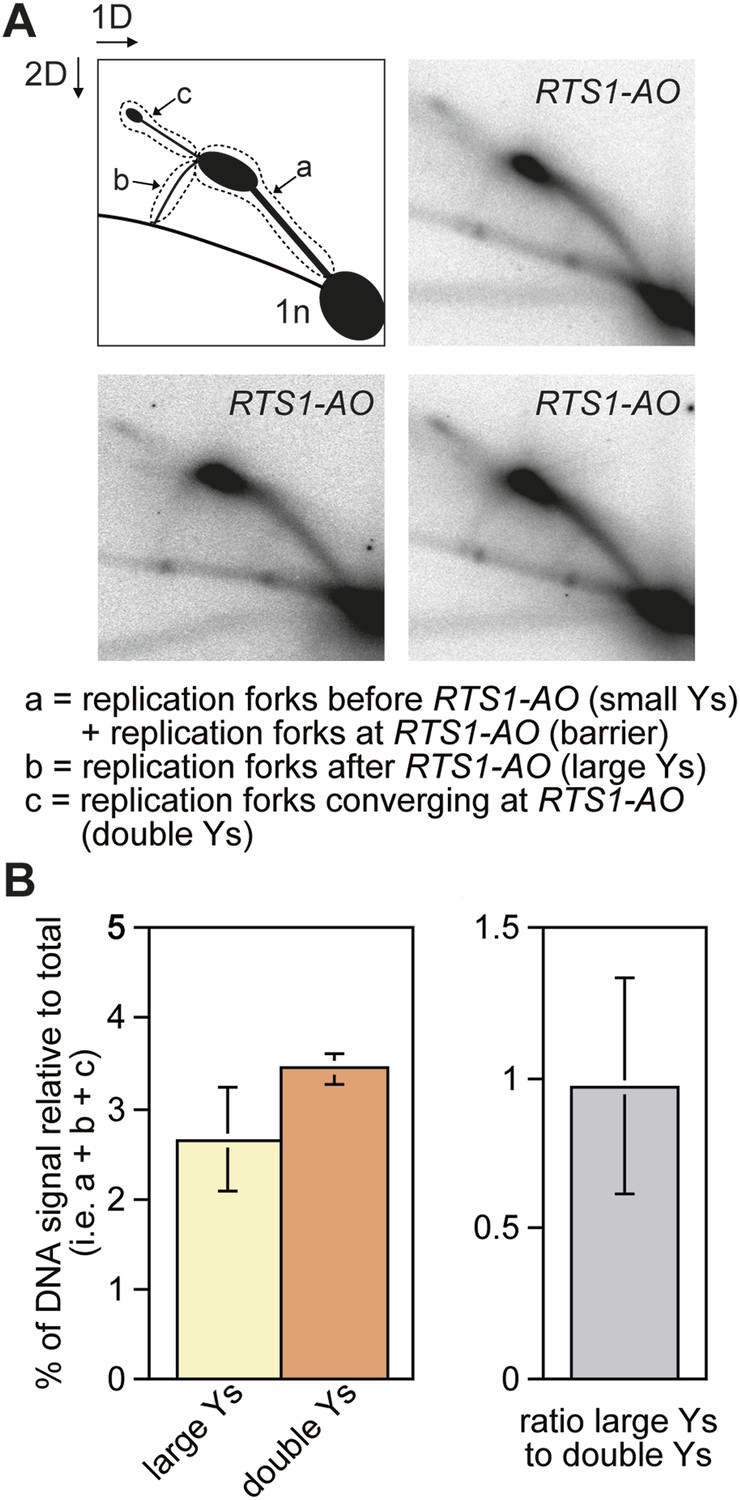
The proportion of restarted forks to converged forks at RTS1-AO.
(A) 2D gel analysis of replication intermediates in the EcoNI fragment shown in Figure 1A. The DNA was extracted from strain MCW4713 (RTS1-AO), and three independent samples are shown (note that the 2D gel in the bottom right panel is reproduced from Lorenz et al., 2009 Figure 2A). The schematic in the top left panel shows the three regions of DNA signal intensity (demarcated by the dotted lines) that were quantified to derive the data in B. A key for the schematic is given below the panels. (B) Quantification of the 2D gels in A and Figure 1B (bottom right panel). Mean values (+/− SD) from the four 2D gels are shown.
Figure 2
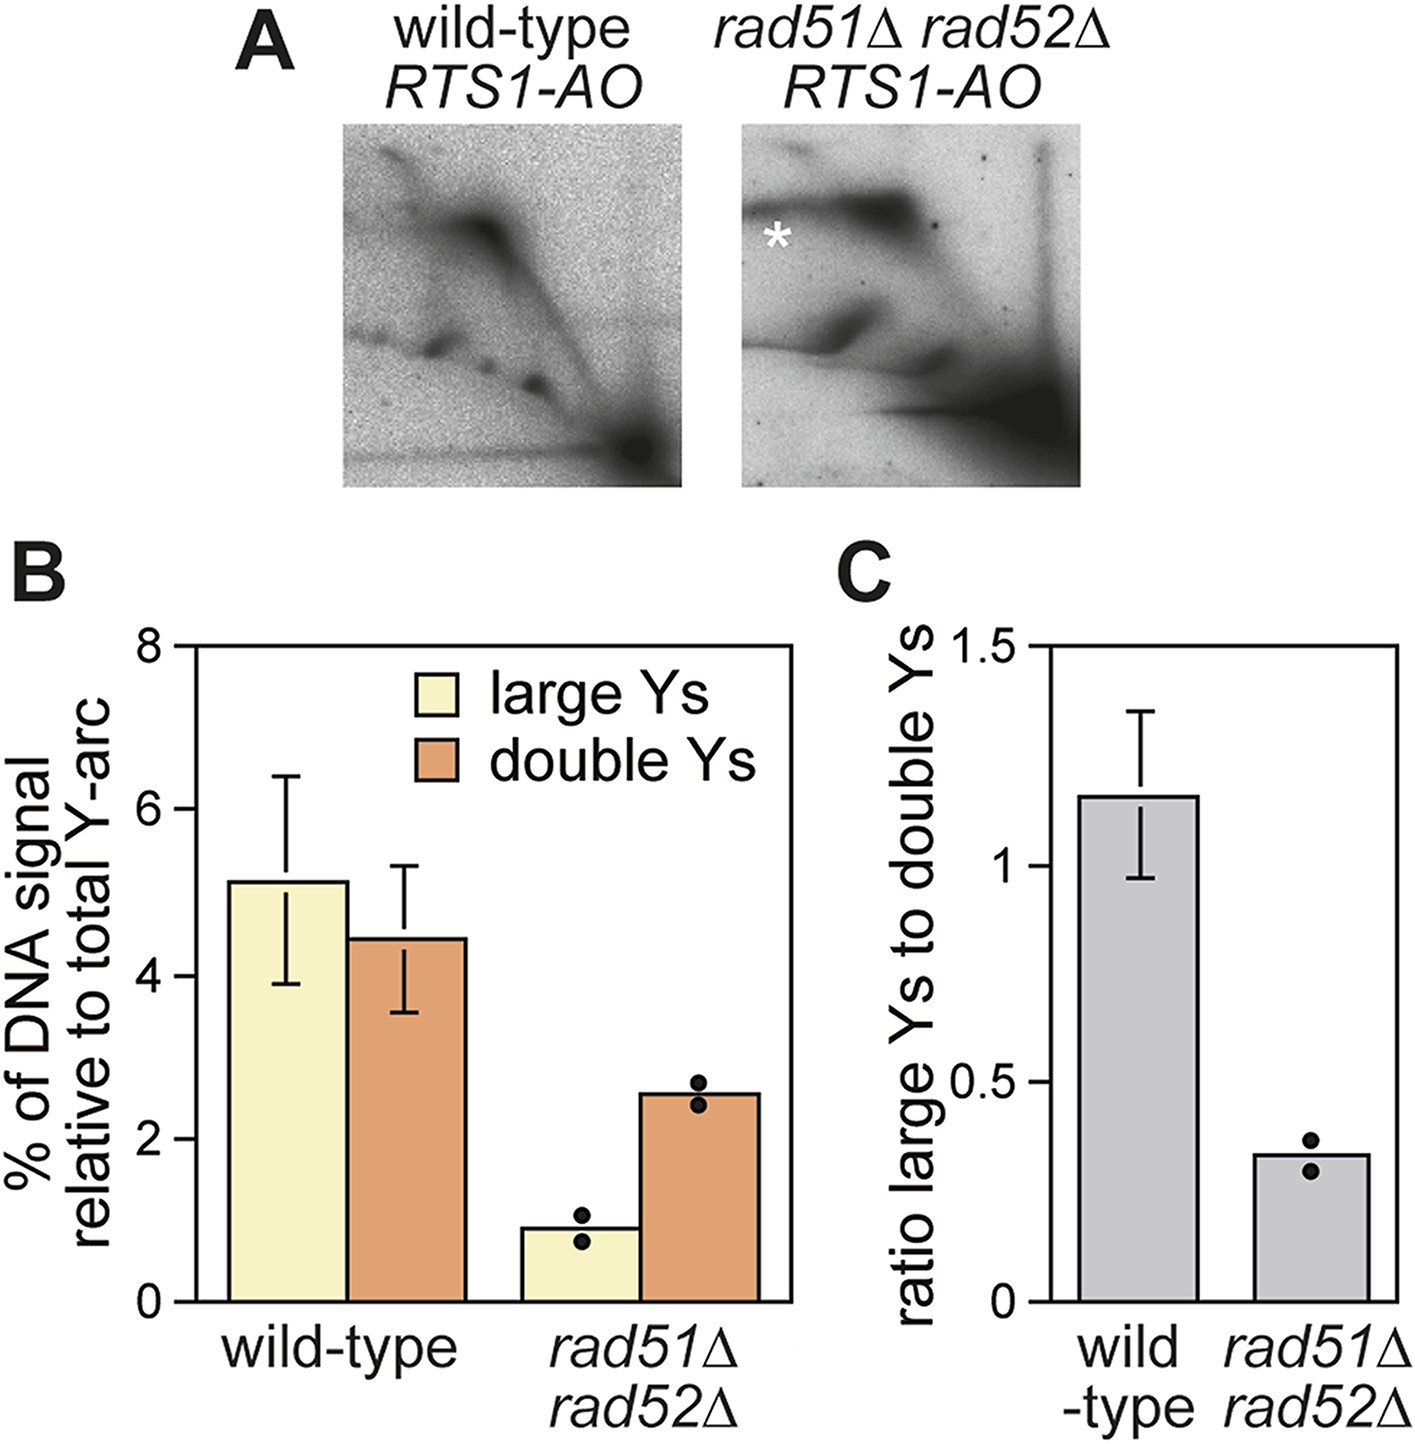
Recombination proteins are needed for replication past RTS1-AO.
(A) 2D gel analysis of replication intermediates in the EcoNI fragment shown in Figure 1A. The DNA was extracted from strains MCW4713 (wild-type RTS1-AO) and MCW1696 (rad51∆ rad52∆ RTS1-AO) using the same method as in Lambert et al. (2010). Note that the signal extending from the RFB signal indicated by the asterisk is an aberration of how the gel ran in the first dimension. (B and C) Quantification of 2D gels. Mean values (± SD) from four independent experiments for wild type are shown. In the case of rad51∆ rad52∆, the values are based on two independent experiments with each value represented by a dot around the mean.
Figure 3 with 3 supplements
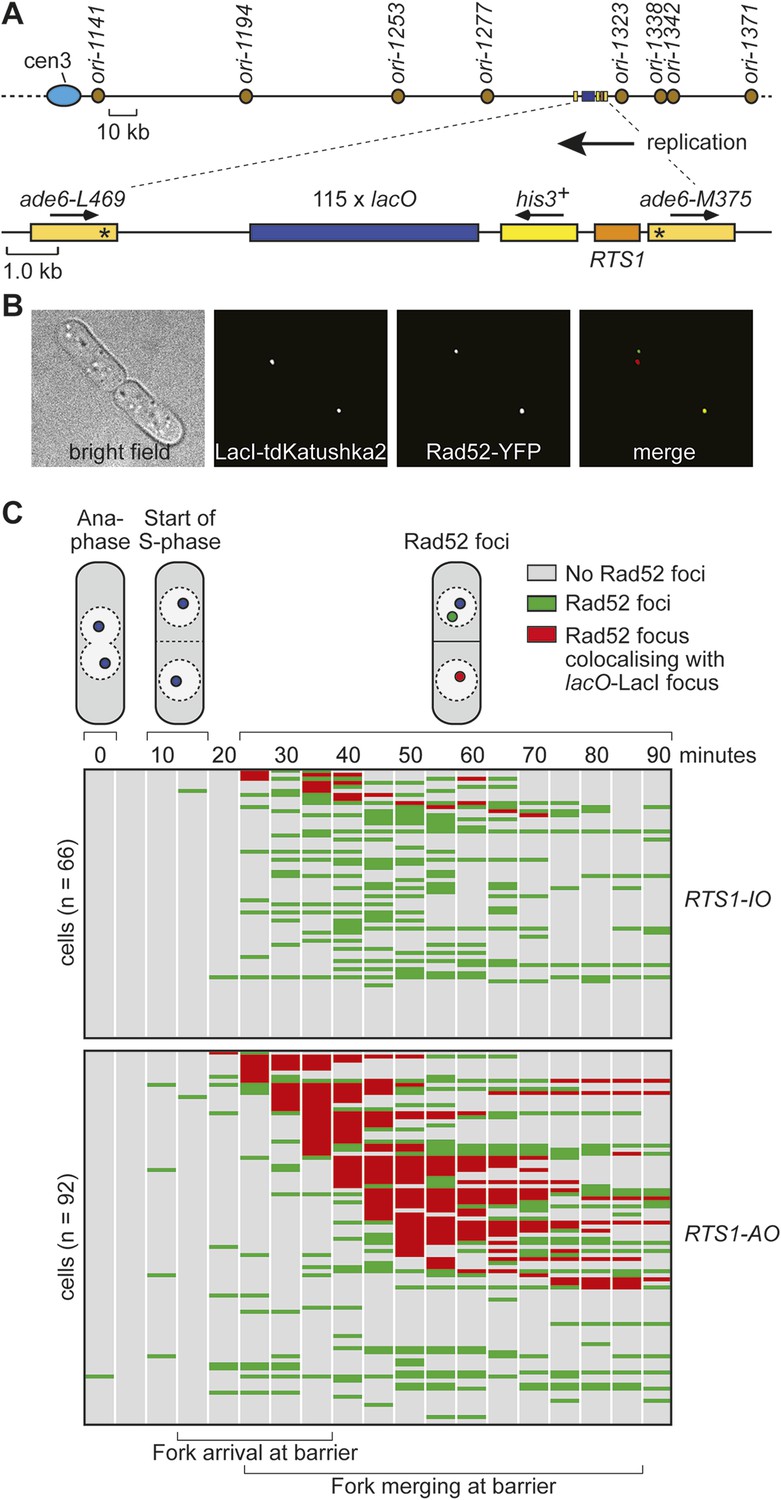
Tracking Rad52-YFP focus localization at RTS1 by time-lapse microscopy.
(A) Schematic showing the modification of the direct repeat recombination reporter for time-lapse microscopy. (B) Representative stills taken from a time-lapse movie of two daughter cells each with a LacI-tdKatushka2 and Rad52-YFP focus. In the right hand daughter, the foci co-localize. (C) Analysis of time-lapse movies. The presence of a Rad52 focus and whether it co-localizes with the lacO-LacI-tdKatushka2 focus is recorded every 5 min for 90 min post-anaphase in each cell. The top panel is a schematic of S. pombe cells at various stages post-anaphase with nuclear lacO-LacI foci in blue, Rad52 foci in green, and co-localizing foci in red. The strains are MCW6395 and MCW6556.
Figure 3—figure supplement 1
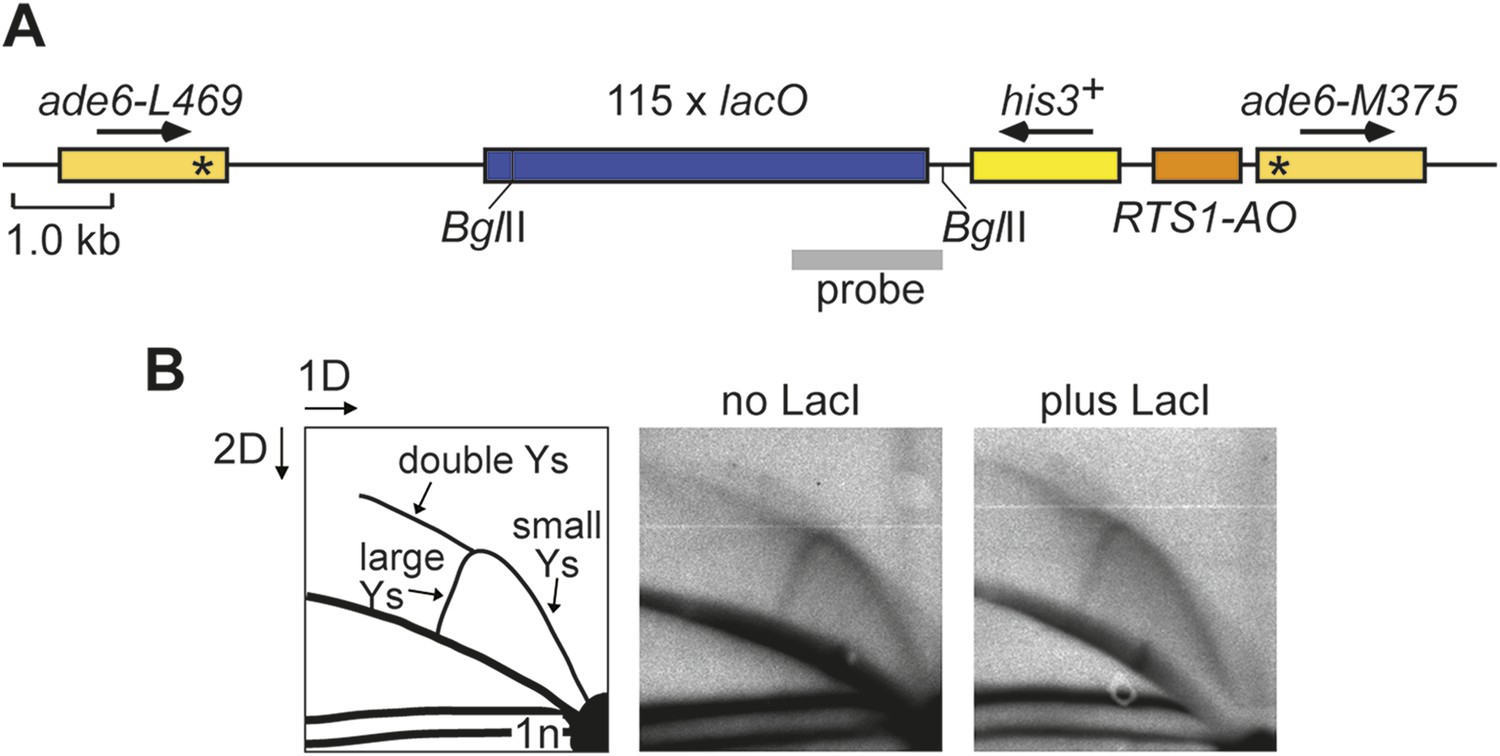
Effect of LacI expression on replication fork progression through the lacO array downstream of RTS1-AO.
(A) Schematic showing the BglII restriction fragment and probe used for 2D gel analysis of replication intermediates within the lacO array. The probe is a SacII-PstI restriction fragment from pMN5. (B) 2D gel analysis of replication intermediates in the BglII fragment shown in A. The DNA was extracted from strains MCW6302 (no LacI) and MCW6536 (plus LacI) grown in EMMG with 1 μM thiamine (i.e., the same as used for live cell imaging) without enrichment for replication intermediates on BND cellulose. The data show an arc of Y-shaped replication intermediates across the lacO array. This signal does not differ appreciably between the two conditions indicating that replication progression across the lacO array is not unduly perturbed by low levels of LacI.
Figure 3—figure supplement 2
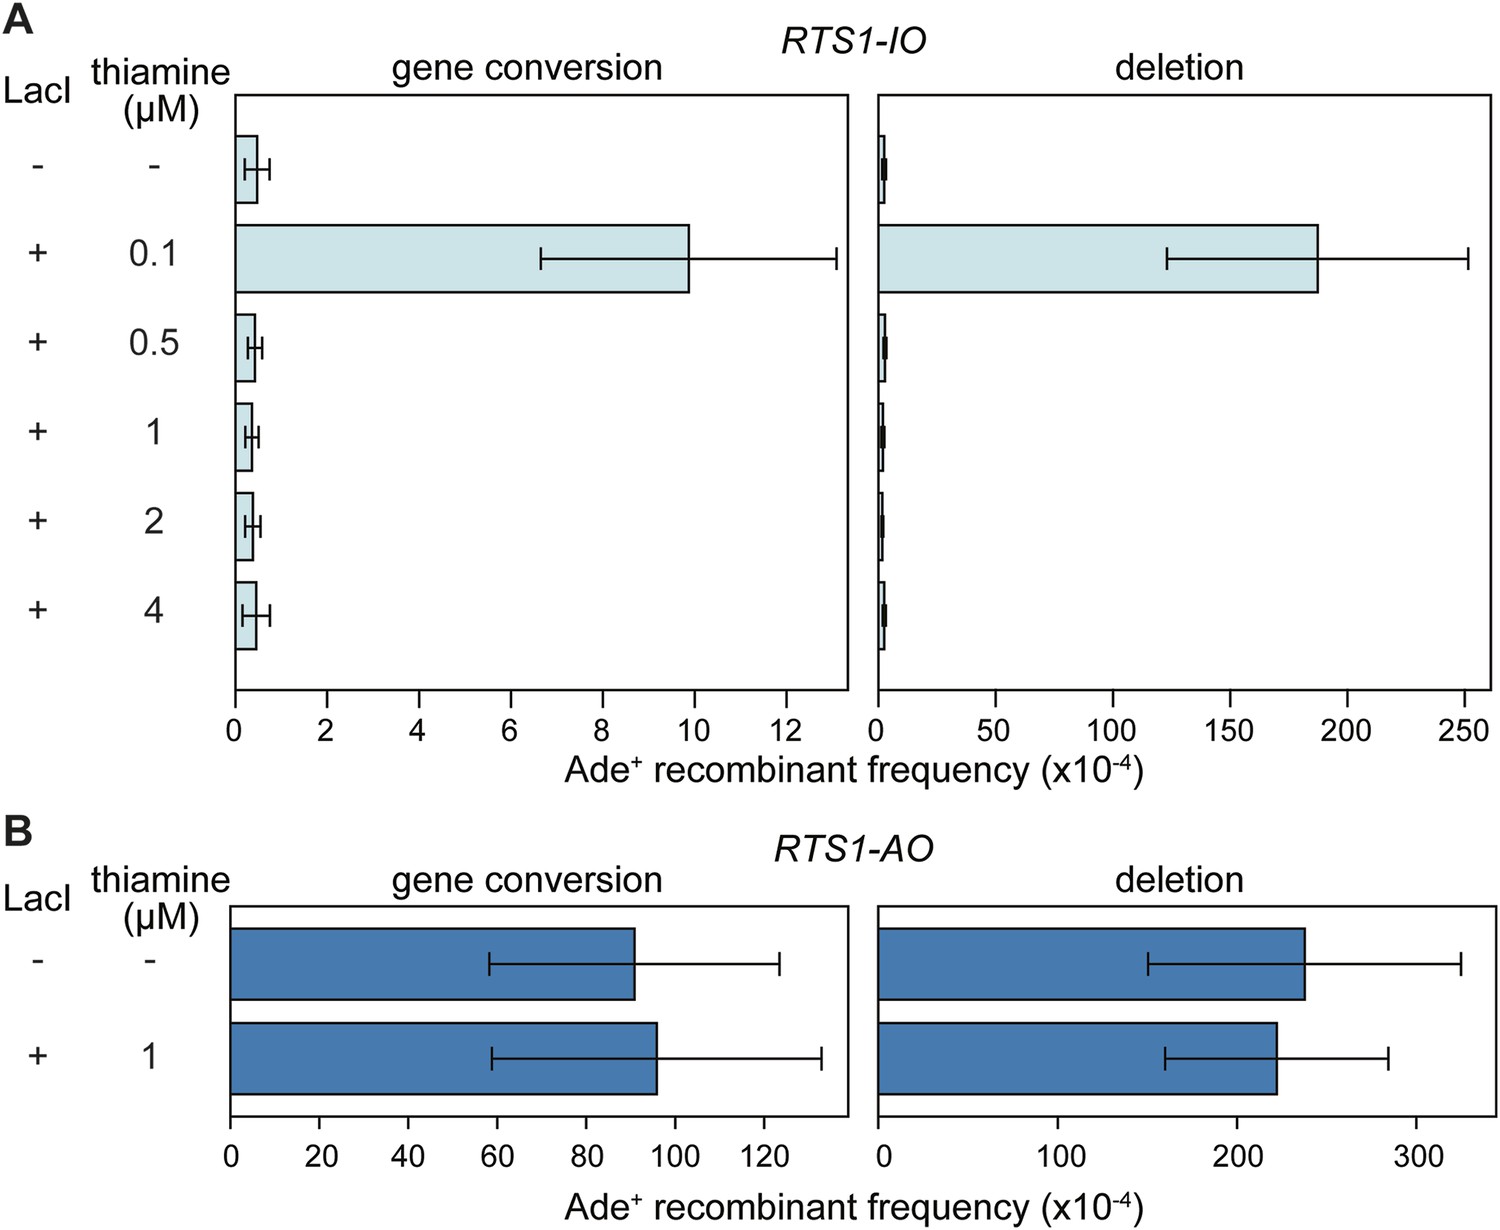
Effect of LacI expression on the frequency of direct-repeat recombination in strains containing a lacO array between the repeats.
(A) Ade+ recombinant frequencies for strains MCW6298 (no LacI) and MCW6351 (plus LacI). (B) Ade+ recombinant frequencies for strains MCW6302 (no LacI) and MCW6536 (plus LacI). Error bars are the standard deviations about the mean. For LacI expression a chimeric gene encoding LacI, with an N-terminal nuclear localization signal (NLS) and C-terminal tdKatushka2 tag, was placed under control of the thiamine repressible nmt41 promoter and integrated at the lys1 locus. The concentration of thiamine in the media is indicated.
Figure 3—figure supplement 3
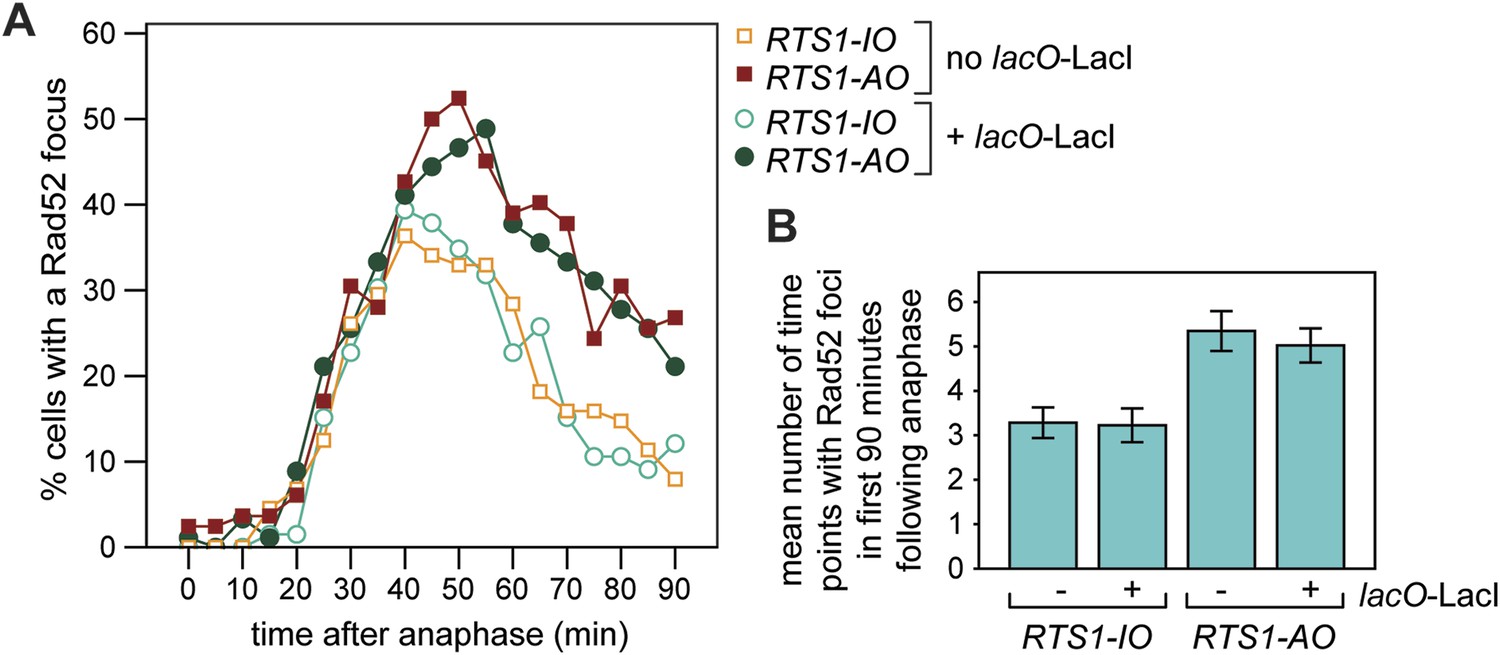
Frequency of Rad52 foci in RTS1-IO and RTS1-AO cells.
(A) Percentage of cells with a Rad52-YFP focus in the first 90 min post-anaphase. The strains without lacO-LacI are MCW7111 (RTS1-IO; n = 88) and MCW7114 (RTS1-AO; n = 83), and those with lacO-LacI are MCW6395 (RTS1-IO; n = 66) and MCW6556 (RTS1-AO; n = 92). (B) Number of time points in which a Rad52 focus is observed in the 90 min post-anaphase. The strains are the same as in A. Data are represented as mean ± SEM.
Figure 4
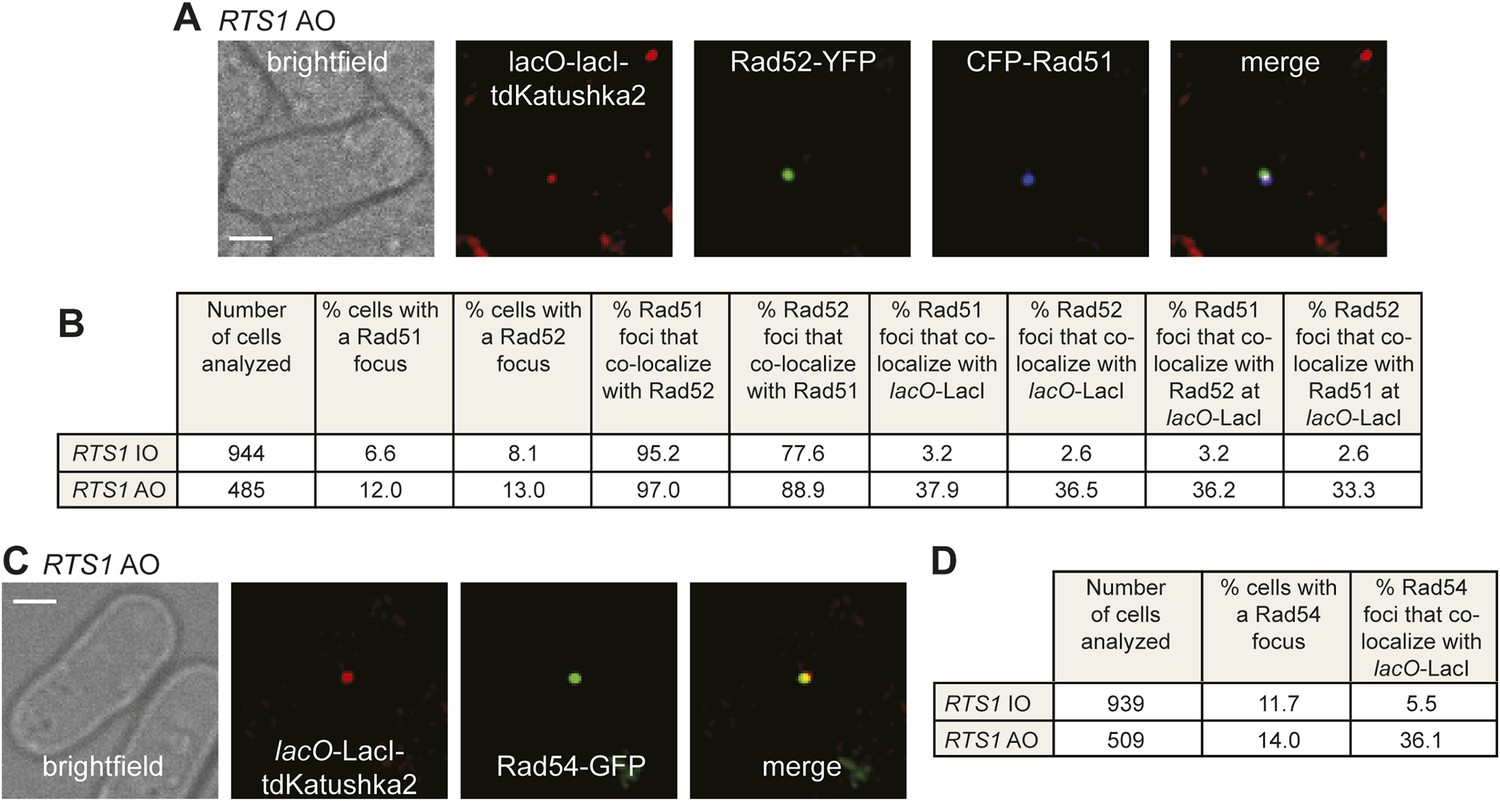
Both CFP-Rad51 and Rad54-GFP foci co-localize with lacO-LacI in RTS1-AO cells to a similar extent as Rad52-YFP foci.
(A) Example snapshots of a RTS1-AO cell with both a CFP-Rad51 and Rad52-YFP focus co-localizing with a lacO-LacI-tdKatushka2 focus. The scale bar represents 2 µm. (B) Quantification of data like in A. The strains are MCW7640 (RTS1-IO) and MCW7638 (RTS1-AO). (C) Example snapshots of a RTS1-AO cell with a Rad54-GFP focus co-localizing with a lacO-LacI-tdKatushka2 focus. The scale bar represents 2 µm. (D) Quantification of data like in C. The strains are MCW7646 (RTS1-IO) and MCW7645 (RTS1-AO).
Figure 5 with 1 supplement

Temporal kinetics of Rad52-YFP foci localization to RTS1.
(A) Percentage of cells with one or more CFP-PCNA foci in the first 90 min post-anaphase. The RTS1-IO strain is MCW6701 (n = 31), and the RTS1-AO strain is MCW6706 (n = 31). (B) Percentage of cells with a Rad52-YFP focus that co-localizes with the lacO-LacI focus in the first 90 min post-anaphase. The data are derived from Figure 3C. (C) Percentage of cells with a Rad52-YFP focus that co-localizes with the lacO-LacI focus in the 90 min following the first appearance of CFP-PCNA foci post-anaphase (i.e., the start of S-phase). The RTS1-IO strain is MCW6712 (n = 34) and the RTS1-AO strain is MCW7065 (n = 52). Note that the overall percentage of cells with a Rad52-YFP focus co-localizing with lacO-LacI is slightly higher than in cells without CFP-PCNA. The CFP tag on PCNA partially impairs its function, which is compensated by expression of untagged PCNA in the same cells (Meister et al., 2007). Nevertheless, we suspect that a subtle impairment of PCNA function accounts for the more frequent co-localization of Rad52-YFP with lacO-LacI. (D) End point of Rad52-YFP focus co-localization with the lacO-LacI focus relative to the disappearance of CFP-PCNA foci. The strain is MCW7065 (n = 49). The asterisk indicates cells with a Rad52-YFP focus co-localizing with the lacO-LacI focus more than 45 min after CFP-PCNA foci disappearance.
Figure 5—figure supplement 1

Representative stills from a time-lapse movie showing the appearance of CFP-PCNA foci during S-phase.
The strain is MCW6706. The scale bar in the top panels represents 1 µm.
Figure 6 with 2 supplements
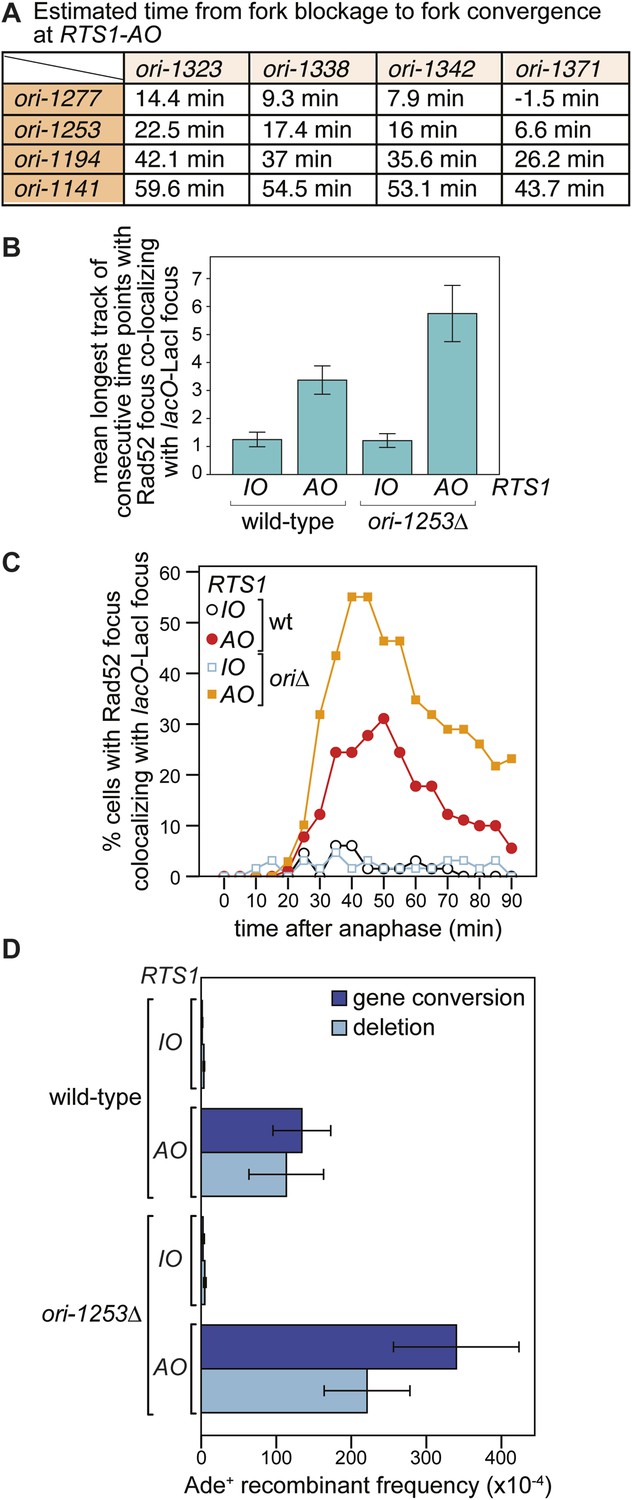
The effect of deleting ori-1253 on recombination at RTS1.
(A) Estimated times from fork blockage at RTS1-AO to fork convergence at RTS1-AO. Times are calculated from the distance between the midpoint of each origin to RTS1 (Siow et al., 2012) and a fork velocity of 3 kb/min, and it is assumed that each origin fires at the same time during S-phase. (B) Effect of deleting ori-1253 on the duration of Rad52-YFP focus co-localization with the lacO-LacI focus. Data are represented as mean ± SEM. (C) Effect of deleting ori-1253 on the percentage of cells with a Rad52-YFP focus co-localizing with the lacO-LacI focus during the 90 min post-anaphase. The data in B and C are derived from Figure 3C and Figure 6—figure supplement 1. (D) ade+ recombinant frequencies for strains MCW4712, MCW4713, MCW6894, and MCW6778. Data are represented as mean ± SD.
Figure 6—figure supplement 1
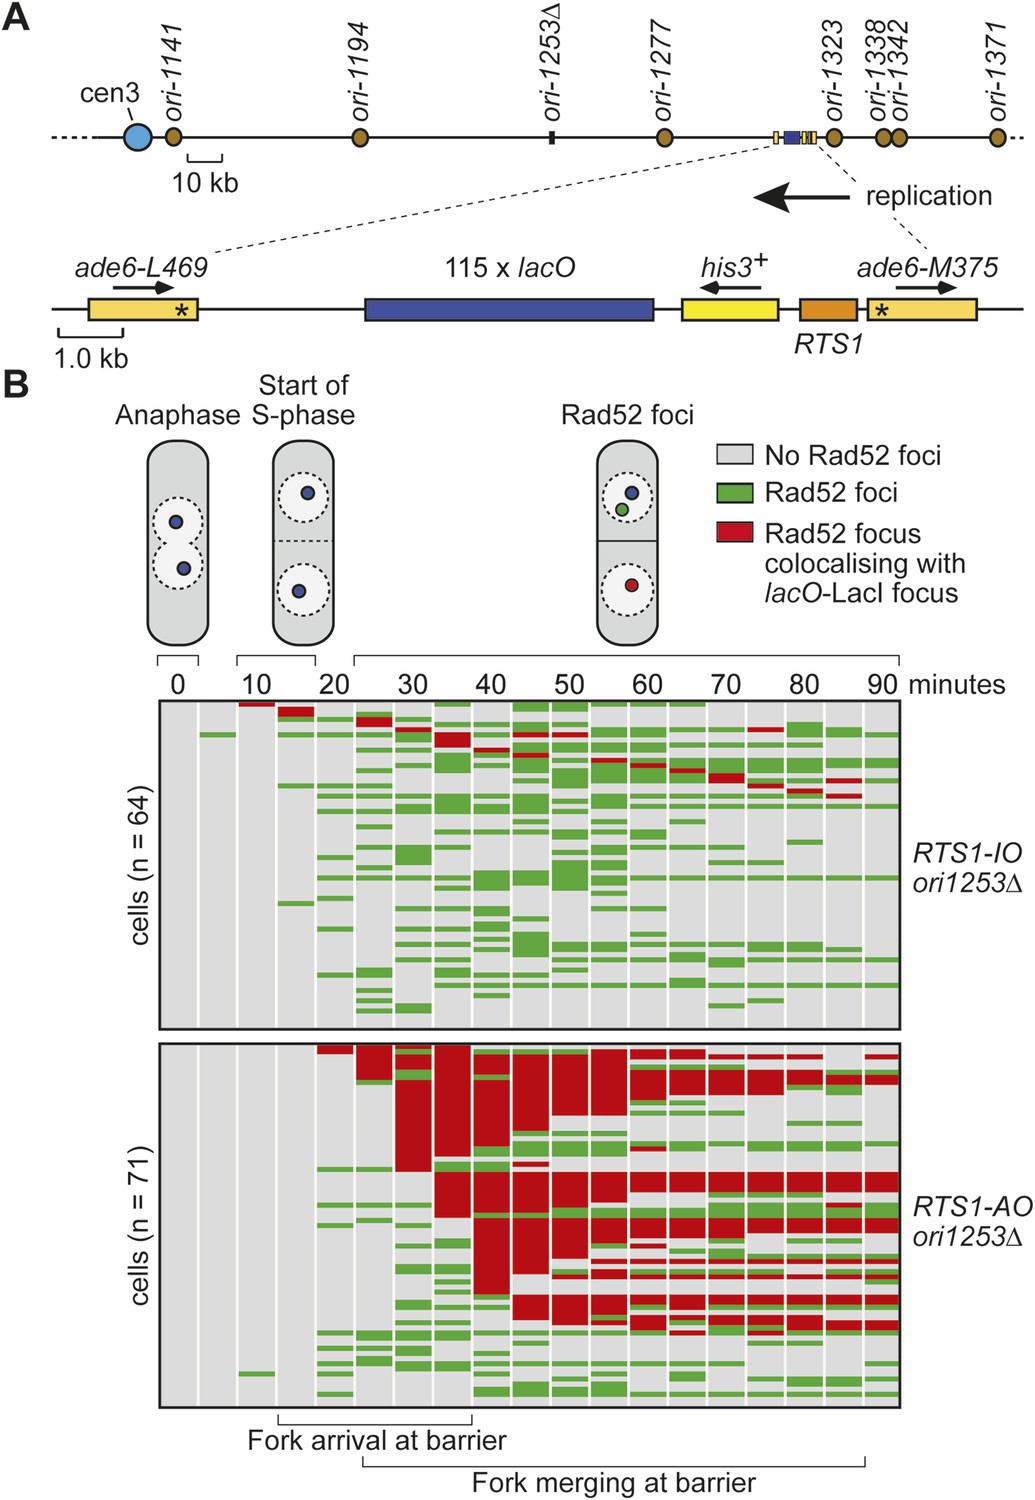
Tracking Rad52-YFP focus localization at RTS1 by time-lapse microscopy in cells in which ori-1253 has been deleted.
(A) Schematic showing the position of the lacO array and RTS1 on chromosome 3 together with the nearby replication origins. (B) Analysis of time-lapse movies. The presence of a Rad52 focus and whether it co-localizes with the lacO-LacI-tdKatushka2 focus is recorded every 5 min for 90 min post-anaphase in each cell. The top panel is a schematic of S. pombe cells at various stages post-anaphase with nuclear lacO-LacI foci in blue, Rad52 foci in green, and co-localizing foci in red. The strains are MCW6902 and MCW6780.
Figure 6—figure supplement 2

The duration of Rad52-YFP focus co-localization with the lacO-LacI focus in cells with RTS1-AO is extended when ori-1253 is deleted.
The data are derived from Figure 3C and Figure 6—figure supplement 1. Where bars extend beyond the scale on the Y axis the % cells is indicated by the number in the bar.
Figure 7
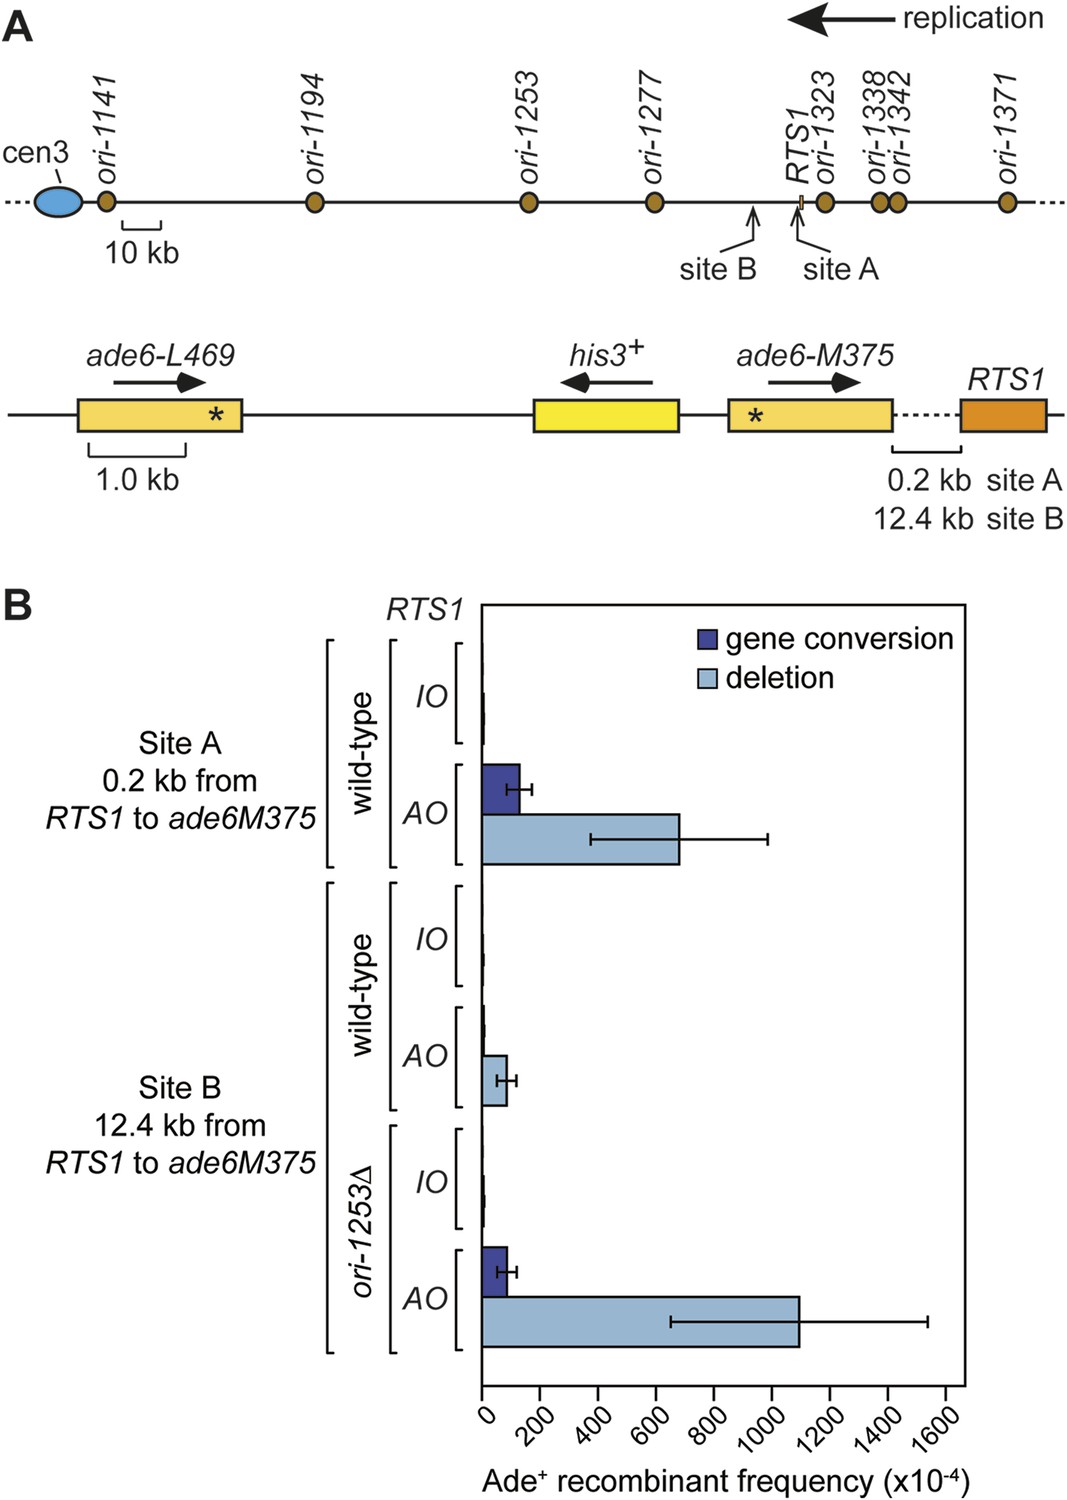
Direct repeat recombination downstream of RTS1.
(A) Schematic showing the two positions on chromosome 3 where the ade6− direct repeat recombination reporter (shown in the bottom panel) is inserted downstream of RTS1. (B) Ade+ recombinant frequencies for strains MCW7131, MCW7133, MCW7257, MCW7259, MCW7293, and MCW7295. Data are represented as mean ± SD.
Figure 8
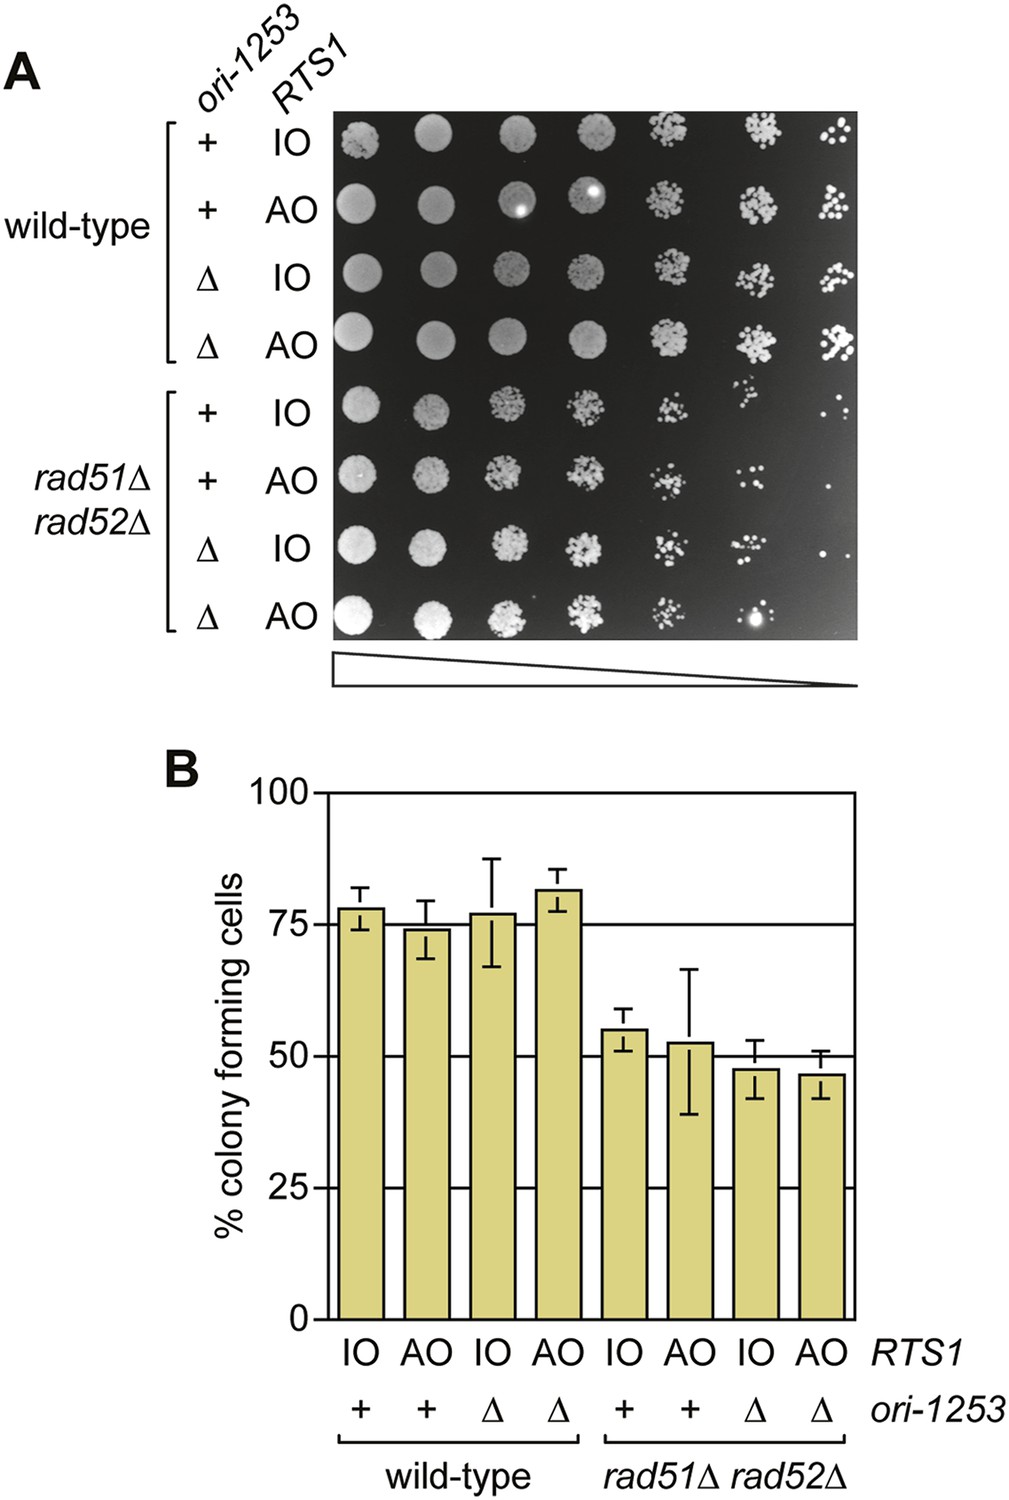
A comparison of the growth and viability of wild-type and rad51∆ rad52∆ mutant strains containing either RTS1-IO or RTS1-AO with and without deletion of ori-1253.
(A) Spot assay and (B) colony forming assay. The strains are MCW7224, MCW7223, MCW7277, MCW7279, MCW7368, MCW7370, MCW7372, and MCW7374. The data in B are mean values ± SD.
Figure 9
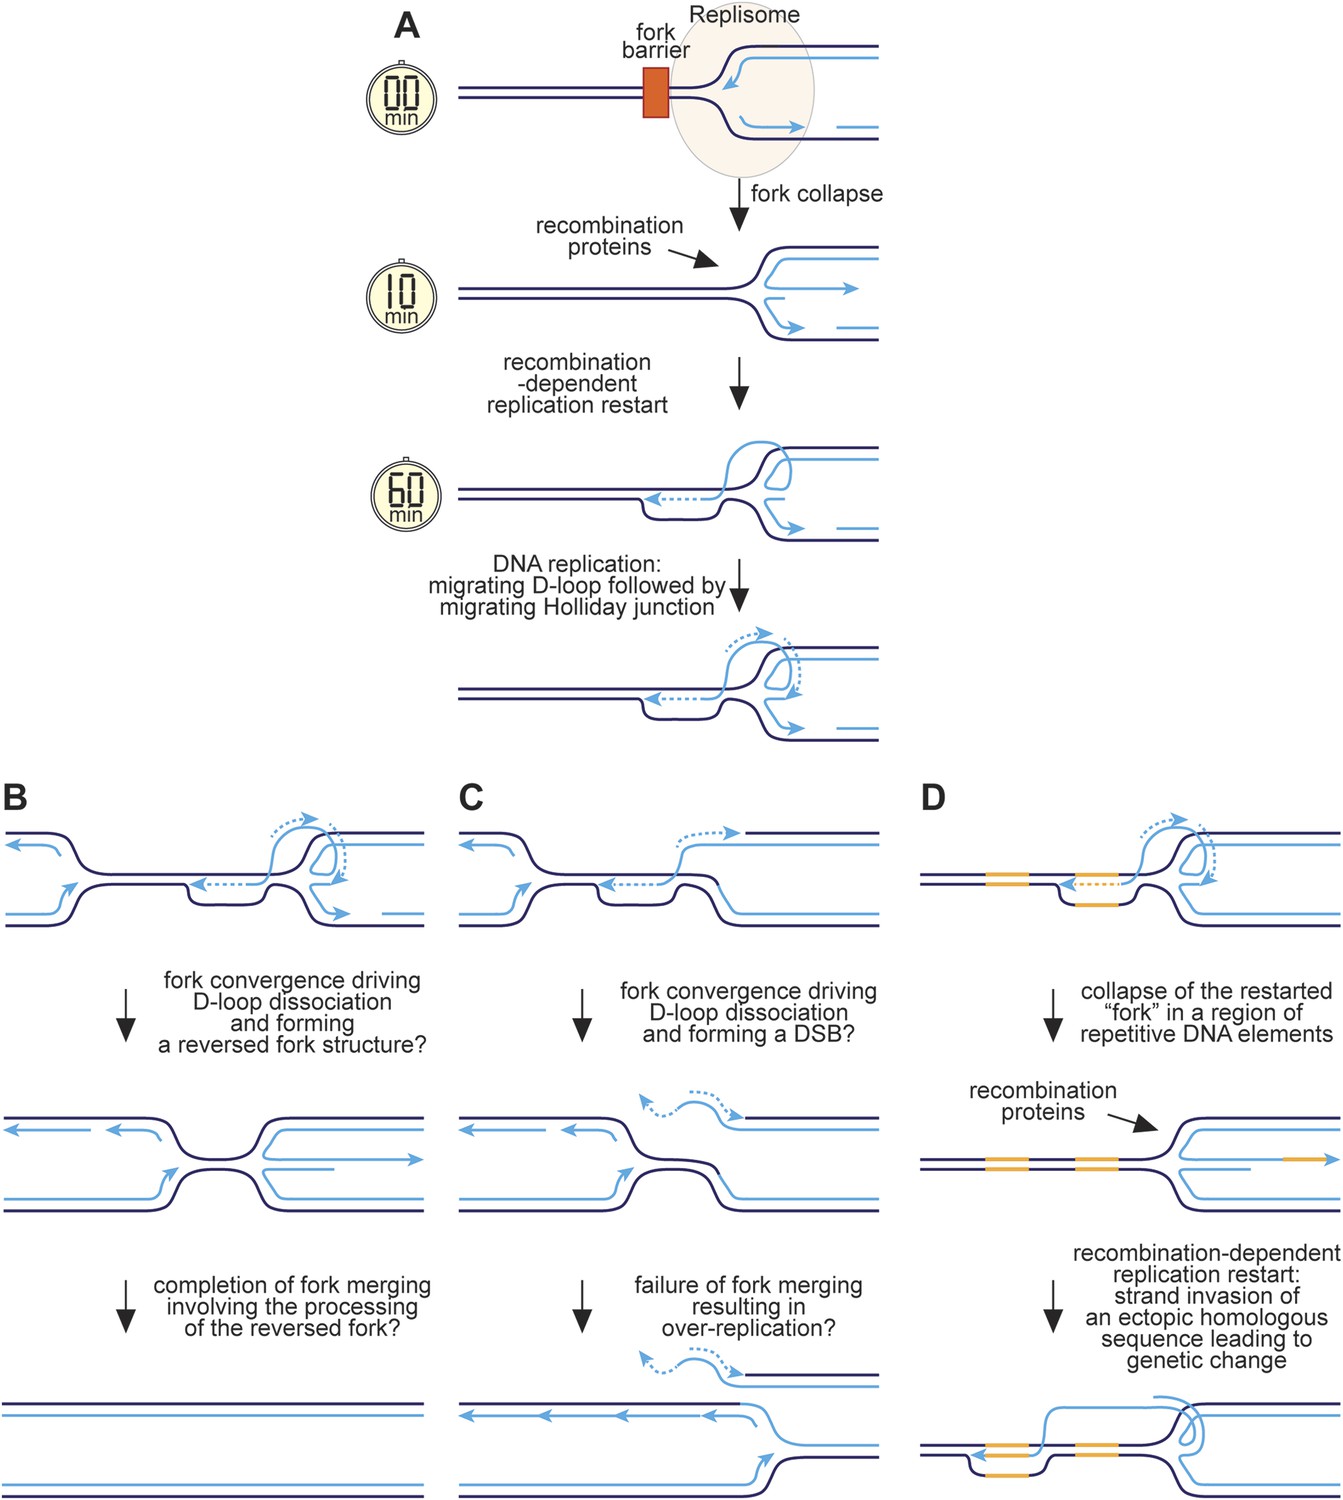
Hypothetical model for RFB-induced RDR.
(A) RDR initiates within 10 minutes of replication fork blockage at RTS1 and gives rise to a restarted fork within 60 min. Parental DNA strands are shown in dark blue and nascent strands in light blue with light blue arrows indicating the direction of DNA synthesis. (B) Model for how a regular and restarted fork might merge. (C) Model for how convergence between a regular fork and a restarted fork could lead to over-replication. (D) Model for how RDR might give rise to genetic change. The two patches of DNA highlighted in yellow represent a direct repeat of homologous sequences. See main text for further details.
Tables
Table 1
Direct repeat recombinant frequencies
| Genotype | RTS1 orientation | Position of direct repeat | Colonies analysed | Ade+ His+ recombinant frequency (× 10−4)* | Ade+ His− recombinant frequency (× 10−4)* | ||
|---|---|---|---|---|---|---|---|
| Mean | p value† | Mean | p value† | ||||
| wild type | IO | Flanking RTS1 | 77 | 1.36 (+/− 0.51) | – | 3.48 (+/− 0.89) | – |
| wild type | AO | Flanking RTS1 | 77 | 134.03 (+/− 38.50) | – | 113.41 (+/− 49.72) | – |
| rad52∆ | IO | Flanking RTS1 | 15 | 0.03 (+/− 0.04) | <0.001‡ | 1.20 (+/− 0.21) | <0.001‡ |
| rad52∆ | AO | Flanking RTS1 | 15 | 0.13 (+/− 0.11) | <0.001§ | 4.07 (+/− 1.16) | <0.001§ |
| ori-1253∆ | IO | Flanking RTS1 | 15 | 2.33 (+/− 1.86) | 0.060‡ | 4.80 (+/− 1.58) | 0.007‡ |
| ori-1253∆ | AO | Flanking RTS1 | 16 | 339.88 (+/− 83.61) | <0.001§ | 221.02 (+/− 57.21) | <0.001§ |
| wild type | IO | Site A | 18 | 1.44 (+/− 0.86) | 0.698‡ | 4.61 (+/− 1.66) | 0.011‡ |
| wild type | AO | Site A | 21 | 128.66 (+/− 43.85) | 0.746§ | 680.48 (+/− 305.44) | <0.001§ |
| wild type | IO | Site B | 18 | 0.88 (+/− 0.51) | 0.023# | 2.45 (+/− 1.88) | 0.001# |
| wild type | AO | Site B | 15 | 5.12 (+/− 2.41) | <0.001¶ | 85.02 (+/− 33.72) | <0.001¶ |
| ori-1253∆ | IO | Site B | 15 | 1.58 (+/− 0.50) | <0.001** | 4.86 (+/− 2.56) | 0.006** |
| ori-1253∆ | AO | Site B | 15 | 86.03 (+/− 33.63) | <0.001†† | 1094.46 (+/− 443.32) | <0.001†† |
-
*
The values in parentheses are the standard deviations about the mean.
-
†
p values are derived from independent-sample t-tests comparing the mean values as indicated.
-
‡
Compared to the equivalent mean recombinant frequency in wild type with RTS1-IO flanked by ade6- direct repeats.
-
§
Compared to the equivalent mean recombinant frequency in wild type with RTS1-AO flanked by ade6- direct repeats.
-
#
Compared to the equivalent mean recombinant frequency in wild type with RTS1-IO and site A ade6- direct repeats.
-
¶
Compared to the equivalent mean recombinant frequency in wild type with RTS1-IO and site A ade6- direct repeats.
-
**
Compared to the equivalent mean recombinant frequency in wild type with RTS1-IO and site B ade6- direct repeats.
-
††
Compared to the equivalent mean recombinant frequency in wild type with RTS1-AO and site B ade6- direct repeats.
Table 2
Distances and estimated replication times from origin to RTS1
| Origin | Distance from barrier (bp) | Time from barrier (min) | |
|---|---|---|---|
| Origin centromere proximal relative to RTS1 | ori-1141 | 186,731 | 62.2 |
| ori-1194 | 134,208 | 44.7 | |
| ori-1253 | 75,154 | 25.1 | |
| ori-1277 | 51,031 | 17.0 | |
| Origin centromere distal relative to RTS1 | ori-1323 | 7735 | 2.6 |
| ori-1338 | 23,098 | 7.7 | |
| ori-1342 | 27,172 | 9.1 | |
| ori-1371 | 55,444 | 18.5 |
-
Distances are calculated from the midpoint of the origin coordinates as stated in OriDB (pombe.oridb.org). Times are based on a replication fork velocity of 3.0 kb/min.
Table 3
List of S. pombe strains used in this study
| Strain | Mating type | Genotype | Source |
|---|---|---|---|
| MCW429 | h+ | ade6-M375 int::pUC8/his3+/ade6-L469 ura4-D18 his3-D1 leu1-32 arg3-D4 | Lab strain |
| MCW1687 | h+ | rad52∆::ura4+ ade6-M375 int::pUC8/his3+/RTS1-IO/ade6-L469 ura4-D18 his3-D1 leu1-32 arg3-D4 | Lab strain |
| MCW1688 | h+ | rad52∆::ura4+ ade6-M375 int::pUC8/his3+/RTS1-AO/ade6-L469 ura4-D18 his3-D1 leu1-32 arg3-D4 | Lab strain |
| MCW1696 | h+ | rad51∆::arg3+ rad52∆::ura4+ ade6-M375 int::pUC8/his3+/RTS1-AO/ade6-L469 ura4-D18 his3-D1 leu1-32 arg3-D4 | Lab strain |
| MCW4712 | h+ | ade6-M375 int::pUC8/his3+/RTS1-IO/ade6-L469 ura4-D18 his3-D1 leu1-32 arg3-D4 | Lab strain |
| MCW4713 | h+ | ade6-M375 int::pUC8/his3+/RTS1-AO/ade6-L469 ura4-D18 his3-D1 leu1-32 arg3-D4 | Lab strain |
| MCW6298 | h+ | ade6-M375 int::pUC8/lacO115/his3+/RTS1-IO/ade6-L469 ura4-D18 his3-D1 leu1-32 arg3-D4 | This study |
| MCW6302 | h+ | ade6-M375 int::pUC8/lacO115/his3+/RTS1-AO/ade6-L469 ura4-D18 his3-D1 leu1-32 arg3-D4 | This study |
| MCW6351 | h+ | ade6-M375 int::pUC8/lacO115/his3+/RTS1-IO/ade6-L469 lys1-::Pnmt41-NLS-lacI-tdKatushka2-hphMX4 ura4-D18 his3-D1 leu1-32 arg3-D4 | This study |
| MCW6395 | h+ | ade6-M375 int::pUC8/lacO115/his3+/RTS1-IO/ade6-L469 lys1-::Pnmt41-NLS-lacI-tdKatushka2-hphMX4 rad52+::YFP-kanMX6 ura4-D18 his3-D1 leu1-32 arg3-D4 | This study* |
| MCW6536 | h+ | ade6-M375 int::pUC8/lacO115/his3+/RTS1-AO/ade6-L469 lys1-::Pnmt41-NLS-lacI-tdKatushka2-hphMX4 ura4-D18 his3-D1 leu1-32 arg3-D4 | This study |
| MCW6556 | h+ | ade6-M375 int::pUC8/lacO115/his3+/RTS1-AO/ade6-L469 lys1-::Pnmt41-NLS-lacI-tdKatushka2-hphMX4 rad52+::YFP-kanMX6 ura4-D18 his3-D1 leu1-32 arg3-D4 | This study* |
| MCW6701 | h+ | ade6-M375 int::pUC8/lacO115/his3+/RTS1-IO/ade6-L469 lys1-::Pnmt41-NLS-lacI-tdKatushka2-hphMX4 ura4-::pECFP-PCNA+ his3-D1 leu1-32 arg3-D4 | This study† |
| MCW6706 | h+ | ade6-M375 int::pUC8/lacO115/his3+/RTS1-AO/ade6-L469 lys1-::Pnmt41-NLS-lacI-tdKatushka2-hphMX4 ura4-::pECFP-PCNA+ his3-D1 leu1-32 arg3-D4 | This study† |
| MCW6712 | h+ | ade6-M375 int::pUC8/lacO115/his3+/RTS1-IO/ade6-L469 lys1-::Pnmt41-NLS-lacI-tdKatushka2-hphMX4 rad52+::YFP-kanMX6 ura4-::pECFP-PCNA+ his3-D1 leu1-32 arg3-D4 | This study*,† |
| MCW6778 | h+ | oriIII-1253∆::natMX4 ade6-M375 int::pUC8/his3+/RTS1-AO/ade6-L469 ura4-D18 his3-D1 leu1-32 arg3-D4 | This study |
| MCW6780 | h+ | oriIII-1253∆::natMX4 ade6-M375 int::pUC8/lacO115/his3+/RTS1-AO/ade6-L469 lys1-::Pnmt41-NLS-lacI-tdKatushka2-hphMX4 rad52+::YFP-kanMX6 ura4-D18 his3-D1 leu1-32 arg3-D4 | This study* |
| MCW6894 | h+ | oriIII-1253∆::natMX4 ade6-M375 int::pUC8/his3+/RTS1-IO/ade6-L469 ura4-D18 his3-D1 leu1-32 arg3-D4 | This study |
| MCW6902 | h- | oriIII-1253∆::natMX4 ade6-M375 int::pUC8/lacO115/his3+/RTS1-IO/ade6-L469 lys1-::Pnmt41-NLS-lacI-tdKatushka2-hphMX4 rad52+::YFP-kanMX6 ura4-D18 his3-D1 leu1-32 arg3-D4 | This study* |
| MCW7065 | h+ | ade6-M375 int::pUC8/lacO115/his3+/RTS1-AO/ade6-L469 lys1-::Pnmt41-NLS-lacI-tdKatushka2-hphMX4 rad52+::YFP-kanMX6 ura4-::pECFP-PCNA+ his3-D1 leu1-32 arg3-D4 | This study*,† |
| MCW7111 | h+ | ade6-M375 int::pUC8/his3+/RTS1-IO/ade6-L469 rad52+::YFP-kanMX6 ura4-D18 his3-D1 leu1-32 arg3-D4 | This study* |
| MCW7114 | h+ | ade6-M375 int::pUC8/his3+/RTS1-AO/ade6-L469 rad52+::YFP-kanMX6 ura4-D18 his3-D1 leu1-32 arg3-D4 | This study* |
| MCW7131 | h+ | ade6-M375 int::pUC8/his3+/ade6-L469/RTS1-IO/ hphMX4 ura4-D18 his3-D1 leu1-32 arg3-D4 | This study |
| MCW7133 | h+ | ade6-M375 int::pUC8/his3+/ade6-L469/RTS1-AO/ hphMX4 ura4-D18 his3-D1 leu1-32 arg3-D4 | This study |
| MCW7257 | h+ | ade6∆::RTS1-IO-hphMX4 (12.4 kb from ade6)int::ade6-M375/pUC8/his3+/ade6-L469/kanMX6 ura4-D18 his3-D1 leu1-32 arg3-D4 | This study |
| MCW7259 | h+ | ade6∆::RTS1-AO-hphMX4 (12.4 kb from ade6)int::ade6-M375/pUC8/his3+/ade6-L469/kanMX6 ura4-D18 his3-D1 leu1-32 arg3-D4 | This study |
| MCW7293 | h+ | oriIII-1253∆::natMX4 ade6∆::RTS1-IO-hphMX4 (12.4 kb from ade6)int::ade6-M375/pUC8/his3+/ade6-L469/kanMX6 ura4-D18 his3-D1 leu1-32 arg3-D4 | This study |
| MCW7295 | h+ | oriIII-1253∆::natMX4 ade6∆::RTS1-AO-hphMX4 (12.4 kb from ade6)int::ade6-M375/pUC8/his3+/ade6-L469/kanMX6 ura4-D18 his3-D1 leu1-32 arg3-D4 | This study |
| MCW7223 | h- | ade6∆::RTS1-AO-hphMX4 ura4-D18 his3-D1 leu1-32 arg3-D4 | This study |
| MCW7224 | h- | ade6∆::RTS1-IO-hphMX4 ura4-D18 his3-D1 leu1-32 arg3-D4 | This study |
| MCW7277 | h- | oriIII-1253∆::natMX4 ade6∆::RTS1-IO-hphMX4 ura4-D18 his3-D1 leu1-32 arg3-D4 | This study |
| MCW7279 | h- | oriIII-1253∆::natMX4 ade6∆::RTS1-AO-hphMX4 ura4-D18 his3-D1 leu1-32 arg3-D4 | This study |
| MCW7368 | h- smt0 | rad51∆::arg3+ rad52∆::ura4+ ade6∆::RTS1-AO-hphMX4 ura4-D18 his3-D1 leu1-32 arg3-D4 | This study |
| MCW7370 | h- smt0 | rad51∆::arg3+ rad52∆::ura4+ ade6∆::RTS1-IO-hphMX4 ura4-D18 his3-D1 leu1-32 arg3-D4 | This study |
| MCW7372 | h- smt0 | rad51∆::arg3+ rad52∆::ura4+ oriIII-1253∆::natMX4 ade6∆::RTS1-IO-hphMX4 ura4-D18 his3-D1 leu1-32 arg3-D4 | This study |
| MCW7374 | h- smt0 | rad51∆::arg3+ rad52∆::ura4+ oriIII-1253∆::natMX4 ade6∆::RTS1-AO-hphMX4 ura4-D18 his3-D1 leu1-32 arg3-D4 | This study |
| MCW7638 | h+ | ade6-M375 int::pUC8/lacO115/his3+/RTS1-AO/ade6-L469 lys1-::Pnmt41-NLS-lacI-tdKatushka2-hphMX4 rad52+::YFP-kanMX6 rad51+::ECFP-rad51+-arg3+ ura4-::rad51+ his3-D1 leu1-32 arg3-D4 | This study* |
| MCW7640 | h+ | ade6-M375 int::pUC8/lacO115/his3+/RTS1-IO/ade6-L469 lys1-::Pnmt41-NLS-lacI-tdKatushka2-hphMX4 rad52+::YFP-kanMX6 rad51+::ECFP-rad51+-arg3+ ura4-::rad51+ his3-D1 leu1-32 arg3-D4 | This study* |
| MCW7645 | h+ | ade6-M375 int::pUC8/lacO115/his3+/RTS1-AO/ade6-L469 lys1-::Pnmt41-NLS-lacI-tdKatushka2-hphMX4 rad54+::GFP-kanMX6 ura4-D18 his3-D1 leu1-32 arg3-D4 | This study‡ |
| MCW7646 | h+ | ade6-M375 int::pUC8/lacO115/his3+/RTS1-IO/ade6-L469 lys1-::Pnmt41-NLS-lacI-tdKatushka2-hphMX4 rad54+::GFP-kanMX6 ura4-D18 his3-D1 leu1-32 arg3-D4 | This study‡ |
-
*
rad52+::YFP-KanMX6 was derived from SP220 (Meister et al., 2003).
-
†
ura4-::pECFP-PCNA+ was derived from SP154 (Meister et al., 2005).
-
‡
rad54+::GFP-kanMX6 was derived from TNF3945 (Maki et al., 2011).
Table 4
List of oligonucleotides used in this study
| Oligonucleotide | Sequence (5′–3′) |
|---|---|
| oMW627 | TAATATAAAAAACTCTTTTCAATTCCAGAATAGTGATAA TTTCGTGCTTAACAAGTTATAATGGTGTATCTCGAGTTGG |
| oMW628 | CAAACTCATCCCATAGAATTTGCAAAATAATAAATAAAA ATGAAACGATACTAAAATAATATTCGAGCTCGTTTAAACTG |
| oMW1257 | TTATAGGCCTGACCAGTGCTGTTCTCTTG |
| oMW1258 | TTATAGGCCTGCAAGTGGATCCTTAGGCTTC |
| oMW1563 | TATAAAGCTTGAAATTCTAGATTGTAAAATG |
| oMW1564 | TATAGTCGACTTTCAACTGCTTCACAGCAC |
| oMW1565 | TTAGAGCTCCAATATAATATGCTATAAAGC |
| oMW1566 | TATACTAGTCATCTTTTAATAATTGAAGAC |
| oMW1577 | ATAAAGCTTTAACCATCAGGTTATTCTC |
| oMW1578 | TTTGGATCCGAGGAAATCACAAGCATTTCC |
| oMW1579 | TTTGAGCTCTTGTTCAGAGCTAGGATTCG |
| oMW1580 | ATAGAATTCACGACGAAAACGCGGACATTC |
| oMW1617 | TATCAGCTGTACTTATTTACGTACTGTG |
| oMW1618 | AATGTCGACAAATCAAAACGACTAGCAGTC |
| oMW1619 | TATGAGCTCGAGTAGATAGAATTTTGTGC |
| oMW1620 | AATACTAGTGCGCTGTAACTTACCTAC |
| oMW1625 | TATAAAGCTTGGTGGTGAGGTAAACG |
| oMW1626 | TATAGTCGACTGTAGTGAGTTAGTGCGCAG |
| oMW1627 | TTAGAGCTCCGAATAATGTGCTGCGACG |
| oMW1628 | TTAATAACTAGTCTTAATATTGC |
Download links
A two-part list of links to download the article, or parts of the article, in various formats.
Downloads (link to download the article as PDF)
Open citations (links to open the citations from this article in various online reference manager services)
Cite this article (links to download the citations from this article in formats compatible with various reference manager tools)
Recombination occurs within minutes of replication blockage by RTS1 producing restarted forks that are prone to collapse
eLife 4:e04539.
https://doi.org/10.7554/eLife.04539


