Dendritic Na+ spikes enable cortical input to drive action potential output from hippocampal CA2 pyramidal neurons
- Howard Hughes Medical Institute, Columbia University, United States
- Kavli Institute for Brain Science, Columbia University, United States
Figures
Figure 1 with 1 supplement
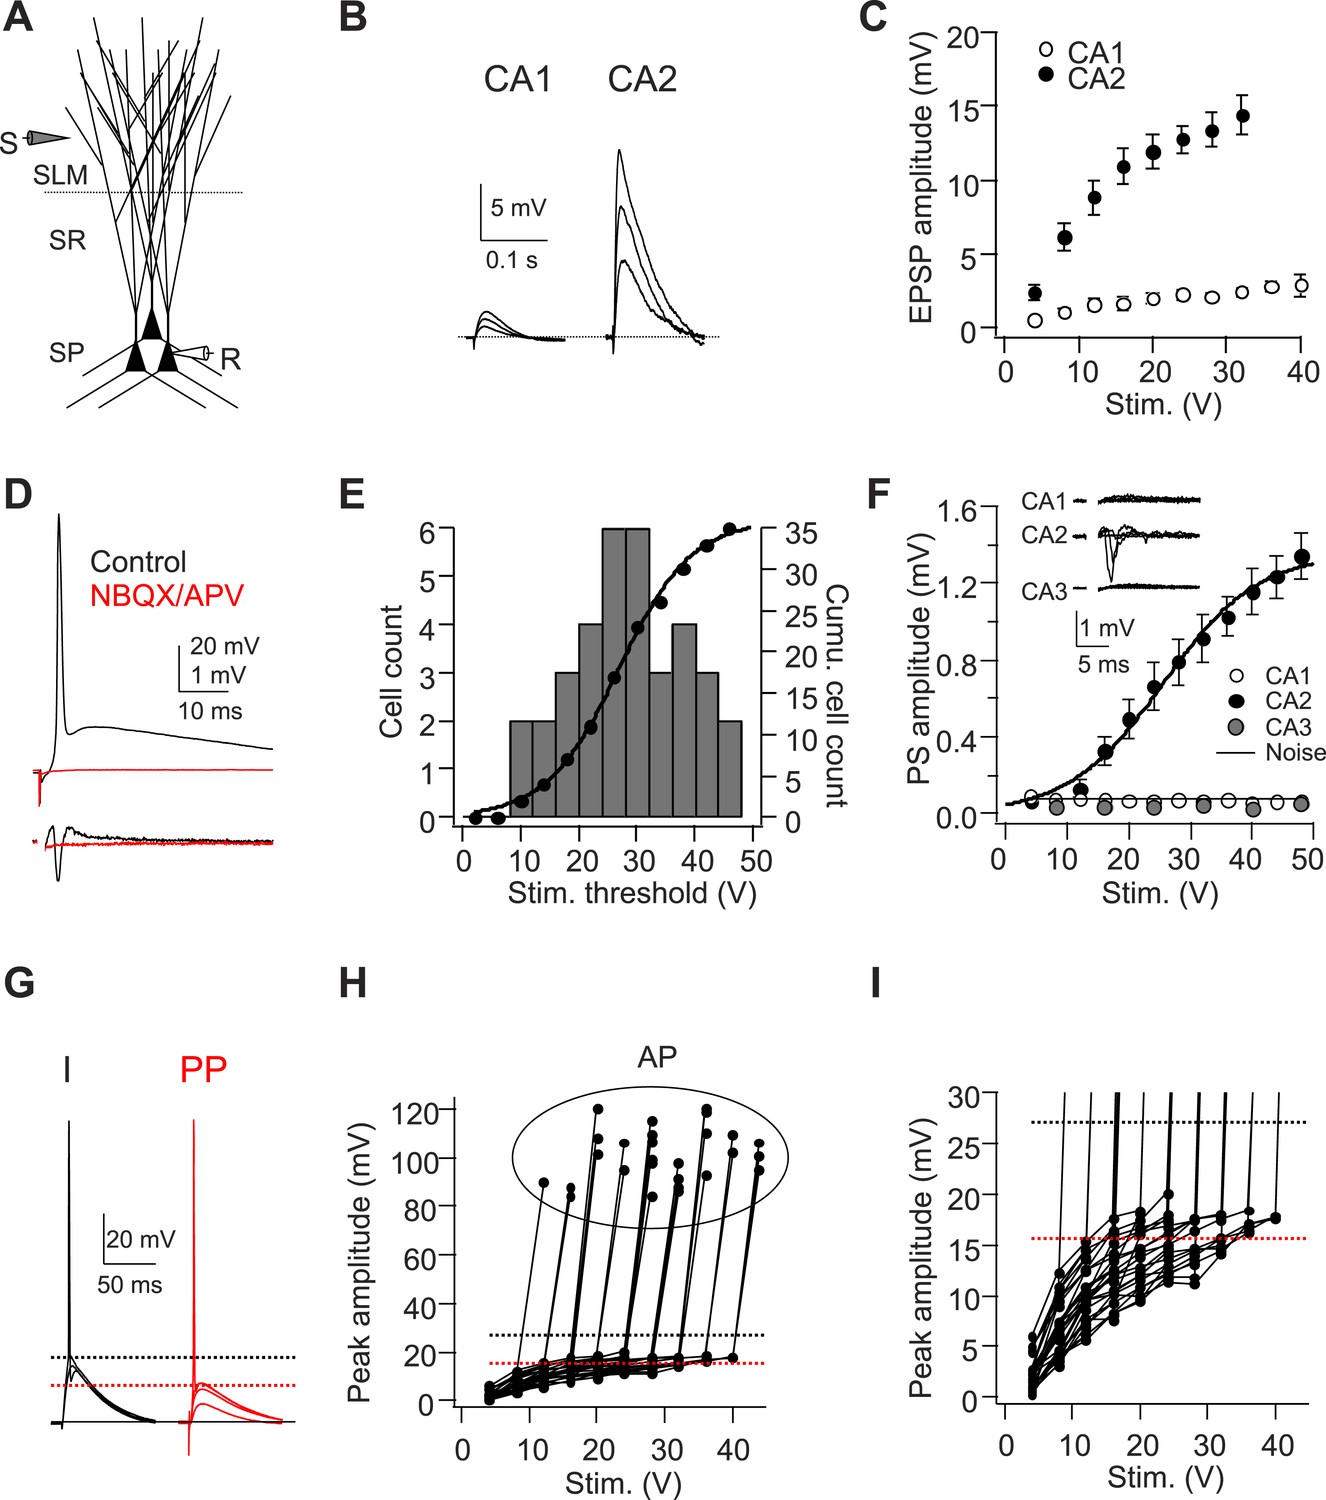
A single stimulus delivered to the perforant path (PP) evokes APs in CA2 PNs.
(A) Diagram illustrating the configuration for the experiment. SLM: stratum lacunosum-moleculare, SR: stratum radiatum, SP: stratum pyramidale. S: stimulating electrode, R: recording electrode. (B) Sample traces of EPSPs evoked by PP stimuli using an electrode placed in SLM of CA1. (C) Mean input–output curves of somatic EPSPs in CA1 (n = 5) and CA2 (n = 6-12) PNs. (D) Simultaneous whole-cell recording from a CA2 PN (top) and extracellular field potential recording from the CA2 cell body layer (bottom) in the absence (black traces) or the presence (red traces) of 20-μM NBQX and 50-μM D-APV. Top: somatic AP evoked by a single PP stimulus. Bottom: extracellular population spike (PS) in CA2 cell body layer. (E) Histogram (bars) and cumulative plot (circles) of PP stimulus threshold required to evoke APs in different CA2 PNs (n = 42 cells). (F) Mean input–output curves of PS in CA1 (n = 5), CA2 (n = 12), and CA3b (n = 6) cell body layers evoked by single PP stimuli. Inset: sample traces of PS in response to a single PP stimulus recorded in CA1, CA2, and CA3b cell body layers. The noise level was measured using a section of baseline that did not exhibit a PS. (G) Sample traces of sub-threshold and AP waveforms in response to somatic current injection (I) and PP stimulation (PP). The dashed lines indicate mean minimal somatic depolarization required to fire APs in response to somatic current injection (black) and PP stimulation (red), respectively. (H) The pooled data from CA2 PNs which fire APs in response to PP stimulation (n = 27). Peak somatic voltage amplitude plotted against stimulating intensity. (I) Expanded view of sub-threshold EPSP response in (H). Note, the dashed lines in (H) and (I) indicate mean minimal somatic depolarization required to fire APs in response to somatic current injection (black, 27.2 ± 1.2 mV, n = 5) and PP stimulation (red, 15.6 ± 0.6 mV, n = 27), respectively.
Figure 1—figure supplement 1
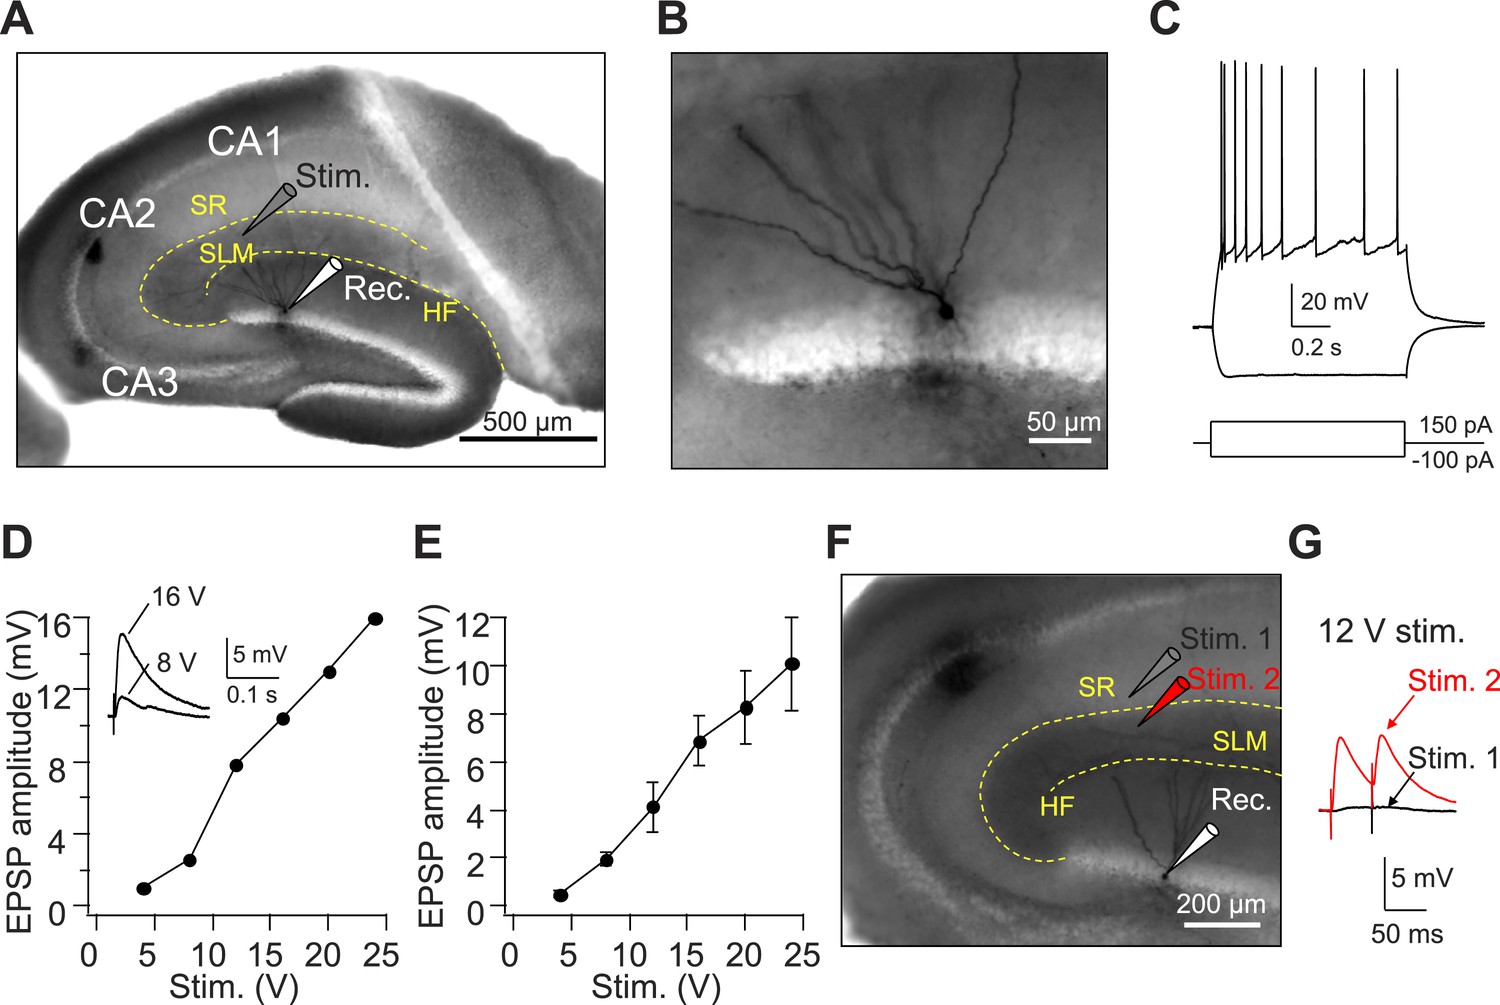
Axons from EC layer II project to CA1 SLM.
(A) The configuration of the experiment shown in (A–E). (B) Expanded view of the recorded GC filled with Biocytin shown in (A). (C) The firing pattern of the GC shown in (A and B) in response to current injections. (D) Input–output relation of EPSPs from an individual GC (same cell as in A–C). Inset: sample traces of EPSPs. (E) Mean input–output relation (n = 6). (F) The configuration of the experiment shown in (G). (G) Sample EPSPs recorded in the GC shown in (F). Note, there is no EPSP response once the stimulating electrode moved slightly to CA1 SR (Stim. 1). SR: stratum radiatum, SLM: stratum lacunosum moleculare, HF: hippocampal fissure.
Figure 2 with 1 supplement

Voltage threshold of APs evoked by PP stimulation in CA2, but not CA1, PNs is lower than threshold of APs evoked by somatic current injection.
(A) Sample traces of somatic voltage responses in response to somatic current injection (I) and a single PP stimulus (PP) from a CA2 PN. Inset shows the dV/dt of the AP waveforms. Arrow indicates the dendrite spike with PP stimulation. (B) Phase-plane plots of dV/dt vs instantaneous voltage from data shown in (A). Note, the arrow indicates a dendrite spike preceding a full-blown AP. (C) Pooled data of AP threshold induced by somatic current injections (I) vs PP stimulation (PP) (n = 17). Filled circle: constant current injection. Open circle: EPSC-like current injection. AP threshold defined as the somatic voltage at which dV/dt exceeds 10 V/s (left) or 50 V/s (right). ***p < 0.001. (D) Sample traces of somatic voltage responses in response to somatic current injection (I) and high-frequency (50 Hz, 5 pulses) burst PP stimulation (PP) from a CA1 PN. Inset shows the dV/dt of AP waveforms. (E) Phase-plane plots of dV/dt vs instantaneous voltage from data shown in (D). Note, the phase plot from somatic current injection (I) is identical with that from PP stimulation (PP). (F) Pooled data of AP threshold induced by somatic current injections (I) vs PP stimulation (PP) (n = 16). Filled circle: constant current injection. Open circle: EPSC-like current injection. AP threshold defined as the somatic voltage at which dV/dt exceeds 10 V/s (left) or 50 V/s (right). n.s., not significant.
Figure 2—figure supplement 1
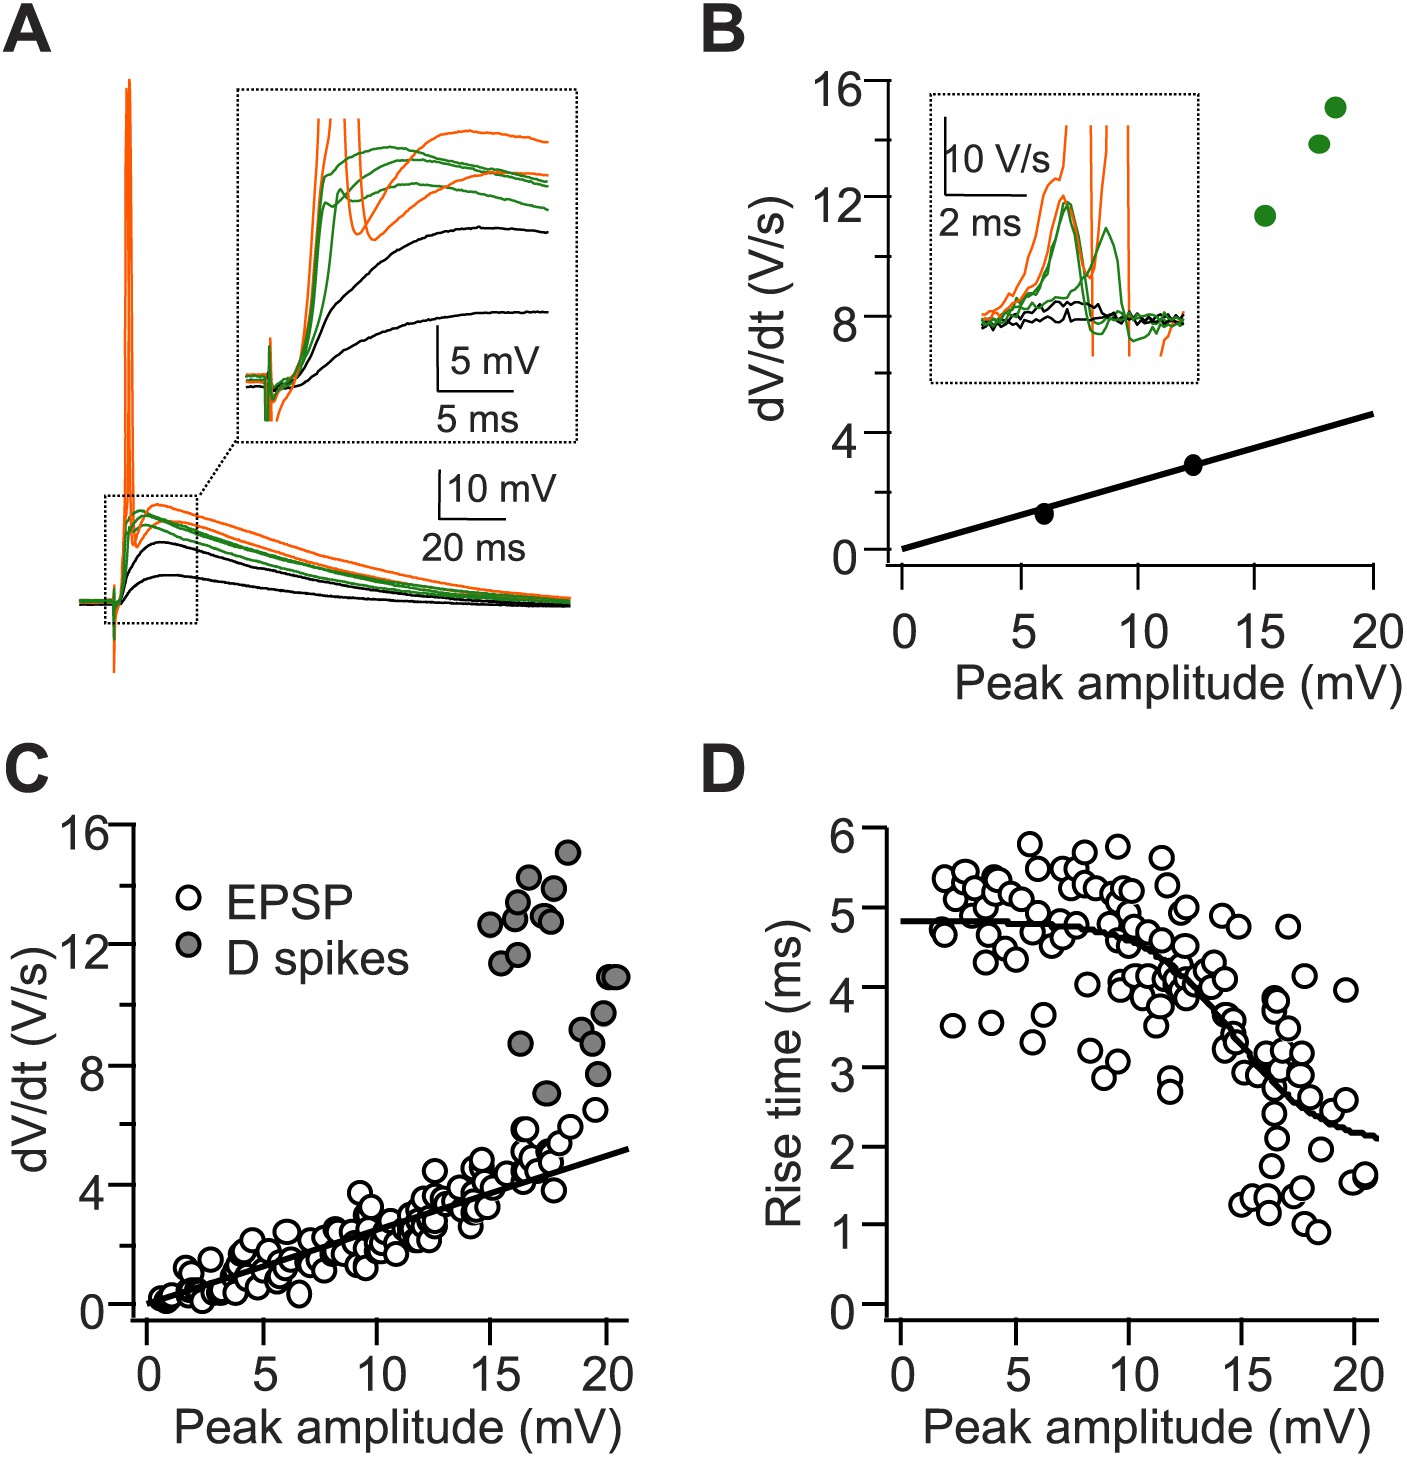
A single stimulus to the PP triggers dendritic spikes (D spikes) in CA2 PNs.
(A) Sample traces of sub-threshold EPSPs (black), D spikes (green), and APs (orange) in a CA2 PN in response to PP stimuli of increasing strength. Inset: the expanded view from the dashed square. (B) dV/dt plotted against peak EPSP amplitude (APs are not shown). Traces and data points color-coded as in (A). Inset: dV/dt of corresponding traces from (A). APs are truncated. (C and D) Pooled data showing dV/dt (C) and the 20–80% EPSP rise time (D) plotted against peak EPSP amplitude (n = 9 cells).
Figure 3
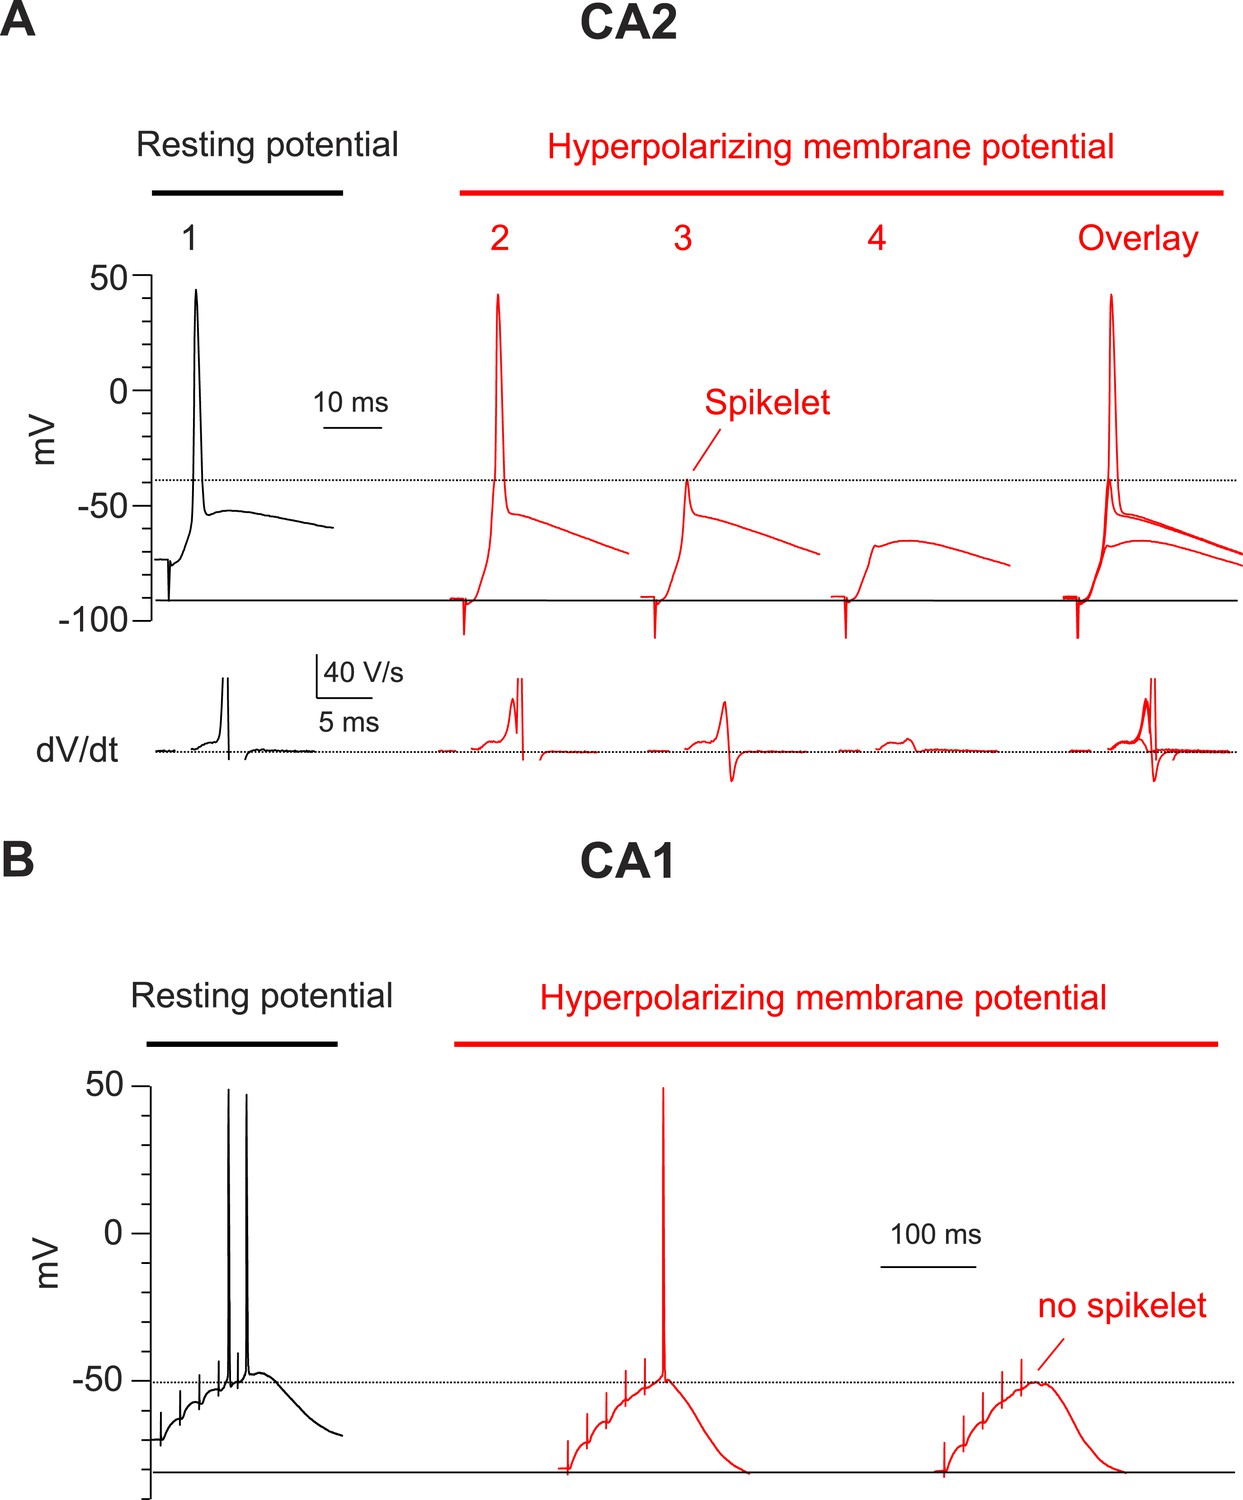
Hyperpolarization of membrane potential reveals prominent spikelets at the soma of CA2, but not CA1, PNs in response to PP stimulation.
(A) Top: a PP stimulus in a CA2 PN reliably elicited a somatic AP at the normal resting potential (trace 1). Hyperpolarization of the resting membrane (traces 2–4) reveals that a PP stimulus with constant strength induced spikelets that variably succeeded (trace 2) or failed (trace 3) in triggering a somatic AP from the hyperpolarized potential. Trace 4 shows a very weak spikelet response to the PP stimulus. Bottom: dV/dt for corresponding voltage responses on top. dV/dt of APs is truncated. Right: overlay of traces 2–4. (B) High-frequency burst PP stimulation (50 Hz, 5 pulses) in a CA1 PN triggers somatic APs at the resting potential (left). Hyperpolarization of the resting membrane fails to reveal spikelets (right).
Figure 4
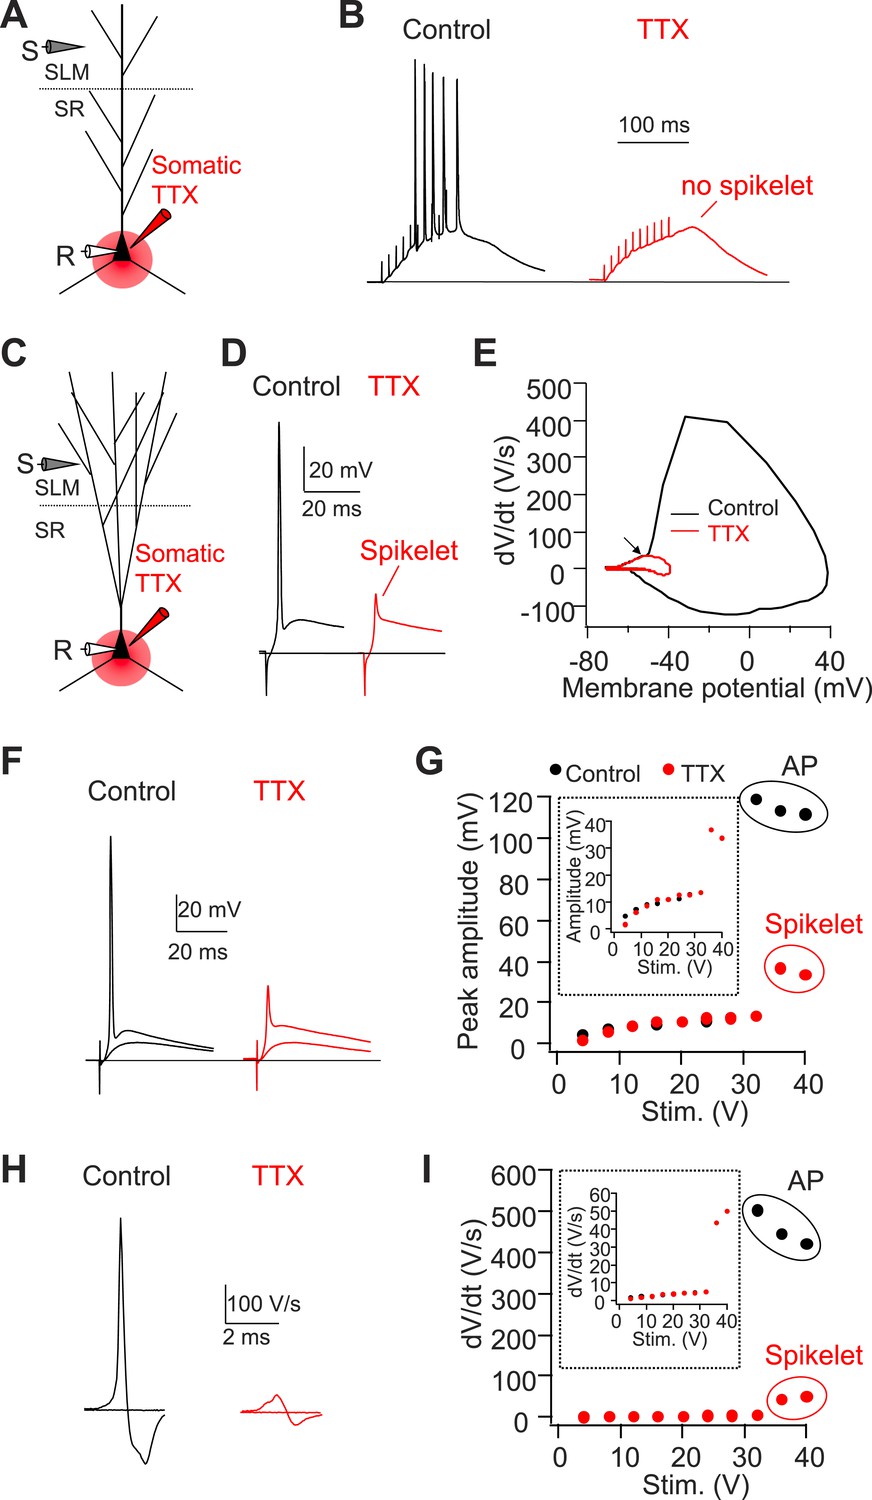
Somatic TTX application reveals prominent spikelets at the soma of CA2, but not CA1, PNs in response to PP stimulation.
(A) Diagram illustrating the configuration of CA1 PN experiment as shown in (B). (B) Sample traces of somatic voltage response in a CA1 PN to high-frequency burst stimulation (100 Hz, 10 pulses) in the absence (control) or the presence of somatic TTX (somatic TTX). Note the absence of spikelets at the soma. (C) Diagram illustrating the configuration of CA2 PN experiment shown in (D–I). (D) Sample traces of somatic voltage response in a CA2 PN to a single PP stimulus in the absence (control) or the presence of somatic TTX (TTX). Note the presence of a prominent spikelet during somatic TTX application at the soma of CA2 PN. (E) A phase-plane plot from the traces shown in (D). Note the overlap of the initial rising phase in control and TTX (arrow). (F) Superimposed traces of somatic voltage response of a CA2 PN to suprathreshold and subthreshold PP stimuli in the absence or the presence of somatic TTX. (G) Input–output of somatic voltage response from the CA2 PN shown in (F). Inset shows an expanded plot of the sub-threshold somatic voltage response. Note, the spikelet amplitude reaches >35 mV, providing ∼20 mV extra somatic depolarization on top of the EPSP. (H) Sample traces of dV/dt from (F). (I) Input–output curve of dV/dt from the CA2 PN shown in (F–H). Inset shows an expanded plot of sub-threshold dV/dt. Note, dV/dt of the spikelets reaches ∼50 V/s.
Figure 5 with 1 supplement
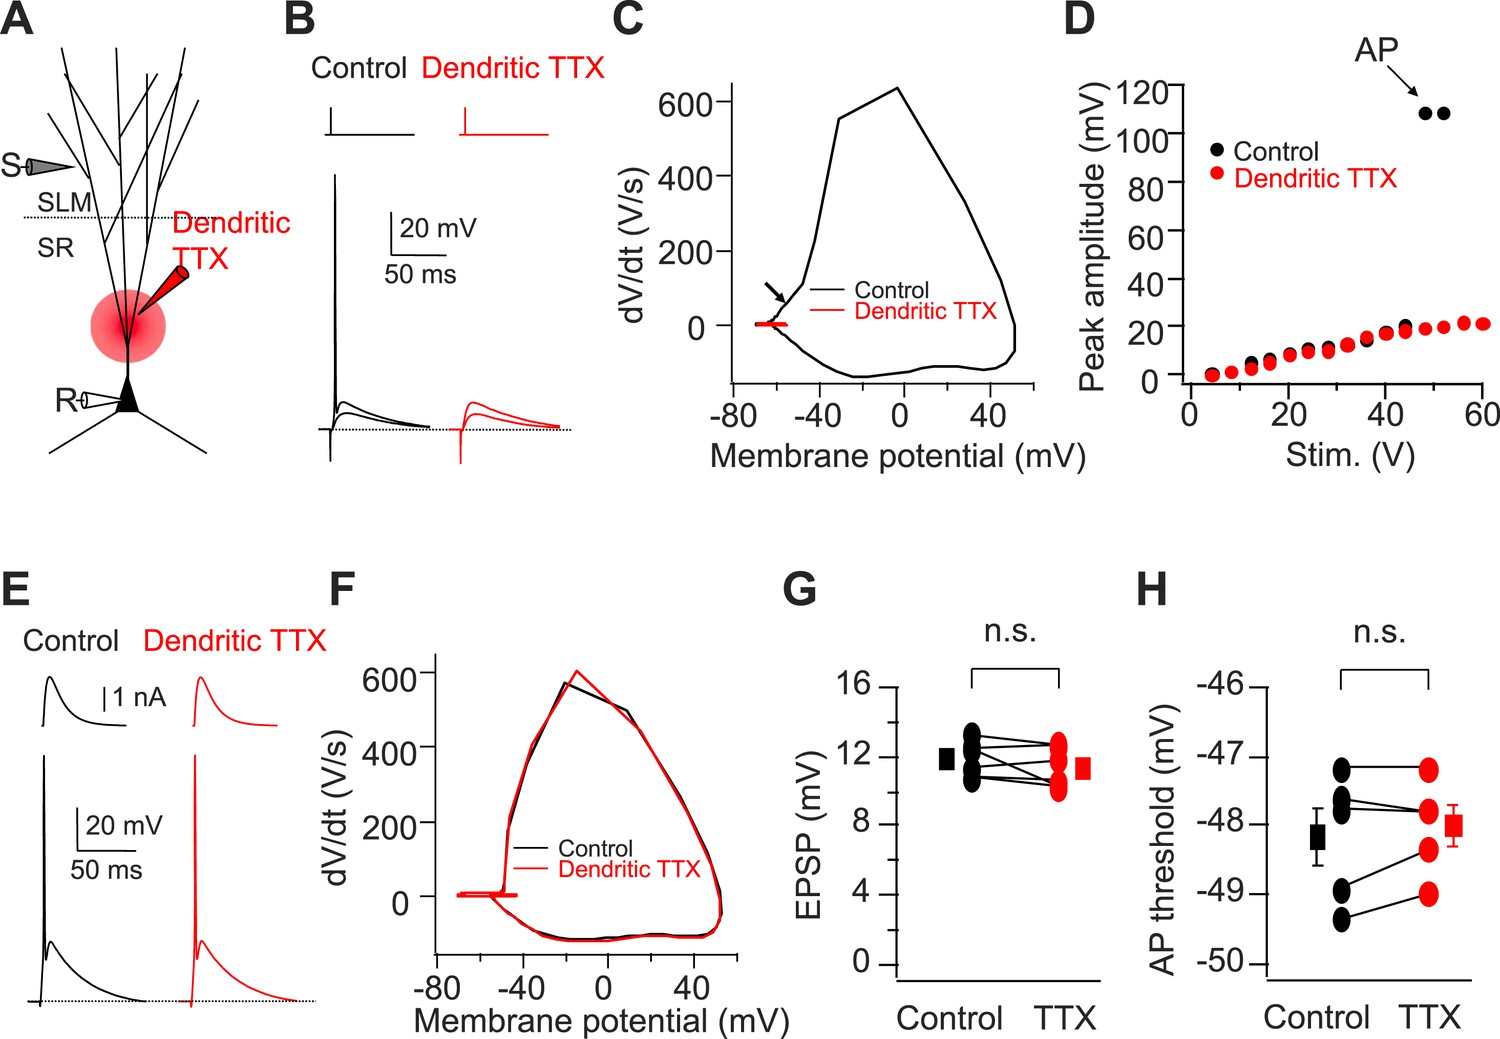
Cortically driven dendritic Na+ spikes are necessary to fire APs in CA2 PNs in response to a single PP stimulus.
(A) Diagram illustrating the configuration of the experiment. (B) Superimposed voltage responses of CA2 PN in response to suprathreshold and subthreshold PP stimuli. Responses obtained in the absence (Control) or the presence of TTX applied to dendrites in SR (Dendritic TTX). Note dendritic TTX blocks AP in response to strong stimulus but does not alter subthreshold EPSP in response to weaker stimulus. (C) Phase-plane plots of dV/dt vs instantaneous voltage from data shown in (B). Arrow indicates a dendritic spike preceding a full-blown AP. (D) Input–output curve of somatic voltage response of an individual CA2 PN to PP stimulation in the absence of TTX (Control) or during local TTX application in SR (Dendritic TTX). (E) Sample traces of AP waveforms in response to somatic EPSC-like current injection. Responses obtained in the absence (Control) or the presence of TTX applied to dendrites in SR (Dendritic TTX). (F) Phase-plane plots of dV/dt vs instantaneous voltage from data shown in (E). Note lack of the rising phase preceding a full-blown AP seen in (C). (G and H) Sub-threshold EPSP evoked by PP stimulation (n = 6) and AP voltage threshold evoked by somatic EPSC-like current injection (n = 5) in the absence (Control) and the presence of TTX applied to dendrites in SR (TTX) for individual experiments (circles) and mean (squares). Error bars show SEM. SEM was smaller than symbol. n.s., not significant.
Figure 5—figure supplement 1
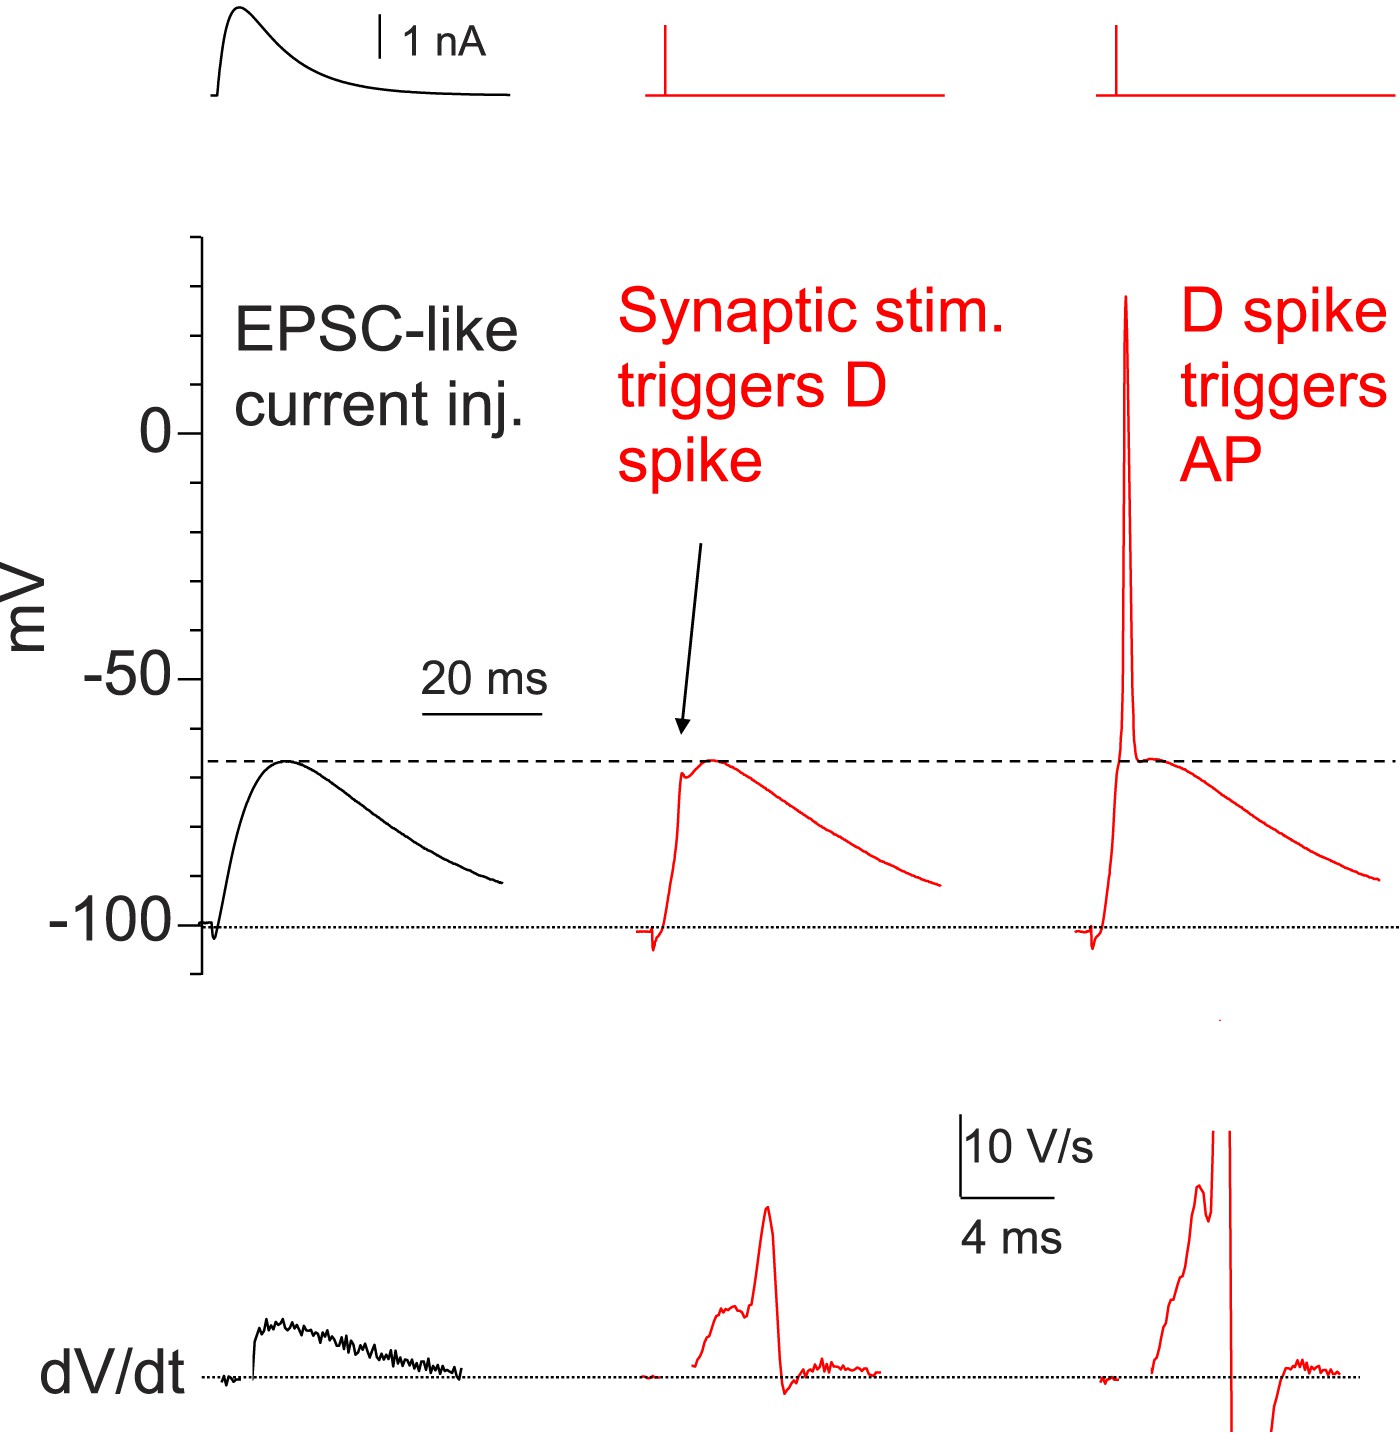
Dendritic Na+ spikes are necessary to fire APs in CA2 PNs.
Sample traces of somatic voltage response in a CA2 neuron to EPSC-like current injection (left) or a PP stimulus (middle and right, the same stimulation strength). Bottom: dV/dt of the corresponding traces on top. Constant negative current injection was applied to hyperpolarize the membrane potential to ∼−100 mV.
Figure 6 with 1 supplement
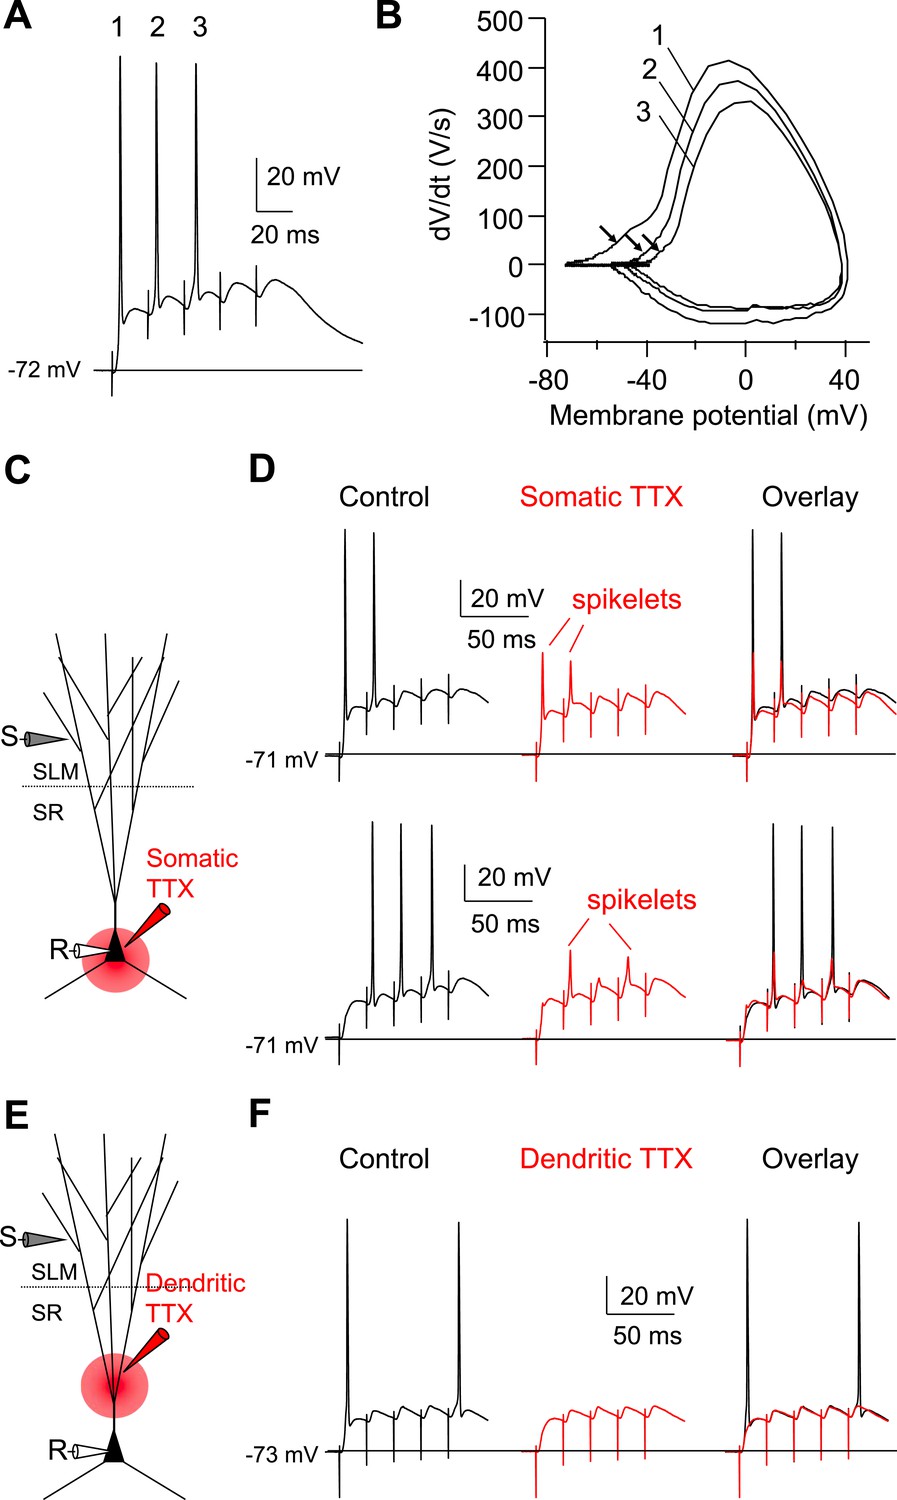
Dendritic Na+ spikes evoked by high-frequency burst stimulation to PP are necessary to fire APs in CA2 PNs.
(A) Sample somatic voltage response to high-frequency PP burst stimulation (50 Hz, 5 pulses). (B) Phase-plane plot from the traces shown in (A). The numbers (1–3) correspond to AP waveforms shown in (A). Note, the arrows indicate the rapid rising phase (dendritic Na+ spikes) preceding the full-blown APs. (C) Diagram illustrating the configuration of the experiment shown in (D). (D) Sample traces of somatic spikelets revealed by somatic TTX application in response to 48 V (top) or 32 V (bottom) high-frequency PP burst stimulation (50 Hz, 5 pulses). Left: control, middle: somatic TTX, right: overlay. (E) Diagram illustrating the configuration of the experiment shown in (F). (F) Sample traces of somatic voltage response to high-frequency PP burst stimulation (50 Hz, 5 pulses). Left: control, middle: dendritic TTX, right: overlay. Note, APs are blocked by dendritic TTX application.
Figure 6—figure supplement 1
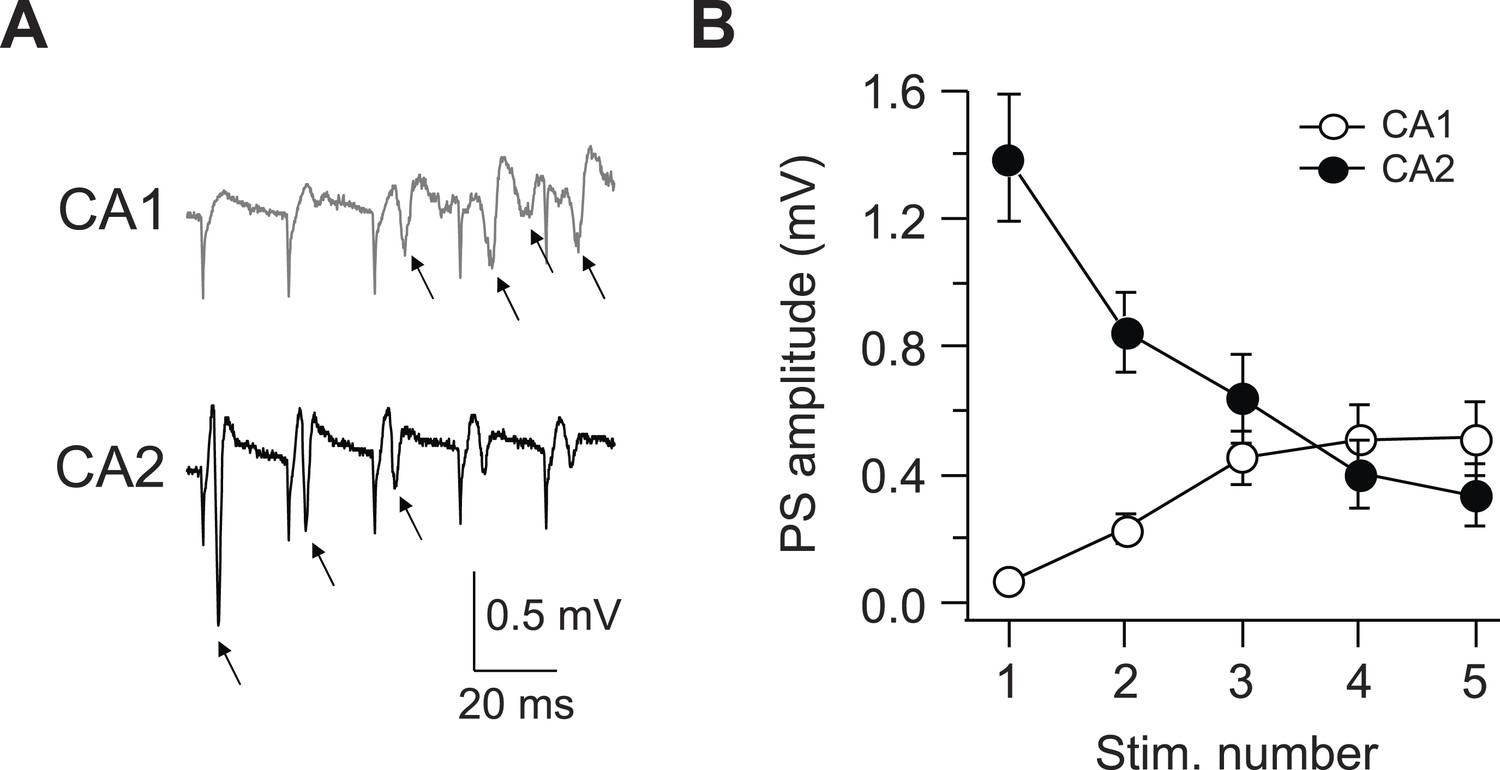
Latency to fire APs in response to PP burst stimulation is shorter in CA2 than CA1.
(A) Sample traces of population spike (PS) recorded in CA1 and CA2 cell body layers in response to a burst of 5 PP stimuli (at 50 Hz). Arrows indicate PS. (B) Mean PS amplitude as function of stimulus number. CA1, n = 8; CA2, n = 9. Error bars show SEM.
Figure 7

CA2, but not CA1 or CA3, dendrites are active in response to PP stimulation.
(A) Left: diagram illustrating the configuration for extracellular field recording. Right: sample traces of field EPSP (fEPSP) responses in SLM, SR, and SP of CA1 and CA2 regions. Arrow indicates active dendritic response (negative field potential) in SR of CA2. (B) Mean input–output curves of PS amplitude in SR of CA1 (n = 4), CA2 (n = 7), and CA3 (n = 6) regions. (C) PS amplitude in SR plotted against PS amplitude in SP from the simultaneous field recordings in SR and SP in CA2 (correlation coefficient = 0.91, p < 0.001, n = 17). (D) Left: scaled simultaneously recorded field responses in SR and SP in CA2 (red circle in the right panel; distance from SP = 105 μm). Right: the time difference of the response latency between SR and SP plotted against the distance between the two recording electrodes (correlation coefficient = 0.92, p < 0.001, n = 13).
Figure 8 with 2 supplements
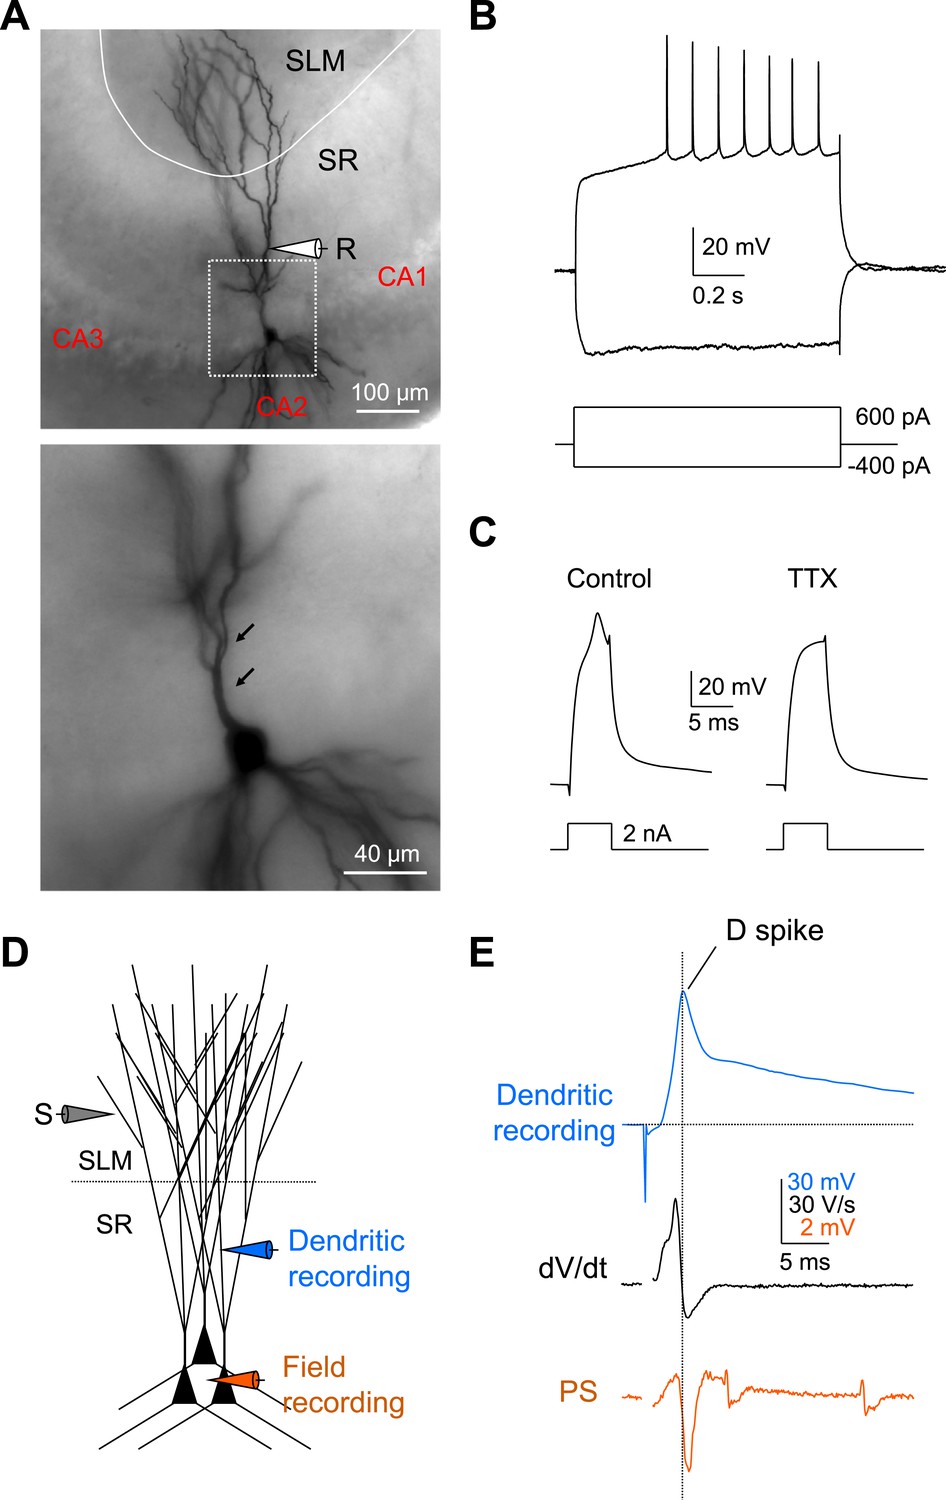
Local dendritic Na+ spikes observed with dendritic whole-cell recordings in CA2 PNs.
(A) Top: a typical CA2 PN filled with biocytin following dendritic whole-cell recording (recording distance: ∼125 μm from soma). Bottom: an expanded view of the box shown on top. Arrows show the lack of thorny excrescences, the postsynaptic spines of mossy fiber synapses seen in CA3 PNs. (B) The voltage response of a CA2 PN dendrite to local current injection (same neuron as in A). (C) A dendritic spike (recording distance: ∼150 μm) evoked by a 5-ms current pulse in the absence or the presence of TTX (0.5 μM). (D) Diagram illustrating the configuration for simultaneous dendritic whole-cell recording and extracellular field recording in CA2 cell body layer shown in (E). (E) Dendritic spike (top), dV/dt (middle), and PS (bottom) in response to a single PP stimulus (same neuron as in C). Note, dendritic spike precedes PS in CA2 cell body layer.
Figure 8—figure supplement 1
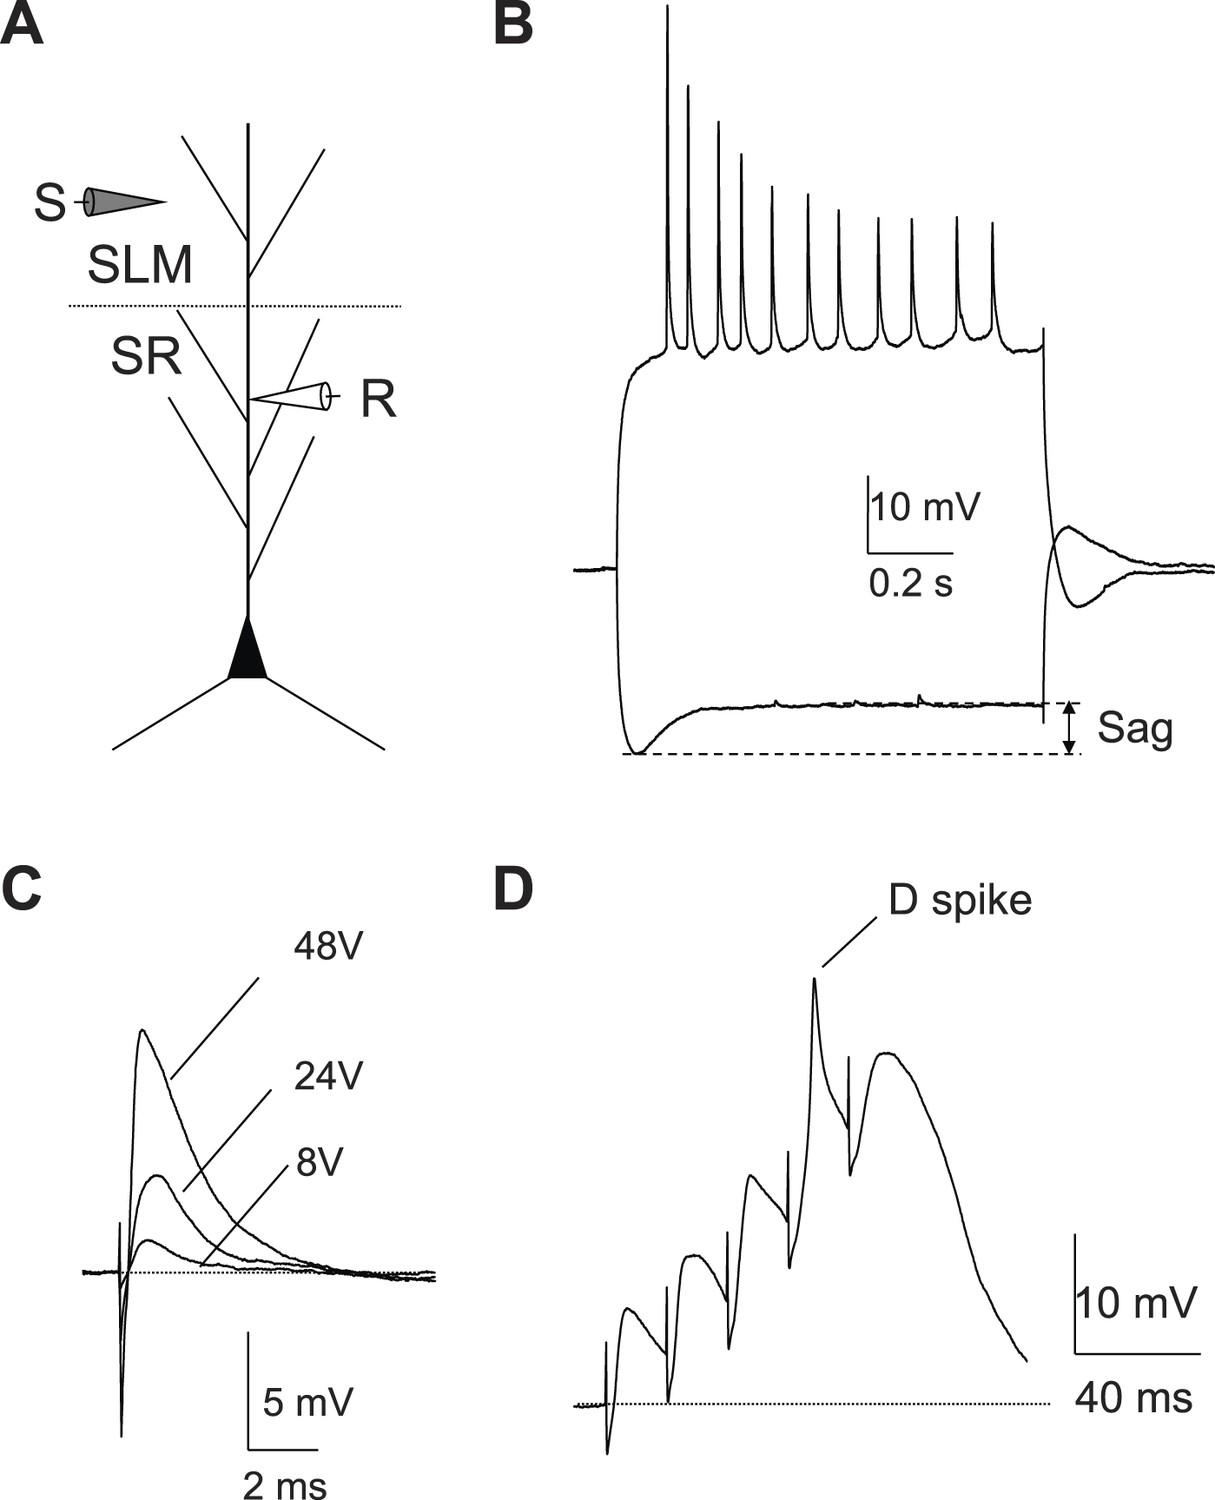
Dendritic whole-cell recordings in CA1 dendrites.
(A) The experimental configuration. (B) Sample traces of the voltage response of a CA1 dendrite (195 μm) to negative or positive constant current injections. Note a larger Sag (characteristic of Ih) than that from CA2 dendritic recordings (Figure 8B). (C) Sample traces of the EPSPs recorded in a CA1 dendrite (217 μm) in response to single PP stimuli. Note the lack of dendritic spikes. (D) An isolated dendritic spike elicited by a high-frequency burst of PP stimuli (50 Hz, 5 pulses) in a CA1 dendrite (196 μm).
Figure 8—figure supplement 2
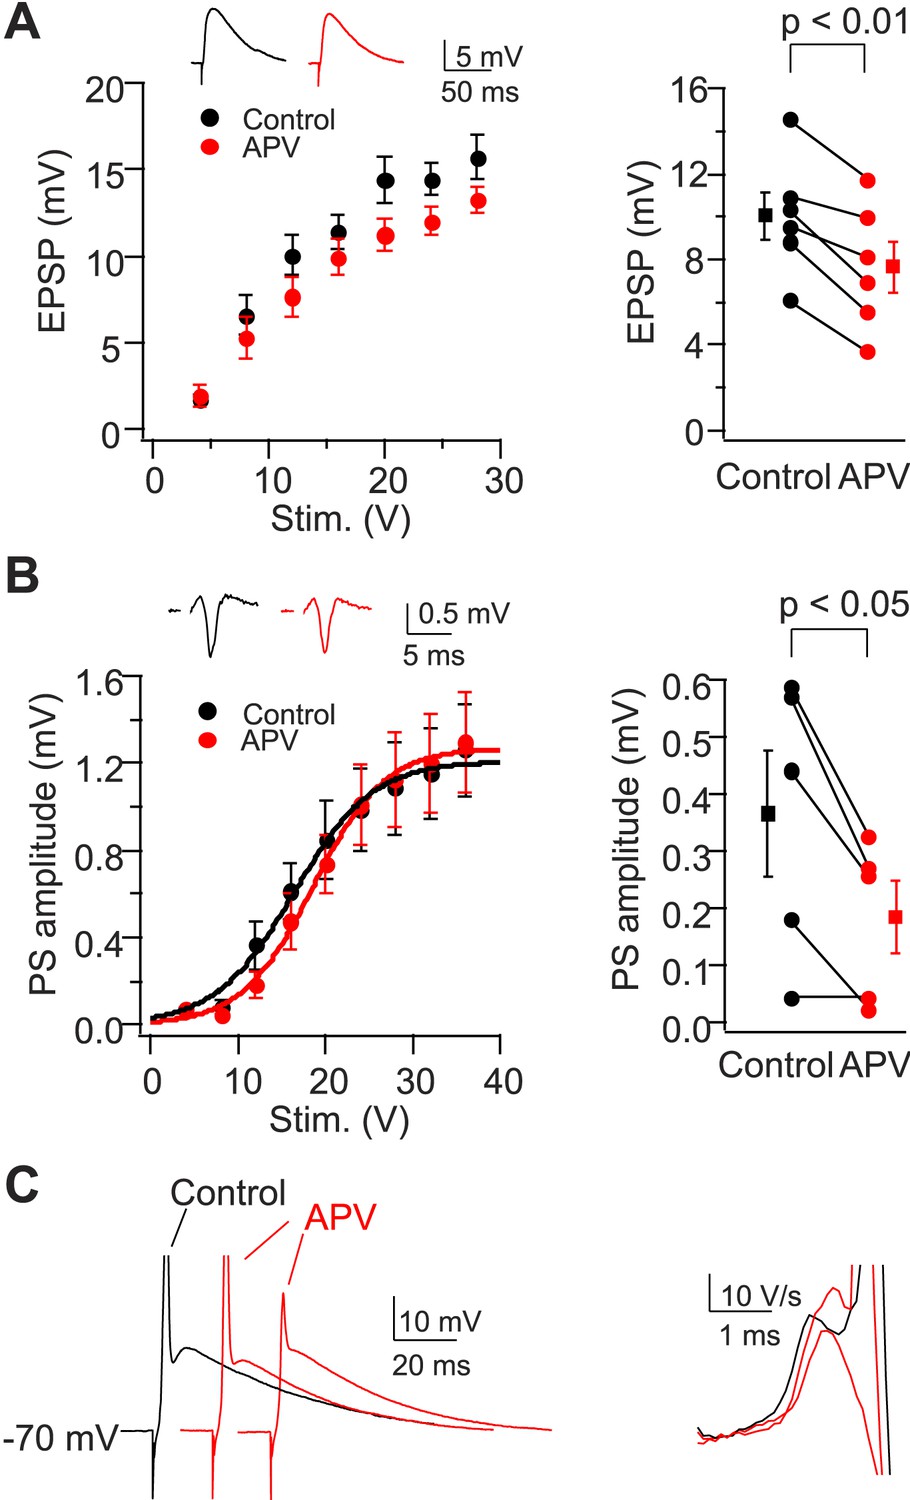
NMDAR activation is not required for dendritic spikes in CA2 PNs.
(A) Left: mean input–output curves of EPSPs in response to a single PP stimulus in the absence vs the presence of 50-μM D-APV. Inset: sample EPSPs in the absence (black) and the presence (red) of D-APV. Right: EPSP amplitude of individual neurons in response to a single 12 V PP stimulus. (B) Left: mean input–output curves of PS in CA2 cell body layer in response to a single PP stimulus in the absence vs the presence of D-APV. Inset: samples traces of PS. Right: PS amplitude of individual neurons in response to a single 12 V PP stimulus in the absence or the presence of D-APV. Square symbols show mean. Error bars show SEM. (C) Left: sample whole-cell voltage responses from a CA2 PN to PP stimuli of fixed strength in the absence (black) vs the presence of D-APV (red). APs are truncated. Right: dV/dt of sample traces shown in the left. Note the presence of D spikes in the presence of D-APV.
Figure 9 with 1 supplement

Dendritic Na+ spikes in CA2 PNs overcome inhibition to trigger APs.
(A) Mean input–output curves of sub-threshold postsynaptic potentials (PSP) in response to a single PP stimulus in the absence (red) or the presence (black) of GABAA and GABAB receptor antagonists, 2 μM SR 95531, and 1 μM CGP 55845, respectively (SR/CGP; n = 8–10). Inset: sample traces of PSPs in the absence and the presence of GABAR antagonists. Trials in which stimulus elicited an AP were not included. (B) Mean input–output curves of PS in response to a single PP stimulus in the absence or the presence of GABAR antagonists (n = 13). Inset shows sample PS. (C) Sample traces of PSPs and APs obtained from somatic whole-cell recordings in response to a PP stimulus with increasing strength in the absence or the presence of GABAR antagonists. (D) Bars show population frequency histogram of AP threshold in the absence (red) and the presence (black) of GABAR antagonists. Circles show cumulative distribution of firing probability as function of stimulus voltage (control: red, n = 34 cells; SR/CGP: black, n = 42 cells). (E) Peak somatic voltage amplitude plotted against stimulating intensity from individual CA2 PNs which fire APs in responses to a PP stimulus in the absence of GABAR antagonists (n = 6). (F) Expanded view of sub-threshold PSP response in (E). Note, the red dashed line in (E) and (F) indicates mean PSP amplitude (10.99 ± 0.59 mV, n = 6) right before CA2 PNs fire APs. (G) Left: sample traces of sub-threshold PSPs, dendritic Na+ spikes, and an AP in a CA2 PN in response to single PP stimuli of constant strength near the threshold for AP firing (60 V, 5 trials) in the absence of GABAR antagonists. Note, PSPs are only able to depolarize membrane to −60.4 mV (black line). Right: dV/dt of the corresponding traces shown at left.
Figure 9—figure supplement 1
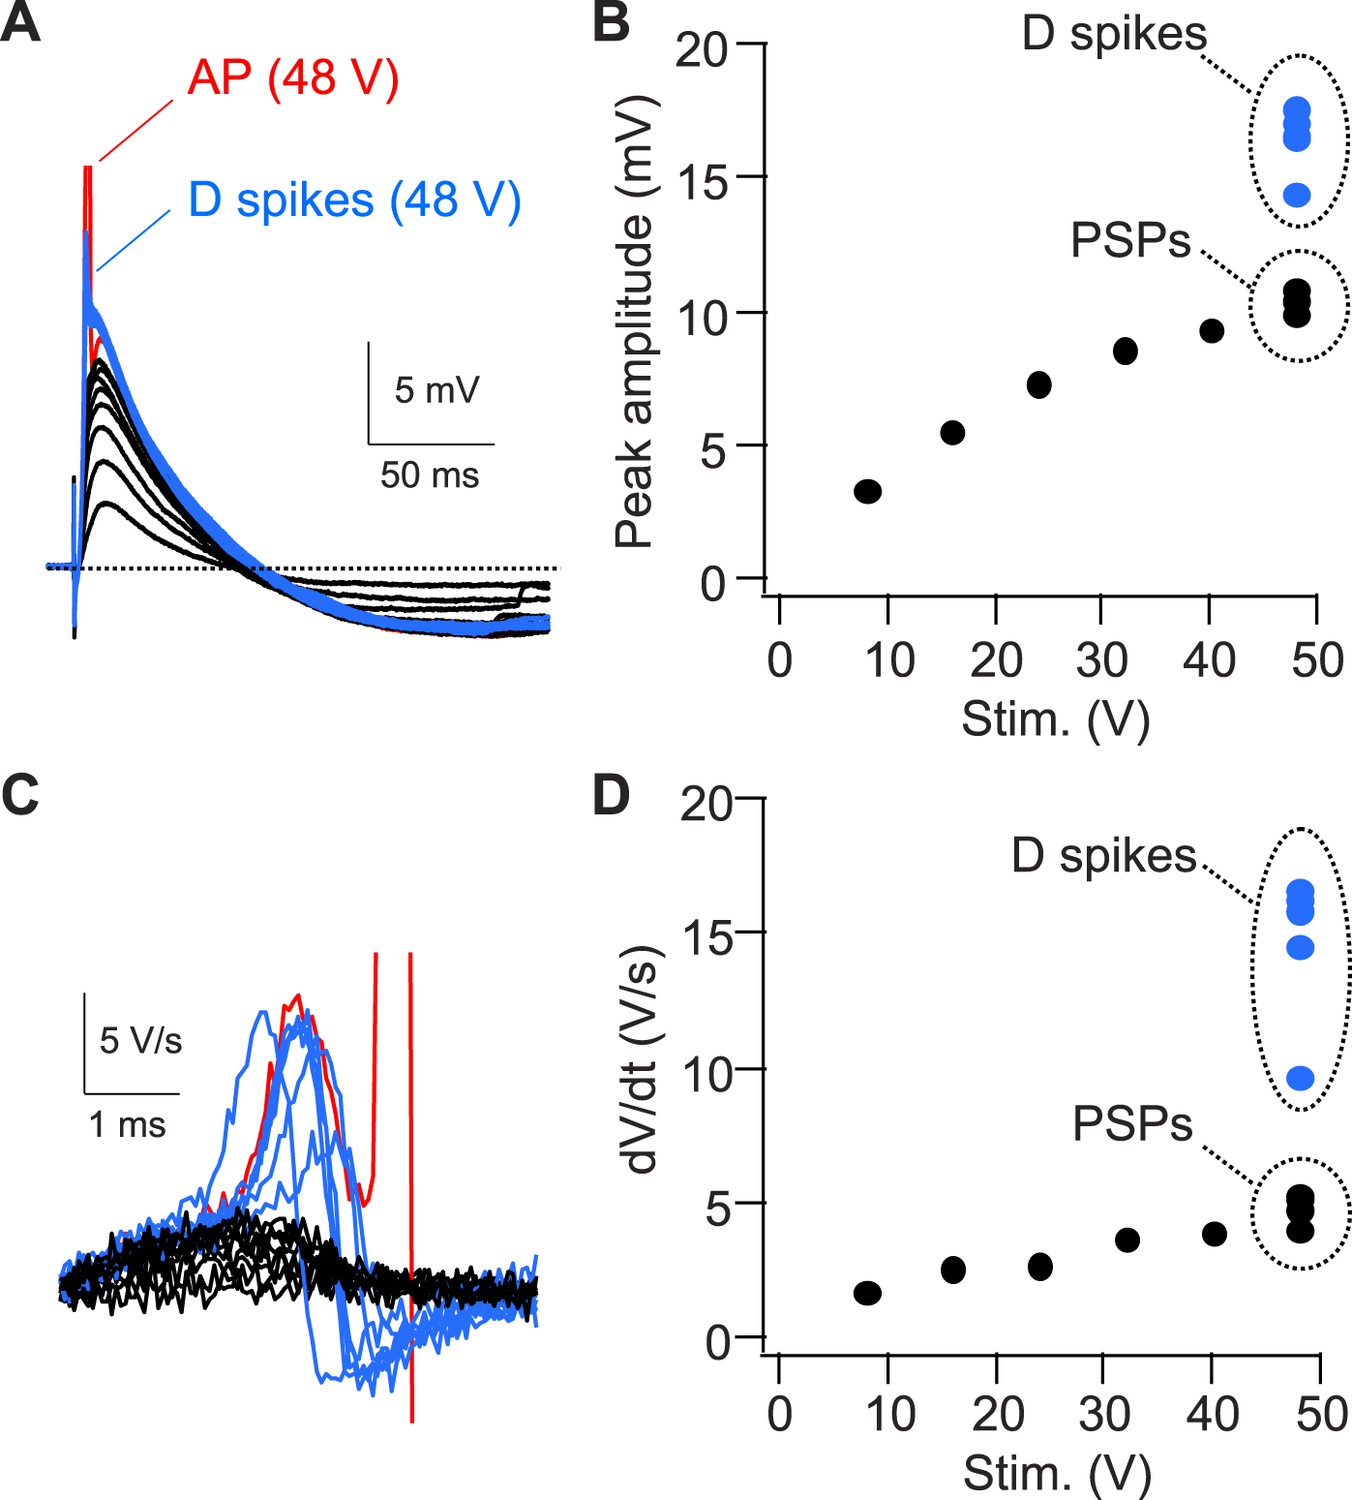
Strong PP stimulation with constant strength variably triggers APs, D spikes, or PSPs in the presence of inhibition.
(A) Sample traces of PSPs, D spikes, and an AP in response to PP stimulation with increasing strengths. The AP is truncated. (B) Quantification of the experiment shown in (A). Note, 10 trials with 48 V stimulation variably trigger D spikes, PSPs, or APs (not shown). (C) dV/dt corresponding to traces shown in (A). The AP is truncated. (D) Quantification of the experiment shown in (C).
Figure 10 with 2 supplements
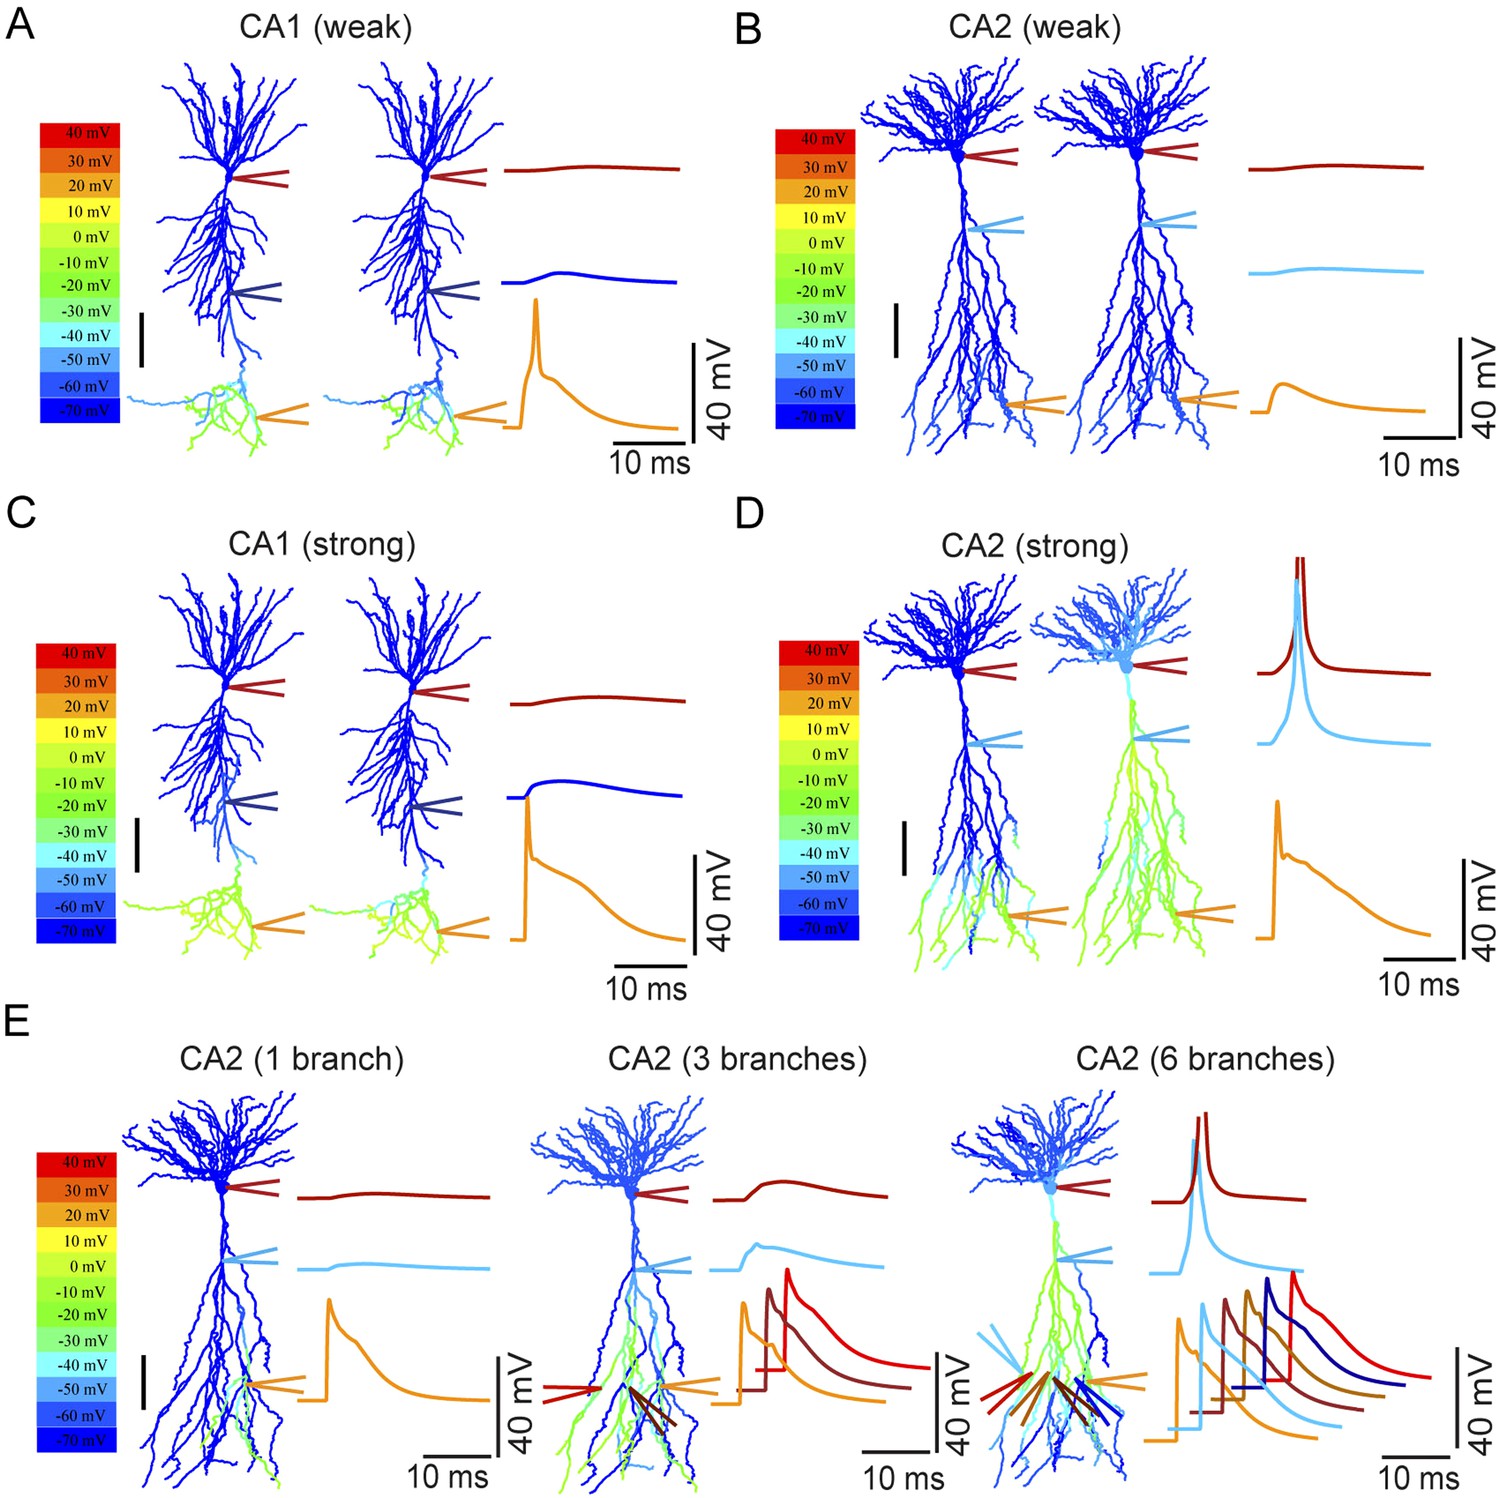
Modeling the differential coupling of dendritic Na+ spikes to AP output in CA1 vs CA2 dendrites.
(A, B) Weak PP stimulation (∼75 synapses) triggered local spikes at distal apical dendrites in CA1 (A), but not in CA2 (B), PNs. In both models, dendritic spikes failed to propagate to the soma. (C) Strong PP stimulation (∼1000 synapses) triggered local Na+ spikes in the apical tuft of the CA1 PN that failed to propagate to the soma. (D) Strong PP stimulation (∼1000 synapses) triggered local Na+ spikes in the apical tuft of CA2 PN that propagated effectively to the soma and triggered an AP. Note the presence of a prominent dendritic Na+ spike at the CA2 PN primary apical dendrite branch point. APs are truncated. Color maps in (A–D) represent voltage snapshots. Left: snapshot taken at the time of peak voltage response in distal dendrites of CA1 and CA2 PNs. Right: snapshot taken at the time of peak voltage response at main apical dendritic trunk for CA1 PN or primary dendritic branch point for CA2 PN. Scale: 100 µm. Traces show voltage response at indicated positions. (E) Increasing numbers of secondary or tertiary CA2 apical branches (∼300 μm from the soma) were activated by ∼150 synapses per branch to trigger dendritic spikes. Offset traces at bottom show voltage responses in individual branches. Simultaneous activation of six out of twelve branches triggered a spike at the soma. Note a prominent dendritic Na+ spike at the branch point of primary apical dendrite of the CA2 PN. Color maps represent snapshots captured at time point of peak voltage observed at the main branch point of CA2 apical dendrites. Scale: 100 µm.
Figure 10—figure supplement 1
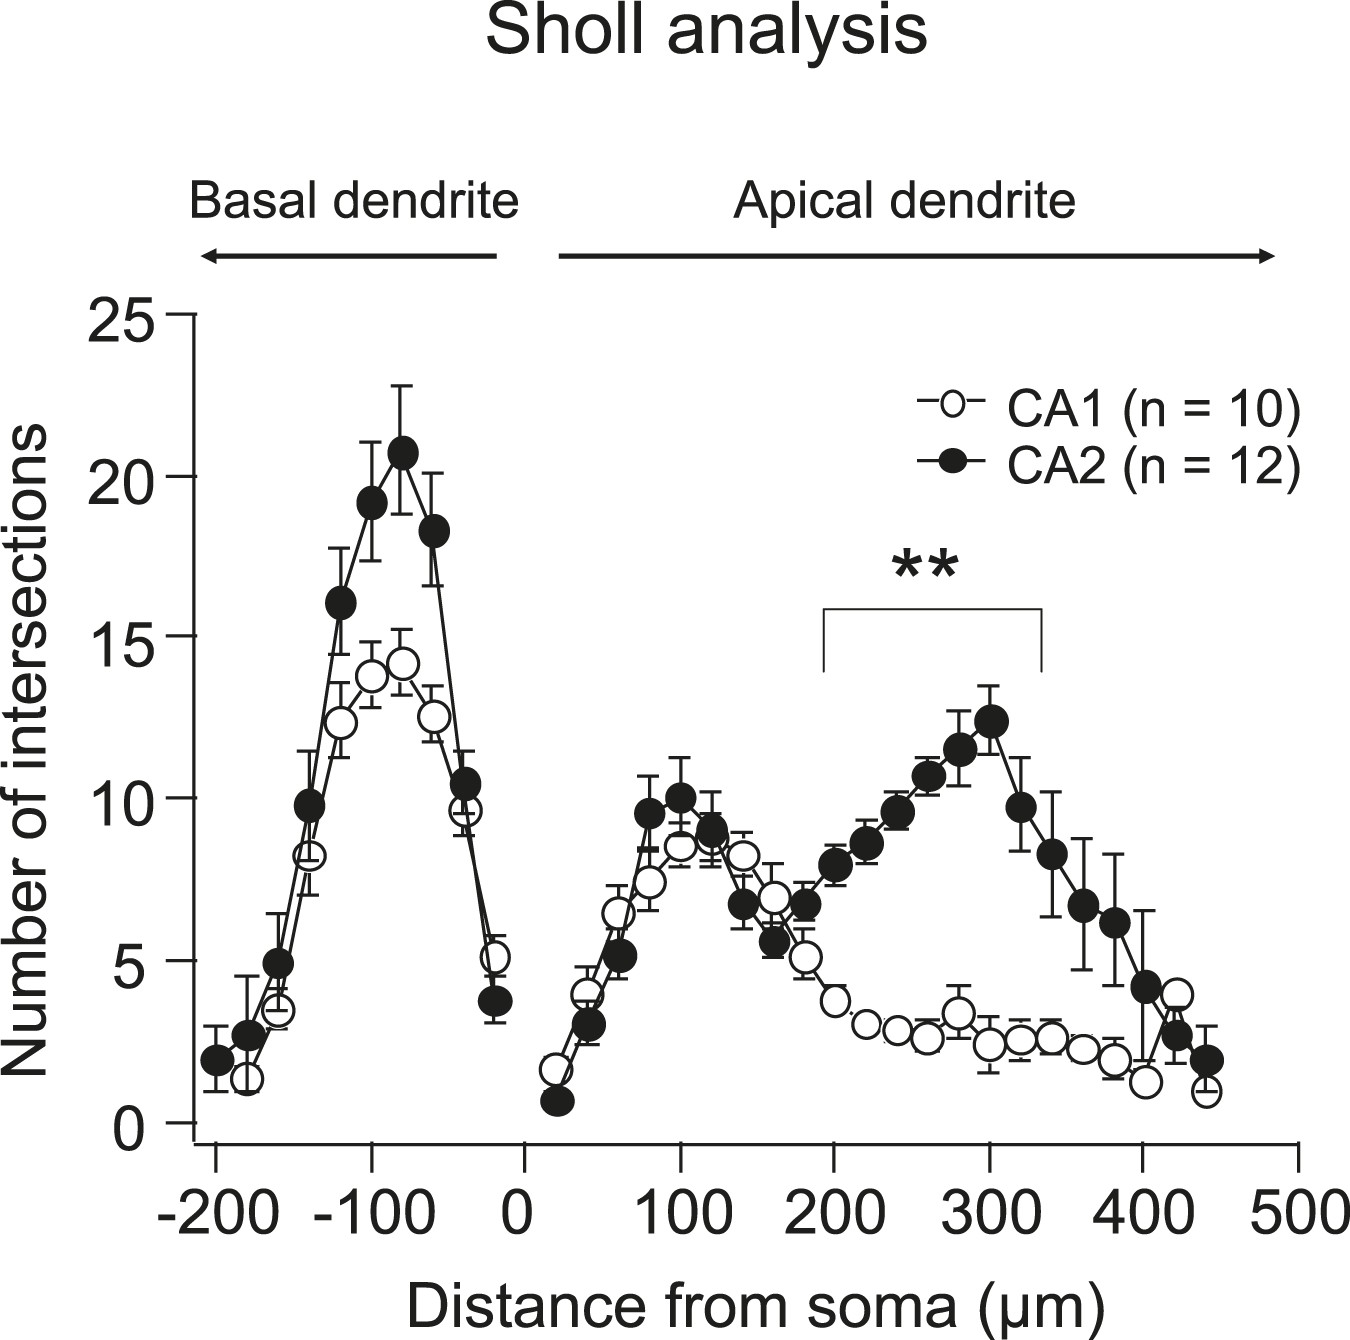
Quantification of dendritic morphology of CA1 vs CA2 using Sholl analysis.
Note, the number of intersections (crossings of the dendritic branches) in the middle and distal apical dendrites in CA2 is significantly larger than that in CA1. **p < 0.01.
Figure 10—figure supplement 2
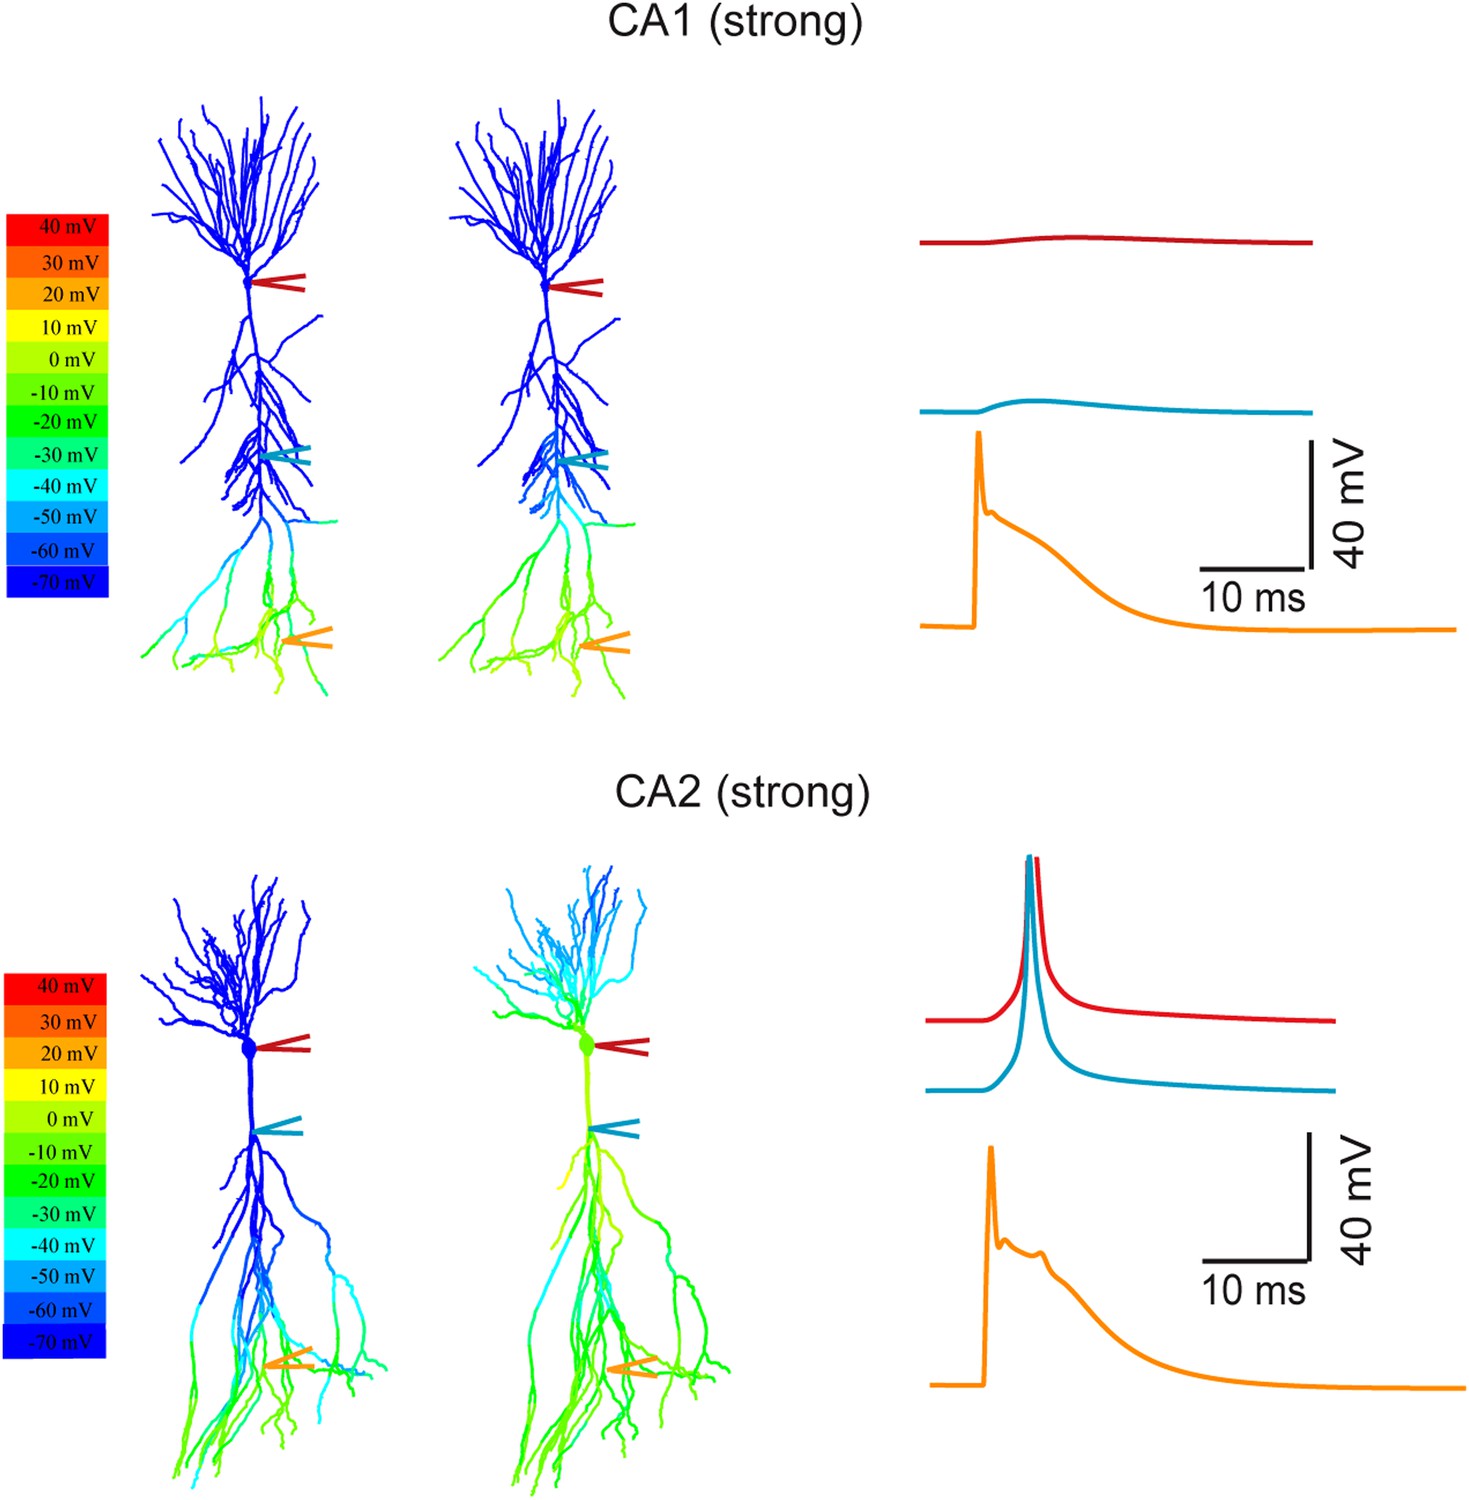
Modeling the differential coupling of dendritic Na+ spikes to AP output in CA1 vs CA2 dendrites.
Models based on morphological reconstructions from a second set of CA1 and CA2 PNs. Strong PP stimulation (∼1000 synapses) evoked local Na+ spikes in the apical tuft of both CA1 (top) and CA2 (bottom) PNs. These spikes propagated effectively to the soma and triggered an AP at the CA2 soma (bottom), but not at the CA1 soma (top). Note a prominent dendritic Na+ spike at the main branch point of the primary apical dendrite of the CA2 PN (cyan trace). The AP (red) is truncated. Color maps represent the snap shots captured at time points of peak voltage immediately after PP stimulation (left) or peak voltage observed at main apical trunk of CA1 and the main branch point of CA2 apical dendrites (right). Note the large depolarization (warm color) at the main branch point (‘hot spot’ zone) in CA2 model.
Download links
A two-part list of links to download the article, or parts of the article, in various formats.
Downloads (link to download the article as PDF)
Open citations (links to open the citations from this article in various online reference manager services)
Cite this article (links to download the citations from this article in formats compatible with various reference manager tools)
Dendritic Na+ spikes enable cortical input to drive action potential output from hippocampal CA2 pyramidal neurons
eLife 3:e04551.
https://doi.org/10.7554/eLife.04551


