Modelling the contribution of the hypnozoite reservoir to Plasmodium vivax transmission
- Imperial College London, United Kingdom
- Walter and Eliza Hall Institute, Australia
- University of Melbourne, Australia
- University of Oxford, United Kingdom
- National Institutes of Health, United States
- Centre de Recerca en Salut Internacional de Barcelona, Spain
Figures
Figure 1 with 1 supplement
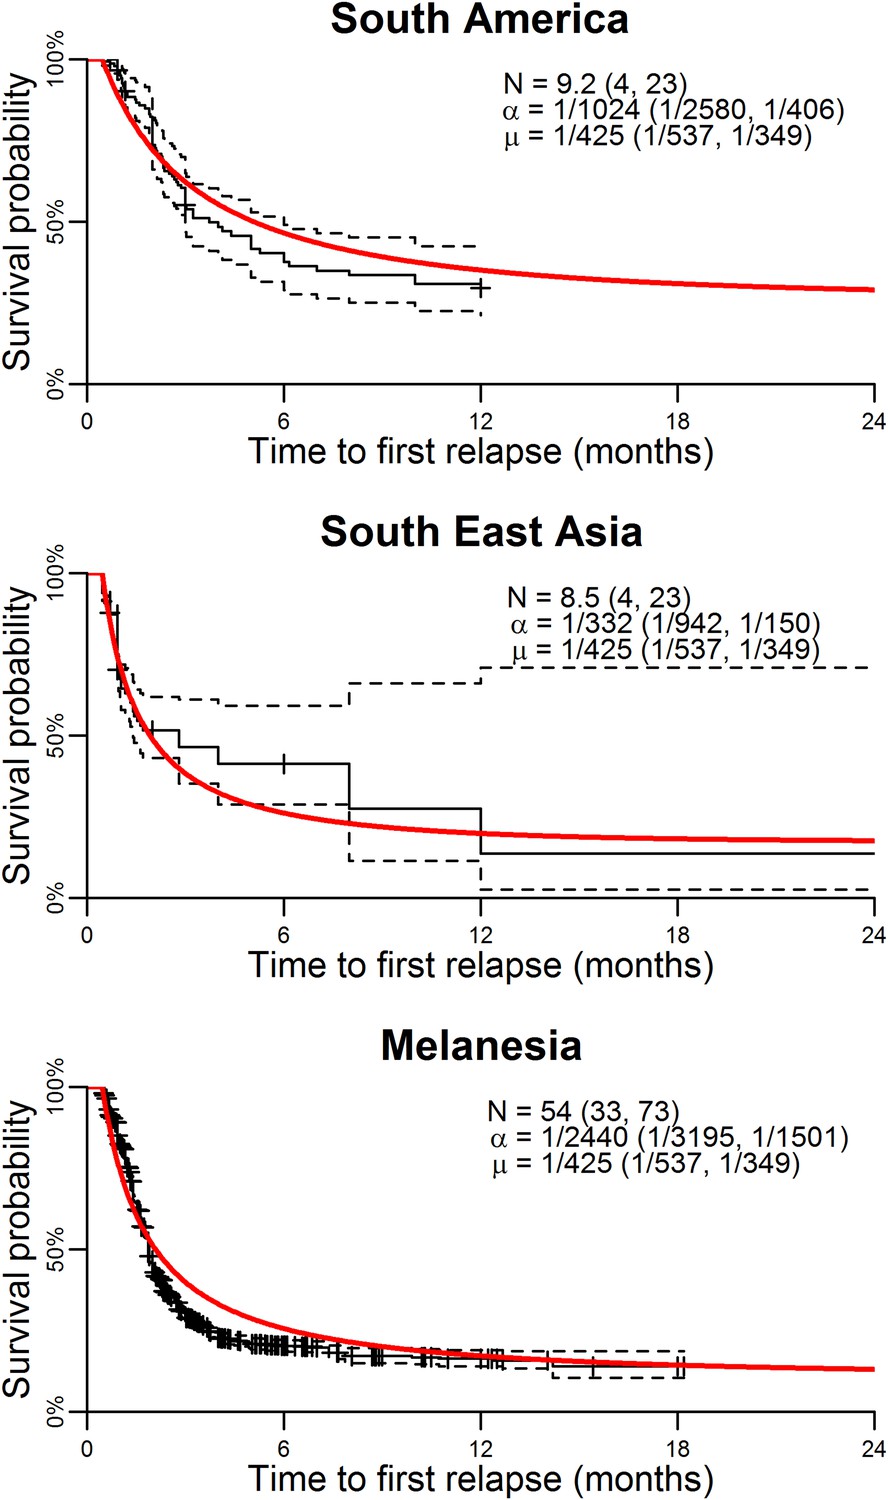
Model parameterisation.
Time to first relapse infection from the within-host model fitted to data from three ecological zones with tropical strains of P. vivax (Battle et al., 2014). The red curves show the model fits with estimated posterior median parameters.
Figure 1—figure supplement 1
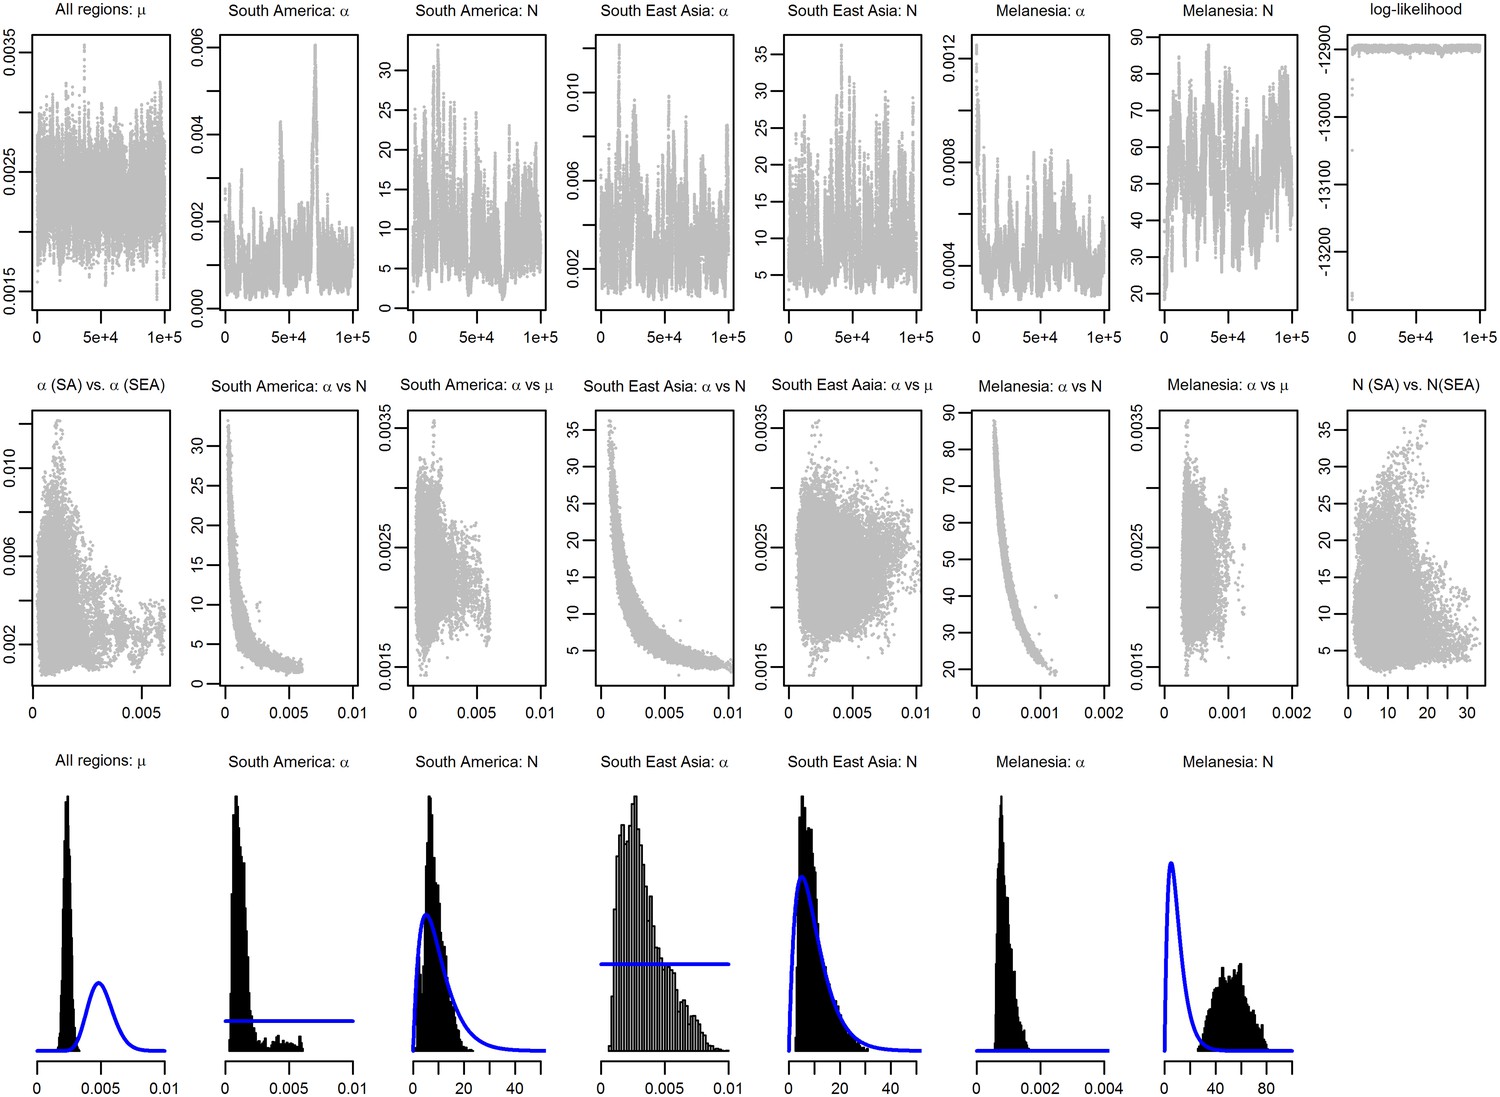
MCMC chains and posterior distributions for Bayesian model fitting.
The likelihood in Equation 12 was sampled using a Metropolis–Hastings Markov Chain Monte Carlo (MCMC) algorithm and the posterior parameter distributions were estimated. 100,000 MCMC iterations were sampled and visually checked for convergence and mixing. The top row shows the MCMC chains. The middle row shows the correlation between pairs of parameters. The bottom row shows the sampled posterior distributions. Prior distributions are shown in blue. Note the high degree of correlation between N and α.
Figure 2 with 1 supplement
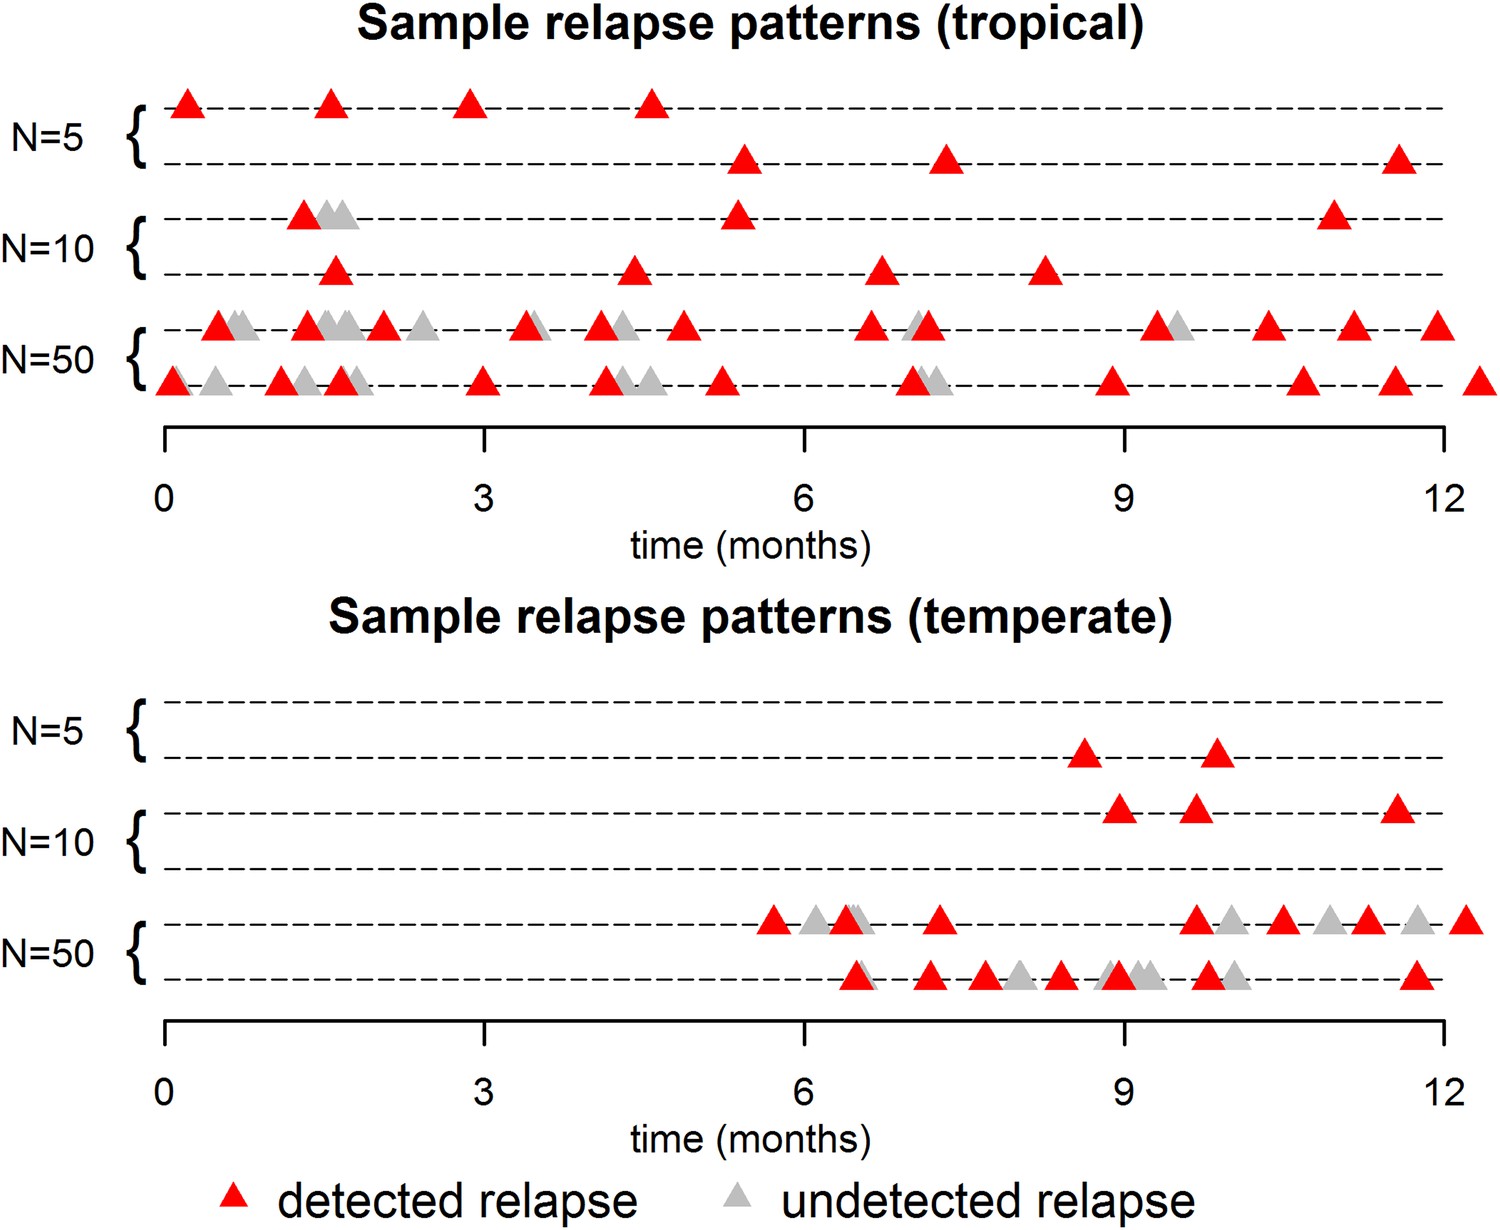
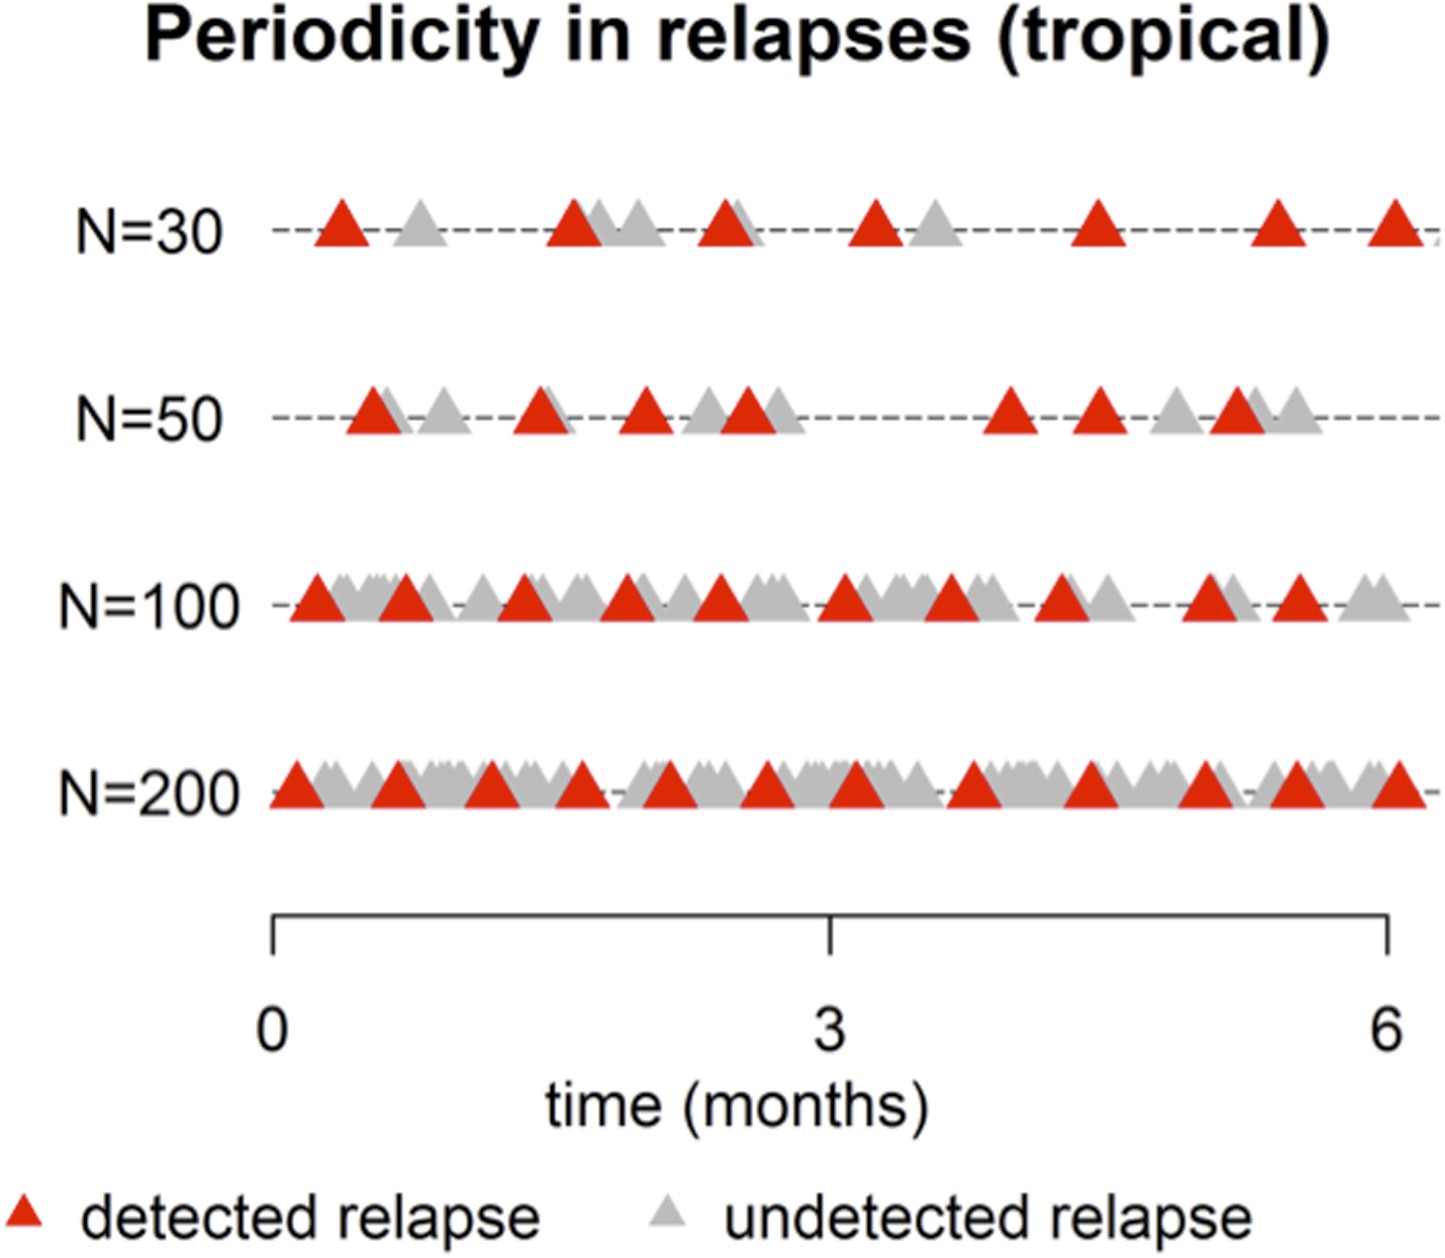
Sample relapse patterns for tropical and temperate strains of P. vivax.
A relapse is assumed to be undetected if it occurs within 14 days of a detected relapse. Both tropical and temperate phenotypes exhibit dose dependency, with a larger number of hypnozoites giving rise to a greater number of relapses and shorter times to first relapse. For larger numbers of hypnozoites (N = 50), periodicity in detected relapses is observed. The appearance of this periodicity is due to the undetected relapses.
Figure 2—figure supplement 1
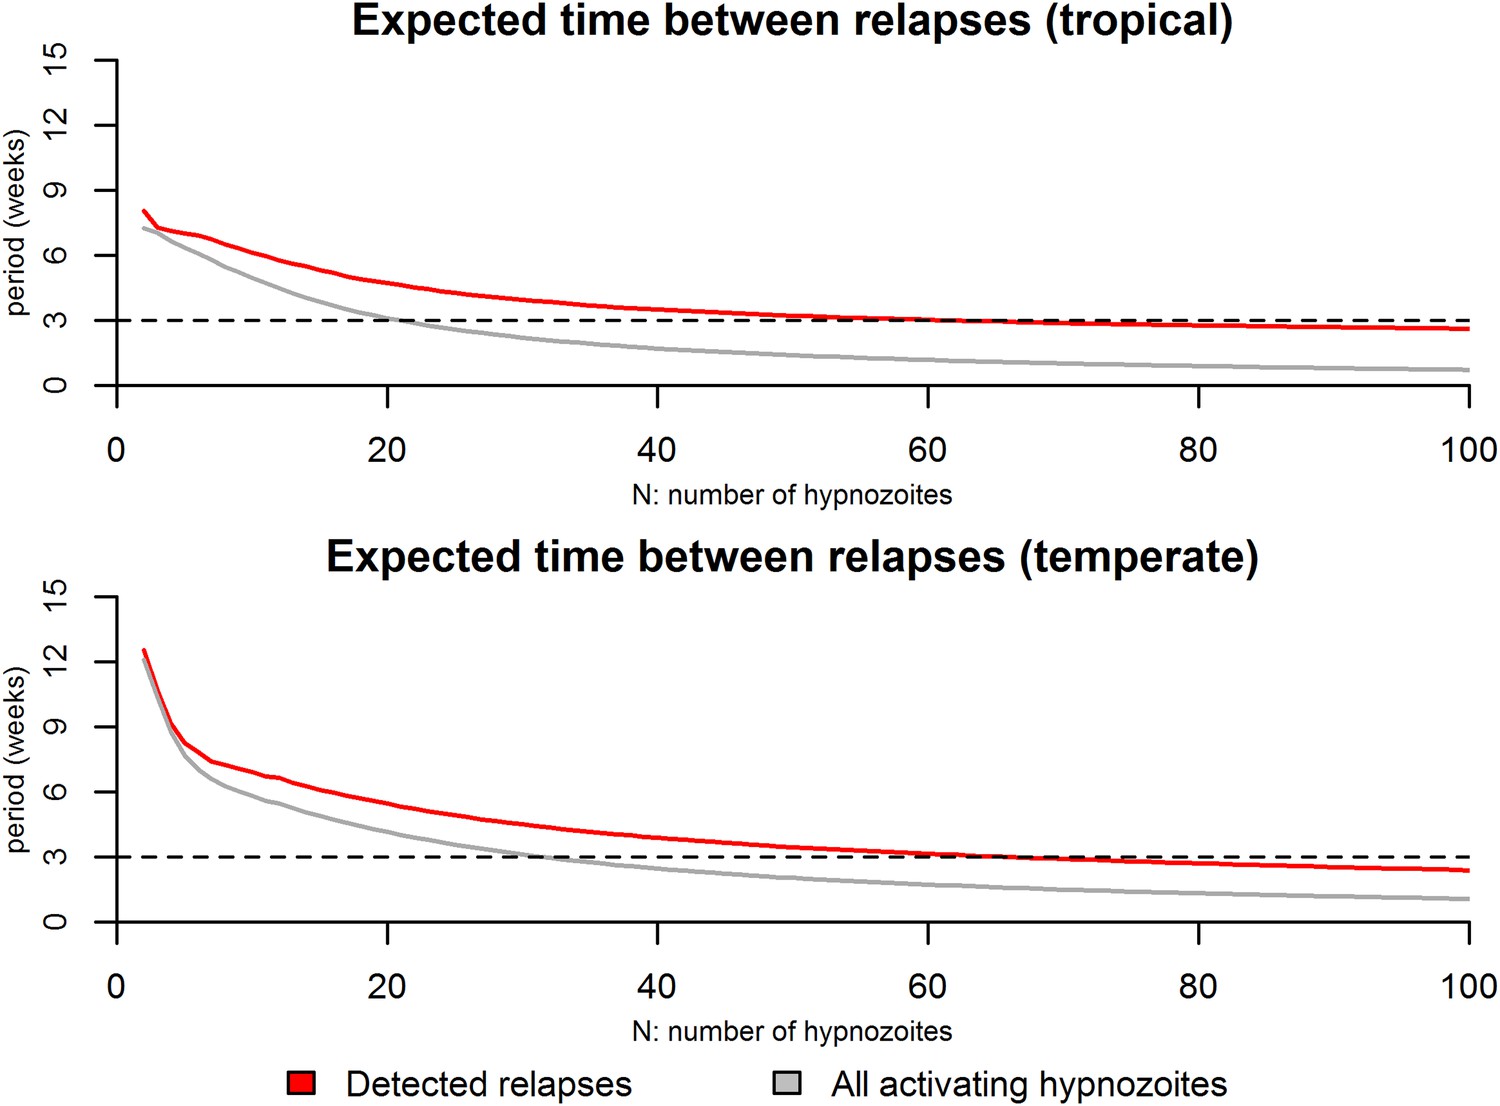
Expected time between consecutive relapses.
For the tropical phenotype the time between relapses was calculated as the mean duration between consecutive relapses over the first 6 months based on 10,000 stochastic simulations. For the temperate phenotype the time between relapses was calculated as the mean duration between consecutive relapses over the first 12 months based on 10,000 stochastic simulations. The red curves denote the time between detected relapses: it is assumed that within 14 days of a detected relapse some activating hypnozoites can go undetected due to anti-malarial prophylaxis or the presence of blood-stage parasites. The grey curve denotes the expected time between all consecutively activating hypnozoites. The dashed line denotes a 3 week duration which has been regularly been observed as a common period between consecutive relapses (White, 2011).
Figure 3
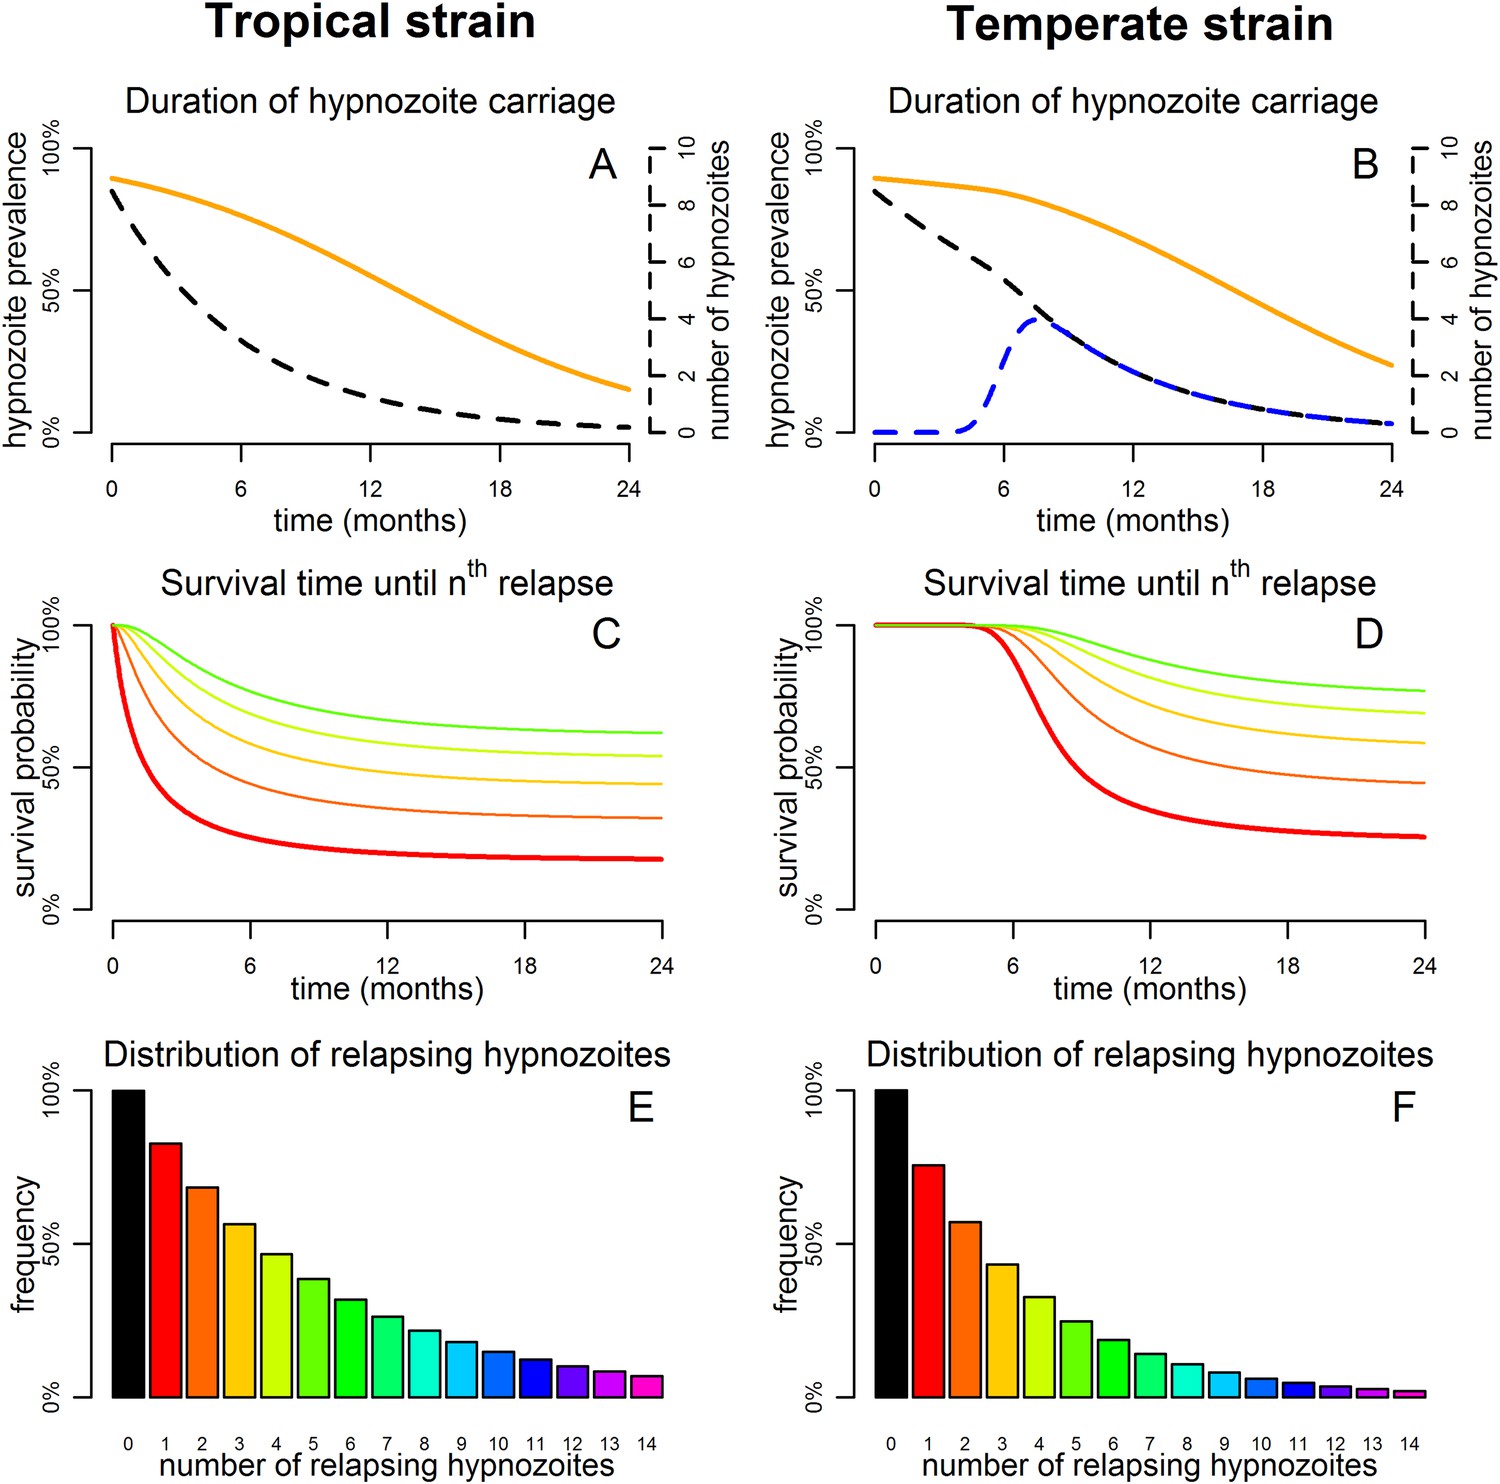
Predicted relapse infections following primary P. vivax infection.
(A and B) Duration of hypnozoite carriage (orange) and expected number of hypnozoites in the liver (dashed). For the temperate strain, the dashed blue line shows the number of hypnozoites in the relapsing phase. (C and D) Survival time until nth relapsing hypnozoite. The red curve is equivalent to the Kaplan–Meier curve for time to first blood-stage infection that would be observed in the absence of new infections from mosquito bites. Only the curves for the first five relapses are shown. (E and F) Proportion of individuals with at least n relapsing hypnozoites following primary infection.
Figure 4
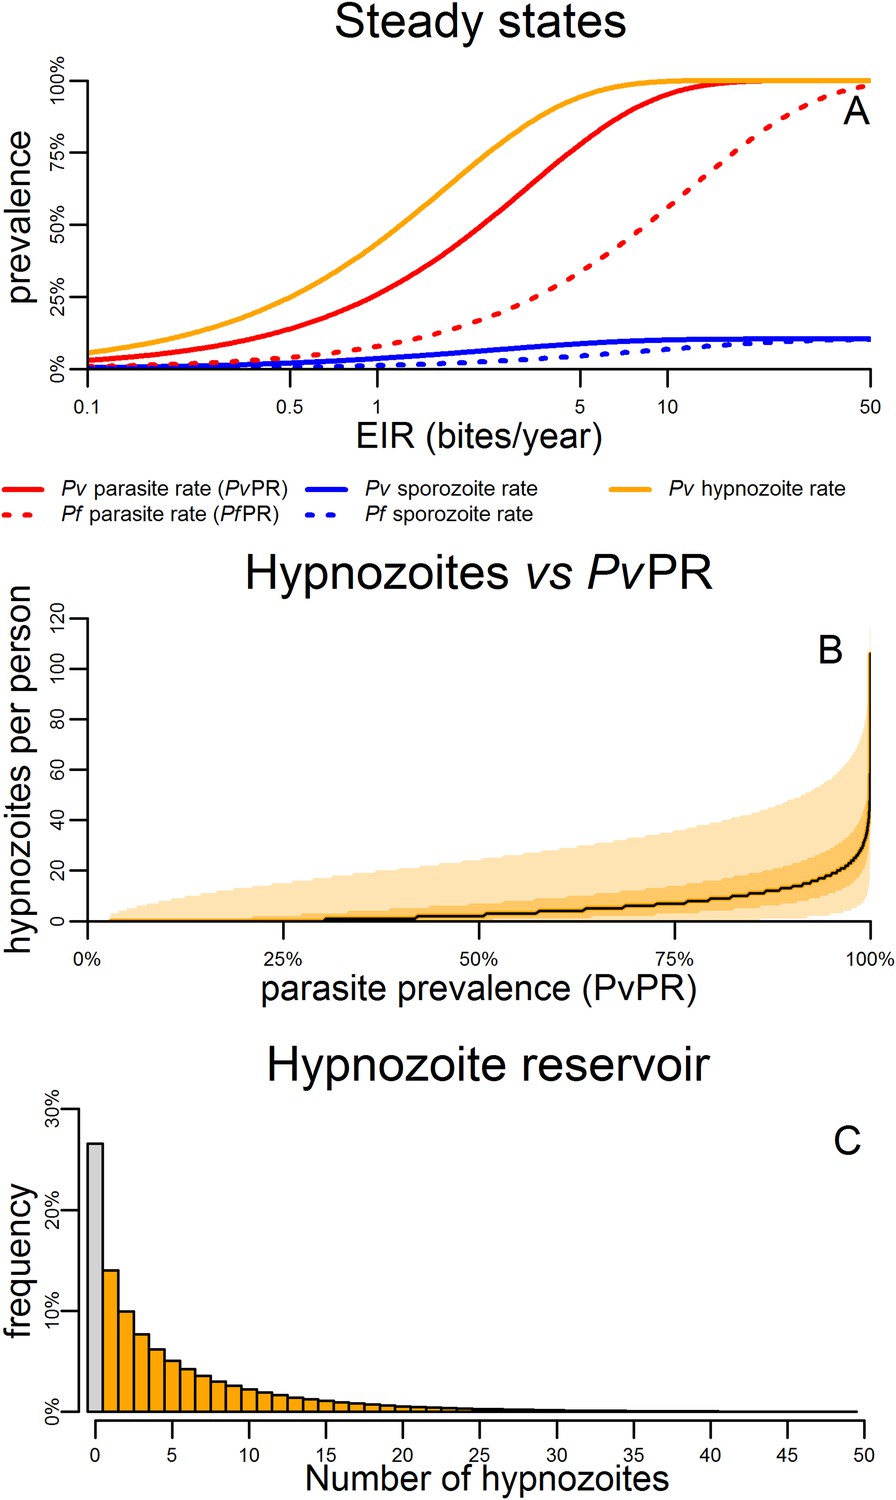
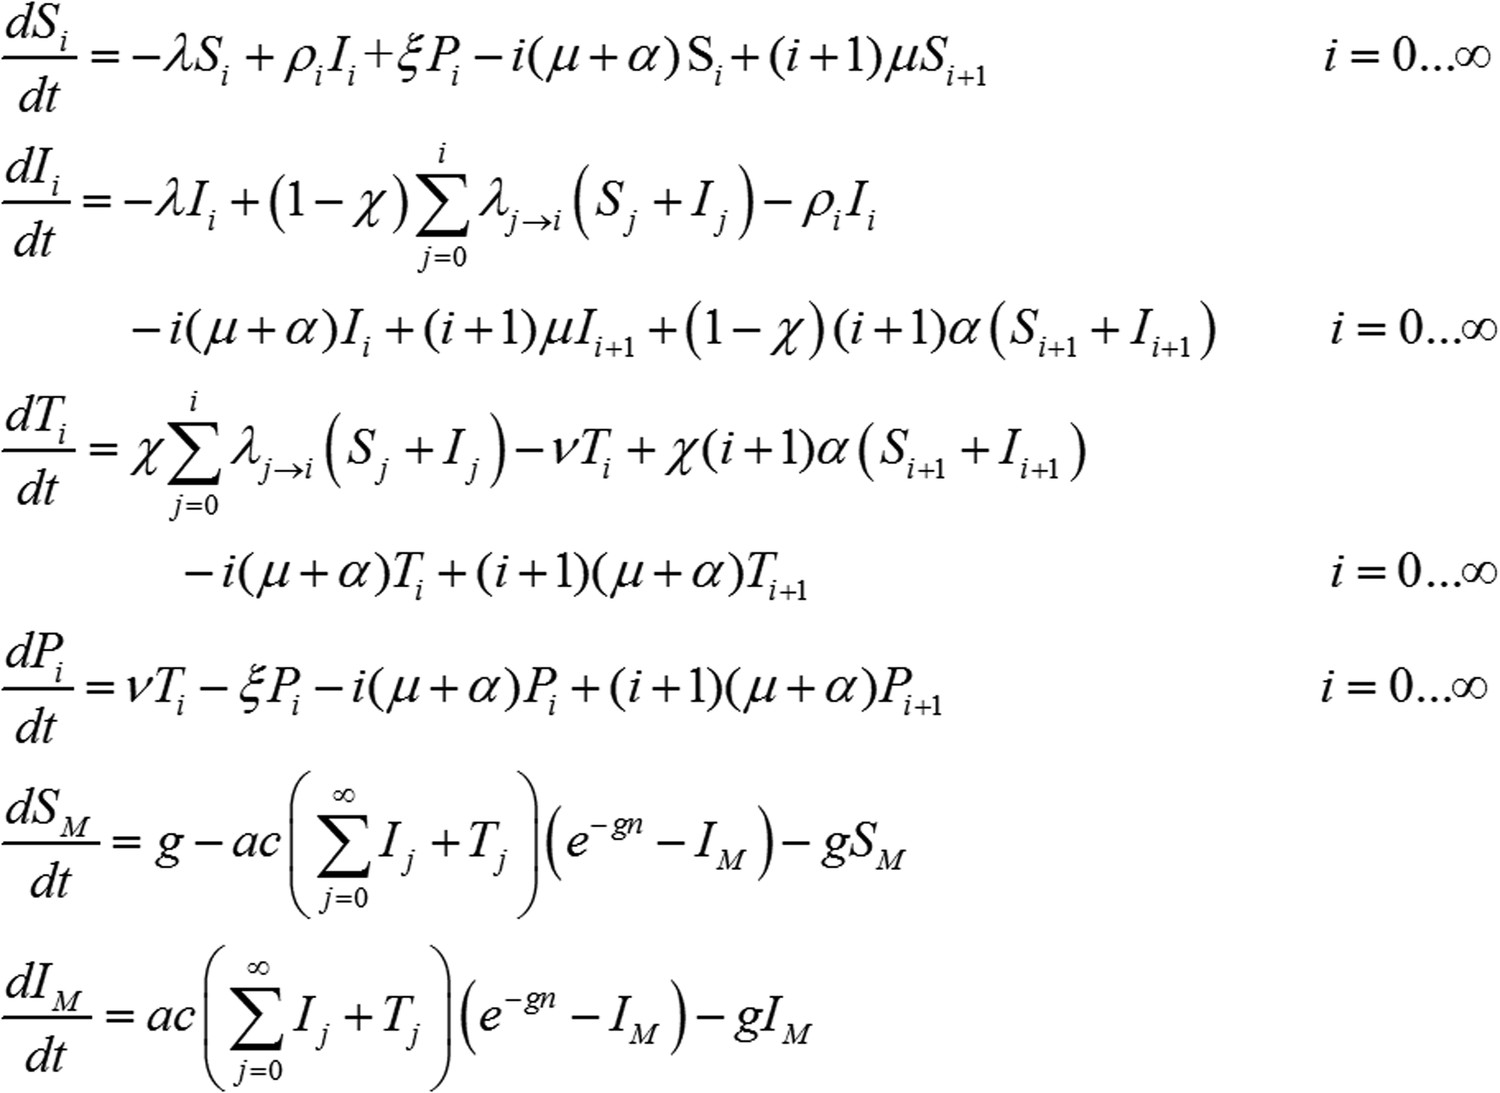
Within-host model for tropical relapses embedded in a P. vivax transmission model.
(A) The statics (estimated equilibrium prevalence) of P. vivax and P. falciparum transmission for different values of the entomological inoculation rate (EIR). EIR was varied by changing the number of mosquitoes per person m. (B) The number of hypnozoites per person is expected to increase with transmission intensity. The black line denotes the median number of hypnozoites, and the shaded areas denote the 50% and 95% ranges. (C) The distribution of the hypnozoite reservoir when PvPR = 50%. The grey bar represents individuals with zero hypnozoites.
Figure 5 with 2 supplements
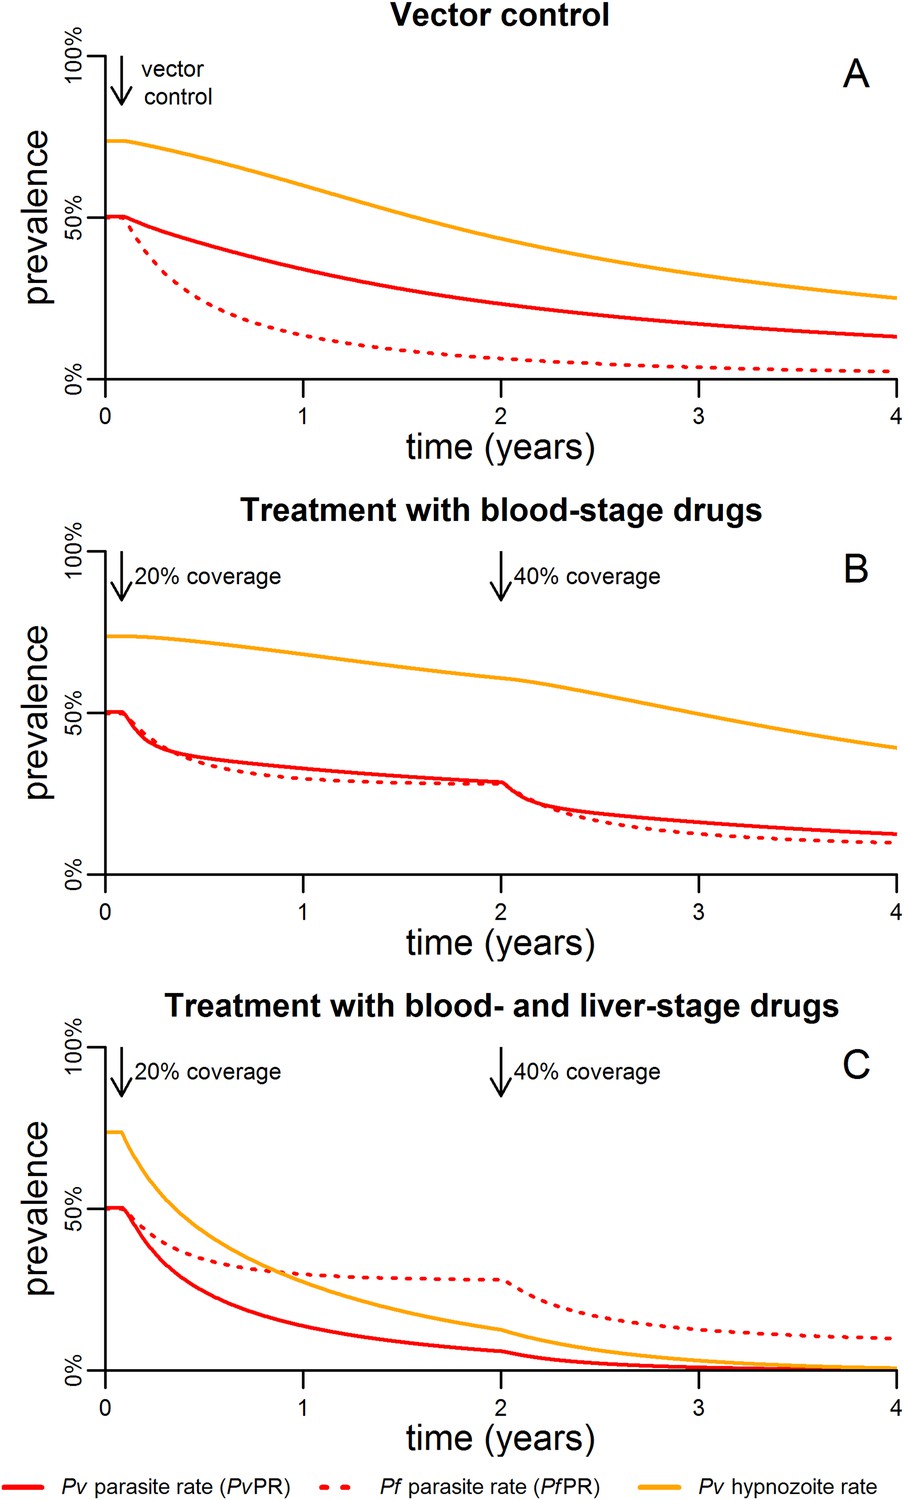
Timelines for malaria control.
(A) The introduction of vector control with ITNs or IRS (assumed to increase mosquito mortality by 30%) is predicted to cause substantial reductions in both PvPR and PfPR. (B) Simulated effect of expanding first-line treatment with blood-stage anti-malarial drugs (e.g., chloroquine or ACTs) so that 20% and 40% of new blood-stage infections are treated. (C) Simulated effect of first-line treatment with a combined regimen of blood-stage anti-malarials and primaquine to remove liver-stage hypnozoites.
Figure 5—figure supplement 1
Transmission model incorporating treatment of new infections with blood-stage anti-malarials.
Treatment coverage χ is assumed, that is, the proportion of new blood-stage infections that receive treatment with blood-stage anti-malarials. There will be a delay between the emergence of parasites into the blood-stream and the administration of treatment following symptoms. This stage is described by treatment compartment Ti and lasts 1/ν = 7 days. Importantly, transmission to mosquitoes is possible during this stage as P. vivax gametocytes (the sexual stage of the parasite that can be transmitted to mosquitoes) are present in the blood very early on in the infection. Following treatment, individuals progress to a period of prophylactic protection Pi, during which they are not susceptible to new blood-stage infections but may still acquire hypnozoites from new bites from infectious mosquitoes. It is assumed that individuals remain under prophylactic protection for 1/ξ = 14 days after which they return to being susceptible Si.
Figure 5—figure supplement 2
Transmission model incorporating treatment of new infections with blood-stage anti-malarials and primaquine.
The incorporation of primaquine into first-line treatment regimens is accounted for by assuming that treatment clears all hypnozoites from the liver as well as clearing blood-stage infections. A 14 day daily dosing regimen of primaquine which has proven efficacy at preventing relapses. In particular we assume treatment eliminates all hypnozoites, so that treated individuals move to compartment P0 (under prophylaxis from treatment and with all hypnozoites removed). The 14 day treatment regimen is assumed to provide a period of prophylactic protection against new hypnozoite infection, that is, new hypnozoites cannot be acquired while primaquine is being administered.
Figure 6

Targeting the hypnozoite reservoir.
Proportion of the population infected with 1–2, 3–9 or 10+ hypnozoites following the introduction of a first-line treatment regimen with blood-stage anti-malarial drugs and primaquine. Individuals with large numbers of hypnozoites are more likely to experience new blood-stage infections and hence become targeted for treatment and have their hypnozoites removed. This results in a selective targeting of the most intensely infected individuals.
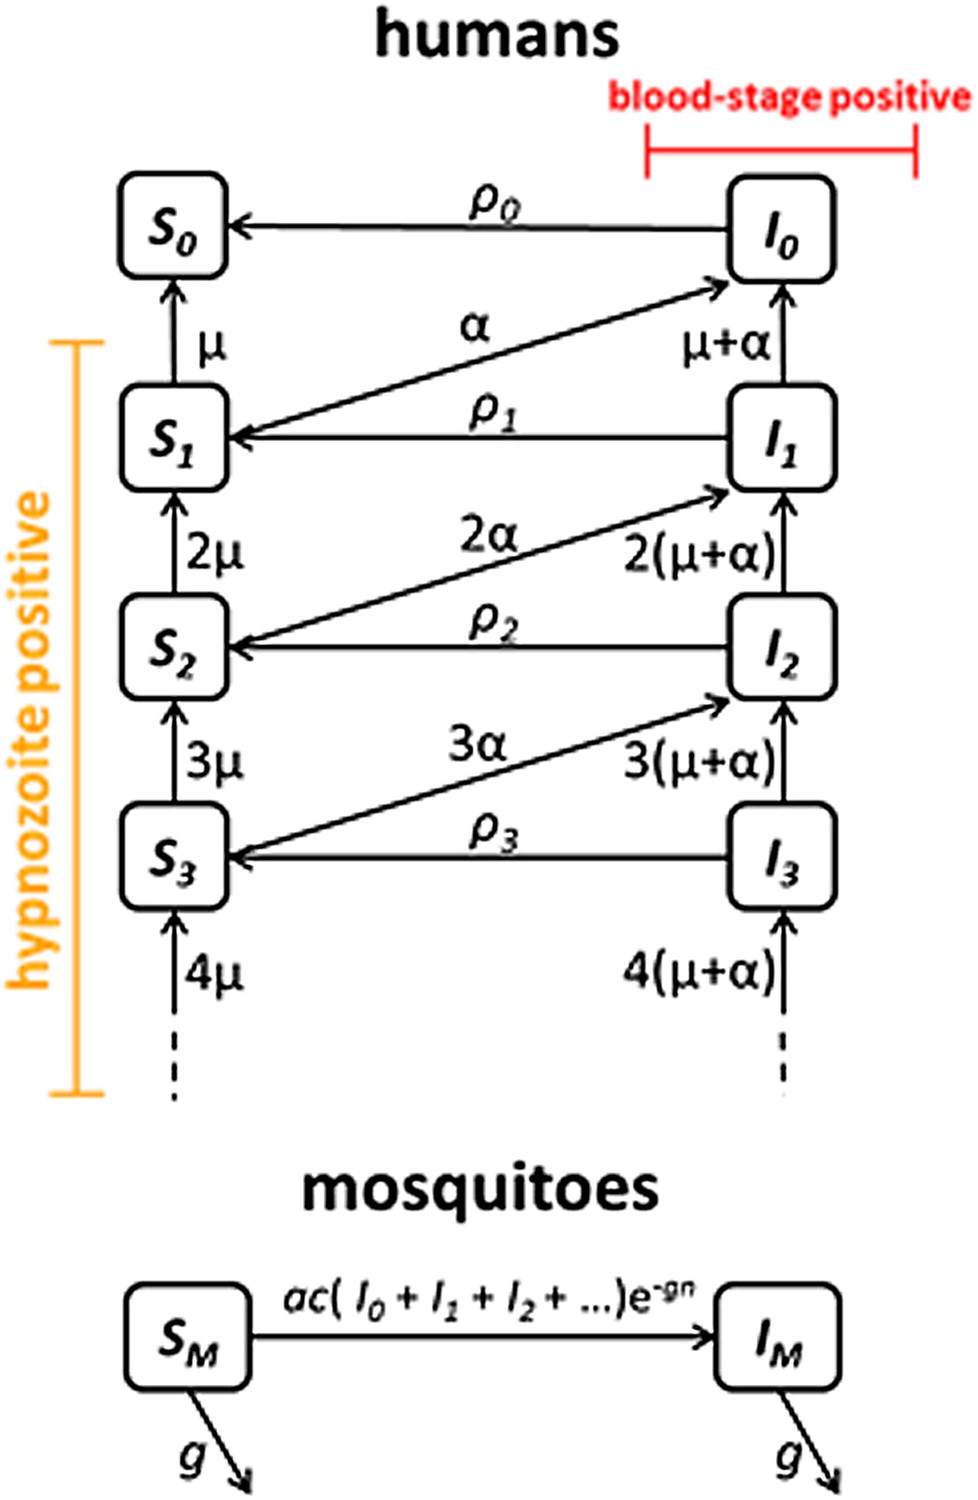
Figure 7 with 1 supplement

Within-host model schematic of relapsing hypnozoites in the liver.
Hypnozoites from tropical strains of P. vivax will progress to the relapsing phase where they are subject to two processes: death and activation leading to relapse. Hypnozoites from temperate strains will begin in a temperate long-latency phase where they must wait before progressing to the relapsing phase.
Figure 7—figure supplement 1
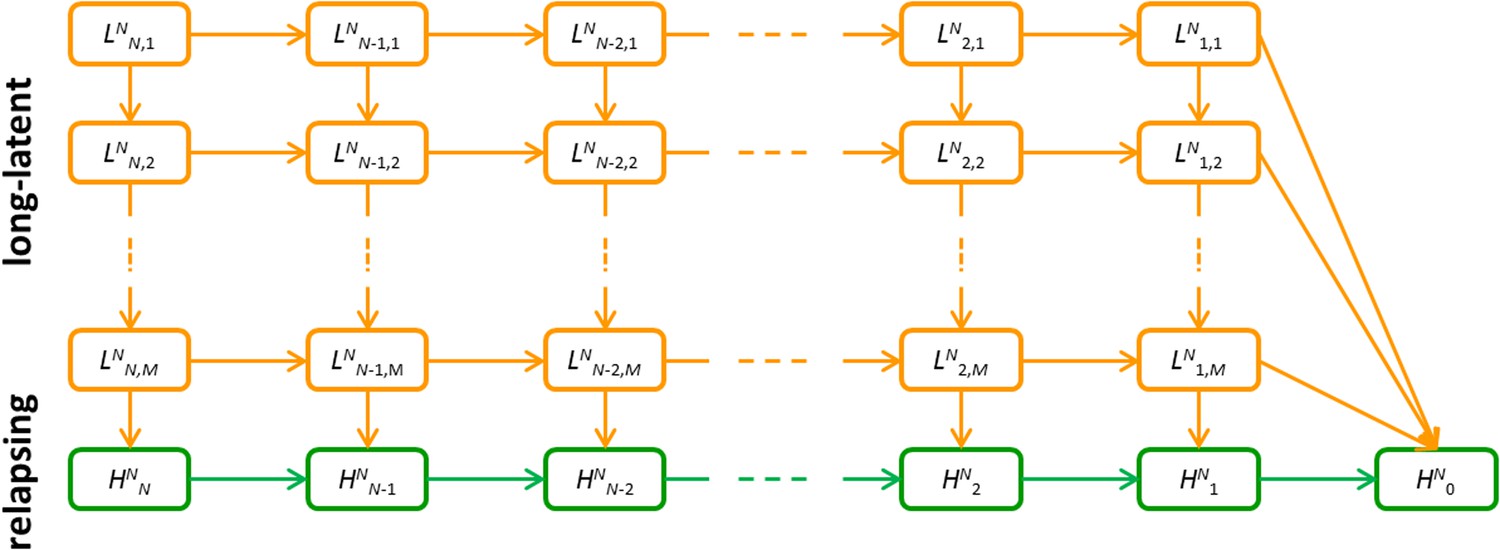
Detailed model schematic of the within-host relapse model.
Orange compartments denote the temperate long-latency phase. Green compartments denote the relapsing phase. Superscript N denotes that the infection began with N hypnozoites. In the long-latency phase, sub-script i, j denotes i hypnozoites in the jth compartment for progressing through the long-latency phase. In the relapsing phase, subscript i denotes the number of hypnozoites. An individual infected with N hypnozoites of a tropical strain begins in the HNN compartment and progresses to HN0 as hypnozoites activate or die. An individual infected with N hypnozoites of a temperate strain begins in the LNN,1 compartment, and progresses down the flow diagram through the M steps during the period of long-latency. During this time they may also move to the right along the flow diagram as the number of hypnozoites reduces due to death. After passing through the M compartments for the long-latency phase, infections will enter the relapsing phase where relapse can occur.
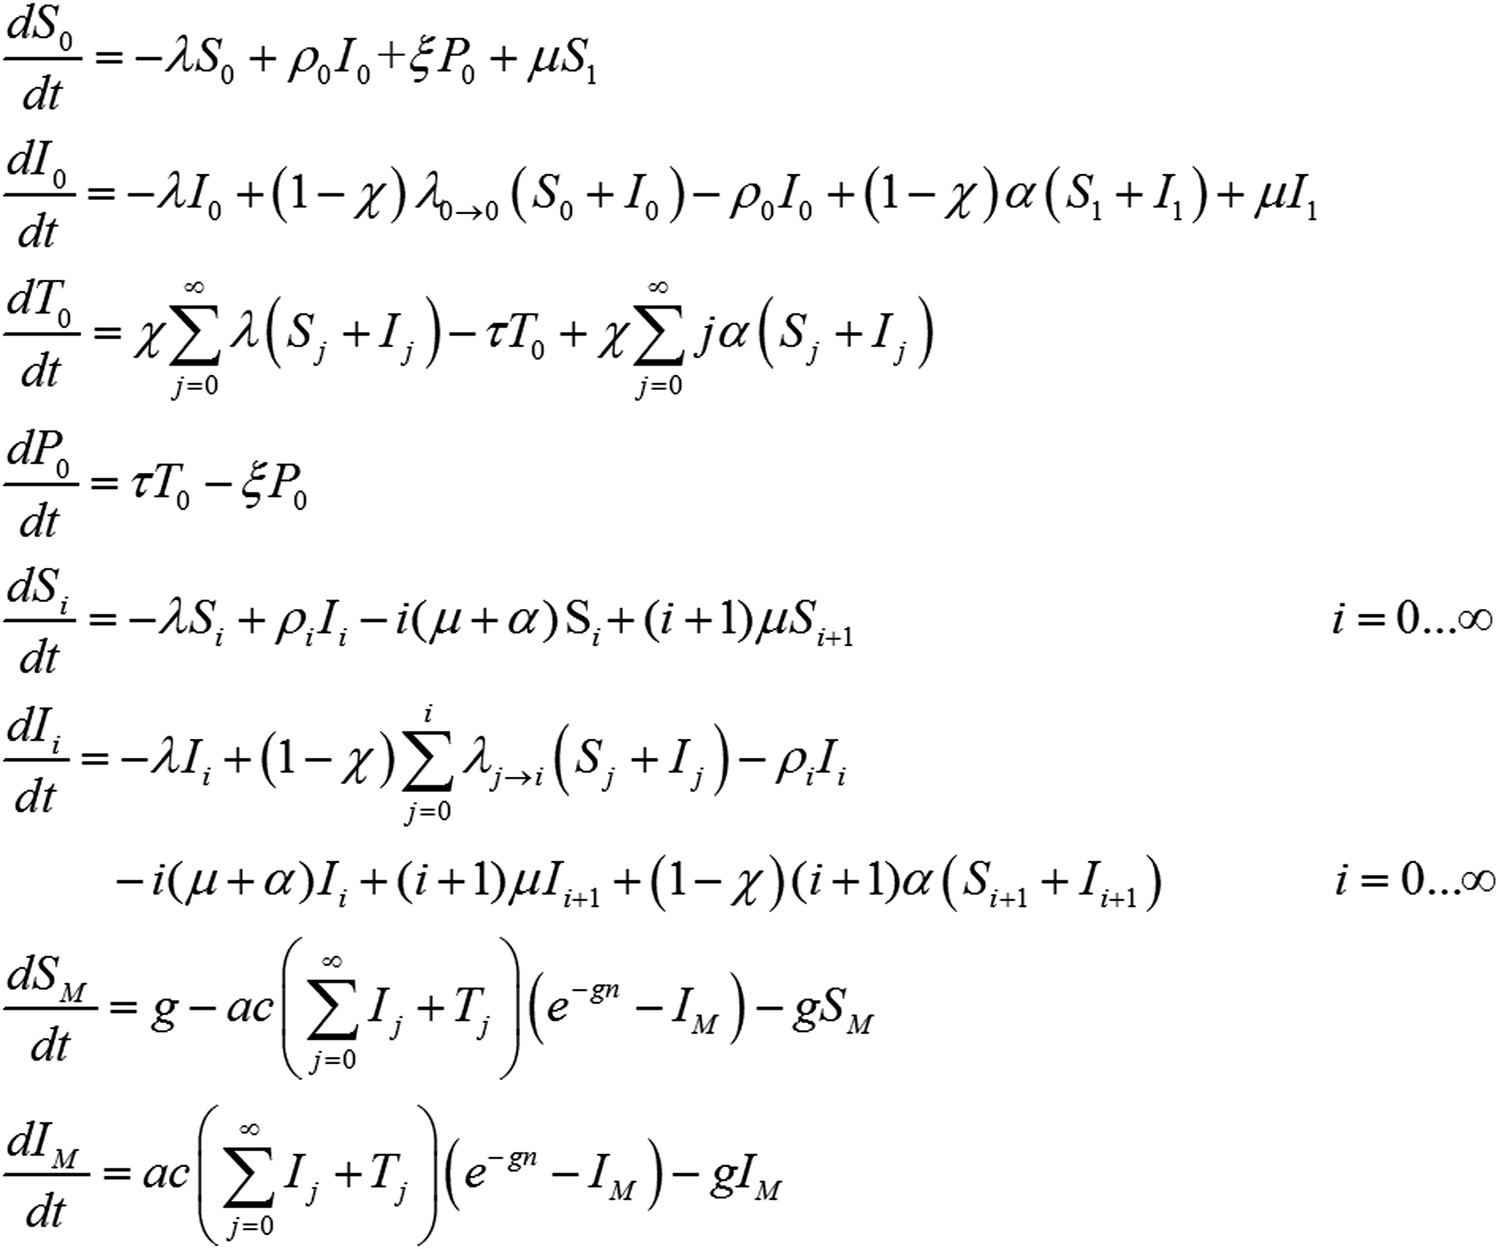
Figure 8
Transmission model schematic.
Within-host model for tropical relapses embedded in a transmission model. Si denotes the proportion of humans susceptible to blood-stage infection with i hypnozoites. Ii denotes the proportion of humans with blood-stage infections carrying i hypnozoites. Individuals in all compartments are exposed to primary infections at rate λ, following which they will move down the flow diagram to a compartment representing blood-stage infection and carrying a greater number of hypnozoites.
Author response image 1
Tables
Table 1
Description of model parameters
| Parameter | Description | Value | Reference |
|---|---|---|---|
| Within-host | |||
| N | number of hypnozoites per infection | 8.5 | estimate* |
| α | rate of hypnozoite activation | 1/332 day−1 | estimate* |
| µ | rate of hypnozoite/hepatocyte death | 1/425 day−1 | estimate* |
| d | duration of temperate long-latency | 180 days | (Battle et al., 2014) |
| σd | standard deviation of temperate long-latency | 30 days | (Battle et al., 2014) |
| M | number of compartments for simulating long-latency: M = (d/σd)2 | 36 | |
| δ | rate of progression through long-latency compartments: δ = M/d | 0.2 day−1 | |
| Humans | |||
| b | transmission probability: mosquito to human | 0.5 | (Smith et al., 2010) |
| r | rate of clearance of blood-stage infections | 1/60 day−1 | (Collins et al., 2003) |
| f | relapse frequency (1/time to first relapse) | 1/76 day−1 | Equation 6 |
| h | expected number of relapses | 4.7 | Equation 4 |
| γ | rate of hypnozoite clearance | 1/420 day−1 | Equation 5 |
| Mosquitoes | |||
| a | mosquito biting frequency | 0.21 day−1 | (Garrett-Jones, 1964) |
| g | mosquito death rate (1/mosquito life expectancy) | 0.1 day−1 | (Gething et al., 2011b) |
| m | number of mosquitoes per human | calculated | |
| n | duration of sporogony in mosquito | 12 days | (Gething et al., 2011b) |
| c | transmission probability: human to mosquito | 0.23 | (Bharti et al., 2006) |
-
*
Based on estimates from South East Asian tropical strains.
Additional files
-
Supplementary file 1
Estimated parameters for the within-host relapse.
- https://doi.org/10.7554/eLife.04692.018
-
Source data 1
‘Individual_Level_Relapse_Data.xlsx’: Data on time to first relapse infection from Battle et al Malaria Journal 2014, 13:144.
- https://doi.org/10.7554/eLife.04692.019
Download links
A two-part list of links to download the article, or parts of the article, in various formats.
Downloads (link to download the article as PDF)
Open citations (links to open the citations from this article in various online reference manager services)
Cite this article (links to download the citations from this article in formats compatible with various reference manager tools)
Modelling the contribution of the hypnozoite reservoir to Plasmodium vivax transmission
eLife 3:e04692.
https://doi.org/10.7554/eLife.04692


