Genes associated with ant social behavior show distinct transcriptional and evolutionary patterns
- Okinawa Institute of Science and Technology, Japan
- Australian National University, Australia
- University of Pennsylvania, United States
Figures
Figure 1 with 3 supplements
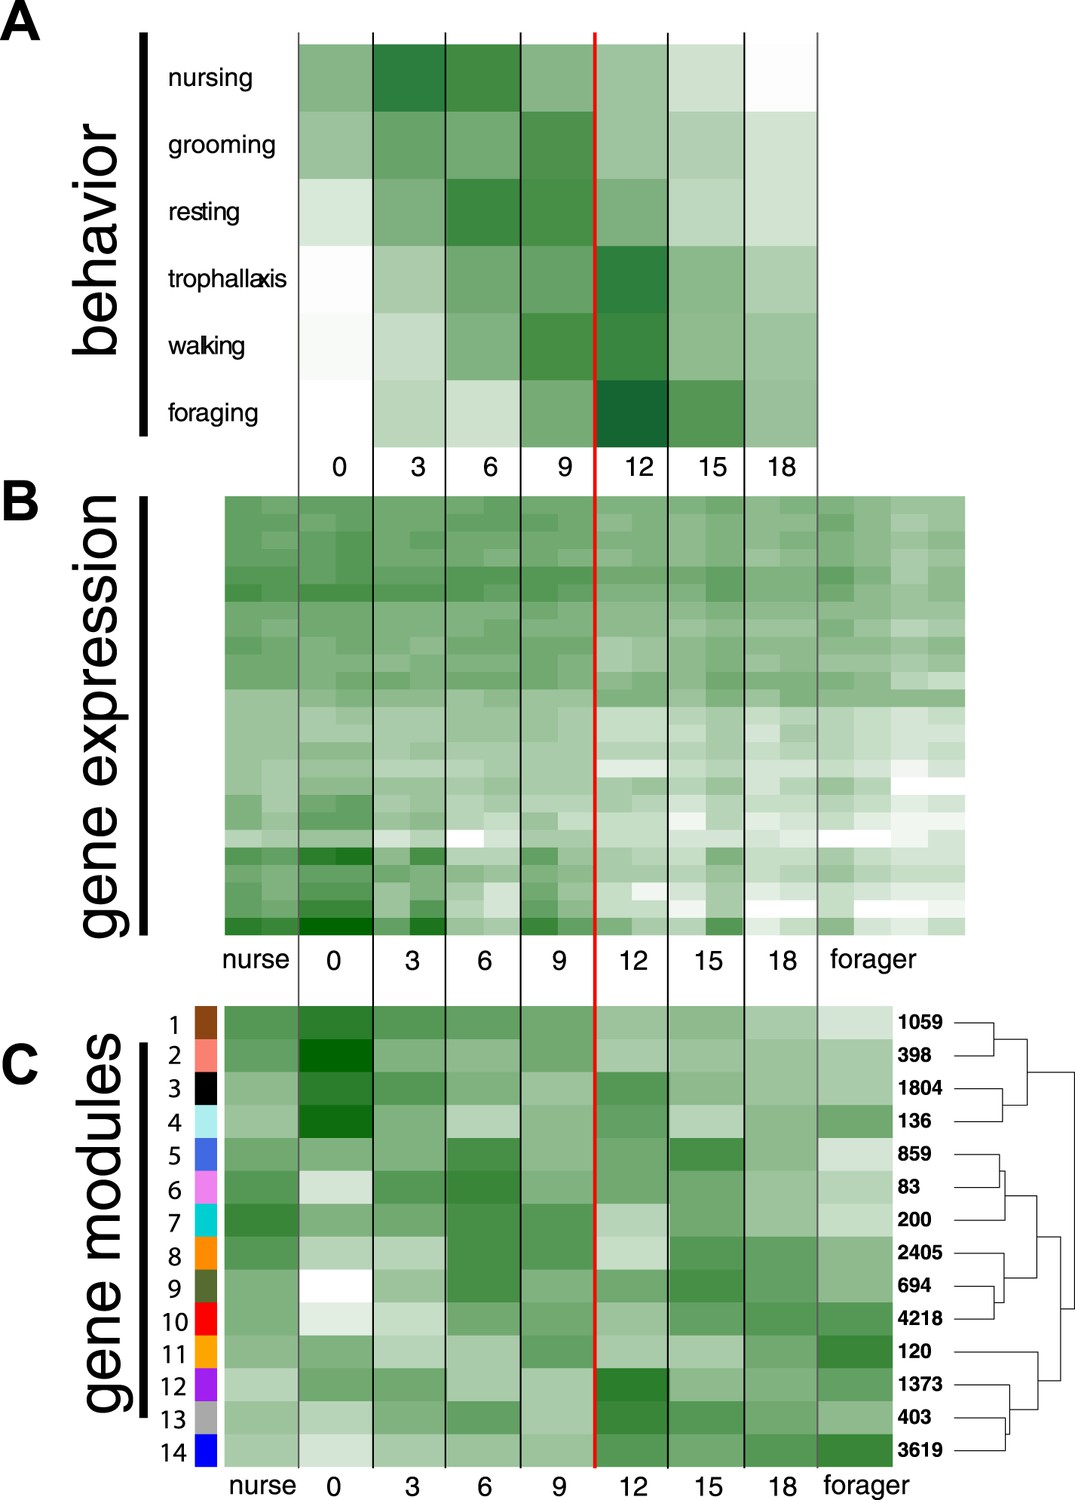
Behavioral and transcriptional changes associated with worker age and behavior.
Numbers along the x-axis represent ages of marked worker cohorts, starting at worker eclosion as an adult (day 0). In all plots dark green represents greater values, while white represents lower values of the measure being plotted. (A) Behavioral results. Workers showed an age-dependent progression of activity, progressing from tasks such as nursing and grooming in the nest to outside tasks such as walking and foraging. (B) Heat map of expression levels over the course of worker aging (higher expression in darker green), for 25 genes most differentially expressed between nurses and foragers. The red line separates the samples classified as ‘nurses’ by K-nearest neighbor classification on the left, from ‘foragers’ on the right, suggesting a distinct transition between the two categories. (C) Correlation between patterns of expression in the 14 identified modules across worker age and behavior. The colors of the boxes are scaled with the value of correlation coefficients, ranging from white to dark green. On the right side of the heat map are the numbers of genes in each module and a dendrogram showing the inferred relationships among modules. The modules show complex patterns of expression, for example with some most highly expressed at age 0, some showing decreasing expression over time, and some increasing expression over time.
Figure 1—figure supplement 1
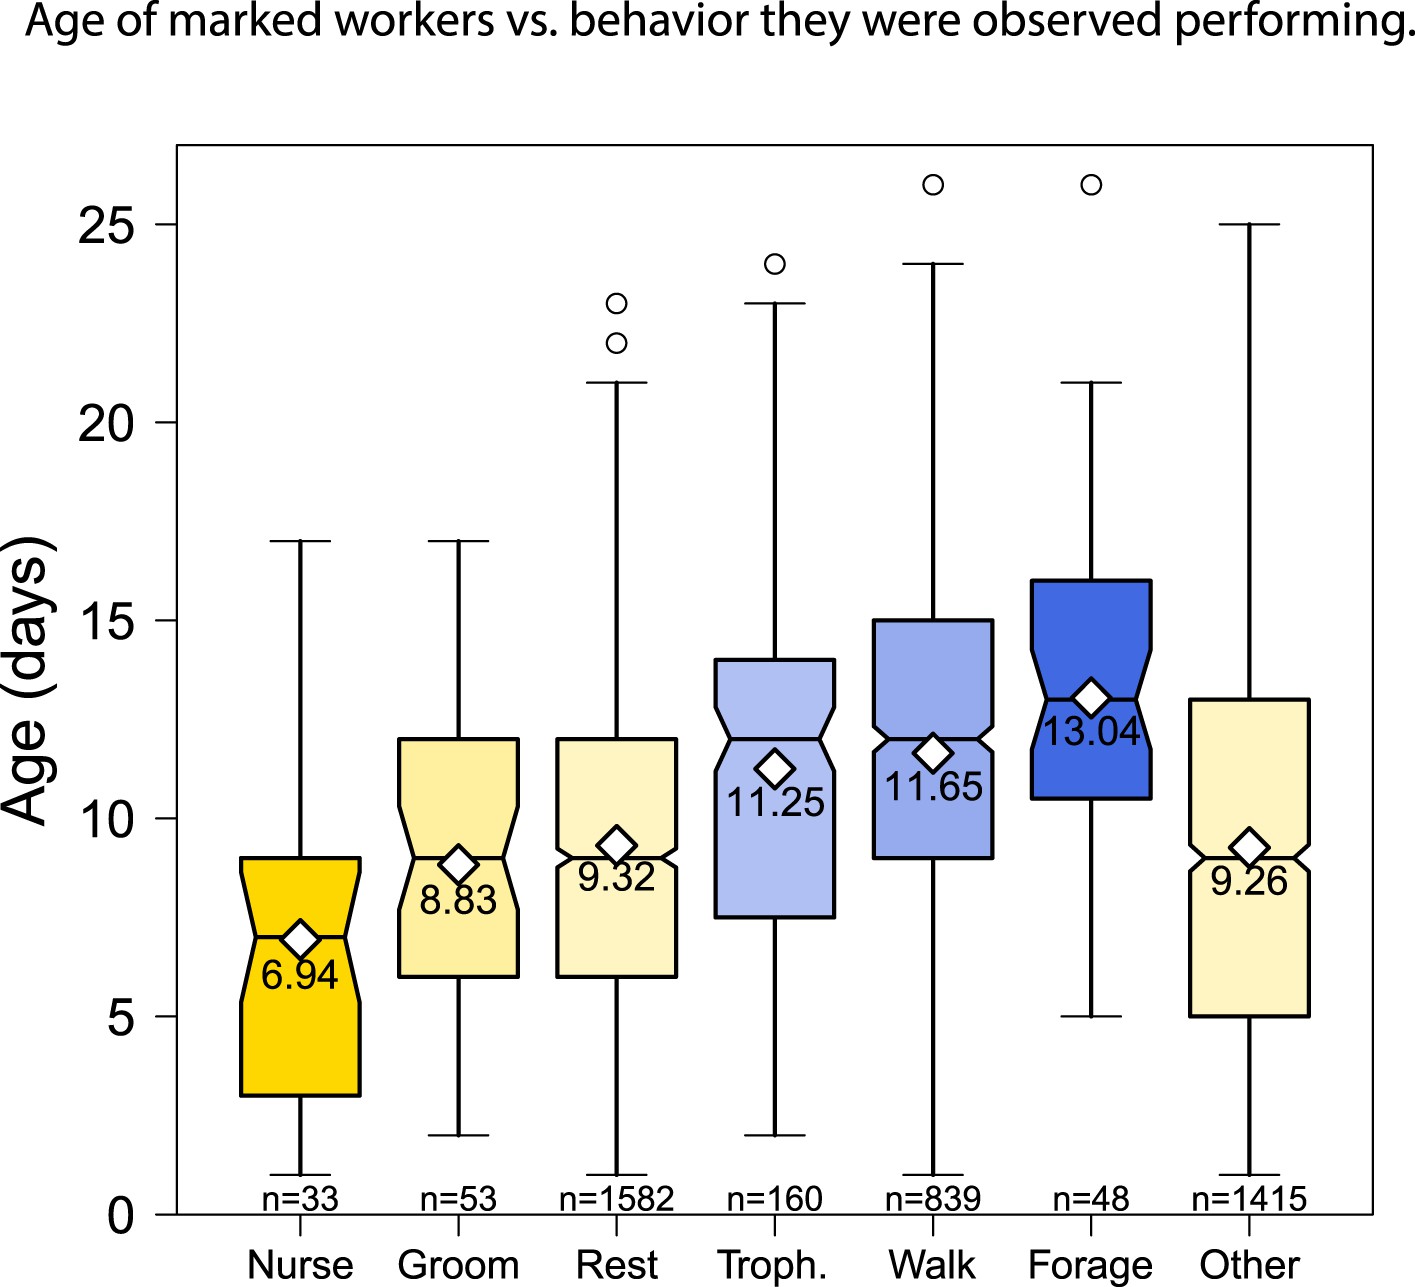
The behaviors performed by age-marked workers changed as the workers aged, from nursing to foraging.
Boxplots show the distribution of age in days for each behavior; white diamonds and the printed number show the mean age for each behavior; and the number of observations for each behavior is shown at the bottom of the graph.
Figure 1—figure supplement 2
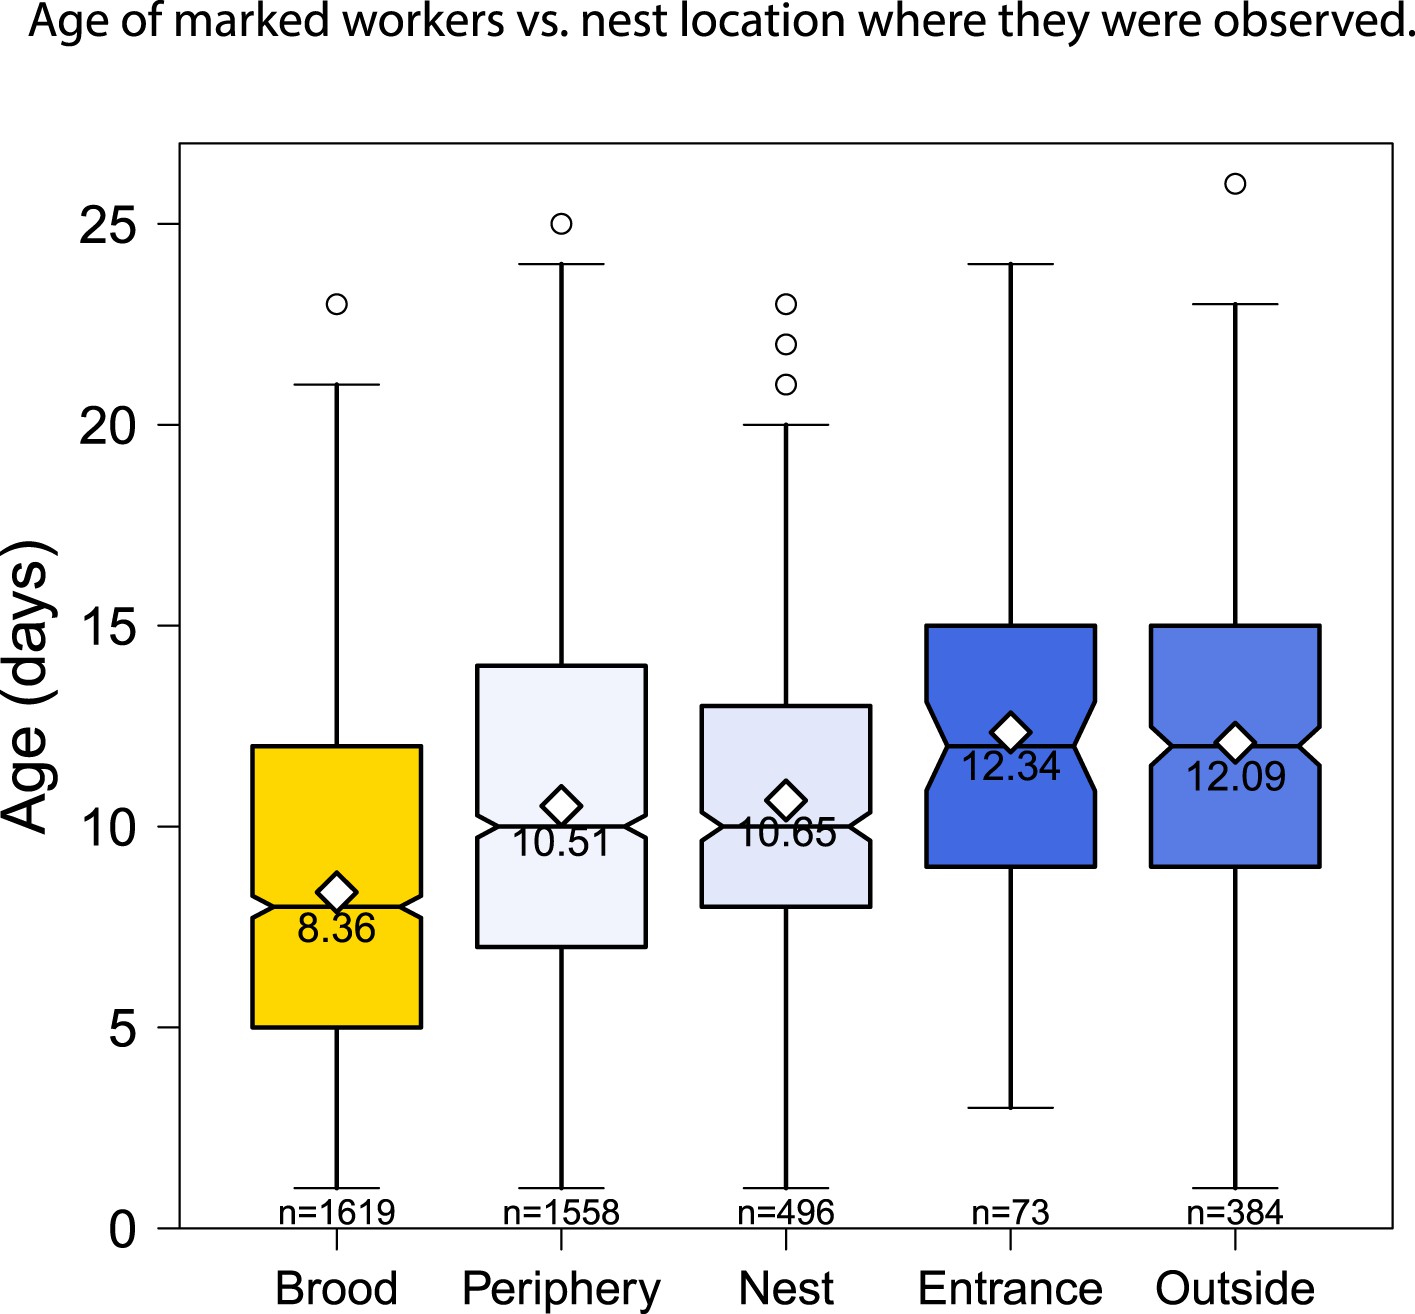
The location of age-marked workers also changed as the workers aged, from the nest area over the brood to outside the nest.
Boxplots show the distribution of age with the mean and sample size for each category.
Figure 1—figure supplement 3
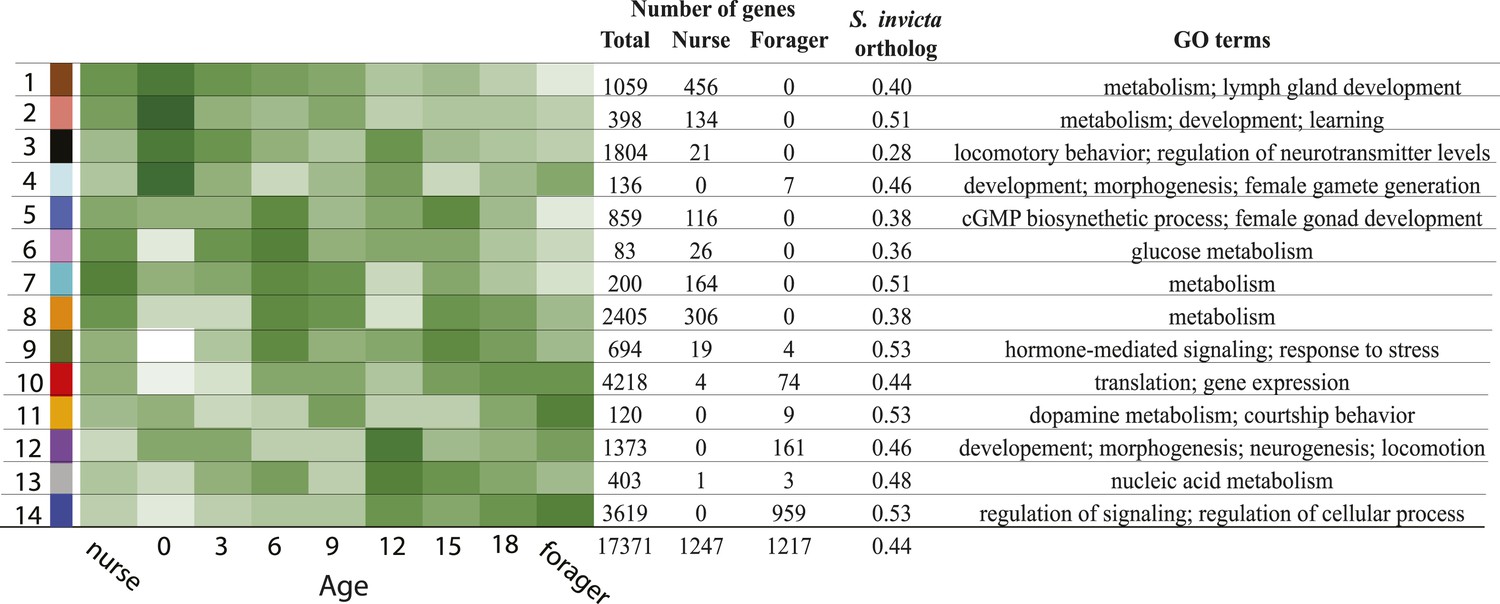
The identified modules vary in expression pattern, composition of nurse-upregulated and forager-upregulated genes, and the proportion of conserved genes with identified fire ant orthologs.
The total number of genes, number of nurse-upregulated genes, and forager-upregulated genes are shown, along with the proportion of identified fire ant orthologs and prominent gene ontology terms enriched for each module (see Supplementary file 4 for the full GO enrichment profiles for each module). Both the module number and associated module color are shown on the left.
Figure 2
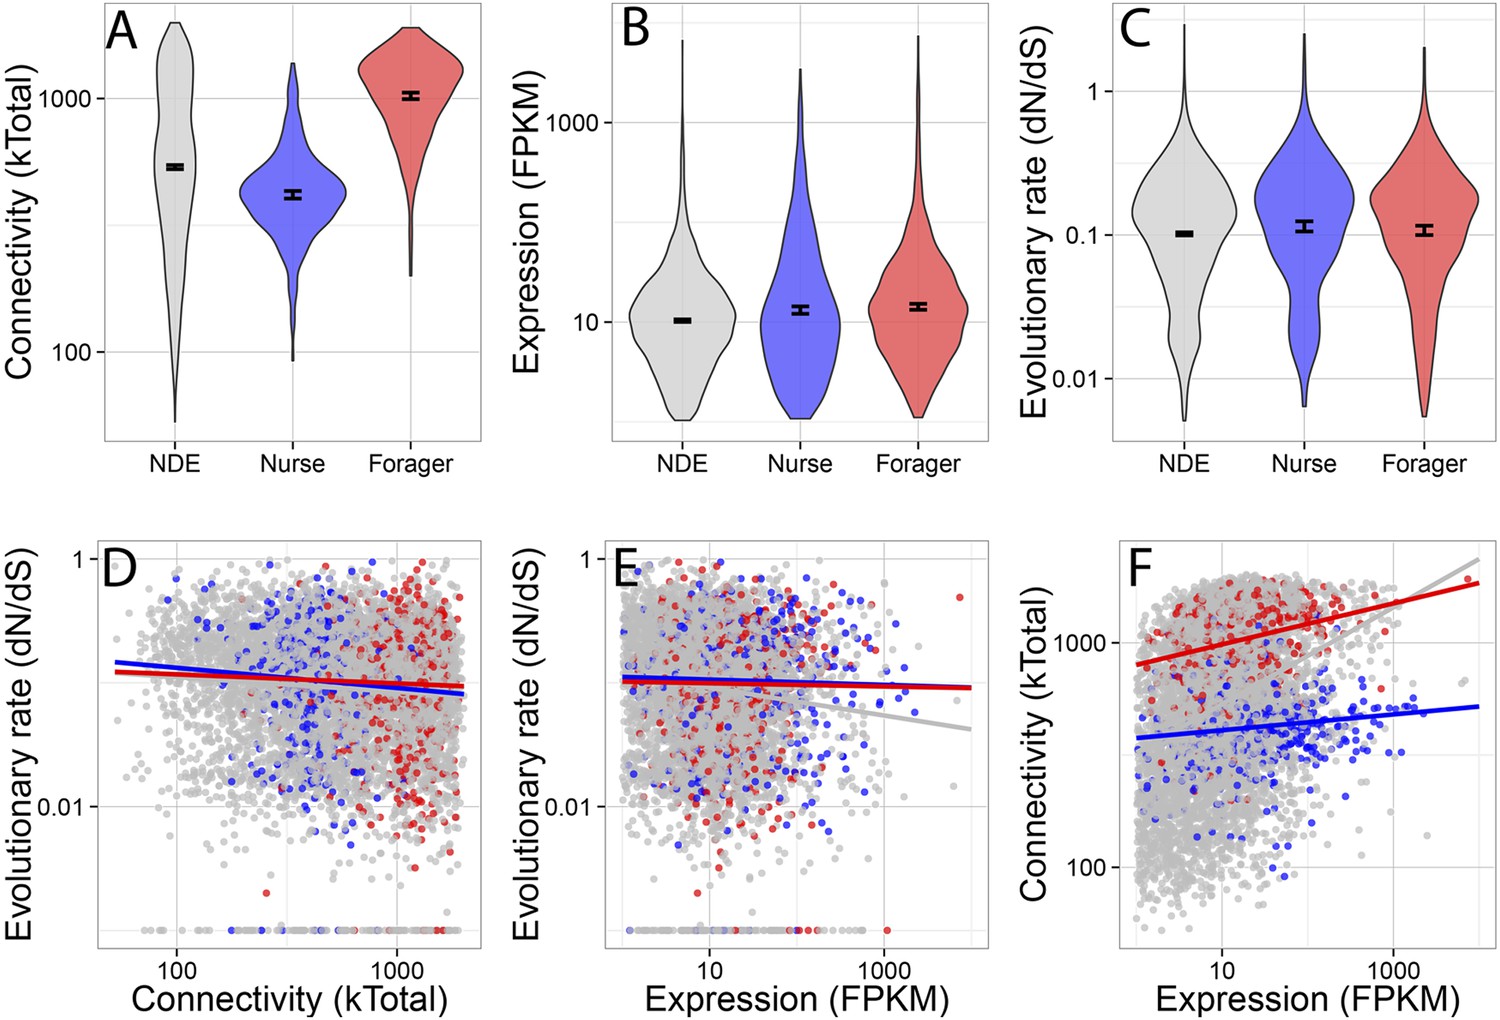
Connectivity, expression, and evolutionary rate for nurse-upregulated (blue), forager-upregulated (red), and non-differentially expressed genes (gray).
Overall, connectivity and expression are positively correlated (F) and negatively associated with evolutionary rate (D and E), as expected. At the same time, forager-upregulated genes are much more strongly connected while nurse-upregulated genes are more loosely connected compared to non-differentially expressed genes (A); Nurse-upregulated genes have a small but significant increase in evolutionary rate (C); and both forager- and nurse-upregulated genes are more highly expressed than non-differentially expressed genes (B). The top panels show results for all data, while the bottom panels show results only for genes with S. invicta orthologs that had estimated evolutionary rates.
Figure 3 with 1 supplement

Genes with identified fire ant orthologs were more highly connected and expressed, but this relationship also depended on whether the gene was nurse-upregulated (blue), forager-upregulated (red), or non-differentially expressed (NDE, gray).
As shown in Figure 2, forager-regulated genes were much more highly connected, and overall, forager-upregulated genes had a higher proportion of identified fire ant orthologs (0.54) relative to nurse-upregulated and non-differentially expressed genes (0.43).
Figure 3—figure supplement 1
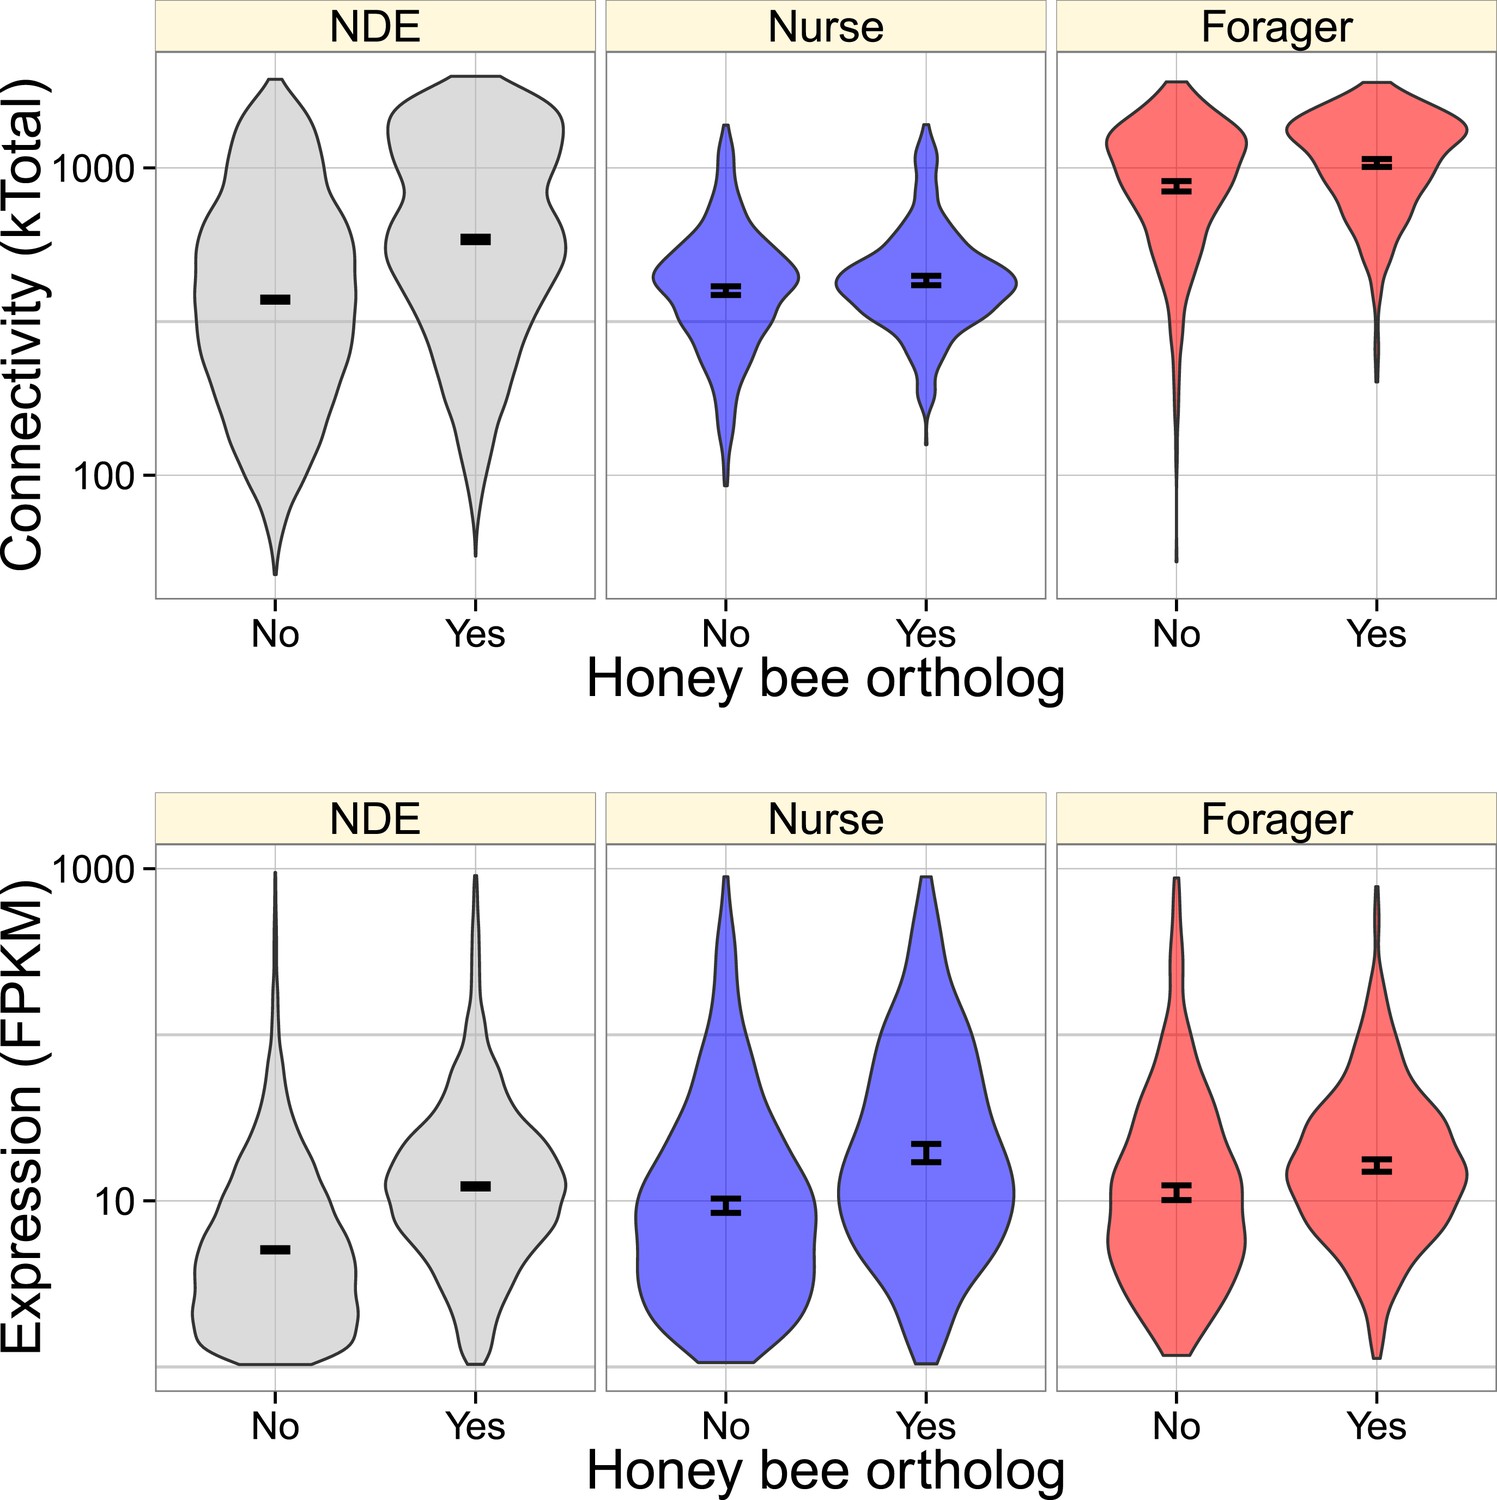
Very similarly to Figure 3, genes with identified honey orthologs were more highly connected and expressed, but this relationship also depended on whether the gene was nurse-upregulated (blue), forager-upregulated (red), or non-differentially expressed (NDE, gray).
Forager-upregulated genes had a higher proportion of identified honey bee orthologs (0.50) relative to nurse-upregulated and non-differentially expressed genes (0.38).
Additional files
-
Supplementary file 1
Table with a list of behaviors observed during the study; behavioral code, name of the behavior, description of the behavior, the label for the behavior used in the main text are shown, and the total number of observations for each behavior are shown.
- https://doi.org/10.7554/eLife.04775.010
-
Supplementary file 2
A PDF of the full R script and abbreviated output with the analyses included in the study.
- https://doi.org/10.7554/eLife.04775.011
-
Supplementary file 3
A table showing the results of Gene Ontology enrichment analysis for the set of genes upregulated in foragers and nurses. The columns show: the GO Biological Process ID, the p value, Odds Ratio, Expected Count, Observed Count, and total number of genes in the data set matching the GO term, a description of the GO term, whether the term was enriched for forager-upregulated genes or nurse-upregulated genes, and finally whether the term is over- or underrepresented.
- https://doi.org/10.7554/eLife.04775.012
-
Supplementary file 4
A table showing the results of Gene Ontology enrichment analysis for genes within each of the 14 identified co-expression modules. The columns show: the GO Biological Process ID, the p value, Odds Ratio, Expected Count, Observed Count, and total number of genes in the data set matching the GO term, a description of the GO term, and the module number and module color in which the GO term was overrepresented.
- https://doi.org/10.7554/eLife.04775.013
-
Source code 1
Complete R Markdown script used in the analyses and to produce Supplementary file 2.
- https://doi.org/10.7554/eLife.04775.014
Download links
A two-part list of links to download the article, or parts of the article, in various formats.
Downloads (link to download the article as PDF)
Open citations (links to open the citations from this article in various online reference manager services)
Cite this article (links to download the citations from this article in formats compatible with various reference manager tools)
Genes associated with ant social behavior show distinct transcriptional and evolutionary patterns
eLife 4:e04775.
https://doi.org/10.7554/eLife.04775


