The small molecule ISRIB reverses the effects of eIF2α phosphorylation on translation and stress granule assembly
- Howard Hughes Medical Institute, University of California, San Francis, United States
- University of California, Berkeley, United States
Figures
Figure 1 with 4 supplements

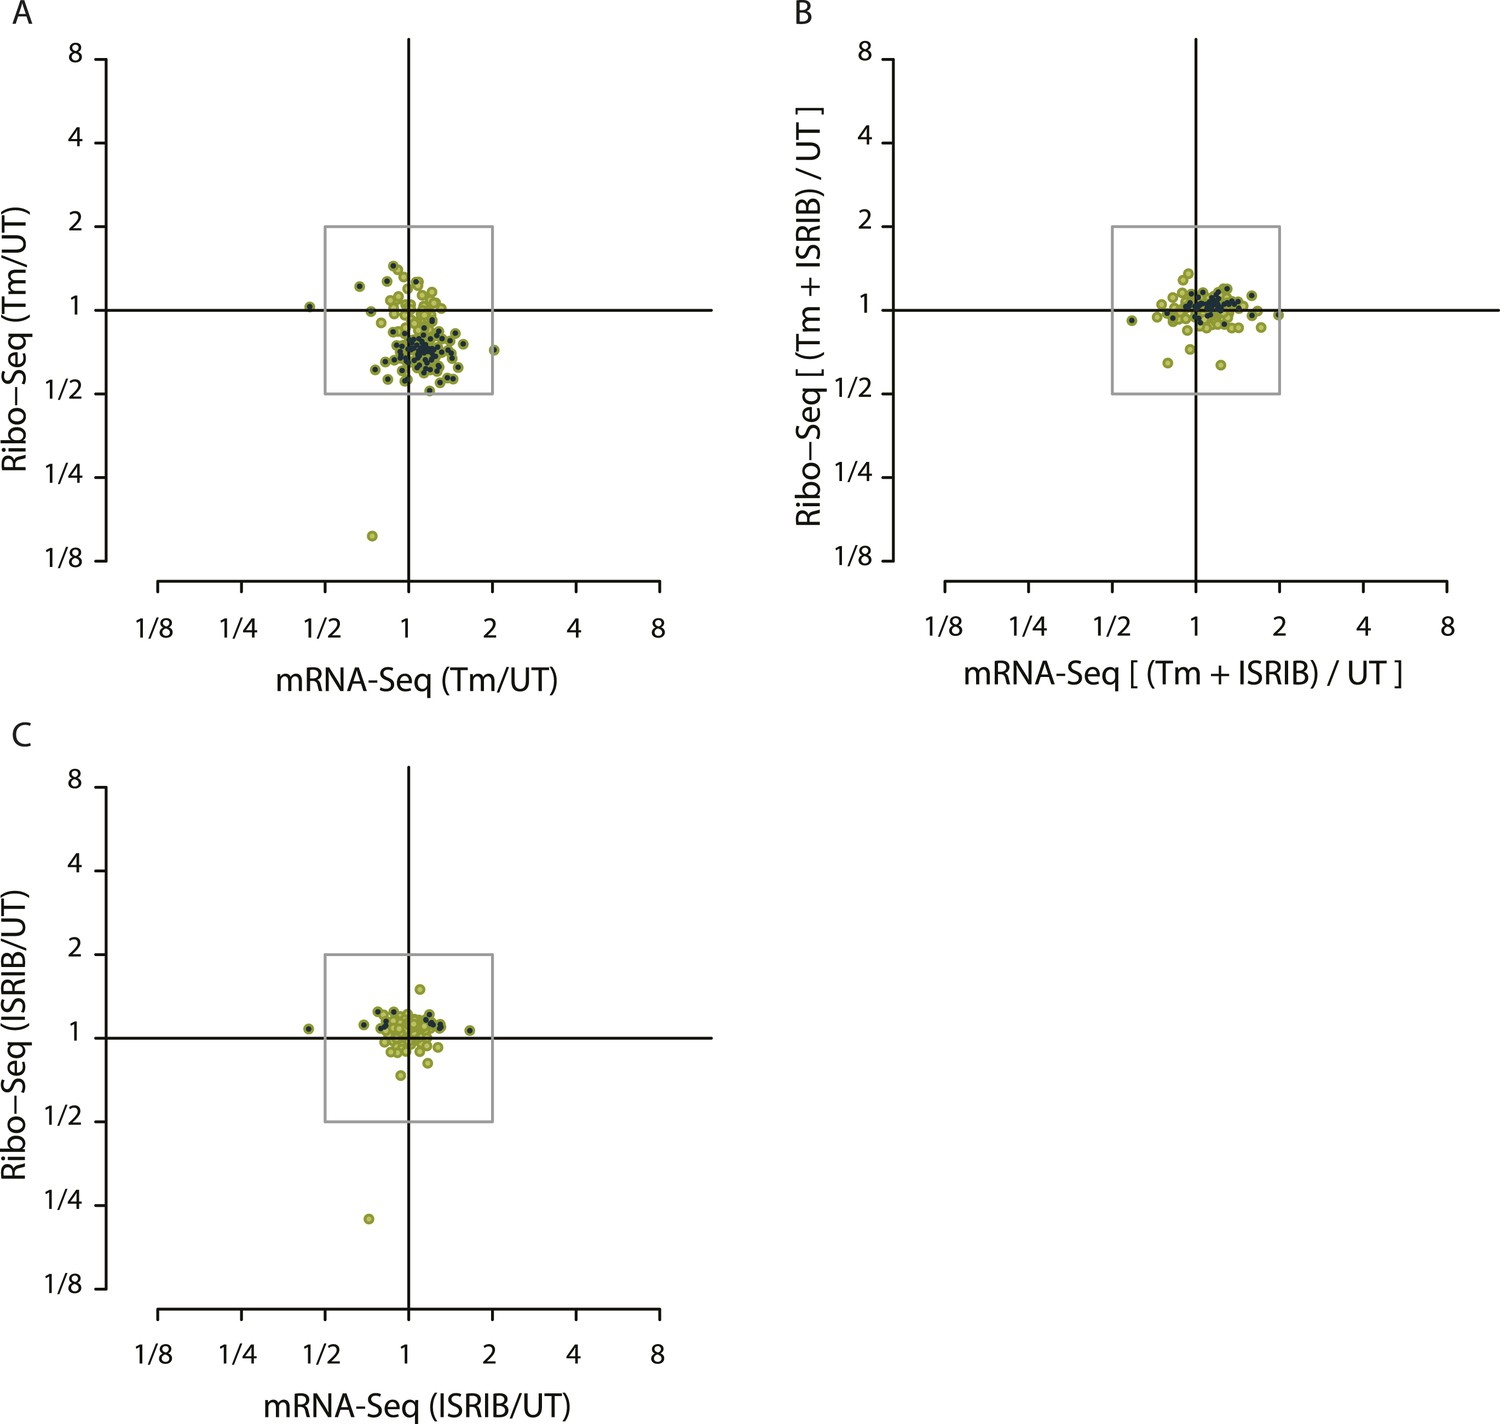
Translational regulation upon ER stress in mammalian cells.
(A) Translational and mRNA changes in HEK293T cells upon ER stress. HEK293T cells were treated with or without 1 μg/ml of Tm for 1 hr. The y-axis represents fold changes in ribosome-protected fragments (Ribo-Seq) between Tm-treated and control samples. The x-axis represents fold changes in mRNA levels (mRNA-Seq) between Tm-treated and control samples. Data points reflecting significant changes (FDR-corrected p-value < 0.1) between Tm treated and untreated (‘UT’) samples are shown in black and non-significant changes are shown in light grey. Note that genes with significant changes (black circles) are numerous in Tm-treated cells and thus the cloud of genes with no significant changes (grey circles) is mostly hidden in the background. Genes with substantially enhanced RFPs and uORFs that are known to be phospho-eIF2α-dependently regulated are labeled pink. ISR-translational targets that contain previously identified uORFs are labeled in green. Triangles denote genes that fall beyond the axis range. The genes inside the grey box are those that change less than twofold in RPF or mRNA reads. Figure 1—source data 2A contains a list of all genes that change more than twofold in RPFs during Tm induction (FDR-corrected p-value < 0.1, corresponding to black circles above and below the box). (B) Translational and mRNA changes in cells co-treated with Tm and ISRIB. HEK293T cells were treated with or without 1 μg/ml of Tm and 200 nM ISRIB for 1 hr. The y-axis represents fold changes in ribosome-protected fragments (Ribo-Seq) between Tm + ISRIB-treated and control samples. The x-axis represents fold changes in mRNA levels (mRNA-Seq) between Tm + ISRIB-treated and control samples. Genes that significantly change when ISRIB co-administration modulates the effects of Tm treatment are shown in black (FDR-corrected p-value < 0.1). Figure 1—source data 2C contains a list of all genes that change more than twofold in RPFs during Tm and ISRIB treatment (FDR-corrected p-value < 0.1). The identity of the ISR-translational targets that contain previously identified uORFs (labeled in green) was not included in this panel as they all collapsed to the center of the plot. (C) Translational and mRNA changes in ISRIB-treated cells. HEK293T cells were treated with or without 200 nM ISRIB for 1 hr. The y-axis represents fold changes in ribosome-protected fragments (Ribo-Seq) between ISRIB-treated and control samples. The x-axis represents fold changes in mRNA levels (mRNA-Seq) between ISRIB-treated and control samples. Data points reflecting significant changes (FDR-corrected p-value < 0.1) between ISRIB-treated and untreated (‘UT’) samples are shown in black and non-significant changes are shown in light grey. Figure 1—source data 2D contains a list of all genes that change more than twofold in RPFs during ISRIB treatment (FDR-corrected p-value < 0.1, corresponding to black circles outside of the box). ATF4 and SLC35A4 (labeled in this panel) showed reduced translational efficiency upon addition of ISRIB. Two biological replicates were analyzed per condition. Number of reads aligned to the genome and ORFs for all samples are found in Figure 1—source data 2E. Correlation plots for the replicates for each condition are found in Figure 1—figure supplement 3. mRNA abundance for all ORFs mapped are found in Figure 1—figure supplement 4. Read counts for all conditions and each individual transcript are found in Figure 1—source data 1. The Ribo-seq and mRNA-seq data have been deposited in NCBI's Gene Expression Omnibus and are accessible through GEO series accession number GSE65778.
-
Figure 1—source data 1
Read counts for all conditions and each individual transcript.
- https://doi.org/10.7554/eLife.05033.003
-
Figure 1—source data 2
Source data for Figure 1.
(A) Significant translational changes in Tm-treated cells. List of genes that change more than twofold in translational efficiency after 1 hr of Tm treatment. mRNA (Tm/UT) represents log2-fold changes in mRNA levels between Tm and untreated samples, and Ribo-Seq (Tm/UT) represents log2-fold changes in RPFs between Tm- and un-treated samples (UT). Only genes with a log2-fold change >|1| and a FDR-corrected p-value <0.1 were included in the table. Known ISR-translational targets are highlighted in pink and targets containing previously identified uORFs are highlighted in green. (B) ISR-translational targets containing uORFs. List of genes that change more than twofold in translational efficiency after 1 hr of Tm treatment and contain previously identified uORFs. Ribo-Seq (Tm/UT) represents log2-fold changes in RPFs between Tm- and un-treated samples (UT). (C) Significant translational changes in Tm and ISRIB-treated cells. List of genes that change more than twofold in translational efficiency after 1 hr of Tm and ISRIB treatment. mRNA [(Tm + ISRIB)/UT] represents log2-fold changes in mRNA levels between Tm and ISRIB-treated and untreated samples and Ribo-Seq [(Tm + ISRIB)/UT)] represents log2-fold changes in RPFs between Tm and ISRIB-treated and untreated samples. Only genes with a log2-fold change >|1| and a FDR-corrected p-value < 0.1 were included in the table. (D) Significant translational changes in ISRIB-treated cells. List of genes that change more than twofold in translational efficiency after 1 hr of ISRIB treatment. mRNA (ISRIB/UT) represents log2-fold changes in mRNA levels between ISRIB-treated and untreated samples and[SPACE]Ribo-Seq (ISRIB/UT) represents log2-fold changes in RPFs between ISRIB-treated and untreated samples. Only genes with a log2-fold change >|1| and a FDR-corrected p-value < 0.1 were included in the table. (E) Alignment of sequencing libraries. Total number of reads and the percentage of reads for both mRNA-seq and ribo-seq libraries that align to the genome and ORF for all conditions (UT, Tm, Tm + ISRIB, ISRIB) and for each replicate.
- https://doi.org/10.7554/eLife.05033.004
Figure 1—figure supplement 1
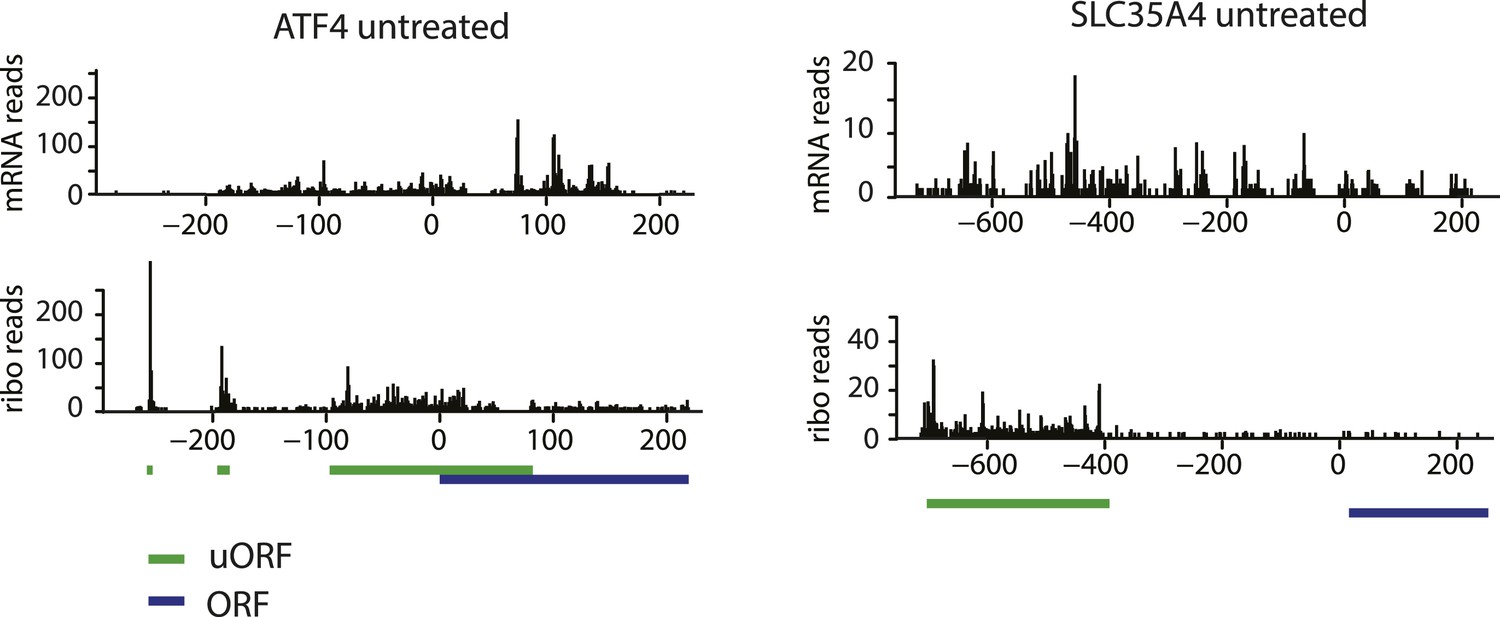
Ribosome and mRNA densities in the 5’UTR of ATF4 and SLC35A4.
mRNA reads (y-axis) are represented along the sequence of each gene (x-axis) in the upper panel. Ribosome footprint (ribo) reads (y-axis) are represented along the sequence of each gene (x-axis) in the lower panel. The known and predicted uORFs are indicated along the sequence in green. The ORF is indicated along the sequence in blue.
Figure 1—figure supplement 2
Translational regulation of mTOR targets upon ER-stress.
(A) Cells were treated with or without 1 μg/ml of Tm for 1 hr. The y-axis represents fold changes in ribosome-protected fragments (Ribo-Seq) between Tm-treated and control samples. The x-axis represents fold changes in mRNA levels (mRNA-Seq) between Tm-treated and control samples. Only mTOR translational targets are plotted (colored light green). Significant changes in mTOR genes (FDR-corrected p-value < 0.1) between Tm-treated and untreated (UT) are highlighted in black. (B) Cells were treated with or without 1 μg/ml of Tm and 200 nM ISRIB for 1 hr. The y-axis represents fold changes in ribosome-protected fragments (Ribo-Seq) between Tm + ISRIB-treated and control samples. The x-axis represents fold changes in mRNA levels (mRNA-Seq) between Tm + ISRIB-treated and control samples. Only mTOR translational targets are plotted (colored light green). Genes that significantly change when ISRIB co-administration modulates the effects of Tm treatment are shown in black (FDR-corrected p-value < 0.1). (C) Cells were treated with or without 200 nM ISRIB for 1 hr. The y-axis represents fold changes in ribosome-protected fragments (Ribo-Seq) between ISRIB-treated and control samples. The x-axis represents fold changes in mRNA levels (mRNA-Seq) between ISRIB-treated and control samples. Only mTOR translational targets are plotted (colored light green). Significant changes in mTOR genes (FDR-corrected p-value < 0.1) between ISRIB-treated and untreated (UT) are highlighted in black.
Figure 1—figure supplement 3
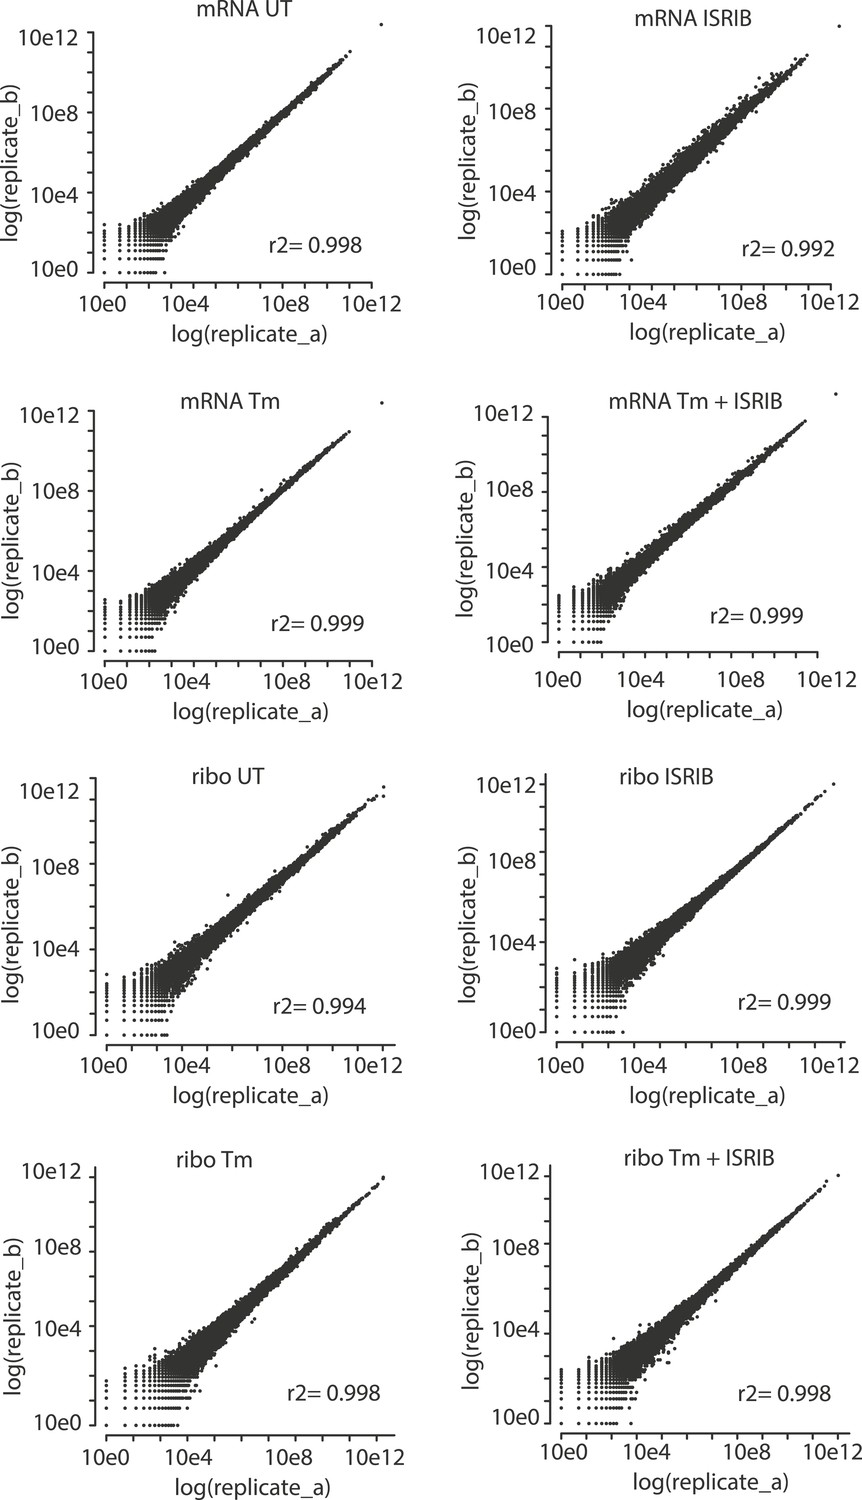
Correlation plots for duplicate ribosome profiling experiments.
The detected ribosome (ribo) or mRNA density is plotted for each gene in each experimental condition (untreated [UT], tunicamycin [Tm], tunicamycin + ISRIB [Tm + ISRIB] and ISRIB). Correlation coefficients (r2) between replicates (A and B) in each condition are indicated in the lower right for each panel.
Figure 1—figure supplement 4
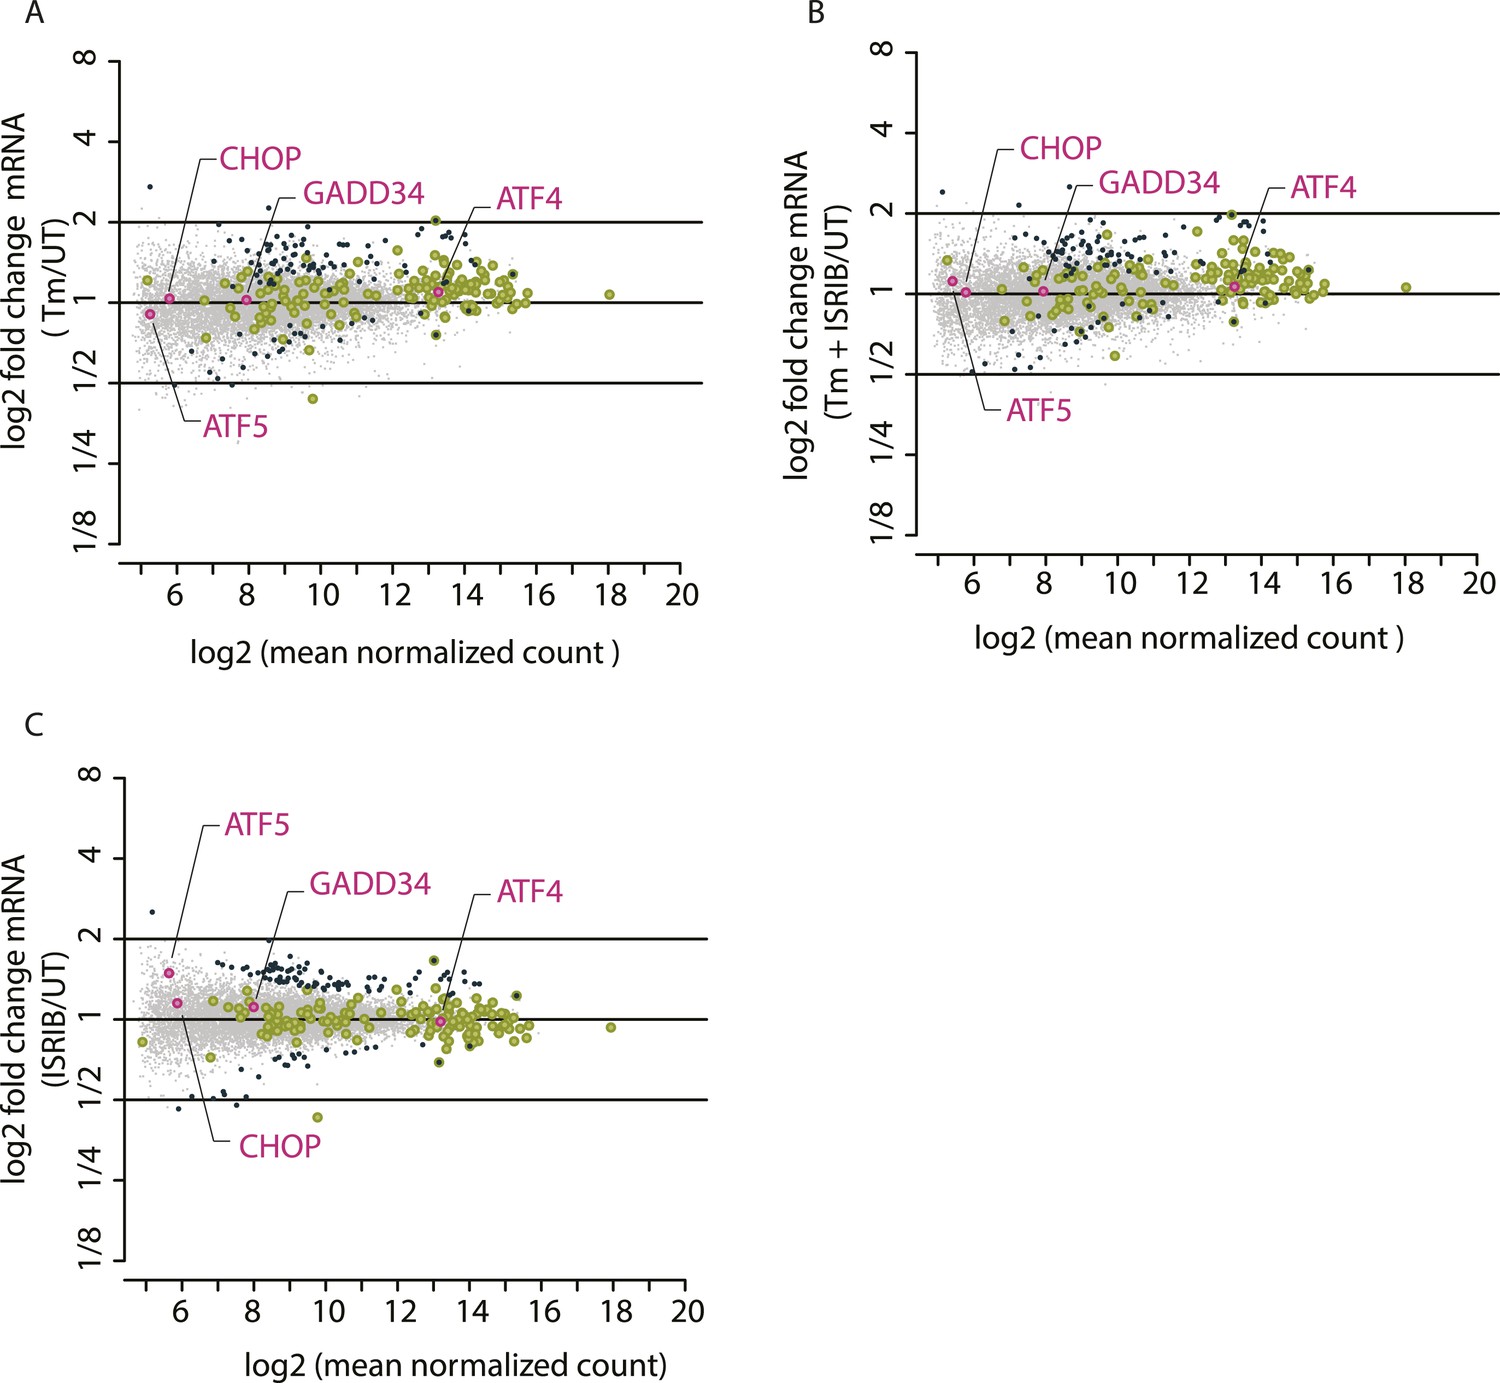
Mean mRNA abundance of all genes mapped.
The x-axis represents log2 (mean normalized count) for each mRNA mapped and the y-axis represents log2 fold changes in mRNA abundance in the different experimental conditions: Tm (panel A), Tm + ISRIB (panel B), and ISRIB (panel C). Previously known phospho-eIF2α-dependent ISR translational targets are highlighted in pink.
Figure 2
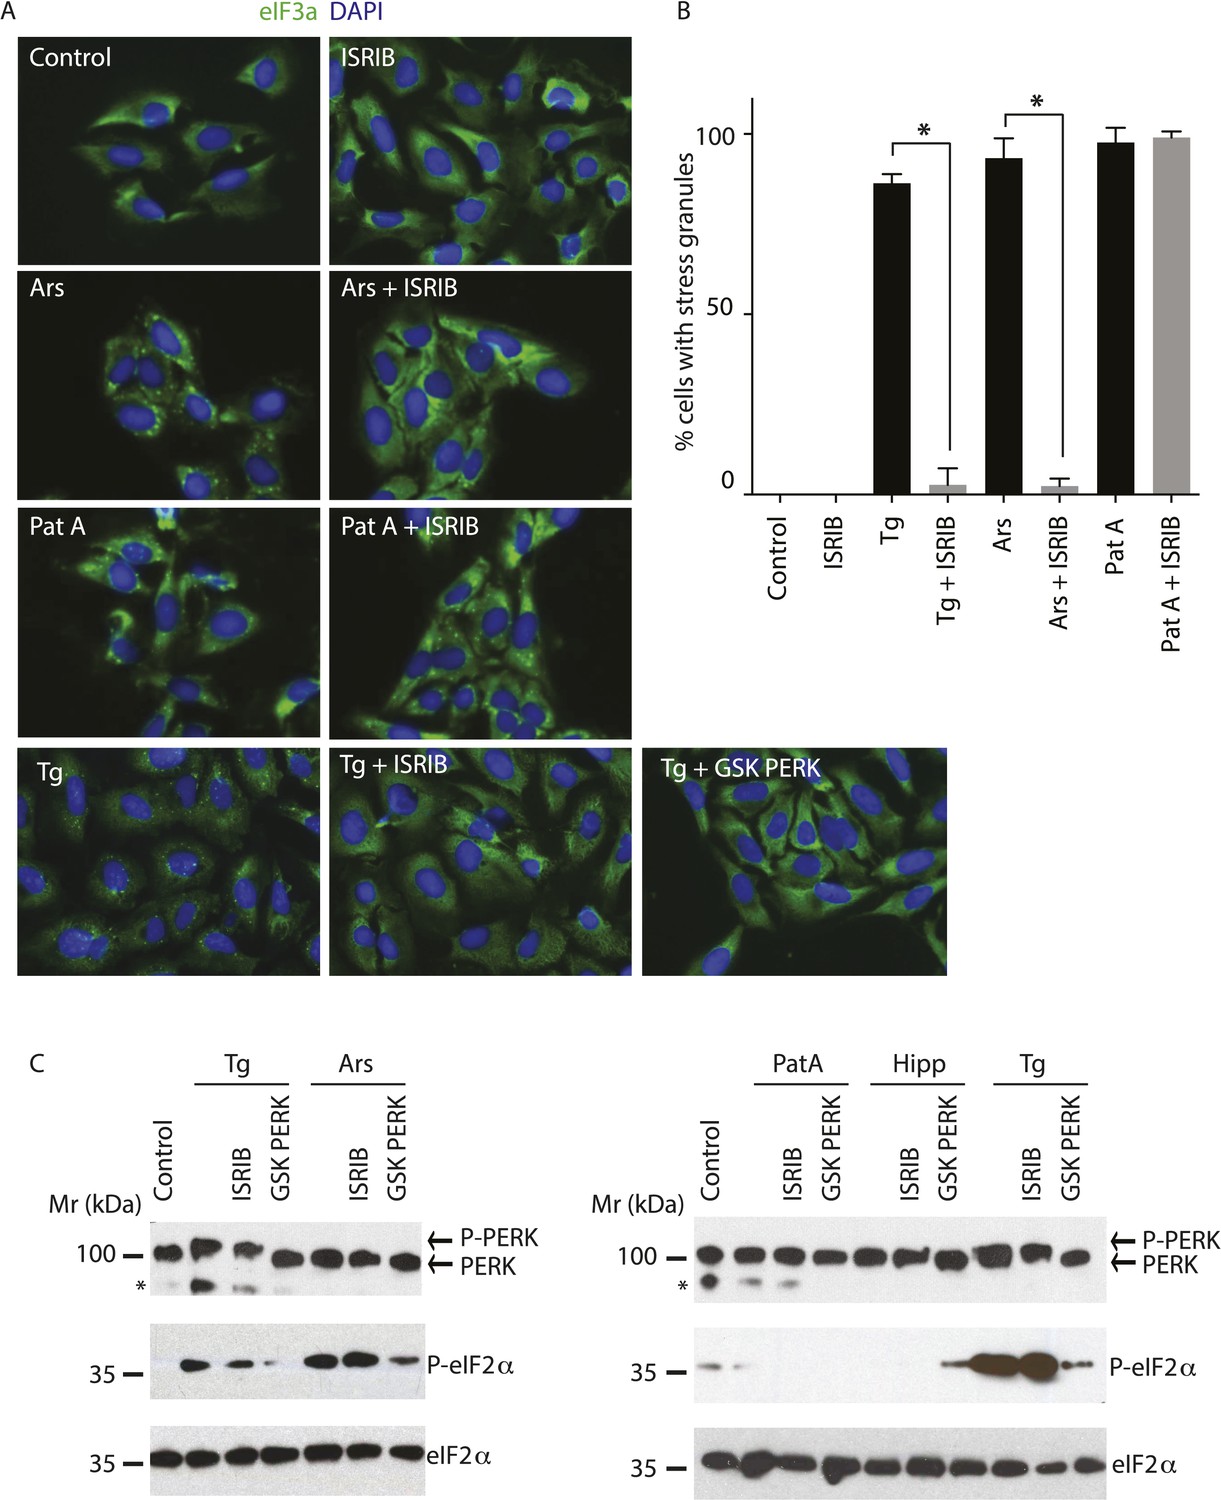
ISRIB blocks stress granule formation induced by eIF2α phosphorylation.
(A) Immunofluorescence analysis (eIF3a) of U2OS cells treated with 200 nM Tg for 1 hr, 250 μM Ars for 30 min, or 100 nM Pat A for 30 min in the presence or absence of 200 nM ISRIB or 1 μM GSK797800 PERK inhibitor. A secondary Alexa Dye 488 anti-rabbit antibody was used to visualize eIF3a and DAPI was used to visualize nuclei. Representative images of at least two biological replicates are shown. (B) Quantitation of the percentage of cells containing stress granules in the different conditions described in A. Images were collected from at least two independent experiments and the number of cells with SGs or no SGs counted. The total number of cells counted for each condition was (sum of all replicates): Control (N = 81), ISRIB (N = 94), Tg (N = 122), Tg + ISRIB (N = 71), Ars (N = 85), Ars + ISRIB (N = 84), Pat A (N = 47) and Pat A + ISRIB (N = 64). No cells had SGs in Tg + PERK inh (N = 71). p-values are derived from a Student's t-test, *p < 0.05. (C) Immunoblot analysis of PERK, phospho eIF2α, and total eIF2α in U2OS cells treated as in A. Hippuristanol (Hipp) was used at 300 nM for 30 min. The right blot was overexposed to confirm the absence of induction of eIF2α phosphorylation upon Pat A and Hipp treatment. A representative blot of three independent experiments is shown. The asterisk (*) represents a background band or degradation product.
Figure 3 with 2 supplements
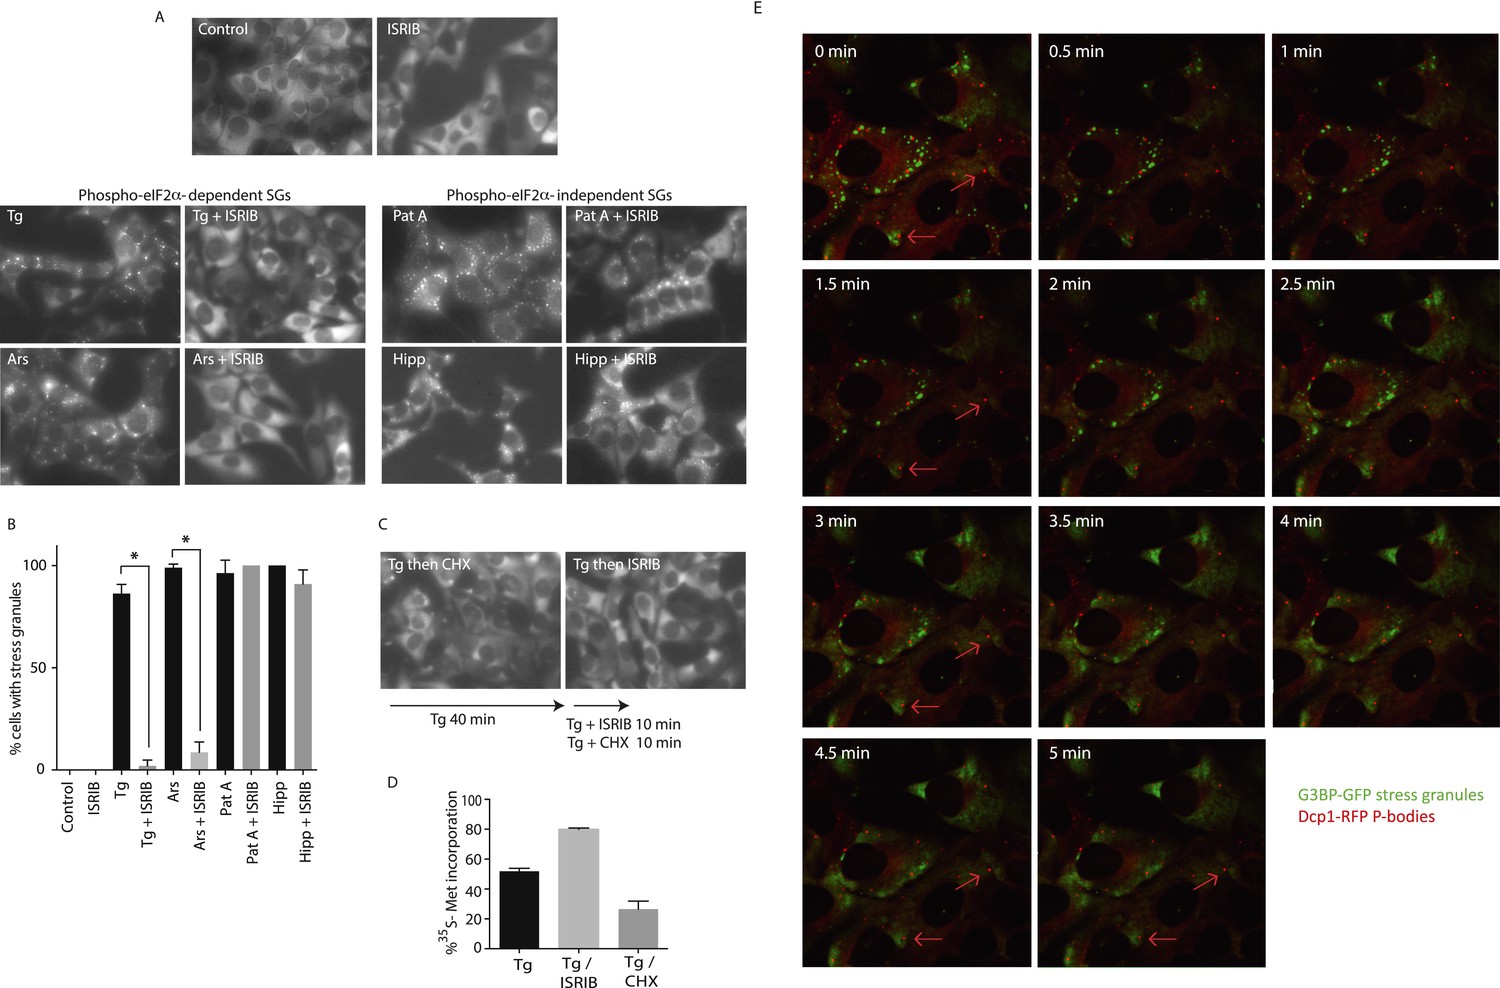
ISRIB addition rapidly dissolves pre-formed stress granules in live cells restoring translation.
(A) Live cell imaging of stress granules in U2OS cells stably expressing G3BP-GFP (SG marker). Cells were treated with 200 nM Tg for 40 min, 250 μM Ars for 30 min, 100 nM Pat A for 30 min, or 300 nM Hipp in the presence or absence of 200 nM ISRIB. Cells were imaged using an epifluorescence microscope. Representative images of at least two biological replicates are shown. (B) Quantitation of the percentage of cells containing stress granules in the different conditions described in A. Images were collected from at least two independent experiments and the number of cells with SGs or no SGs counted. The number of cells analyzed for each condition was (sum of replicates): Control (N = 98), ISRIB (N = 81), Tg (N = 101), Tg + ISRIB (N = 84), Ars (N = 80), Ars + ISRIB (N = 55), Pat A (N = 58), Pat A + ISRIB (N = 50), Hipp (N = 41) and Hipp + ISRIB (N = 52). p-values are derived from a Student's t-test, *p < 0.05. (C) Stress granules were pre-formed with Tg for 40 min (as in Figure 3A) and then CHX (50 μg/ml) or ISRIB (200 nM) was added to the well, incubated for 10 min and images were collected. Representative images of at least two biological replicates are shown. (D) ISRIB quickly restores mRNA translation upon disassembly of stress granules. Cells were treated as in C with 200 nM Tg for 40 min and then DMSO, CHX (50 μg/ml), or ISRIB (200 nM) was added at the same time as [35S]-methionine. Cells were lysed after 15 min, protein was run in an SDS-PAGE gel and radioactivity was measured in each lane (N = 2, mean ± SD). (E) ISRIB quickly dissolves stress granules but does not affect P-bodies. Live cell imaging of U2OS cells stably expressing G3BP-GFP (SG marker) and Dcp1-RFP (P-body marker). Cells were treated with 200 nM Tg for 45 min followed by addition of 200 nM ISRIB at t = 0 min to the well and then imaged using spinning disk confocal microscopy. Images were collected every 30 s. The red arrows point to two representative P-bodies. Representative images of at least three biological replicates are shown.
Figure 3—figure supplement 1
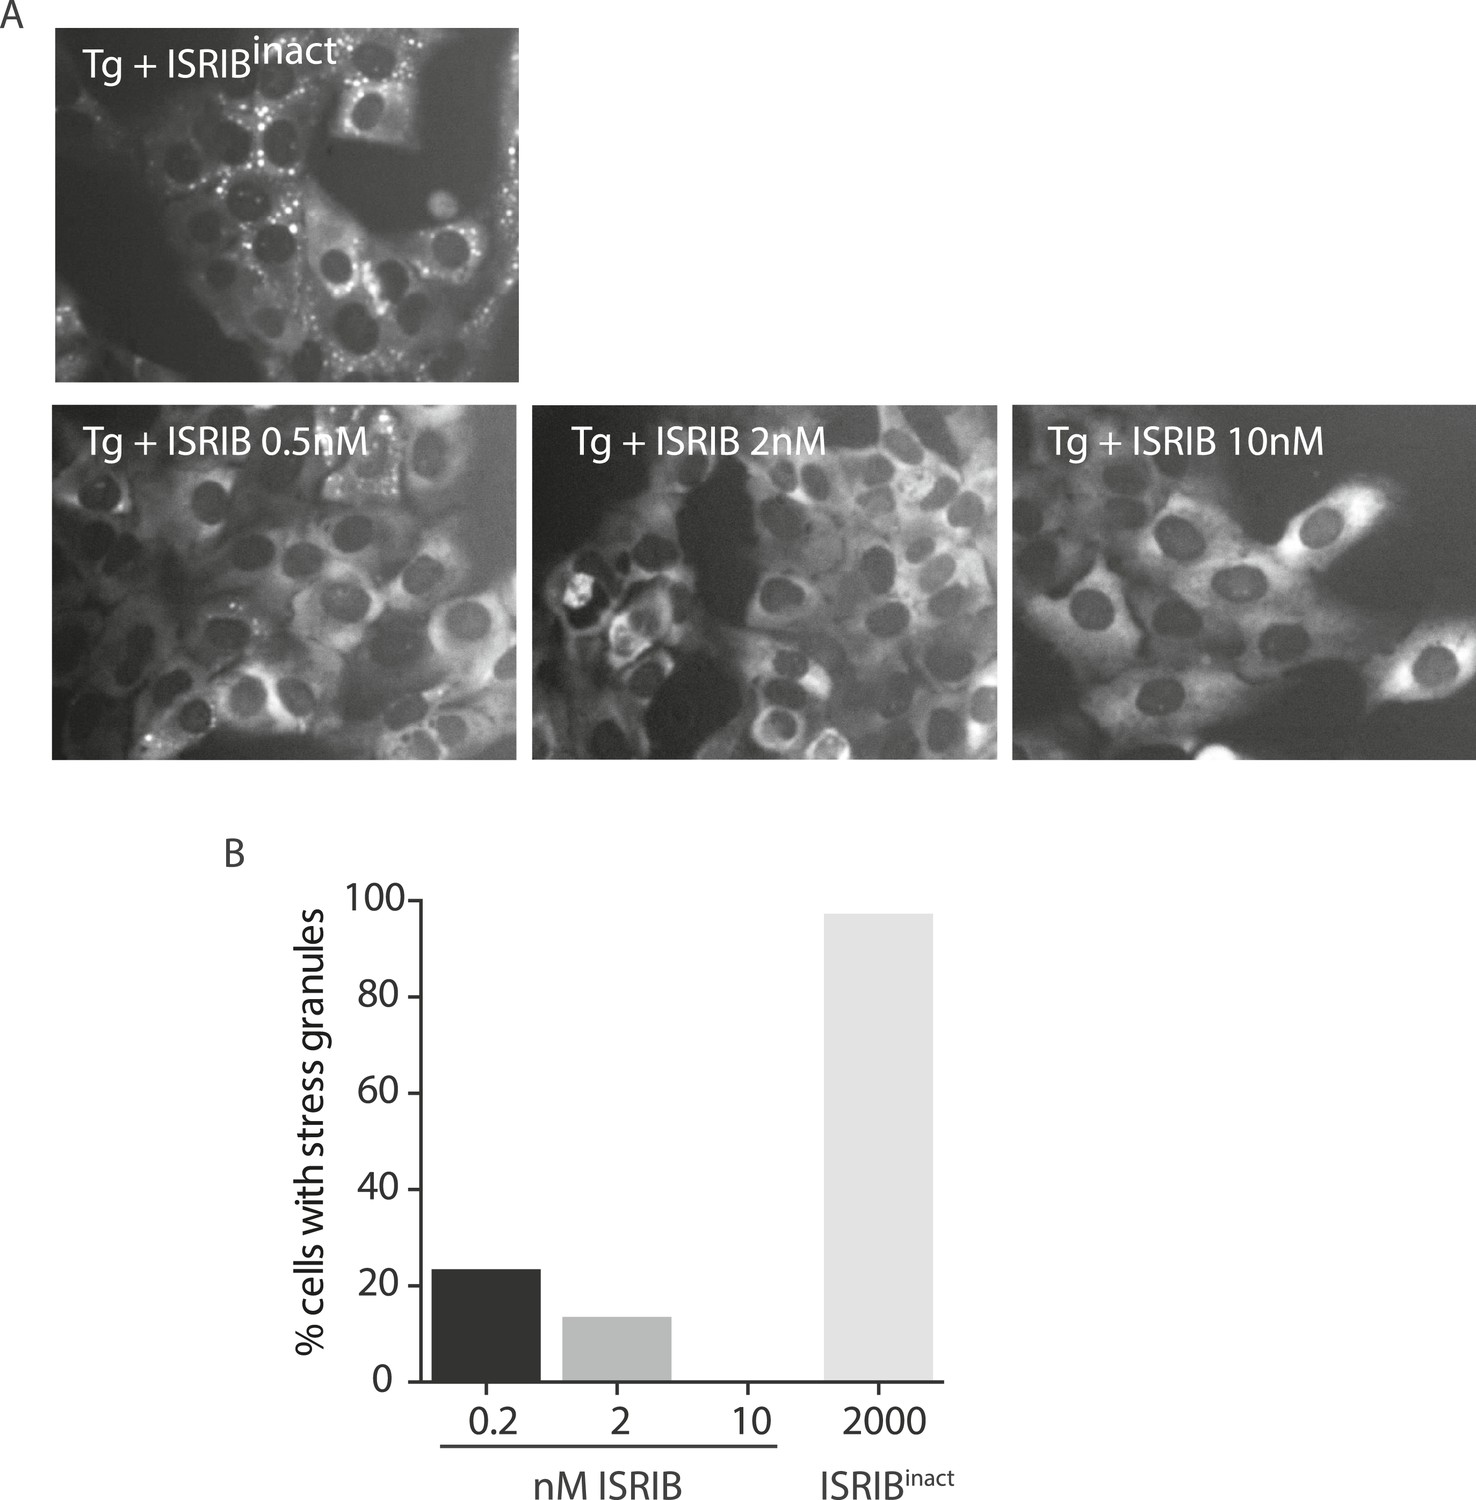
ISRIB dose response and inactive analog in stress granule assay.
(A) Live cell imaging of SGs in U2OS cells stably expressing G3BP-GFP. Cells were treated with 200 nM Tg and different doses of ISRIB (as indicated) or 2 μM of an inactive analog of ISRIB (ISRIBinact). Representative images of at least two biological replicates are shown. (B) Quantitation of the percentage of cells containing stress granules in the different conditions. The number of cells analyzed for each condition were: ISRIBinact (N = 37), 0.5 nM ISRIB (N = 81), 2 nM ISRIB (N = 91), 10 nM ISRIB (N = 43).
Figure 3—figure supplement 2
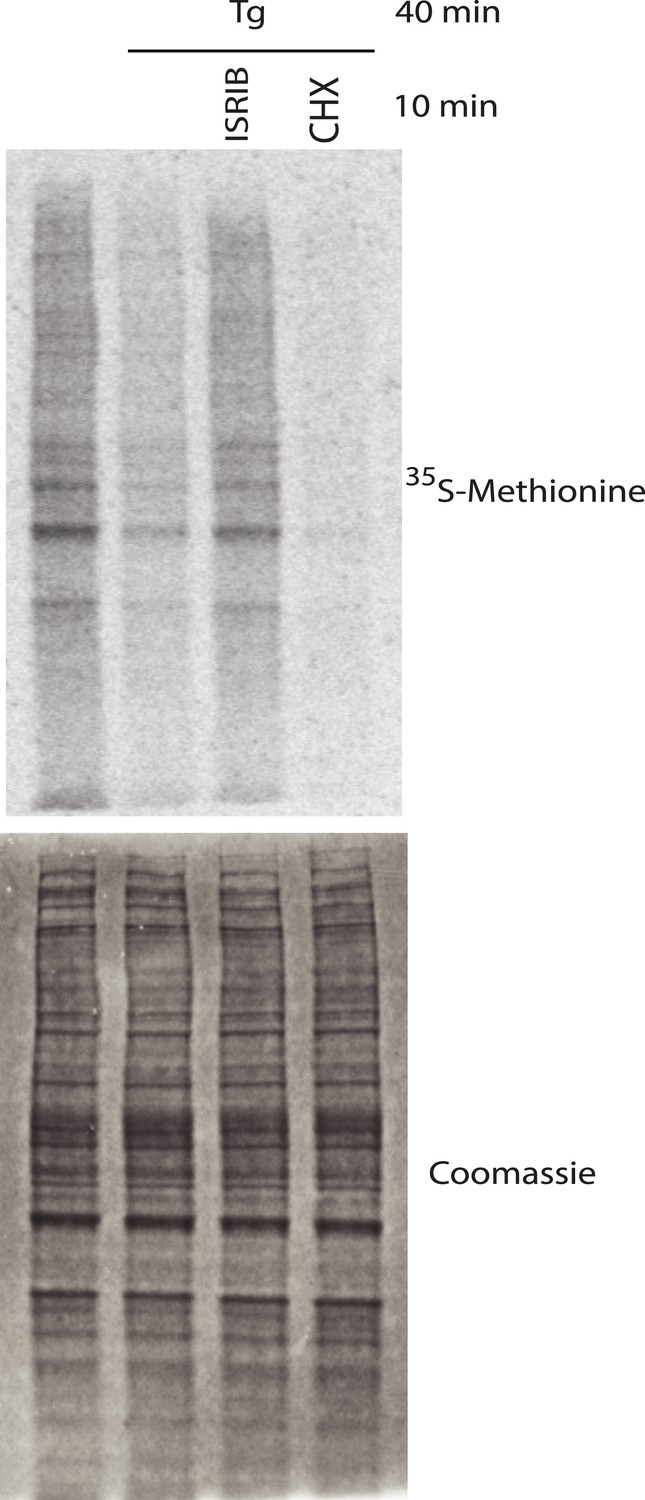
Representative SDS-PAGE gel of [35S]-methionine pulse as described in Figure 3D.
Top panel is an autoradiogram and bottom panel is total protein of the same gel as shown by Coomassie staining.
Videos
Video 1
ISRIB triggers stress granule disassembly.
U2OS cells stably expressing G3BP-GFP (SG marker) and Dcp1-RFP (P-body marker) were treated with 200 nM Tg for 40 min and then 200 nM ISRIB was added at t = 0 min to the well and imaged using an epifluorescence microscope. Images of G3BP-GFP (SGs) were collected every 30 s.
Video 2
ISRIB does not trigger disassembly of P-bodies.
Images of Dcp1-RFP (P-bodies) corresponding to the same field of cells as in Video 1 were collected every 30 s.
Download links
A two-part list of links to download the article, or parts of the article, in various formats.
Downloads (link to download the article as PDF)
Open citations (links to open the citations from this article in various online reference manager services)
Cite this article (links to download the citations from this article in formats compatible with various reference manager tools)
The small molecule ISRIB reverses the effects of eIF2α phosphorylation on translation and stress granule assembly
eLife 4:e05033.
https://doi.org/10.7554/eLife.05033


