The Ret receptor regulates sensory neuron dendrite growth and integrin mediated adhesion
- University Medical Center Hamburg-Eppendorf (UKE), Germany
- Howard Hughes Medical Institute, University of California, San Francisco, United States
- University of California, San Francisco, United States
- Cornell University, United States
- Imperial College London, United Kingdom
Figures
Figure 1 with 2 supplements
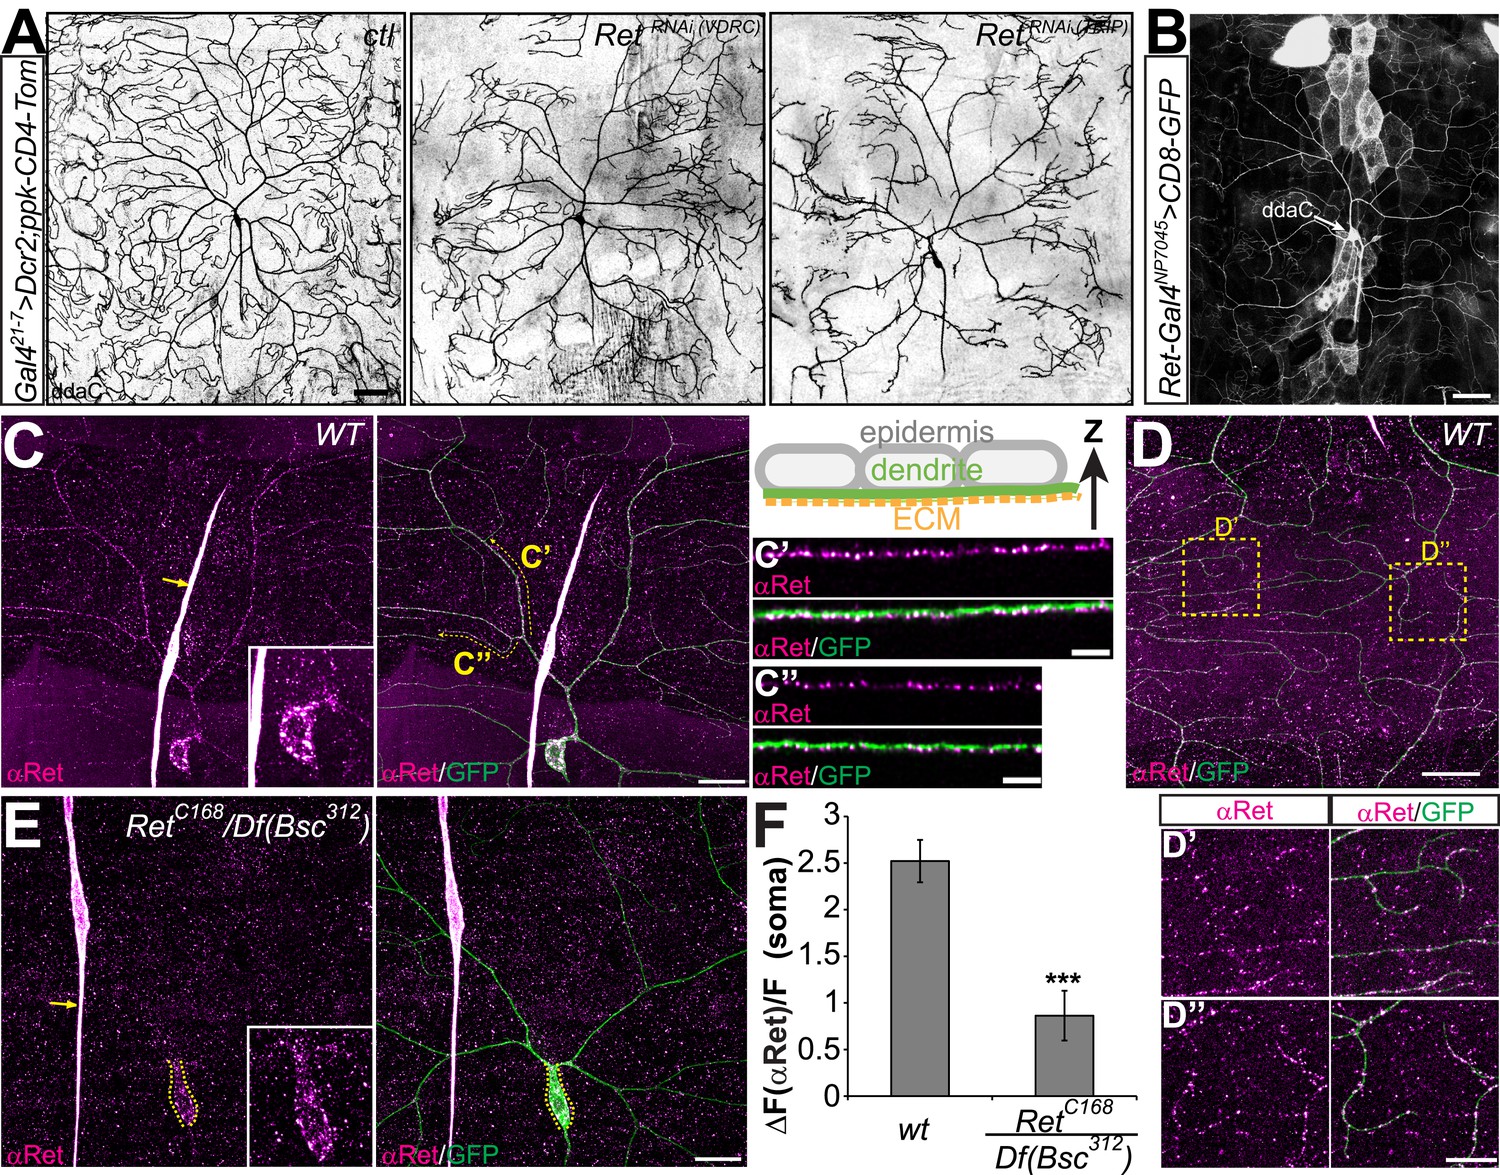
In vivo RNAi knockdown of Ret causes C4da neuron dendrite pattering defects.
(A) RetRNAi transgenes together with Dcr2 were driven by Gal421–7 and C4da neuron morphology was visualized with a specific fluorescent reporter (ppk-CD4-tdTomato). Confocal live images of control animals (ctl) show wildtype dendrite morphology, while expression of either of two independent Ret-RNAi transgenes led to severely disorganized dendrites with incomplete receptive field coverage. (B) A Gal4 insertion in the Ret genomic locus drives CD8-GFP expression in C4da neurons indicating the presence of Ret. Scale bar 50 μm. (C–E) Immunohistochemical analysis of Ret expression in third instar larvae of wildtype (C and D) and Ret deficient animals (E). Overlays with GFP expressing C4da neurons (ppk-Gal4 > CD4-tdGFP) show that specific anti-Ret signal could be detected throughout the C4da dendritic arbor (C). Resliced portions (in Z direction) of primary (C′) and terminal (C′′) C4da dendrites show that Ret strongly labels the basal side of dendrites facing the ECM as shown in the schematic drawing. (D) Ret was also present in distal terminal dendrites of the dorsal field of C4da neurons (D′ and D′′, scale bar 20 μm, 10 μm for insets). Residual Ret signal was detected in the C4da neuron soma in Ret mutant animals but not in dendrites (E inset). Arrows indicate non-specific antibody signal present in wildtype and Ret mutant samples. Scale bar 20 μm. (F) Quantitative analysis of Ret immunoreactivity in C4da somata of wildtype and Ret mutant samples showing the signal over background (ΔF/F, mean ± SD, n = 5, p < 0.001, Student's two-tailed t-test).
Figure 1—figure supplement 1
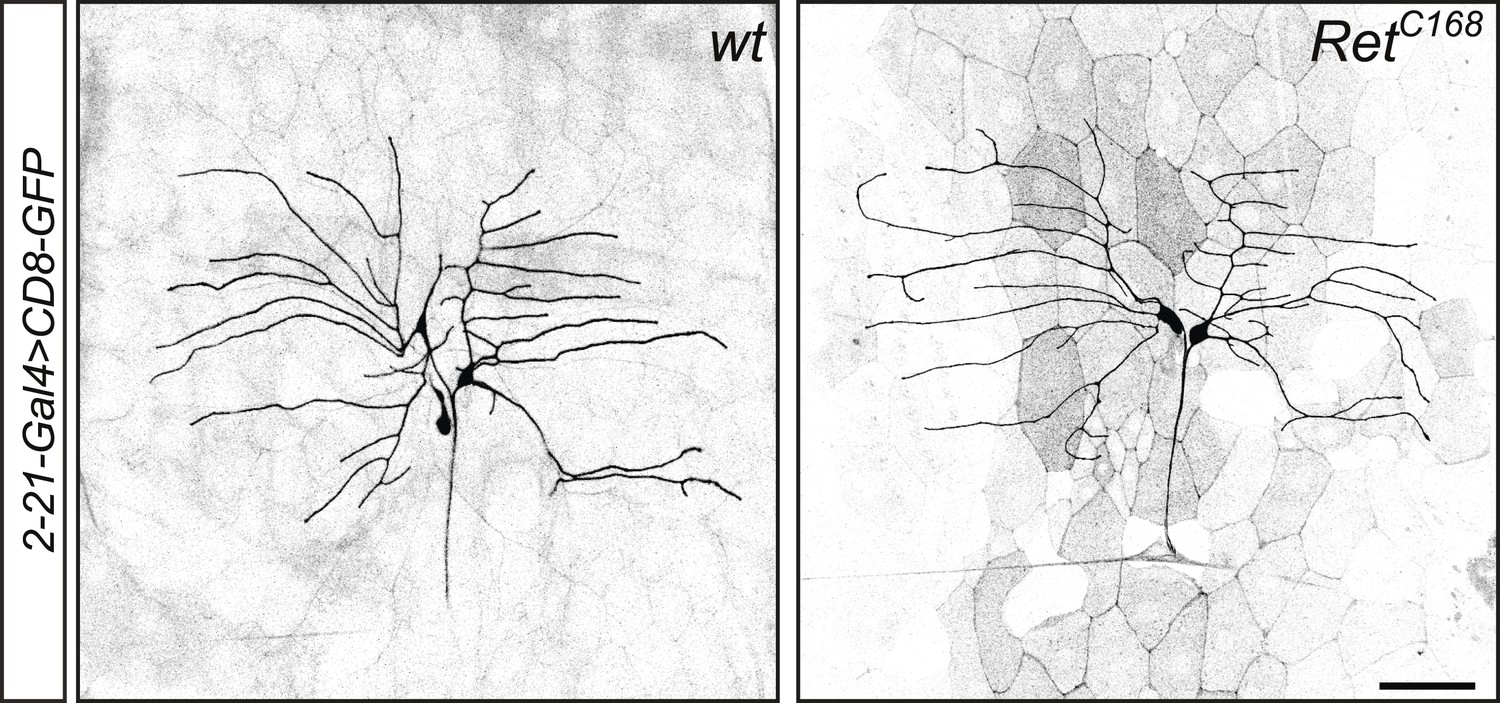
Class I da neurons do not display obvious morphological defects in Ret mutant animals.
RetC168 homozygous third instar larvae display no obvious phenotype in class I da neuron morphology visualized by 2-21-Gal4 > CD8-GFP. Scale bar 50 μm.
Figure 1—figure supplement 2
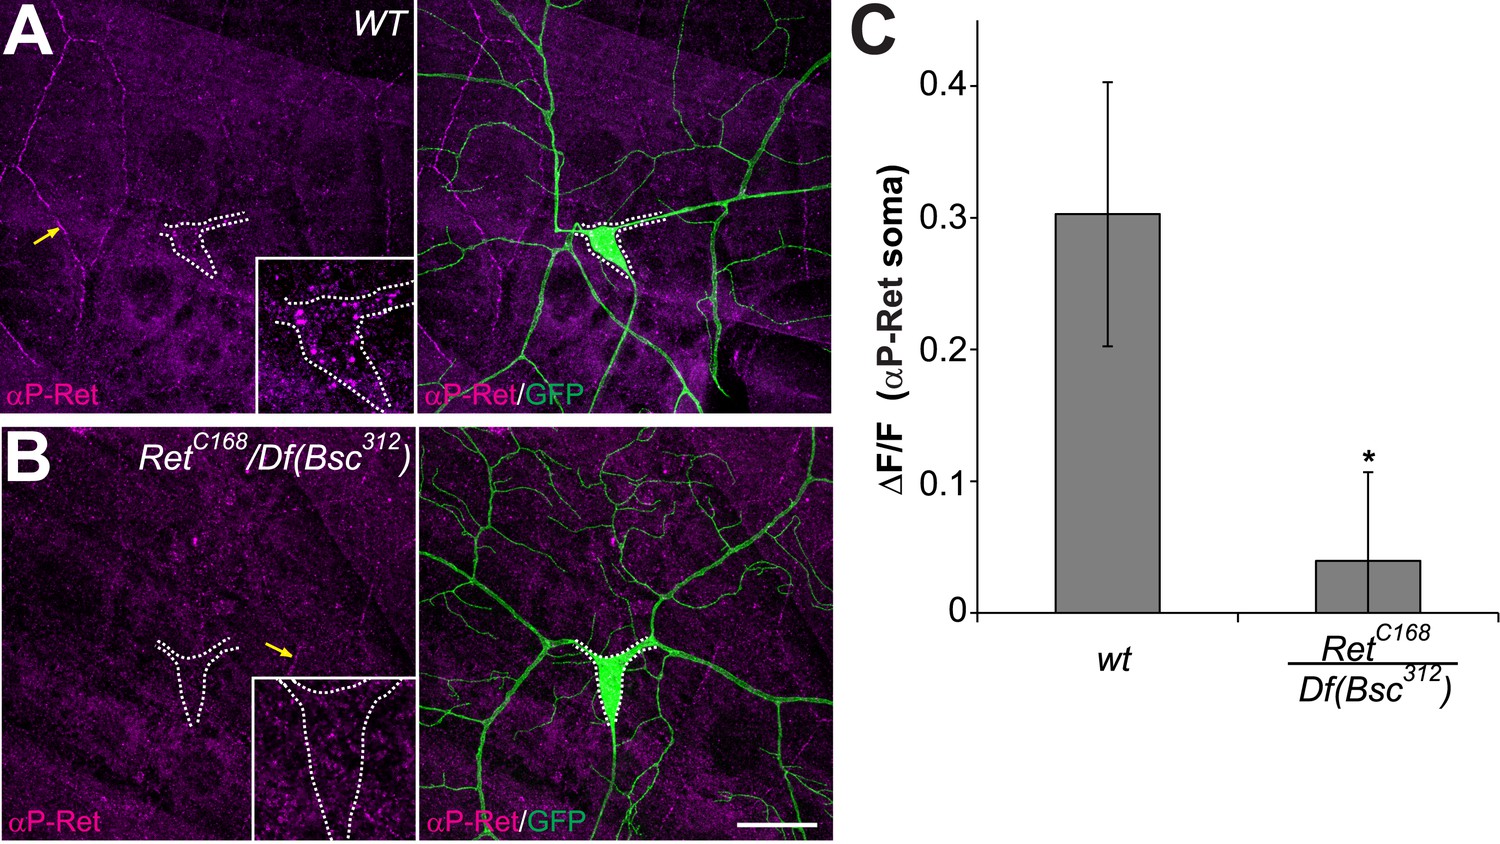
phospho-Ret levels are reduced in Ret mutant C4da neurons.
(A and B) Immunohistochemical analysis of phospho-Ret in third instar larvae of wildtype (A) and Ret mutant animals (B). Specific anti-phospho-Ret signal could be detected in C4da neuron somata of control but not Ret mutant animals (A and B inset). Arrows indicate non-specific antibody signal at epithelial junctions. Scale bar 25 μm. (B) Quantitative analysis of phospho-Ret immunoreactivity in C4da somata of wildtype and Ret mutant samples showing signal over background (ΔF/F, mean ± SD, n = 3, p < 0.05, Student's two-tailed t-test).
Figure 2
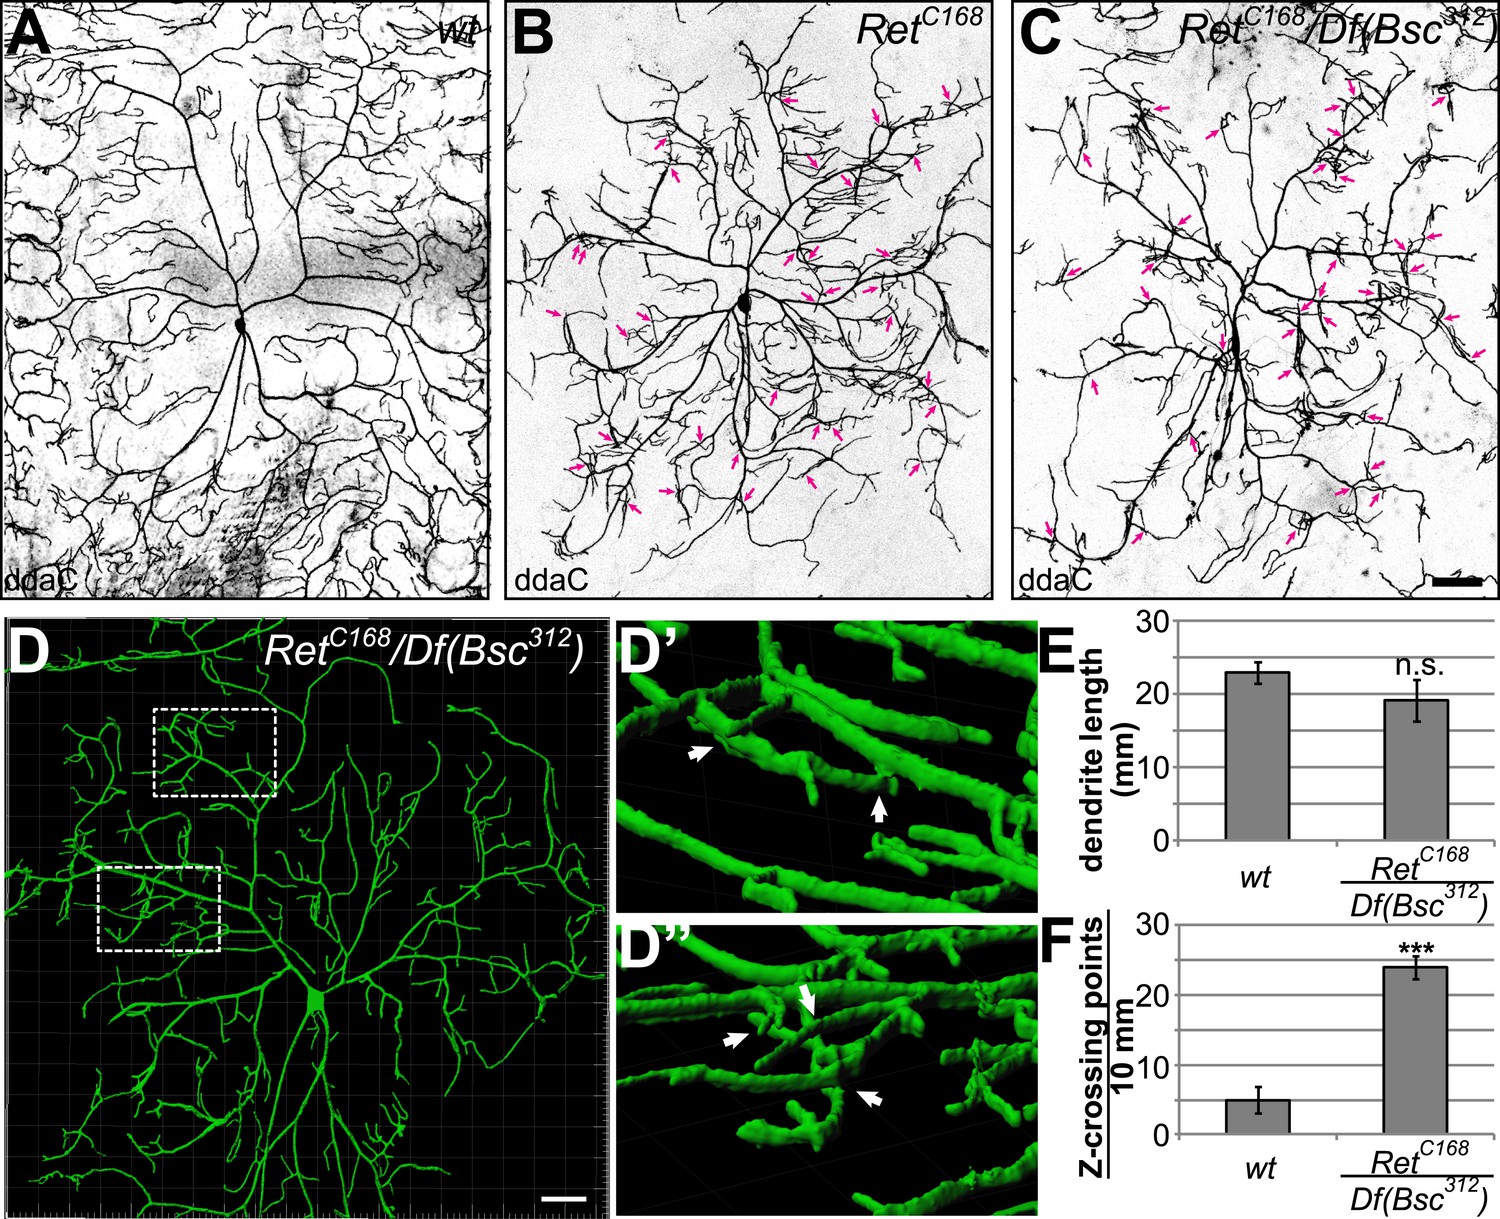
Loss of Ret function impairs C4da neuron dendrite patterning and results in out of plane crossing of isoneuronal branches.
(A–C) Confocal live images of C4da neurons in (A) wildtype, (B) RetC168 homozygous, and (C) RetC168/Df(Bsc312) third instar larvae. Loss of Ret function causes abnormal dendrite patterning featuring reduced receptive field coverage and overlapping dendrites (indicated by arrows). Note that the phenotype is more severe in RetC168/Df(Bsc312) than in RetC168 mutant C4da neurons. Scale bar: 50 μm. (D) 3D reconstruction of a Ret deficient C4da neuron with magnified 3D views of regions with dendrites crossing in different growth planes (D′ and D′′). Scale bar: 25 μm. (E) Total dendrite length of Ret mutant C4da neurons was not significantly changed compared to wildtype. (F) Out of plane crossing of C4da neuron dendrites in Ret mutants was however highly elevated (mean ± SD, n = 8; p < 0.001, Student's two-tailed t-test).
Figure 3
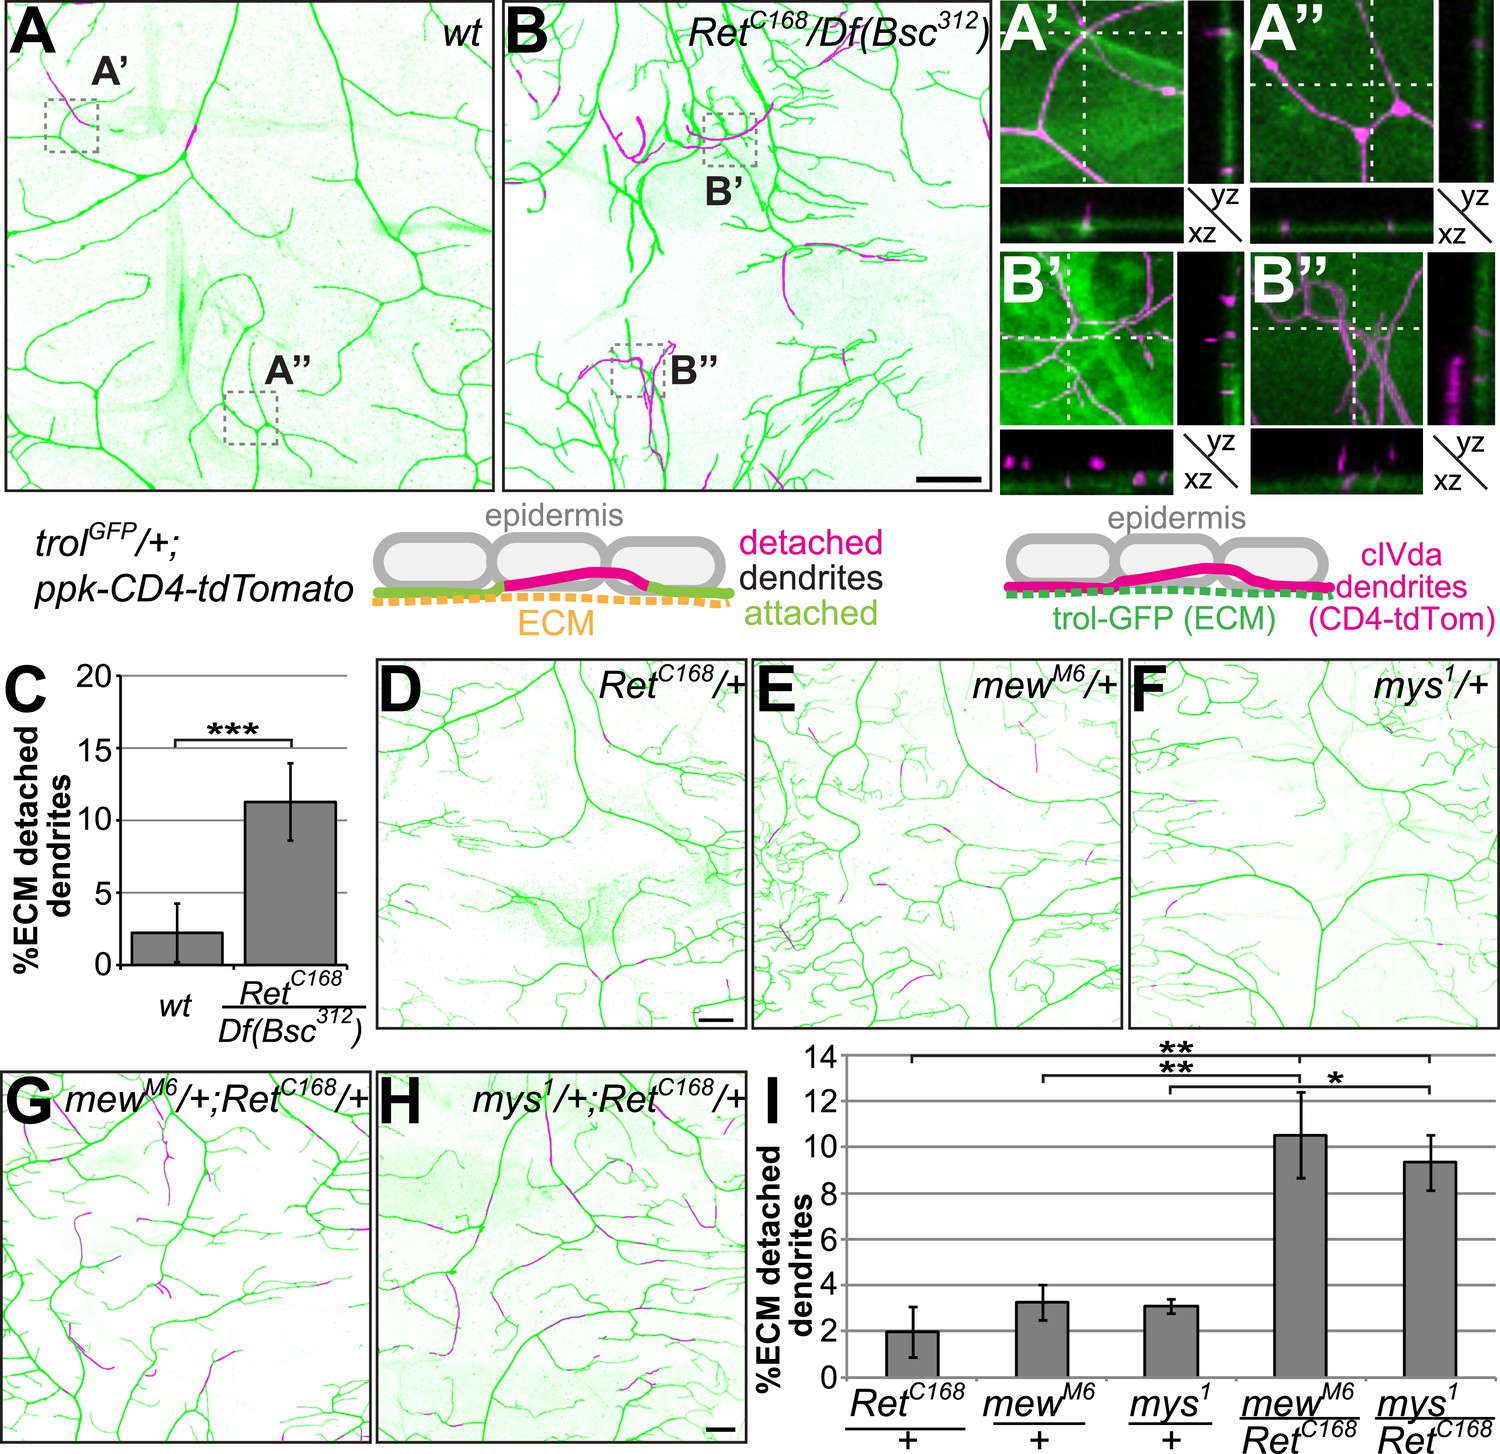
Dendrite-ECM detachment due to Ret loss of function is genetically linked to integrins.
C4da neuron dendrites along the dorsal midline (ppk-CD4-tdTomato) and the extracellular matrix (trol-GFP or vkg-GFP) were co-visualized in third instar larvae. High resolution two-color confocal z-stacks were analyzed for dendrite-ECM interaction and detached dendrite segments are indicated in magenta as indicated schematically. (A) In wildtype animals, very few dendrite segments were not in contact with the ECM. Magnified regions of (A) and cross-sections illustrate dendrite-ECM proximity with few dendrite segments not contacting the ECM (A′, A′′, ECM in green, dendrites in magenta, see schematic for color code). (B) A strong increase of detached dendrites could be observed in Ret mutant animals, highlighted in the magnified sections displaying severe displacement of dendrites from the ECM (B′ and B′′). Scale bar: 25 μm. (C) Quantitative analysis of dendrite-ECM interaction in wildtype and Ret mutant C4da neurons revealed a strong increase in dendrite detachment in Ret deficient animals (mean ± SD, n = 5, p < 0.001, Student's two-tailed t-test). (D–E) Genetic interaction analysis of dendrite-ECM adhesion in (D) RetC168, (E) mewM6, (F) mys1 heterozygous and (G) mewM6/RetC168 (H) mys1/Ret C168 trans-heterozygous third instar larvae. The combination of either integrin mutant with the RetC168 allele showed highly increased loss of dendrite-ECM interaction (G and H) compared to wildtype or the heterozygous alleles alone. Scale bar: 25 μm. (I) Quantitative analysis of dendrite detachment for the individual genotypes as indicated. mewM6/RetC168 and mys1/RetC168 trans-heterozygotes showed significantly impaired dendrite-ECM adhesion (mean ± SD, p < 0.05, n = 4, Mann–Whitney U-test).
Figure 4 with 3 supplements
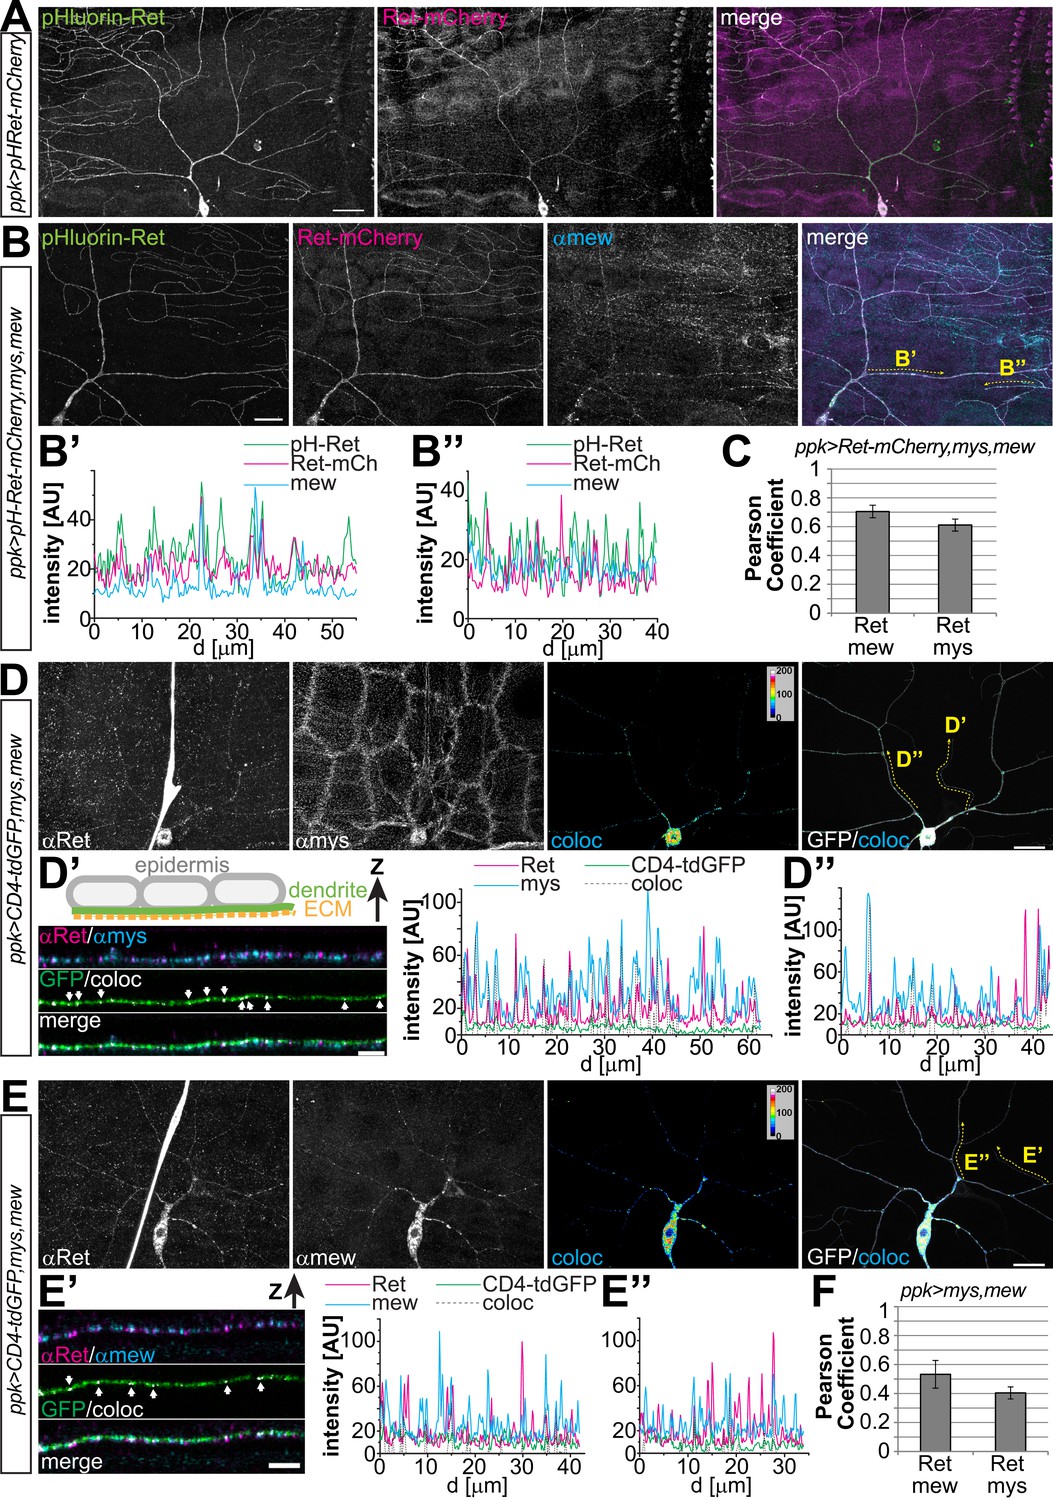
Ret localizes to the dendrite surface and co-localizes with integrins.
(A) Cell surface immunostaining of pHluorin-Ret-mCherry expressed in C4da neurons using ppk-Gal4. Surface exposed Ret labeled by pHluorin (surface-stained with anti-GFP antibody) showed even labeling of the entire dendritic tree, while the mCherry signal displayed a more granular distribution of cellular Ret. Scale bar: 30 μm. (B) Cell surface immunostaining of pHluorin-Ret-mCherry co-expressing mys and mew in C4da neurons using ppk-Gal4. Cell surface and cellular Ret were partially co-distributed with Mew in dendrites, as evident from fluorescence intensity plots along (B′) low order and (B′′) terminal dendrites. Scale bar 20 μm. (C) Quantitative colocalization analysis of Ret and integrins coexpressed in C4da neurons (ppk-Gal4,CD8-GFP > Ret-mCherry,mys,mew). Pearson coefficients were calculated for C4da neuron soma and dendrite regions showing a positive correlation of Ret and integrin signals (see ‘Materials and methods’ for details, mean ± SD, n = 5 per genotype). (D and E) Colocalization analysis of endogenous Ret and integrins overexpressed in C4da neurons (ppk-Gal4,CD4-tdGFP > mys,mew). Endogenous Ret signal was colocalized with (D) anti-mys or (E) anti-mew immunoreactivity in C4da neurons and colocalized pixels visualized in false color representations (coloc). (D′ and E′) Stretches of terminal dendrites resliced in Z direction showing partial colocalization of (D′) Ret and mys or (E′) Ret and mew along the basal dendrite facing the ECM as indicated by arrows (see schematic drawing). Line intensity plots of the same dendrite portion show signal distribution of endogenous Ret and integrins together with the colocalized signals (coloc) and the CD4-tdGFP membrane marker. (D′′ and E′′) Line intensity plots for a primary dendrite portion (indicated in D and E). (F) Quantitative colocalization analysis of endogenous Ret and integrins expressed in C4da neurons (ppk-Gal4,CD4-tdGFP > mys,mew). Pearson coefficients calculated for C4da neuron soma and dendrites showing a positive correlation of endogenous Ret and integrin signals (see ‘Materials and methods’ for details, mean ± SD, n = 5 per genotype).
Figure 4—figure supplement 1
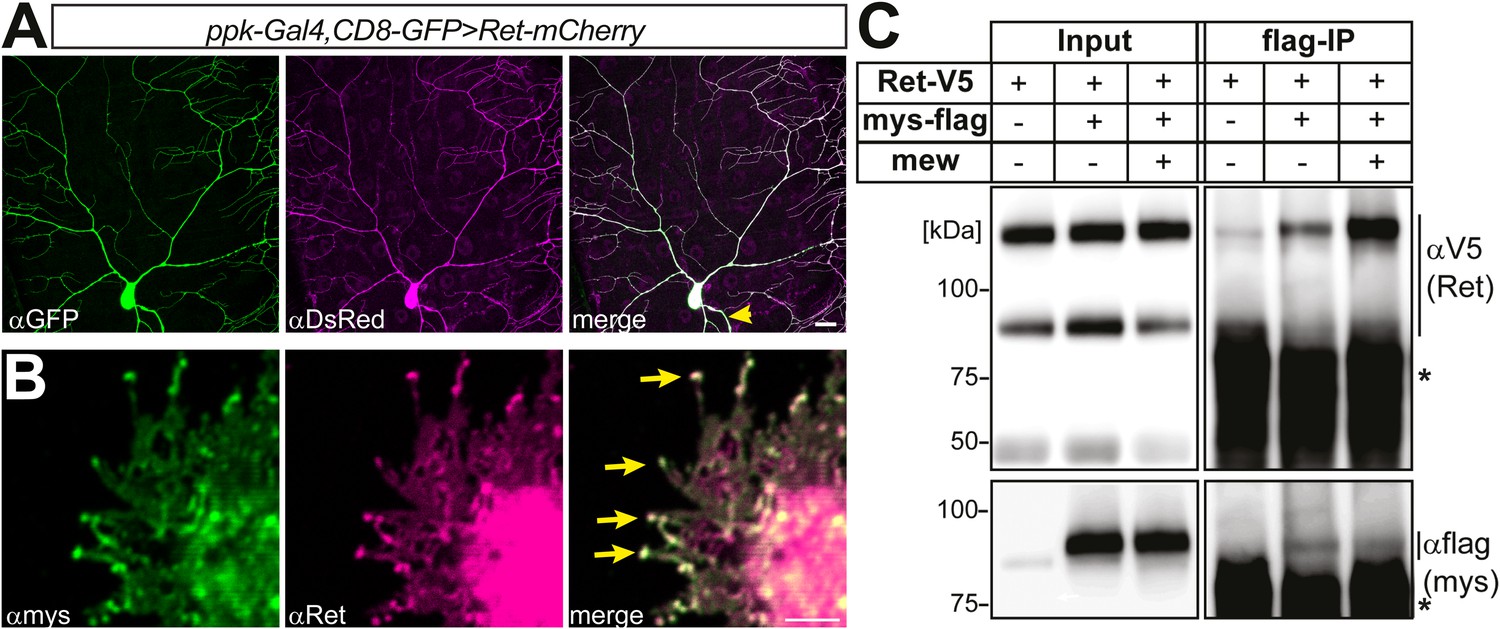
Colocalization and biochemical interaction of Ret and integrins in S2 cells.
(A) Analysis in third instar larval fillet preparations expressing Ret-mCherry (anti-DsRed immunostaining) in class IV da neurons with ppk-Gal4 > CD8-GFP (anti-GFP). Ret was fairly evenly distributed in low and high order dendrites and the axon (yellow arrow). Scale bar 25 μm. (B) S2 cells were co-transfected with mys and Ret and imunostained with specific anti-mys (green) and anti-Ret antibodies (magenta). Mys and Ret colocalization in S2 cells is particularly strong in filopodial tips (arrows). Scale bar 1 μm. (C) S2 cells were transfected with V5-tagged Ret and flag-tagged mys with or without mew co-transfection. Mys-flag was immunoprecipitated and Ret interaction was probed by Western blotting with an anti-V5 antibody. The asterisks indicate secondary antibody cross-reactivity with the IP antibody.
Figure 4—figure supplement 2
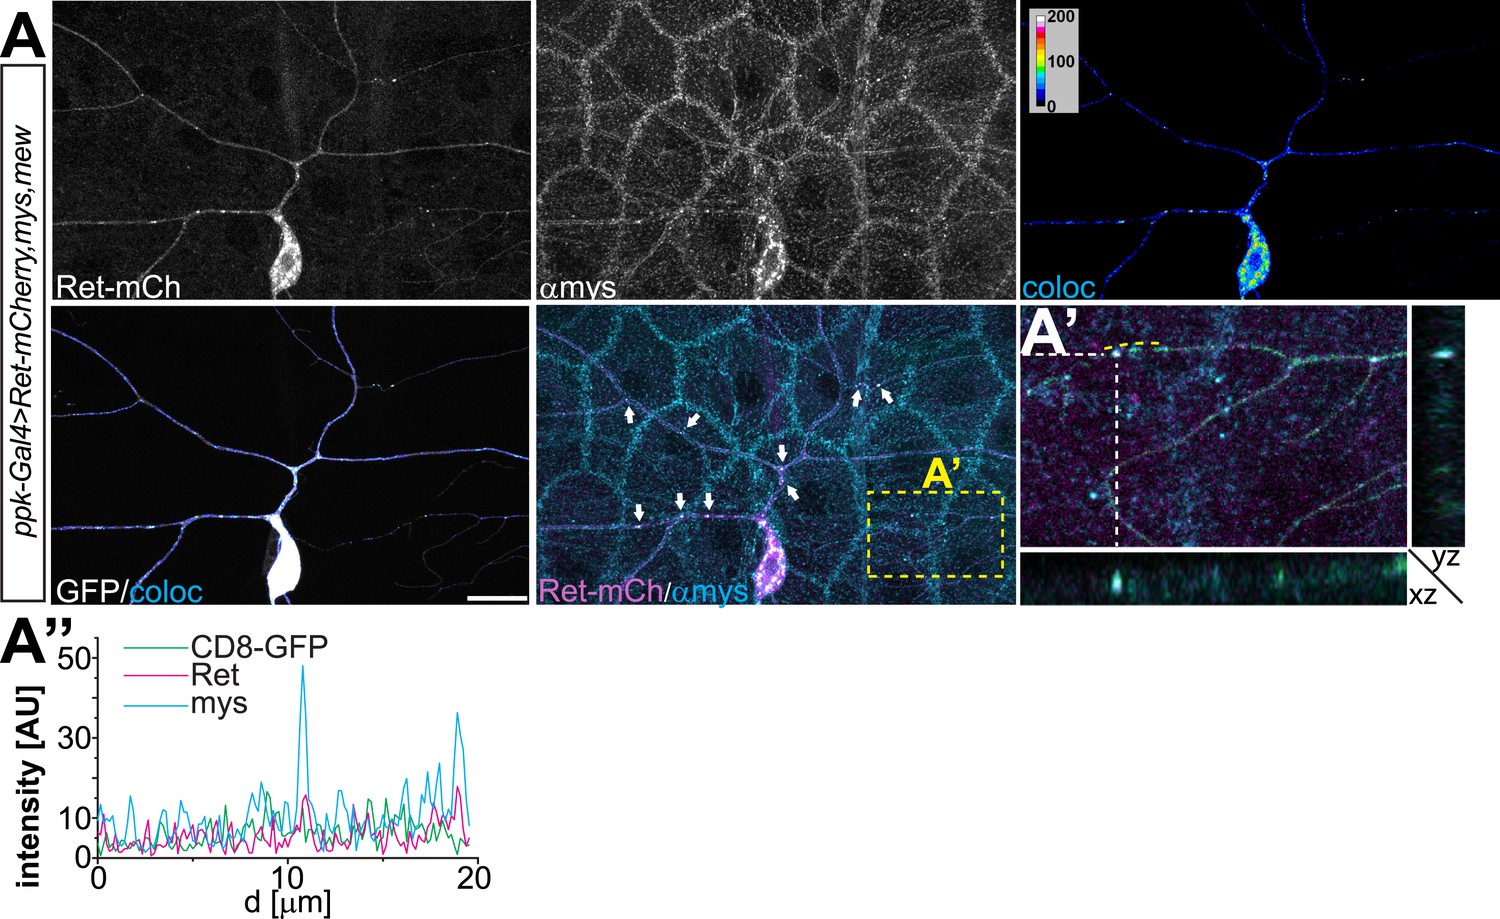
Overexpressed Ret and mys colocalization in C4da neurons.
(A) Immunohistochemical analysis of C4da neurons co-expressing Ret-mCherry with Mys/Mew using ppk-Gal4 > CD8-GFP. Ret-mCherry signal was colocalized with anti-Mys immunoreactivity in C4da neurons and colocalized pixels visualized in false color representations (coloc). Ret and Mys showed colocalized punctae in dendritic arbors (indicated by arrows). Scale bar 20 μm. (A′) High magnification view and cross-sections (indicated by yellow rectangle, Z cutting plane indicated by dashed lines) shows 3D colocalization of Ret and Mys in dendrites. (A′′) Line intensity plot along a dendrite portion (indicated by dashed yellow line in A′) shows the signal covariance of Ret and Mys.
Figure 4—figure supplement 3

Overexpressed Ret and mew colocalization in C4da neurons.
(A) Immunohistochemical analysis of C4da neurons co-expressing Ret-mCherry with integrins Mys/Mew using ppk-Gal4 > CD8-GFP. Ret and Mew colocalized pixels were visualized in false color representations (coloc) and colocalized punctae are present in dendritic arbors (indicated by arrows). Scale bar 20 μm. (A′) High magnification view and cross-sections (indicated by yellow rectangle, Z cutting plane indicated by dashed lines) shows 3D colocalization of Ret and Mew in dendrites. (A′′) Line plots of signal intensities along a dendrite portion (indicated by dashed yellow line in A′) show covariance of Ret and Mew localization.
Figure 5 with 1 supplement
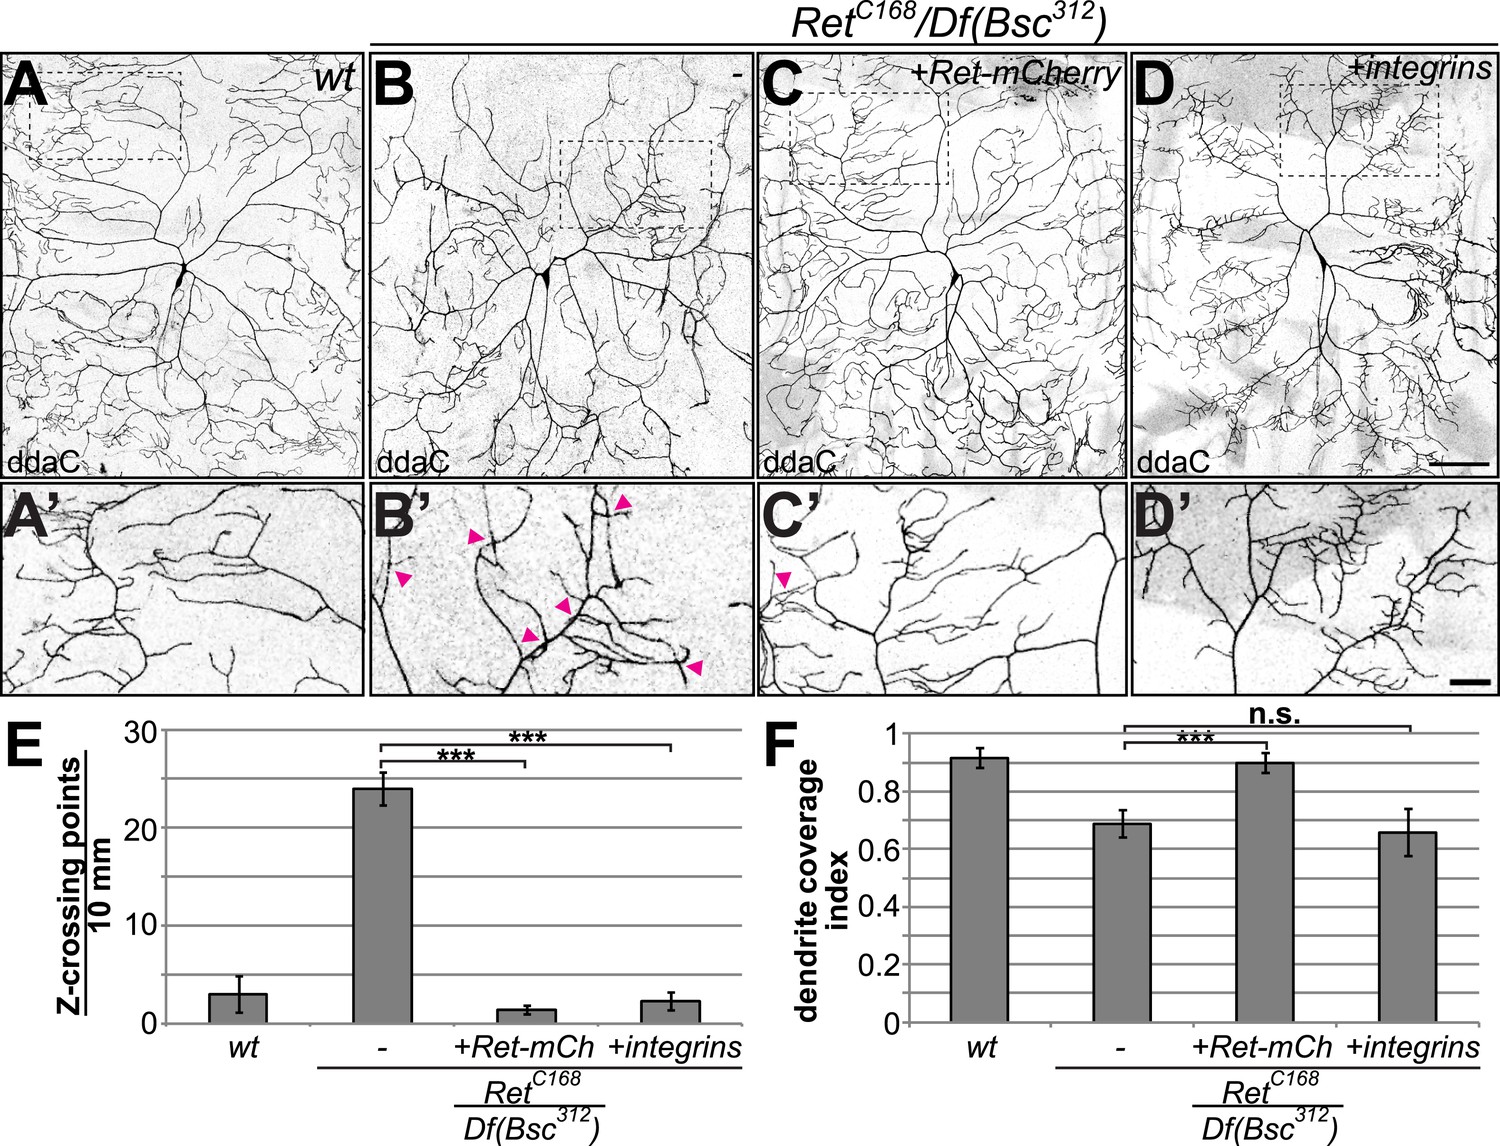
Cell-autonomous rescue of Ret mutant dendrite defects by C4da-specific expression of Ret or integrins.
(A–D) Maximum projections of C4da neurons visualized with ppk-Gal4 > CD4-tdGFP are shown for (A) wildtype and (B–D) Ret mutant animals. C4da neuron specific expression of (C) UAS-Ret-mCherry or (D) UAS-mys/UAS-mew in Ret mutant larvae rescues dendrite crossing defects. However, only re-expression of Ret fully restores dendritic field coverage to wildtype levels. Scale bar 100 μm. (A′–D′) Magnified view of the indicated dendrite area for the different genotypes. Dendrite crossing points are indicated by arrowheads. Note that Ret-mCherry or integrin expression in Ret mutant C4da neurons strongly reduced dendrite crossing events. Scale bar 30 μm. (E) Quantitative analysis of out of plane dendrite crossing for the indicated genotypes. Overexpression of Ret or integrins specifically in C4da neurons of Ret mutant animals fully rescues dendrite crossing defects (p < 0.001, n = 5) (F) Dendrite coverage index (ratio of dendrite field area and segment area (Parrish et al., 2009)) is shown for the indicated genotypes. Defects in receptive field coverage of Ret mutant C4da neurons are rescued by C4da specific expression of the Ret-mCherry transgene, but not integrin overexpression (mean ± SD, p < 0.001, n = 5, Mann–Whitney U-test).
Figure 5—figure supplement 1

Integrins suppress Ret overexpression induced adult eye phenotypes.
Integrin co-expression suppresses Ret induced photoreceptor degeneration. Overexpression of Ret with GMR-Gal4 caused a rough eye phenotype and pigmentation defects, which can be fully rescued by co-expression of integrins. Co-expression of Ret-mCherry and Mys-GFP could be readily detected by their fluorescent tag confirming the presence of both proteins in the rescued eye. Note that although Ret dependent photoreceptor phenotype was rescued, pigmentation defects observed upon Ret overexpression were not.
Figure 6

Rac1 loss of function phenocopies and genetically interacts with Ret and integrins.
The dorsal field of C4da neurons (ppk-CD4-Tom) and the extracellular matrix (vkg-GFP) were co-visualized in third instar larvae. High resolution two-color confocal z-stacks were analyzed for dendrite-ECM interaction and enclosed dendrite segments are indicated in magenta. Images of (A) Wildtype, (B) rac1J11 homozygous, and (C) rac1J11/rac1J10,rac2Δ,mtlΔ larvae are shown displaying a strong increase of detached dendrites in the rac1 mutant animals. Scale bar 30 μm. (D and E) Quantitative analysis of dendrite-ECM interaction and dendrite crossing in wildtype and rac1 mutants shows a significant increase in dendrite detachment (C) and Z crossing points (D) in rac1 deficient C4da neurons. (F–L) Genetic interaction analysis of dendrite-ECM adhesion in (F) Ret, (G) mew, (H) mys, (I) rac1 heterozygous and (J) rac1/Ret (K) mew/rac1 (L) mys/rac1 trans-heterozygous third instar larvae. The combination of rac1 mutants with either Ret or integrins showed increased loss of dendrite-ECM interaction illustrated by detached portions of the dendritic tree (in magenta). Scale bar 30 μm. (M) Quantitative analysis of dendrite detachment from the ECM for the individual genotypes as indicated (mean ± SD, p < 0.05, n = 4 per genotype, Mann–Whitney U-test).
Figure 7

Ret mutant C4da neurons display increased dendrite dynamics and aberrant F-actin localization.
(A–B) The dorsal dendrite field of the same C4da neurons expressing CD4-tdGFP was imaged at 72 hr and 96 hr AEL in (A) wildtype and (B) Ret mutant animals. Growth and retraction events of dendritic branches were traced and are highlighted in green (growing dendrite) and magenta (retracting dendrite). Scale bar 25 μm. (C) Quantitative analysis of dendrite growth and retraction events in wildtype and Ret mutant C4da neurons showing the relative change in dendrite length normalized by the total dendrite length of the dorsal field. Note that growth and retraction of dendrites in Ret mutant neurons is strongly increased (mean ± SD, p < 0.01 for growth, p < 0.05 for retraction, n = 4). (D) Dendrite growth/retraction ratios of Ret deficient C4da neurons show a significant decrease compared to wildtype (mean ± SD, p < 0.05, n = 4, Student's t-test). (E) F-actin levels in primary branches of Ret mutant C4da neurons are elevated in proximal regions compared to wildtype. Normalized LifeAct-mCherry signal along primary dendrites was plotted against increasing soma distance showing significantly different intensity profiles (shaded area ± SD, p < 0.05, n = 5). (F–G) Dorsal fields of ddaC neurons expressing CD4-tdGFP and LifeAct-mCherry were imaged at 96–100 hr AEL in (F) wildtype and (G) Ret mutant animals. LifeAct levels normalized to GFP are shown as color coded arbitrary intensities. Ret mutant C4da neuron dendrites display increased proximal, but reduced distal F-actin levels. Abnormal accumulation of F-actin in aberrant, crossing dendrites was frequently seen in Ret mutant but not wildtype neurons (indicated by arrows). Additionally, many terminal branches of Ret loss of function neurons have lower levels (below threshold) of F-actin than wildtype. Scale bar 30 μm.
Videos
Video 1
Colocalization of endogenous Ret and the integrin Mew in C4da neurons.
The video shows a 3-dimensional flight view of Ret-Mew colocalization along the C4da dendritic arbor. Shown are CD4-tdGFP labeling the C4da neuron (green), anti-Ret (magenta), and anti-Mew (cyan) together with the colocalized signal (grayscale) between Ret and Mew.
Download links
A two-part list of links to download the article, or parts of the article, in various formats.
Downloads (link to download the article as PDF)
Open citations (links to open the citations from this article in various online reference manager services)
Cite this article (links to download the citations from this article in formats compatible with various reference manager tools)
The Ret receptor regulates sensory neuron dendrite growth and integrin mediated adhesion
eLife 4:e05491.
https://doi.org/10.7554/eLife.05491


