Graded Ca2+/calmodulin-dependent coupling of voltage-gated CaV1.2 channels
- University of Washington, United States
- University of California, Davis, United States
Figures
Figure 1

Single-channel electrical and optical recordings of CaV1.2 channel coupling.
(A and B) Representative iBa (A) and iCa (B) traces recorded from CaV1.2-expressing tsA-201 cells during step depolarizations from −80 to −30 mV. Amplitude histograms (constructed from n = 6 cells each) were fit with multi-component Gaussian functions (solid black lines). A portion of each trace (gray box) is shown enlarged below, showing that the resulting L-type Ca2+ current reflects the simultaneous opening and closing of multiple channels with Ca2+ as the charge carrier, but not with Ba2+ as the charge carrier. (C) Bar chart of iBa and iCa single-channel activity (nPo). Data are presented as means ± SEM (**p < 0.01). (D) Calibrated TIRF image of an adult ventricular myocyte dialyzed with the Ca2+ indicator dye Rhod-2 via the patch pipette (see also Video 1). Time courses of [Ca2+]i from each sparklet site (indicated by green circles on TIRF image) and their κ values are shown in panels a-e. (E) All-points histogram of Ca2+ sparklet data recorded from adult ventricular myocytes. The data were fit with a multi-component Gaussian function (solid black line).
Figure 2
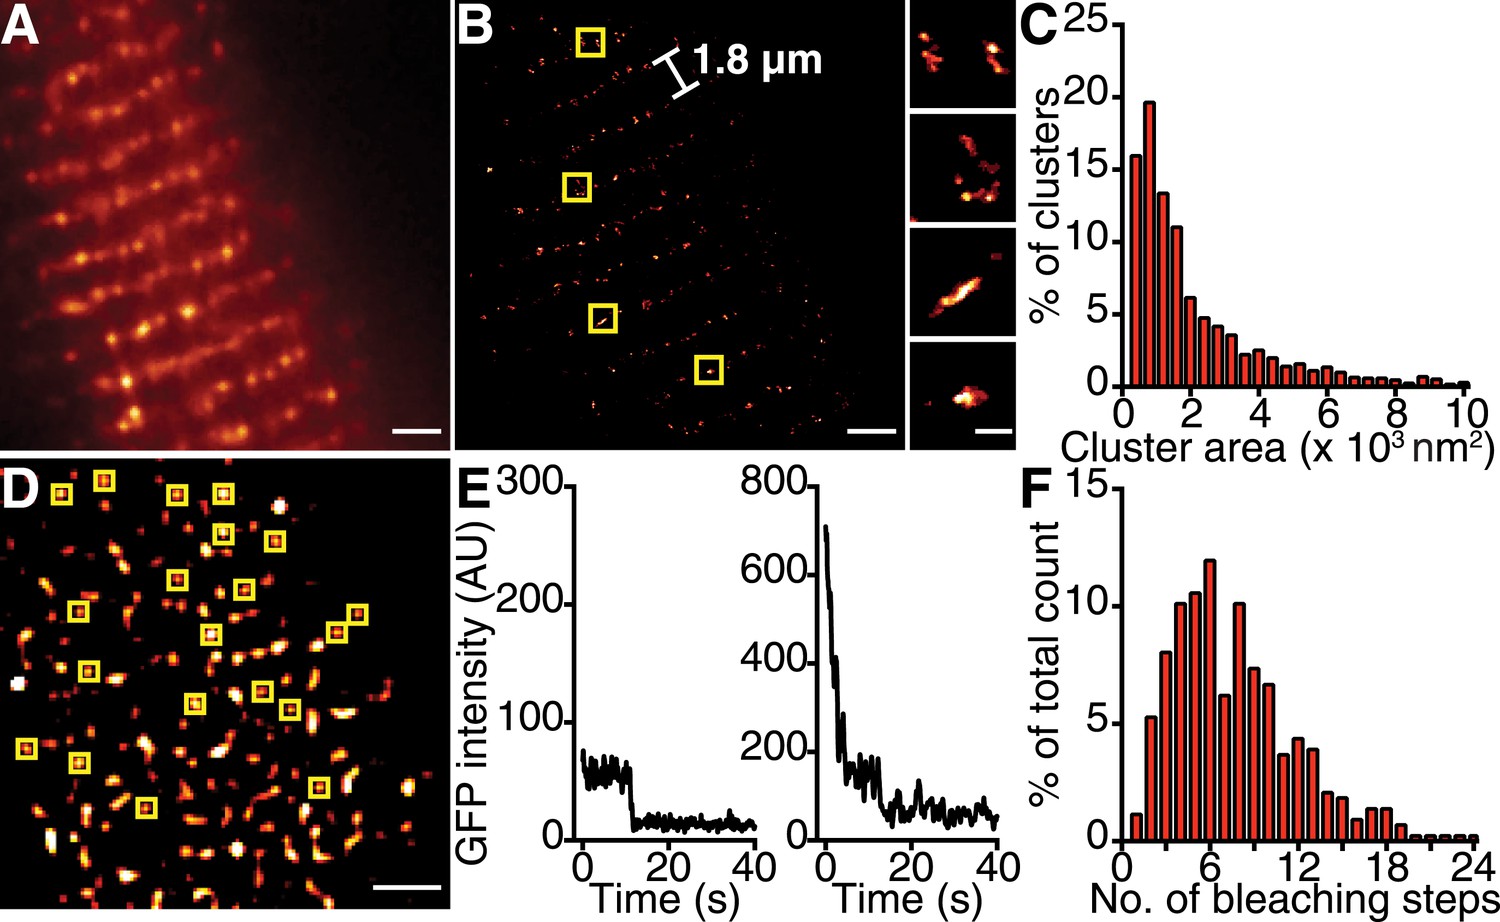
CaV1.2 channels form clusters in the ventricular myocyte PM.
(A) TIRF image of a fixed, adult mouse ventricular myocyte immunolabeled with an antibody specific for CaV1.2 channels. (B) Super-resolution GSD image of the same cell. Channels are located along the t-tubule network with the characteristic 1.8-μm separation. Yellow boxes denote location of higher-magnification images of channel clusters (right). (C) Distribution of cluster areas in ventricular myocytes (n = 5 myocytes). (D) An average of the first five frames of a TIRF image time series taken of a myocyte isolated from mice expressing CaVβ2a-PA-GFP. Yellow boxes indicate spots selected for analysis. Scale bars = 2 μm. (E) Examples of bleaching steps for CaVβ2a-PA-GFP associated with CaV1.2 channels. (F) Distribution of bleaching steps obtained from 435 spots selected from n = 11 cells.
Figure 3 with 1 supplement
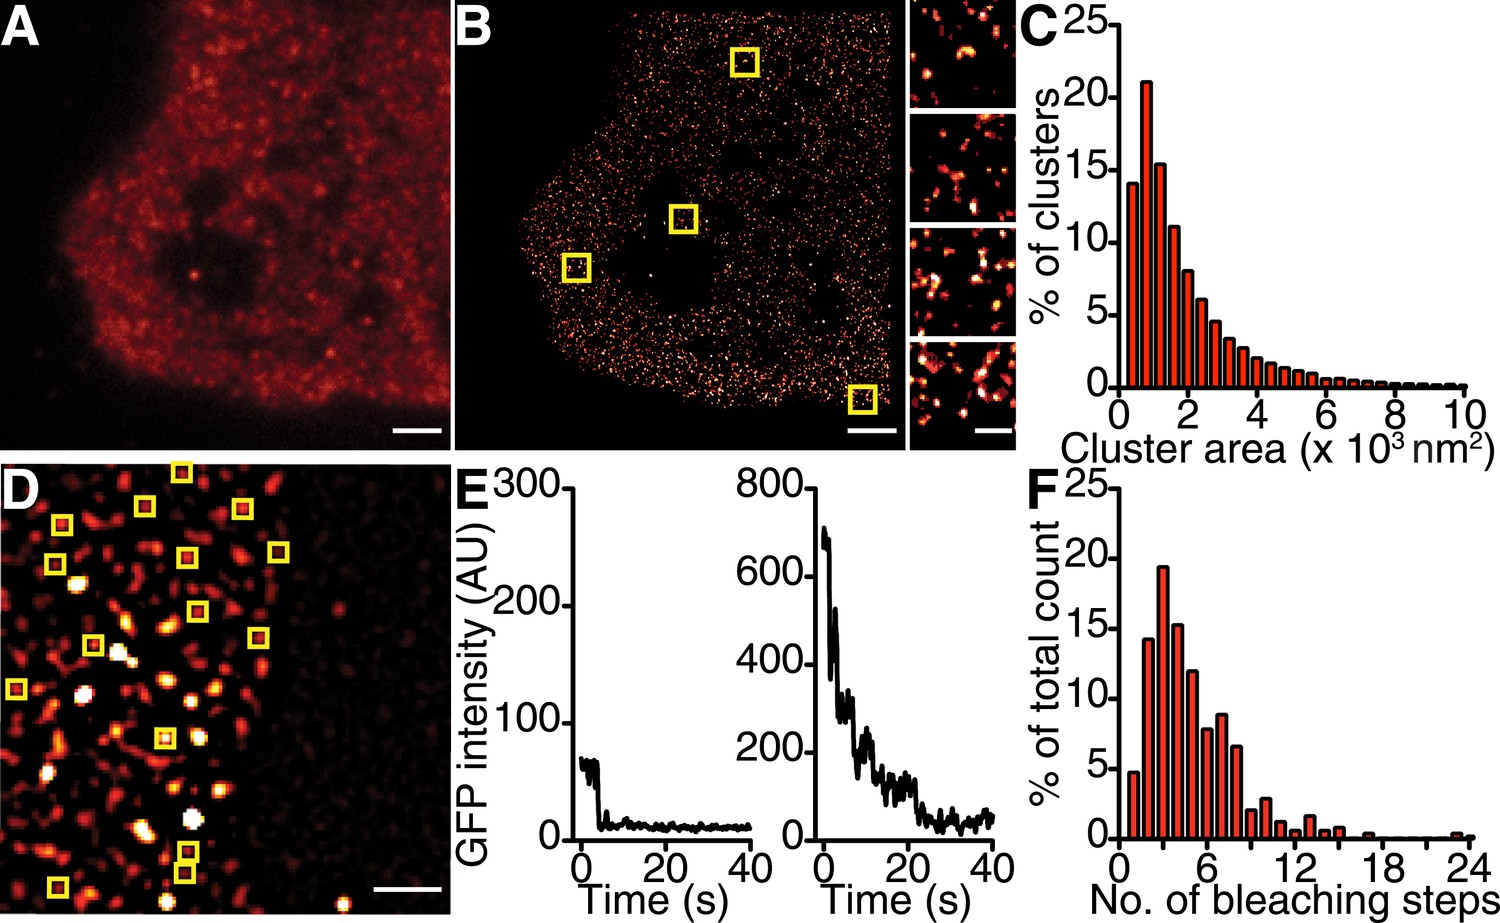
CaV1.2 channels form clusters in tsA-201 cell membranes.
(A and B) TIRF and GSD images of immunolabeled CaV1.2 channels in a transfected tsA-201 cell (A). Yellow boxes in (B) indicate the location of each higher-magnification image (right). (C) Distribution of cluster areas in tsA-201 cells (n = 9 cells). (D) An average of the first five frames of a TIRF image time series for a tsA-201 cell expressing CaV1.2-EGFP. (E) Examples of bleaching steps for CaV1.2-EGFP. Scale bars = 2 μm. (F) Distribution of bleaching steps obtained from 484 spots selected from n = 10 cells.
Figure 3—figure supplement 1
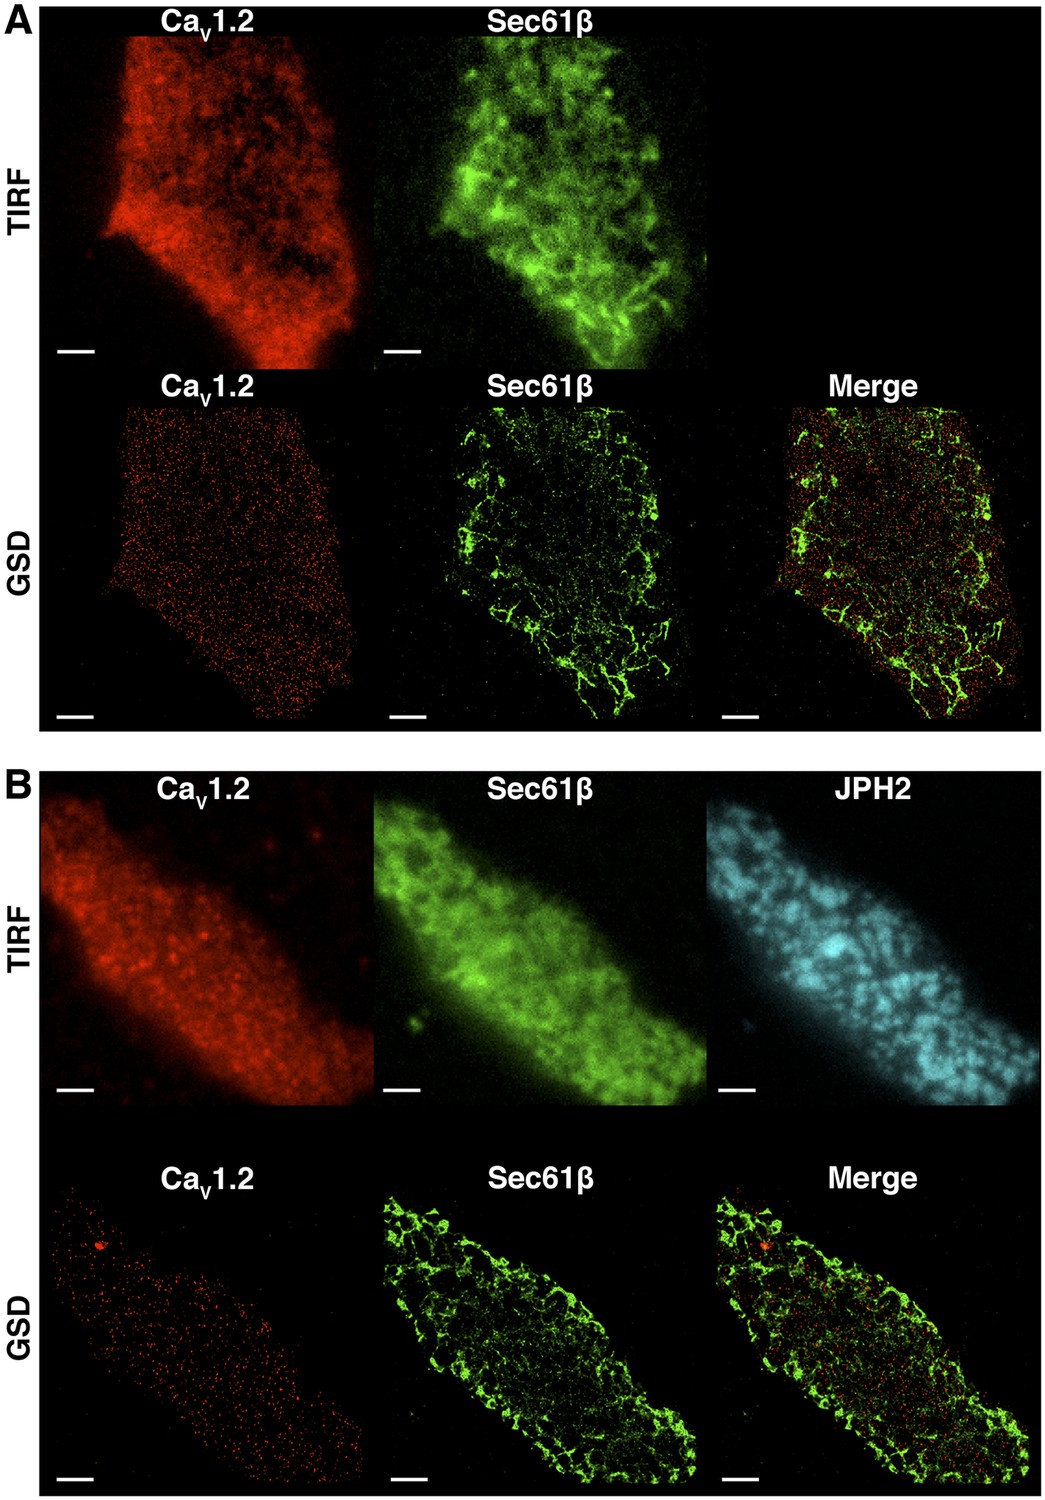
CaV1.2 channel clusters are not co-localized to tsA-201 ER structures.
(A) TIRF (top) and GSD (bottom) images of immunolabeled CaV1.2 channels (left) and mCherry-Sec61β (middle) in a transfected tsA-201 cell. The image on the bottom right was generated by merging CaV1.2 and mCherry-Sec61β GSD images. (B) Top: TIRF images of immunolabeled CaV1.2 channels (left), mCherry-Sec61β (middle), and JPH2 (right) in a transfected tsA-201 cell. Bottom: GSD images from the same cell showing CaV1.2 channels (left), mCherry-Sec61β (middle), and a merge of the two (right). Scale bars = 2 μm.
Figure 4 with 5 supplements

Interactions between CaV1.2 channel C-termini occur spontaneously and in a Ca2+/CaM-dependent manner.
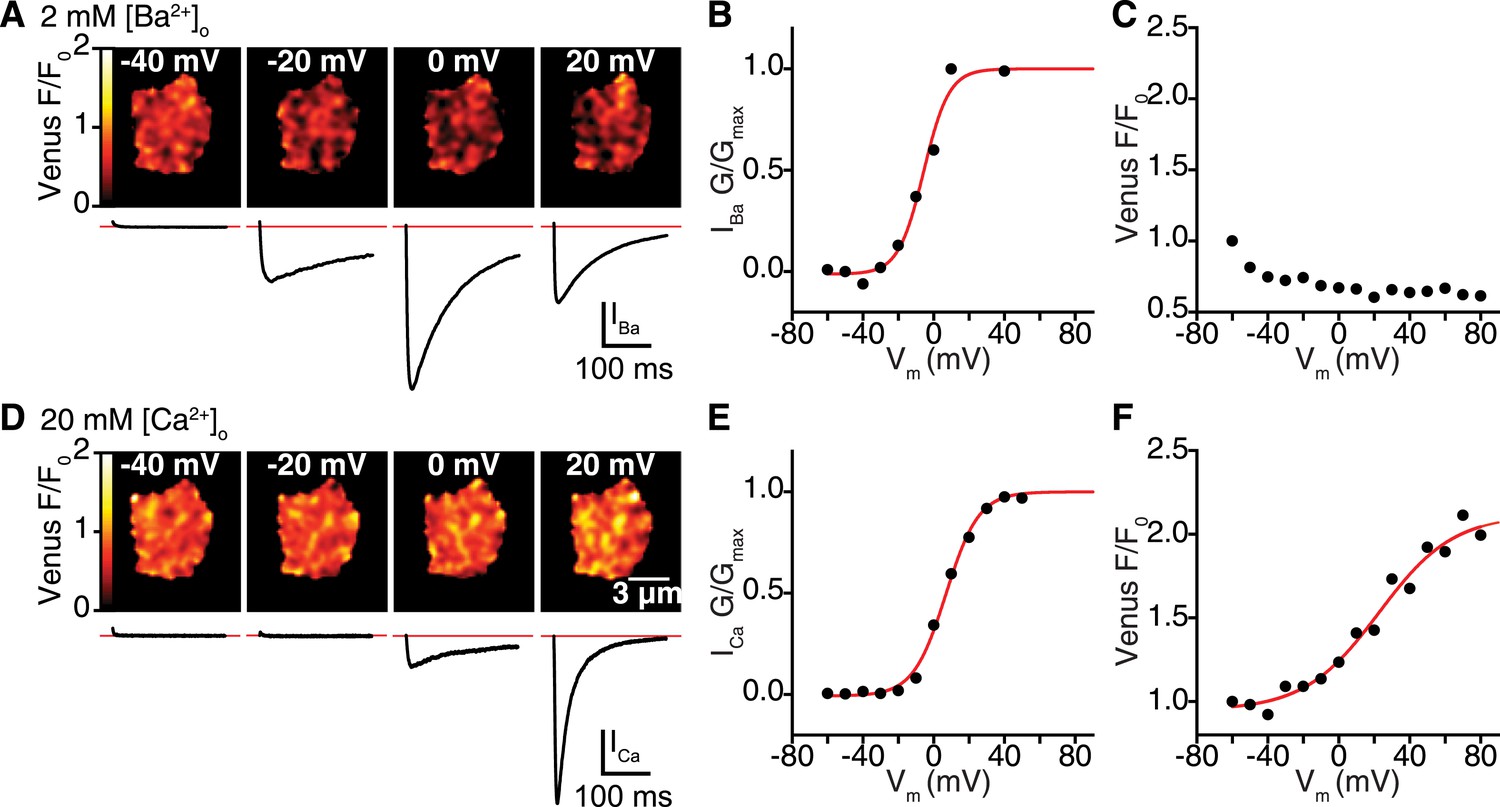
(A) Illustration of the bimolecular fluorescence complementation strategy for assaying interactions between CaV1.2 channel C-termini. Non-interacting channels tagged at their C-terminus with either the N- or C-terminal half of split Venus are non-fluorescent (left). Spontaneous interactions between channel C-termini result in reconstitution of Venus and emission of fluorescence (right). (B–E) TIRF images obtained from whole-cell patch-clamped tsA-201 cells expressing CaV1.2-VN and CaV1.2-VC over 9-s voltage steps to the indicated potentials. Images were median-filtered, smoothed, pseudo-colored with a ‘red-hot’ LUT, and divided by the initial −60 mV image to obtain calibrated Venus F/F0. Experiments were performed with 2 mM Ba2+ (B) or 20 mM Ca2+ (C–E) in the perfusing solution. Scale bars = 3 μm. (See also Figure 4—figure supplement 2) (D) Images obtained during dialysis with MLCKp (0.1 μM). (E) Images from a cell in which CaM1234 was co-expressed with CaV1.2-VN and CaV1.2-VC (see also Figure 4—figure supplement 3). (F) Relationship between membrane voltage and Venus reconstitution for each experimental condition. (G) Bar chart showing mean Venus fluorescence (F/F0) ± SEM for each condition at −40 and +40 mV (*p < 0.05).
Figure 4—figure supplement 1
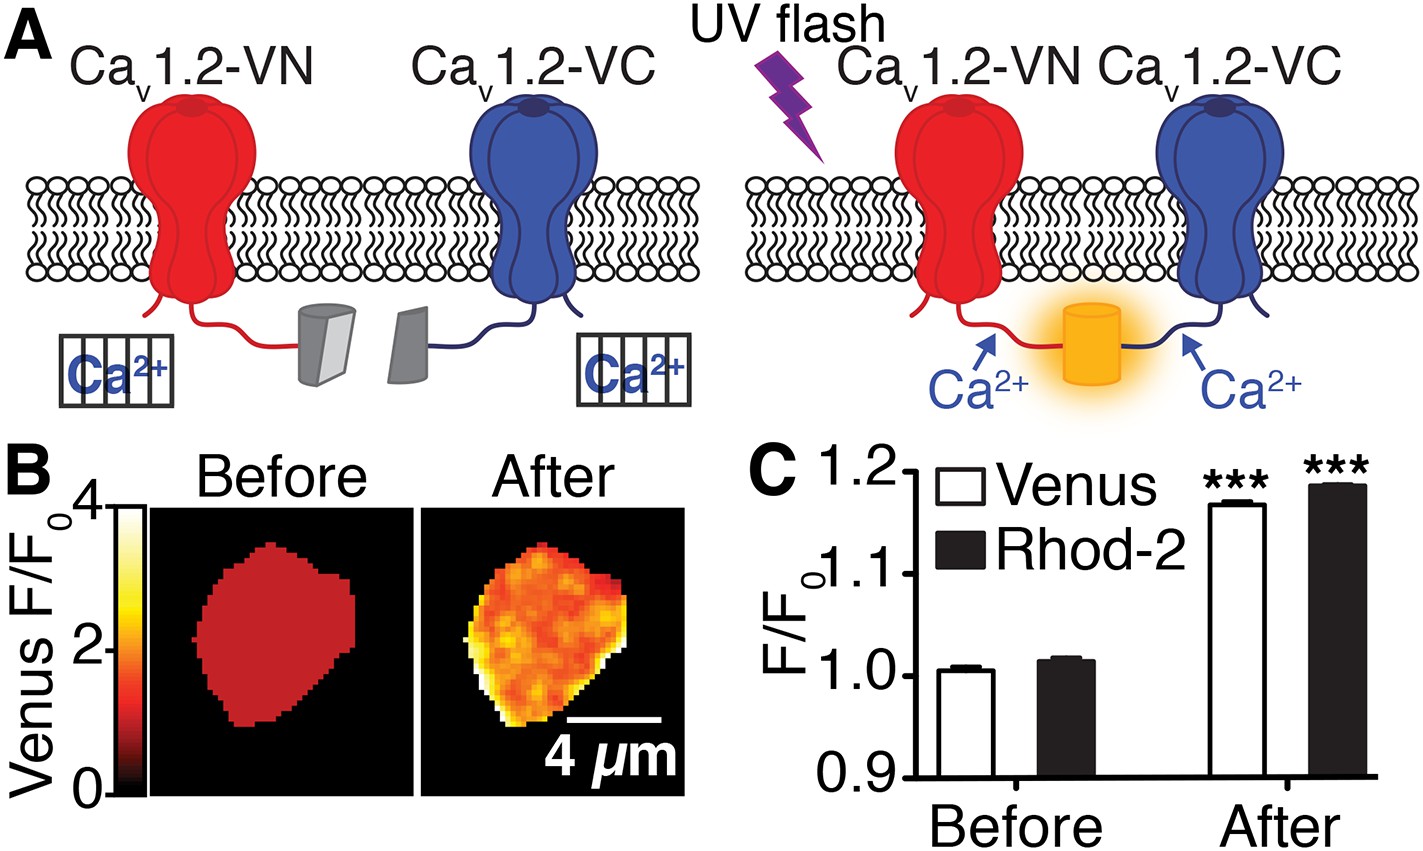
Flash photolysis of caged Ca2+ stimulates CaV1.2 interactions.
(A) Illustration of flash photolysis-induced bimolecular fluorescence complementation. Prior to uncaging of Ca2+, cells were bathed in a zero Ca2+ solution; under these conditions, split-Venus–tagged channels do not interact (left). Upon application of a UV flash to uncage Ca2+, interactions between the channel C-termini results in reconstitution of Venus protein and emission of fluorescence (right). (B) Confocal images of Venus fluorescence emission (F/F0) before and after flash photolysis of caged Ca2+. (C) The bar chart shows mean Venus and Rhod-2 fluorescence emission (F/F0) ± SEM before and after Ca2+ uncaging (***p < 0.001, for comparison of CaV1.2interactions [Venus reconstitution] and intracellular Ca2+ concentration [Rhod-2 emission] before and after flash photolysis of caged Ca2+; paired t-test).
Figure 4—figure supplement 2
CaV1.2 interactions are Ca2+ dependent.
(A–C) Venus fluorescence and CaV1.2 currents were recorded in whole-cell mode from tsA-201 cells expressing CaV1.2-VN and Cav1.2-VC during depolarizing voltage steps to −40, −20, 0 and +20 mV with Ba2+ as the charge carrier (2 mM [Ba2+]o). Voltage dependencies were fit with a Boltzmann sigmoidal function (red solid line) except in (C), where Venus F/F0 decayed exponentially during the voltage protocol in a manner reminiscent of photobleaching. (A) Calibrated Venus F/F0 TIRF images (top) and IBa (bottom) from a representative tsA-201 cell. (B) Voltage dependence of normalized conductance. (C) Venus fluorescence (F/F0) plots. (D–F) Venus fluorescence and CaV1.2 currents were recorded as above (A–C) with Ca2+ as the charge carrier (20 mM [Ca2+]o). (D) Calibrated Venus F/F0 TIRF images (top) and IBa (bottom) from a representative tsA-201 cell. (E) Voltage dependence of normalized conductance. (F) Venus fluorescence (F/F0) plots. Voltage dependencies were fit with a Boltzmann sigmoidal function (red solid line).
Figure 4—figure supplement 3
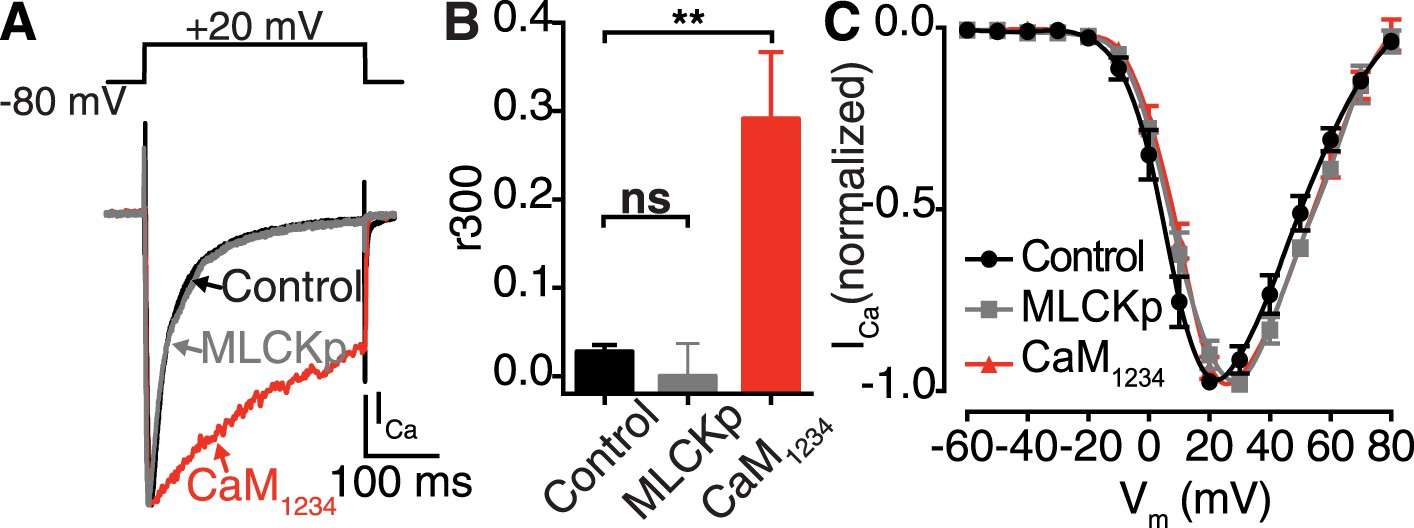
Ca2+ binding to distinct CaM pools regulates CDI.
(A–C) tsA-201 cells expressing CaV1.2 were subjected to a 300-ms depolarization from a holding potential of −80 mV to a test potential of +20 mV in the presence of 20 mM [Ca2+]o. (A) ICa elicited under control conditions (20 mM [Ca2+]o), with 0.1 μM MLCKp dialyzed via the patch pipette, and in cells co-expressing Ca2+-insensitive CaM1234. (B) Mean r300 ratios ± SEM (**p = 0.002). (C) Current-voltage relationships.
Figure 4—figure supplement 4
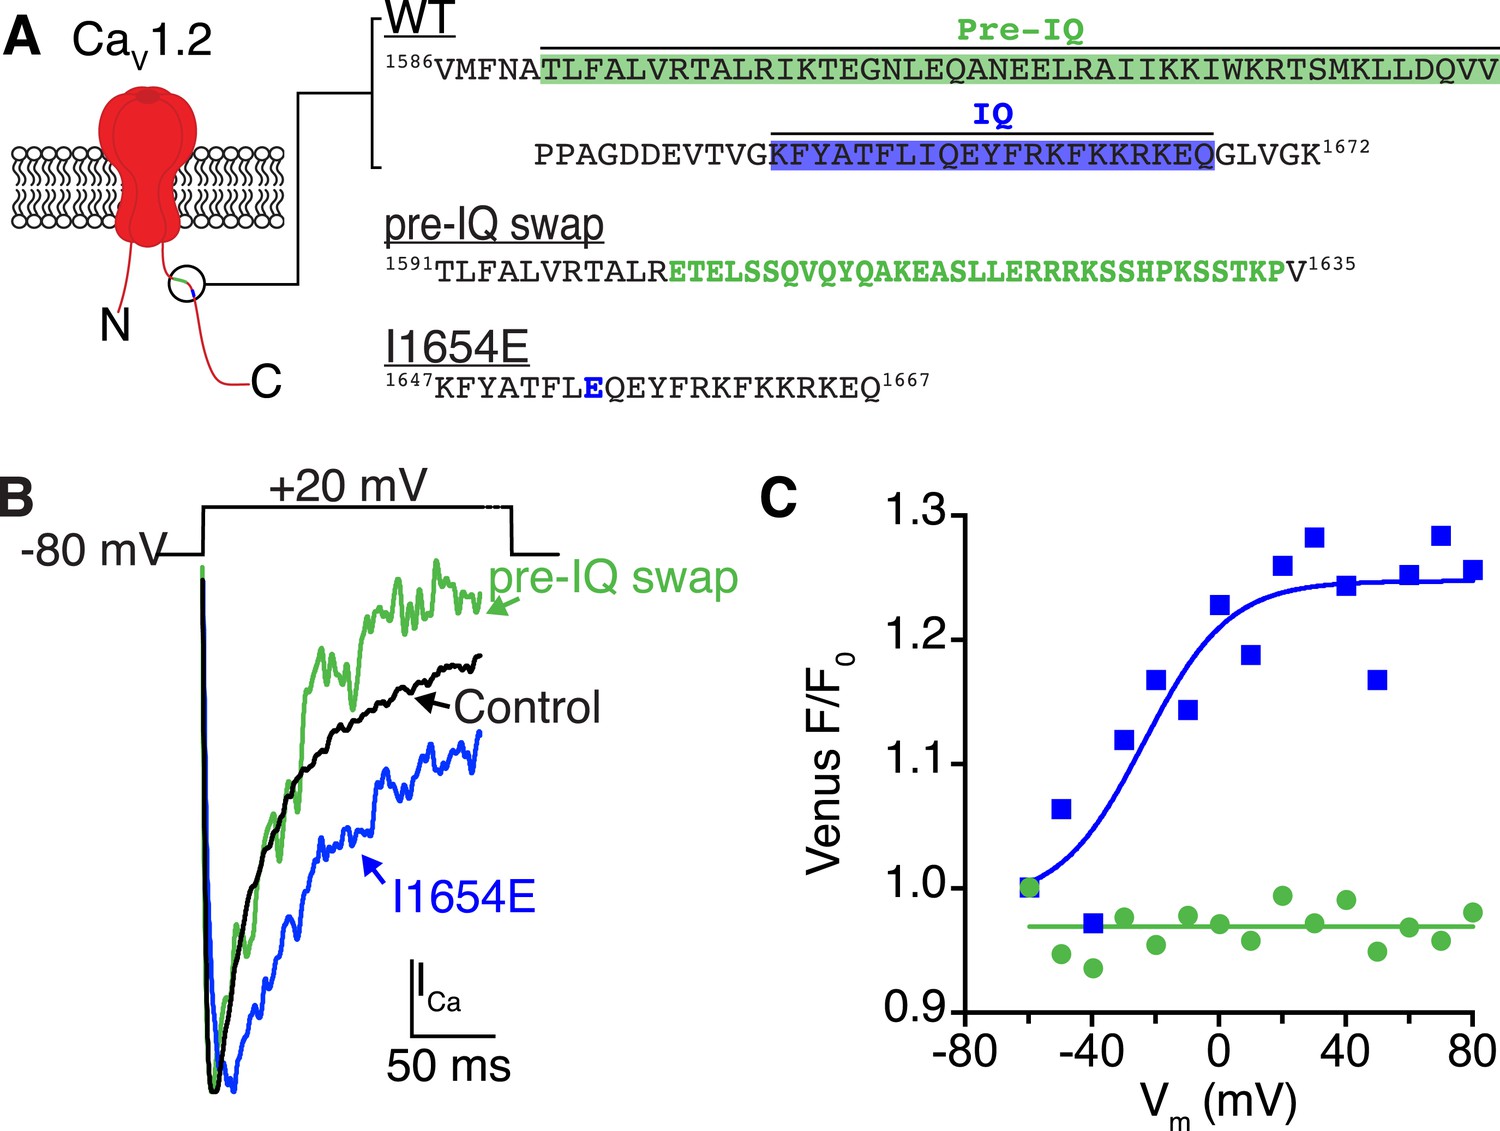
Ca2+/CaM binding to the pre-IQ domain, and not the IQ domain, mediates channel coupling.
(A) Illustration of the pore-forming subunit of a CaV1.2 channel embedded in the PM, with intracellular N and C-termini. The C-terminus contains pre-IQ (green) and IQ (blue) motifs, which are known to bind CaM. The amino acid sequence of the pre-IQ and IQ segments of the C-terminus of WT, pre-IQ swap, and I1654E mutant channels used in this study are shown on the right. For the pre-IQ swap, a 33-amino-acid segment was replaced with 33 non-identical amino acids. For the I1654E mutation, a point mutation was made replacing I1654 with E. (B) ICa elicited by a depolarizing step from −80 mV to a test potential of +20 mV under control conditions (20 mM [Ca2+]o) in tsA-201 cells expressing WT (black), I1624E (blue), or pre-IQ swap (green) CaV1.2 channels. (C) Venus fluorescence (F/F0) plots for the two mutant channels. CaV1.2(I1624E) channels exhibited a voltage-dependent increase in Venus reconstitution that fit a Boltzmann sigmoidal function (blue solid line; n = 5). Venus F/F0 decayed over the course of the voltage protocol in cells expressing CaV1.2(pre-IQ swap) (n = 8).
Figure 4—figure supplement 5
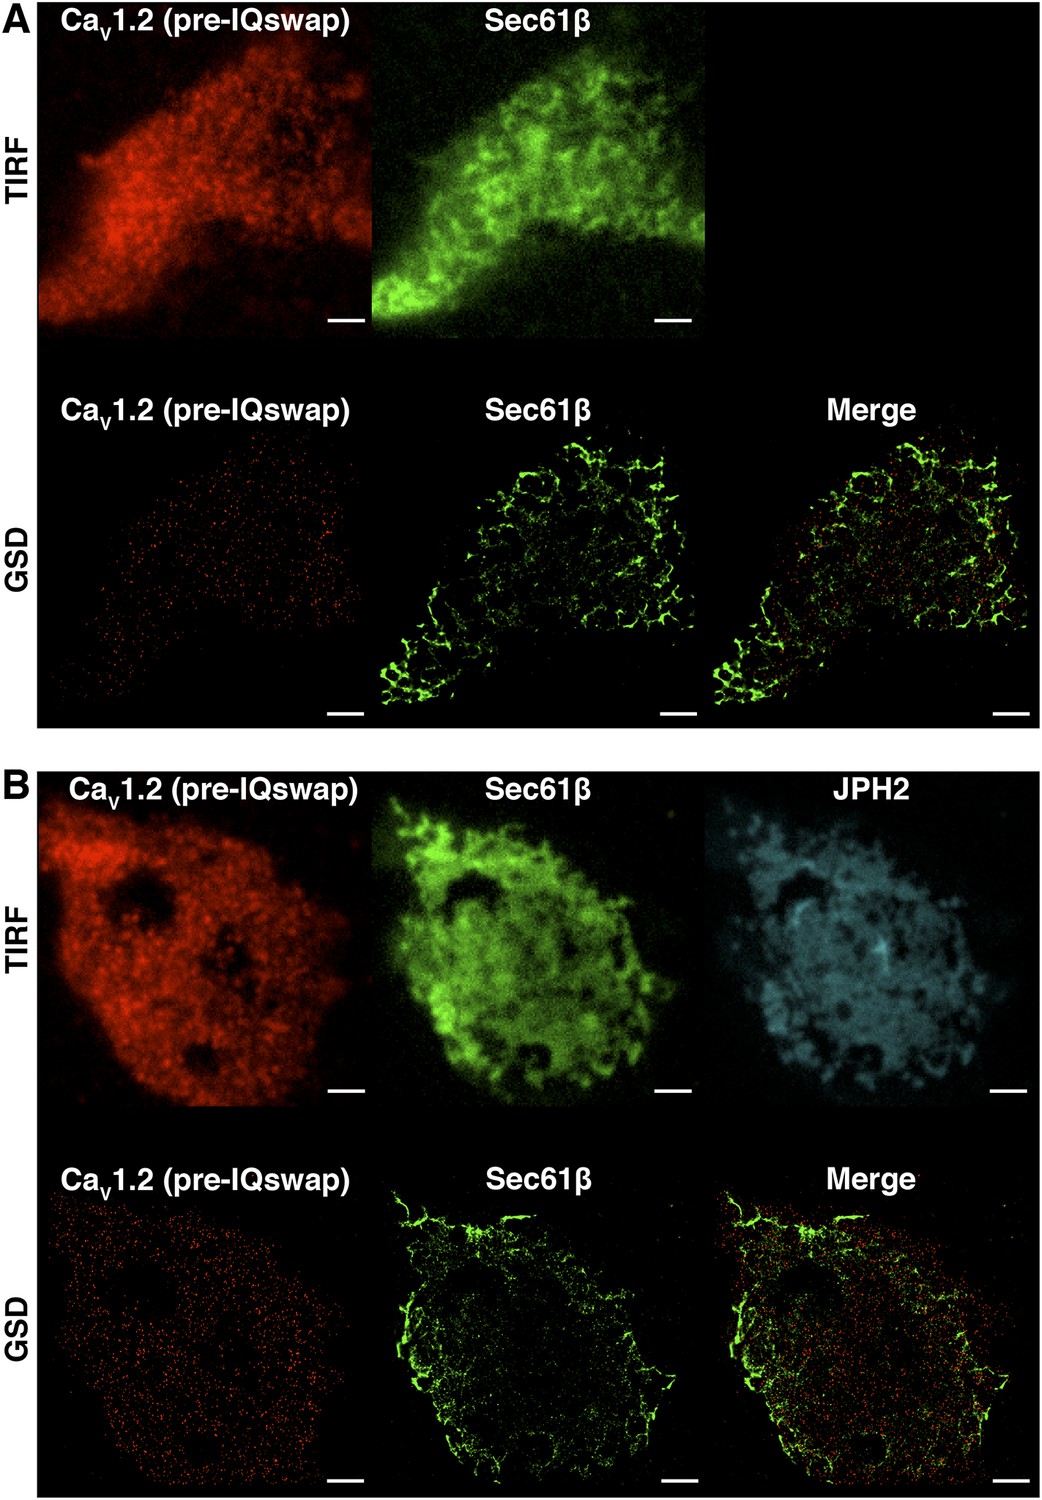
CaV1.2 channel clustering is necessary but not sufficient for functional coupling.
(A) TIRF (top) and super-resolution GSD (bottom) images of immunolabeled CaV1.2(pre-IQ swap) channels (left) and mCherry-Sec61β (middle) in an exemplary transfected tsA-201 cell. The image on the bottom right was generated by merging CaV1.2(pre-IQ swap) and mCherry-Sec61β GSD images. (B) Top: TIRF images of immunolabeled CaV1.2(pre-IQ swap) channels (left), mCherry-Sec61β (middle), and JPH2-GFP (right) in a transfected tsA-201 cell. Bottom: GSD images from the same cell showing CaV1.2(pre-IQ swap) channels (left), mCherry-Sec61β (middle), and a merge of the two (right). Scale bars = 2 μm.
Figure 5
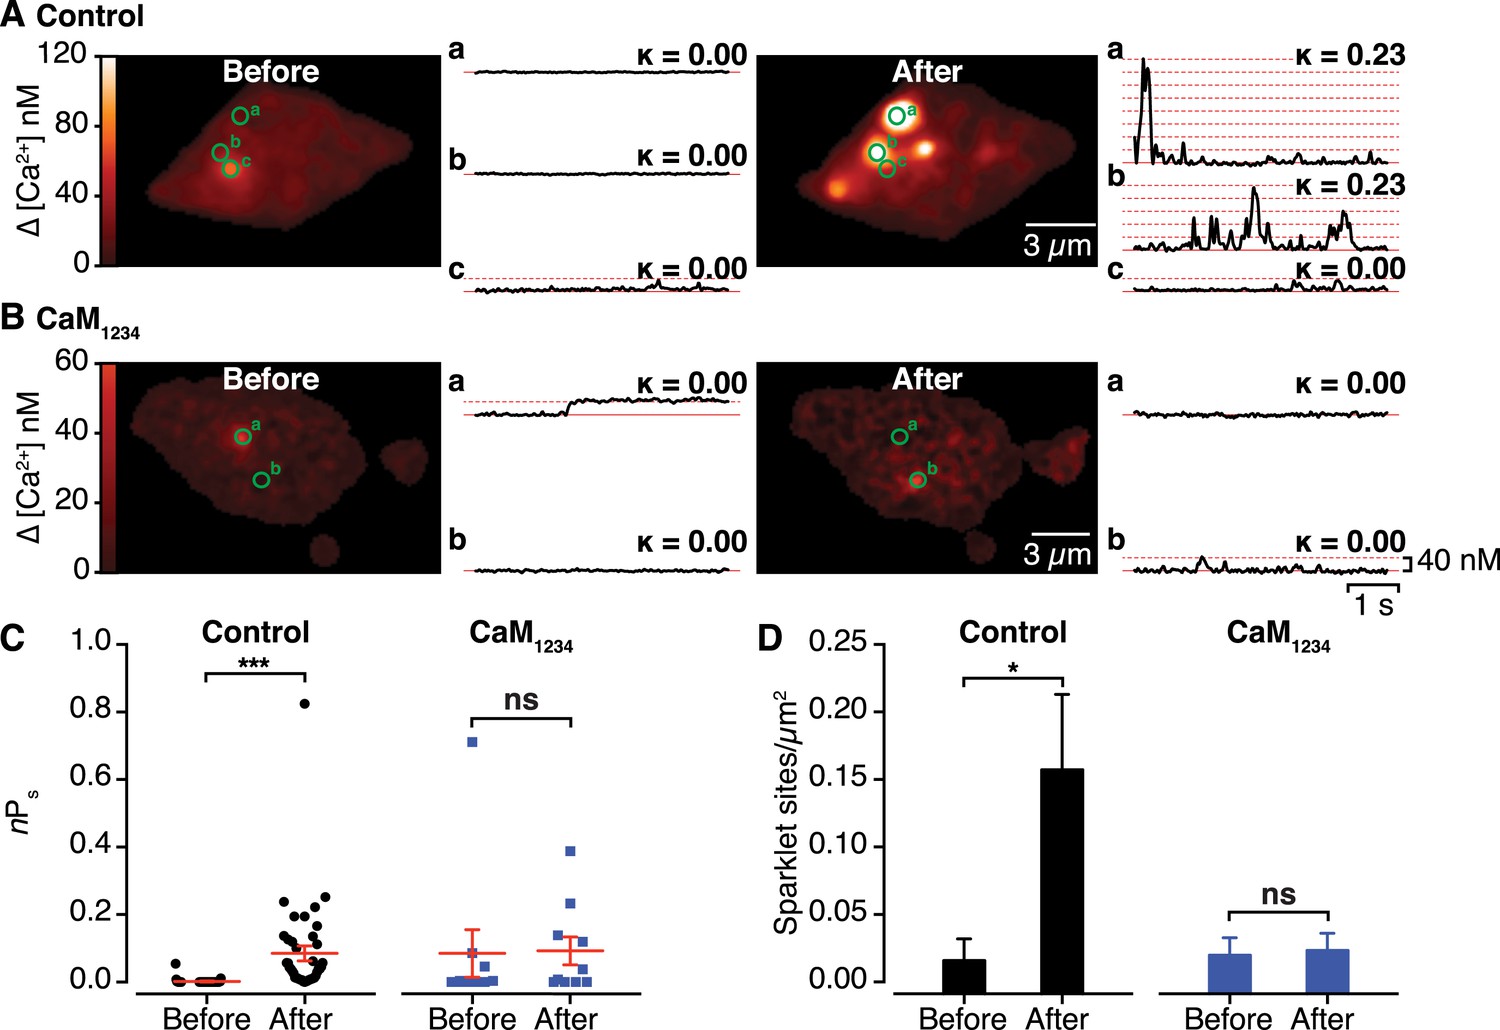
Effects of interactions between CaV1.2 channel C-termini on channel activity.
(A and B) Calibrated TIRF images (see also Video 2) of representative control tsA-201 cells (A) and tsA-201 cells expressing the Ca2+-insensitive CaM1234 mutant (B). In both cases, cells expressed CaV1.2-VN and CaV1.2-VC and were loaded with Rhod-2 via the patch pipette. Cells were held at −80 mV during sparklet recordings before (left) and after (right) depolarization to +60 mV. The time course of [Ca2+]i for each sparklet site (denoted by green circles) before and after depolarization is shown to the right of each image. (C and D) Scatter plots of sparklet activity (C; nPs; ***p < 0.001) and sparklet site density (D; *p = 0.03), before and after depolarization in control (n = 5) and CaM1234-expressing (n = 6) cells. ns, not significant.
Figure 6

Interactions of CaV1.2 C-termini occur dynamically with Ca2+ influx and are transiently persistent.
(A) Time course of the percent change in FRETr (bottom) evoked by flash photolysis of caged Ca2+ (purple box). Experiments were performed at a holding potential of −80 mV with zero EGTA or BAPTA; thus, the change in [Ca2+]i (F/F0; top) was global. Averaged traces (n = 5 cells) and error bars showing SEM at each sampling point. (B) Correlation between changes in FRETr and global [Ca2+]i produced by caged Ca2+ photolysis, showing that increases in [Ca2+]i were accompanied by an increase in FRETr (p < 0.0001). (C) Plot of the percent change in FRETr vs [Ca2+]i (nM). Data (n = 8 cells) were fit to a Boltzmann Sigmoidal function (solid red line) with V50 = 254.3 nM (black dashed line). (D) Step depolarization (top) in the presence of 10 mM EGTA produced local [Ca2+]i elevation and inactivating ICa (middle). Increased channel interactions, represented as the percent change in FRETr (bottom; averaged from n = 6 cells), were detected at the onset of depolarization and repolarization during the peak and tail currents. Dashed line shows FRETr baseline level.
Figure 7
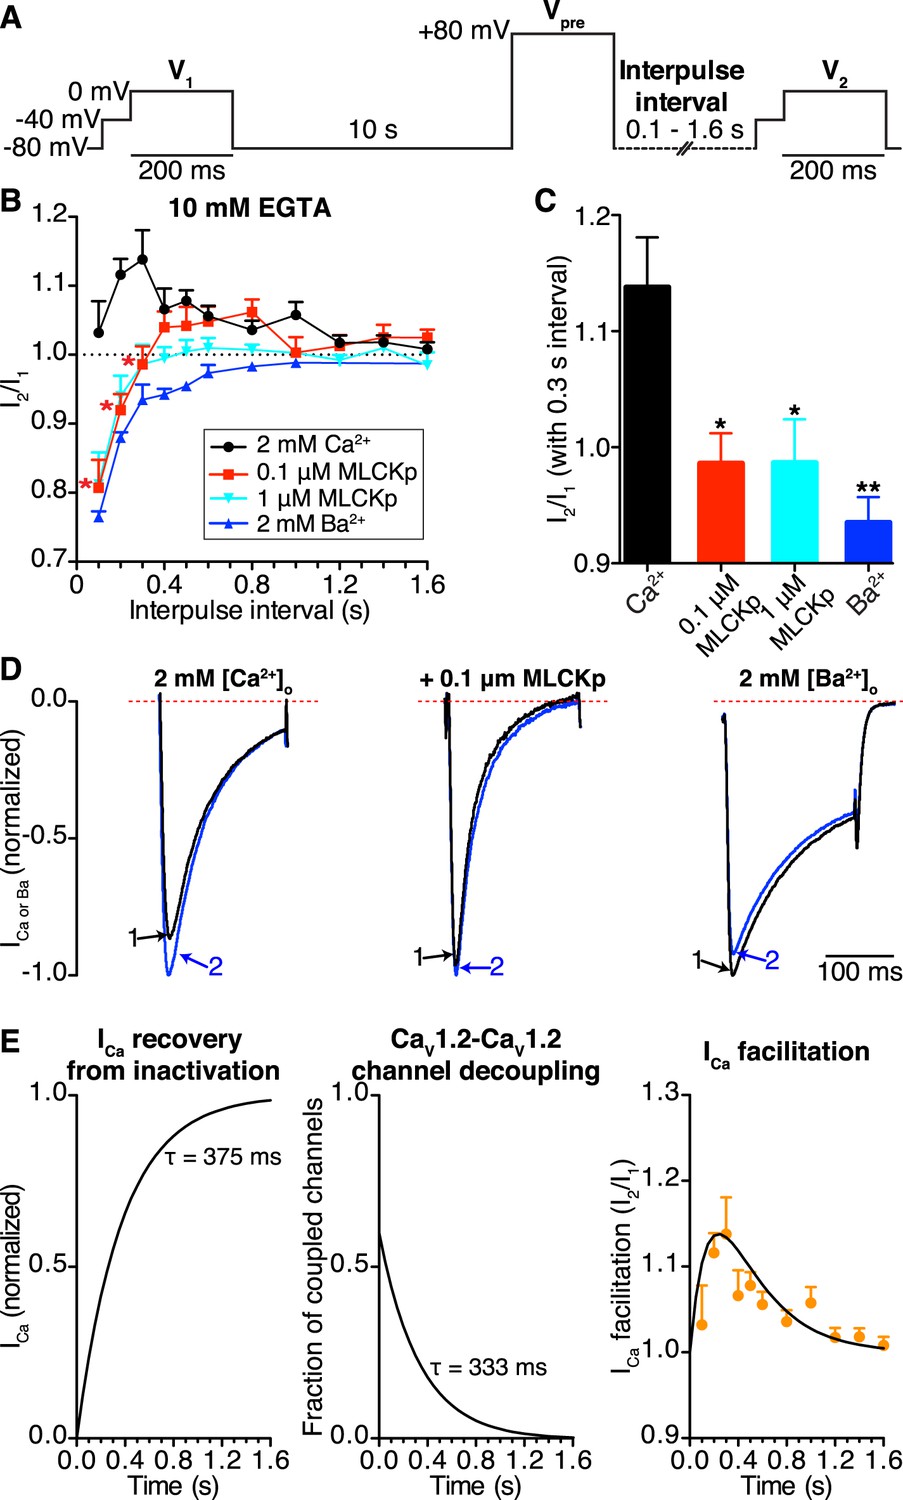
CaV1.2-to-CaV1.2 channel coupling is critical for ICa facilitation in cardiomyocytes.
(A) Voltage protocol used to evoke I1 and I2 in ventricular myocytes. (B) Line chart summarizing the current amplitude ratio (I2/I1) at 0 mV for each condition over the range of interpulse intervals from 0.1 to 1.6 s. (C) Bar chart summarizing the current-amplitude ratio (I2/I1) with a fixed interpulse interval of 300 ms for each condition. (D) Normalized whole-cell currents evoked by the protocol in (A), with 2 mM [Ca2+]o as the charge carrier without (left) or with (middle) intracellular dialysis of 0.1 μM MLCKp (middle). The currents on the right were recorded with 2 mM [Ba2+]o as the charge carrier. Data are shown as means + SEM (*p < 0.05, **p < 0.01 vs control (2 mM [Ca2+]o)). (E) Simulated time-course of ICa recovery from inactivation (left), CaV1.2-CaV1.2 channel cluster disassembly (middle), and ICa facilitation (solid black line; right). Recovery and channel decoupling curves are single exponential functions with time constants (τ) of 375 ms and 333 ms, respectively. The ICa facilitation curve is the product of the recovery and decoupling functions. For comparison, the experimental facilitation data (orange circles) collected with 2 mM [Ca2+]o as the charge carrier is plotted alongside the simulated ICa facilitation data. The amplitude of the decoupling function was scaled to fit the facilitation data.
Figure 8
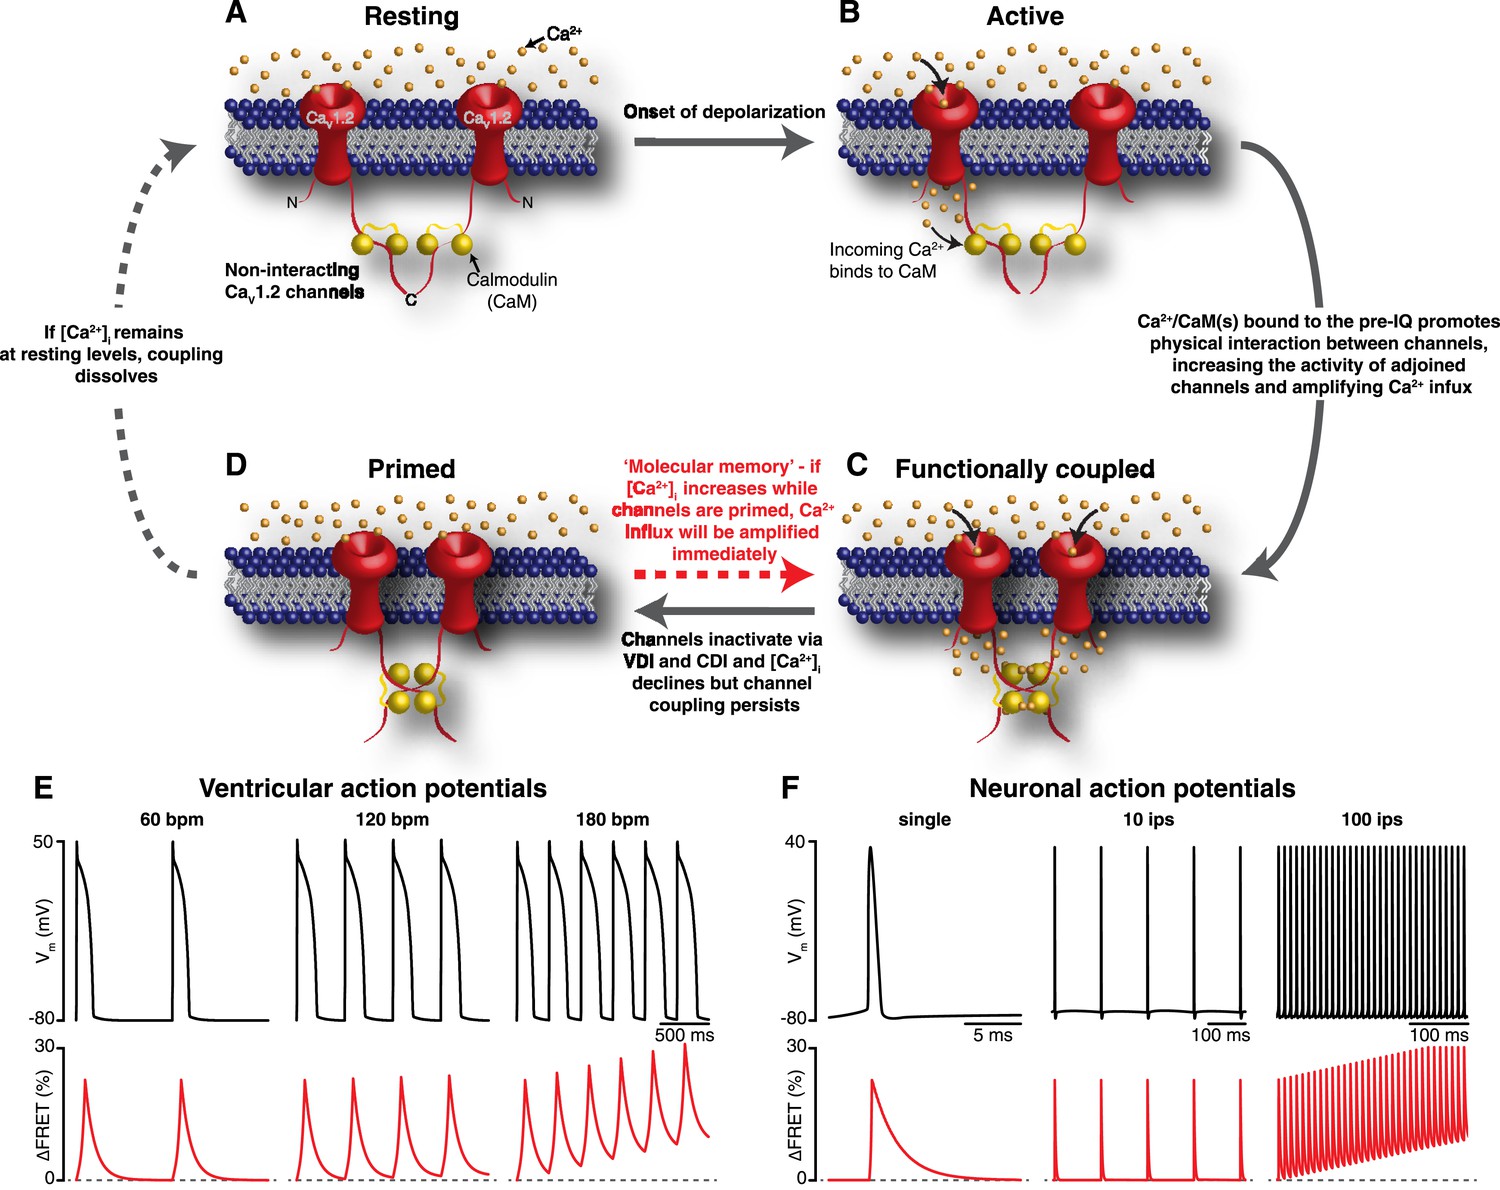
Mechanism and proposed model for the functional coupling of CaV1.2 channels.
(A) CaV1.2 channels are arranged into clusters in the PM of excitable cells; for simplicity, a cluster of two channels is shown. At the resting membrane potential (e.g., −80 mV), [Ca2+]i and CaV1.2 Po are low; hence, the majority of CaV1.2 channels are non-interacting. (B) During an action potential, the PM becomes depolarized, increasing the Po of independently gating CaV1.2 channels. Ca2+ flows into the cell through these active channels, producing an elevation in local [Ca2+]i and increasing Ca2+ binding to CaM. (C) Ca2+/CaM binding to the C-terminal pre-IQ domain of the CaV1.2 channel promotes physical interactions between adjacent channels. This functional coupling increases the activity of adjoined channels and thus amplifies Ca2+ influx. (D) CaV1.2 channels undergo VDI and CDI, and [Ca2+]i declines once more. However, the channels remain coupled in a ‘primed’, non-conducting state for a finite time. If the membrane is depolarized again when the channels are still primed, the amplification of Ca2+ influx will be immediate; otherwise, if [Ca2+]i remains at resting levels beyond the lifetime of the primed state, the coupling dissolves and the cycle begins again. (E) and (F) show proposed rate-dependent changes in CaV1.2 channel coupling in ventricular myocytes and neurons, respectively. Top: Simulated ventricular and neuronal action potentials are depicted at low, intermediate, and high firing rates. Bottom: The accompanying dynamic change in CaV1.2 channel coupling (reflected by FRET changes between adjacent channels). bpm, beats per minute; ips, impulses per second.
Videos
Video 1
Cardiomyocyte Ca2+ sparklets.
Stack of 2D images acquired at 100 Hz from a whole-cell patch-clamped adult ventricular myocyte held at −80 mV and dialyzed with Rhod-2 via the patch pipette.
Video 2
Ca2+ sparklet activity and site density are augmented by CaV1.2 channel interactions.
Stacks of 2D images acquired at a frame rate of 100 Hz from a representative, Rhod-2–dialyzed tsA cell expressing CaV1.2-VN and CaV1.2-VC, held at −80 mV, before (left) and after (right) depolarization.
Additional files
-
Source code 1
Custom software for Ca2+ sparklet detection and analysis written in MATLAB.
- https://doi.org/10.7554/eLife.05608.019
-
Source code 2
Binary coupled Markov chain model.
- https://doi.org/10.7554/eLife.05608.020
Download links
A two-part list of links to download the article, or parts of the article, in various formats.
Downloads (link to download the article as PDF)
Open citations (links to open the citations from this article in various online reference manager services)
Cite this article (links to download the citations from this article in formats compatible with various reference manager tools)
Graded Ca2+/calmodulin-dependent coupling of voltage-gated CaV1.2 channels
eLife 4:e05608.
https://doi.org/10.7554/eLife.05608


